Journal of Environmental Management - DORA 4RI
←
→
Page content transcription
If your browser does not render page correctly, please read the page content below
Journal of Environmental Management 280 (2021) 111785
Contents lists available at ScienceDirect
Journal of Environmental Management
journal homepage: http://www.elsevier.com/locate/jenvman
Research article
Ex-ante quantification of nutrient, total solids, and water flows in
sanitation systems
Dorothee Spuhler a, b, *, Andreas Scheidegger a, Max Maurer a, b
a
Eawag, Swiss Federal Institute of Aquatic Science and Technology, 8600, Dübendorf, Switzerland
b
Institute of Civil, Environmental and Geomatic Engineering, ETH Zürich, 8093, Zurich, Switzerland
A R T I C L E I N F O A B S T R A C T
Keywords: To prioritise sustainable sanitation systems in strategic sanitation planning, indicators such as local appropri
Sustainable sanitation ateness or resource recovery have to be known at the pre-planning phase. The quantification of resource recovery
Substance flow modelling remains a challenge because existing substance flow models require large amounts of input data and can
Resource recovery
therefore only be applied for a few options at a time for which implementation examples exist. This paper aims to
Structured decision making
answer two questions: How can we predict resource recovery and losses of sanitation systems ex-ante at the pre-
Multi-criteria decision analysis
planning phase? And how can we do this efficiently to consider the entire sanitation system option space? The
approach builds on an existing model to create all valid sanitation systems from a set of conventional and
emerging technologies and to evaluate their appropriateness for a given application case. It complements the
previous model with a Substance Flow Model (SFM) and with transfer coefficients from a technology library to
quantify nutrients (phosphorus and nitrogen), total solids (as an indicator for energy and organics), and water
flows in sanitation systems ex ante. The transfer coefficients are based on literature data and expert judgement.
Uncertainties resulting from the variability of literature data or ignorance of experts are explicitly considered,
allowing to assess the robustness of the model output. Any (future) technologies or additional products can easily
be added to the library. The model is illustrated with a small didactic example showing how 12 valid system
configurations are generated from a few technologies, and how substance flows, recovery ratios, and losses to
soil, air, and water are quantified considering uncertainties. The recovery ratios vary between 0 and 28% for
phosphorus, 0–10% for nitrogen, 0–26% for total solids, and 0–12% for water. The uncertainties reflect the high
variability of the literature data but are comparable to those obtained in studies using a conventional post-ante
material flow analysis (generally about 30% variability at the scale of a an urban area). Because the model is fully
automated and based on literature data, it can be applied ex-ante to a large and diverse set of possible sanitation
systems as shown with a real application case. From the 41 technologies available in the library, 101,548 systems
are generated and substance flows are modelled. The resulting recovery ratios range from nothing to almost
100%. The two examples also show that recovery depend on technology interactions and has therefore to be
assessed for all possible system configurations and not at the single technology level only. The examples also
show that there exist trade-offs among different types of reuse (e.g. energy versus nutrients) or different sus
tainability indicators (e.g. local appropriateness versus resource recovery). These results show that there is a
need for such an automated and generic approach that provides recovery data for all system configurations
already at the pre-planning phase. The approach presented enables to integrate transparently the best available
knowledge for a growing number of sanitation technologies into a planning process. The resulting resource re
covery and loss ratios can be used to prioritise resource efficient systems in sanitation planning, either for the
pre-selection or the detailed evaluation of options using e.g. MCDA. The results can also be used to guide future
development of technology and system innovations. As resource recovery becomes more relevant and novel
sanitation technologies and system options emerge, the approach presents itself as a useful tool for strategic
sanitation planning in line with the Sustainable Development Goals (SDGs).
* Corresponding author. Swiss Federal Institute of Aquatic Science and Technology, Überlandstrasse 133, 8600, Dübendorf, Switzerland.
E-mail address: dorothee.spuhler@eawag.ch (D. Spuhler).
https://doi.org/10.1016/j.jenvman.2020.111785
Received 24 July 2020; Received in revised form 26 November 2020; Accepted 30 November 2020
Available online 16 December 2020
0301-4797/© 2020 The Authors. Published by Elsevier Ltd. This is an open access article under the CC BY-NC-ND license
(http://creativecommons.org/licenses/by-nc-nd/4.0/).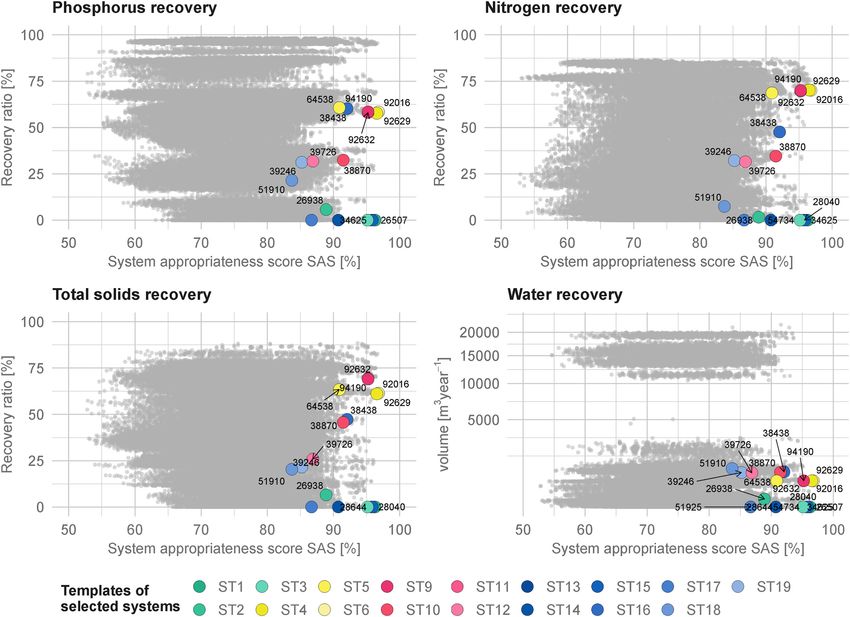
D. Spuhler et al. Journal of Environmental Management 280 (2021) 111785
1. Introduction data. Thus, a modelling approach is required. Resource recovery and
loss ratios can be modelled using substance flow modelling (SFM) based
If there is one thing important for health and environmental pro on material flow analysis (MFA, e.g. Baccini and Brunner, 2012; Huang
tection, and thus for social and economic development, it is good et al., 2012; Mehr et al., 2018). Unfortunately, existing models require
sanitation. detailed knowledge about the technology implementation and large
The importance of sanitation has been acknowledged in the human amount of data (e.g. Espinosa and Otterpohl, 2014; Montangero and
right to water and sanitation (UN, 2010). That sanitation should also be Belevi, 2008; van der Hoek et al., 2016; Yoshida et al., 2015). Therefore,
sustainable has been recognized by the Sustainable Development Goals they can only be applied post-ante for few options at a time (e.g.
SDG 6 (UN, 2015). In most of high-income countries, we benefit from Dahlmann, 2009; Meinzinger et al., 2009; Montangero et al., 2007;
great sanitation services and make great efforts to treat wastewaters and Ormandzhieva et al., 2014; Schütze and Alex, 2014; Ushijima et al.,
to prevent environmental pollution. However, at a global level consid 2012; Woltersdorf et al., 2016; Yiougo et al., 2011). Moreover, most of
ering rapidely growing urban centres in low-income areas, the situation the existing models are designed for conventional systems and are not
has not been improving much recently. One reason for this is, that easily applicable for innovations. To our knowledge, there is currently a
conventional sanitation solutions are not appropriate and thus not complete lack of generic methods to model substance flows of a large
viable in fast growing urban areas, where most of the current population and diverse range of sanitation systems at the scale of an entire city.
growth is taking place (Dodman et al., 2017; Isunju et al., 2011;
Tremolet et al., 2010; UNDESA, 2014). This is due to their requirements 1.1. Aim
for large amounts of water and energy, expensive infrastructure, and
long planning horizons (Davis et al., 2019). Sustainable sanitation sys To help solve this problem we will address two questions in this
tems should be locally appropriate in terms of technology, institutions paper:
and social acceptance, and economically viable in order to protect the
human health and the environment (SuSanA, 2008). But to be in line 1. How can we predict resource recovery and loss ratios of sanitation
with SDG 6, they should also be designed to closing water and nutrient systems ex-ante at the pre-planning phase?
loops at the lowest possible level. 2. And how can we do this efficiently to consider the entire sanitation
The definition of sustainable sanitation has triggered the develop system option space?
ment of many novel sanitation technologies and system configurations
such as urine diversion toilets or container-based sanitation (Tilmans To answer these questions, we present two elements. First, we pre
et al., 2015; Tobias et al., 2017). Many of these innovations are inde sent a method to model substance flows that is generic to any system and
pendent from sewers, water, and energy and therefore more appropriate can be applied automatically for many sanitation systems. Second, we
for developing urban areas. They are also potentially more sustainable provide the required a priori data to apply this model for four substances
because they often allow for the recovery of resources such as nutrients, and a large and diverse set of conventional and emerging technologies
water, and energy (e.g. Andriessen et al., 2019; Chen and Beck, 1997; ex-ante. The four substances cover nutrients (nitrogen and phosphorus),
Cofie et al., 2009; Daigger, 2009; Davis et al., 2014; Evans et al., 2013; organics and energy (total solids), and water. Because the a priori data is
Harder et al., 2019; Langergraber and Masi, 2018; Rao et al., 2017; highly variable depending on the technology implementation, the
Trimmer et al., 2019; Udert and Wachter, 2012). Also, the flexibility to quality and quantity of flows, and the local context, we also calculate the
cope with changing environmental and socio-demographic conditions uncertainties of the results. To exemplify the model and its outputs we
further enhance their sustainability (Hoffmann et al., 2020; Larsen et al., present a didactic case and some snapshots of a full-scale application of
2016). 41 technologies resulting in 101,548 valid system configurations.
While innovation potentially enhance sustainability, they certainly
enhance planning complexity. The currently available portfolio of 2. Methods
technologies leads to an overwhelming number of possible system
configurations. To consider them all in a strategic planning process is 2.1. Overview
extremely difficult. The two main challenges are (1) the lack of knowl
edge what options exists and how appropriate they might be in a given The quantification of recovery ratios of sanitation systems auto
context; and (2) data about the performance of these options regarding matically, for many options simultaneously, and ex-ante, requires three
the multiple sustainability criteria. The sustainability criteria are given elements: a generic description of the systems; a method to model the
by the five objectives for sustainable sanitation laid out by the Sus substance flows within these systems, and the data on transfer co
tainable Sanitation Alliance (SuSanA, 2008): health and hygiene, eco efficients and inflowing masses. Additionally, we need a way to consider
nomic viability, socio-cultural acceptance, technical and institutional the uncertainties related to the data of transfer coefficients as those
appropriateness, and protection of the environment and natural re data are based on prediction and not on in-situ measurements.
sources. Because sustainability requires multiple dimensions to be con Spuhler et al. (2018) provides an automated system builder that al
siders, trade-offs are to be expected and a multi-criteria decision lows to find all valid system options from a set of technologies. We
approach such as structured decision making is needed (Gregory et al., extended this model with a substance flow model and the technology
2012). Spuhler et al. (2018) addressed the lack of knowledge about library with the required data on transfer coefficients and their un
possible system configurations and local appropriateness. The here certainties. The only additional input is the masses entering a system
presented manuscript addresses the second point by presenting a model which is defined by the number of users within a year. Fig. 1 provides an
to quantify resource recovery and losses as one sustainability indicator overview on the required model and data elements. The substance
and by providing a technology library containing international data and modelling aspects are described in this method section. The required a
knowledge needed for this task. priori data (potential technologies, transfer coefficients and un
Only if practitioners have the knowledge and data about the resource certainties, inflowing masses) are provided in the results section.
recovery and loss ratios of the various sanitation system they can
consider environmental protection and circular economy when strate 2.2. Sanitation technologies and system builder
gically planning for sustainable sanitation. Hence this knowledge and
data are needed ex-ante, at the pre-planning phase. Unfortunately, in the The sanitation system builder defines a sanitation system (SanSys) as
absence of infrastructure in place and few full-scale implementation a set of compatible sanitation technologies (Techs) which in combina
examples of novel technologies and systems, we cannot measure this tion transport, transform, or separate sanitation products from their
2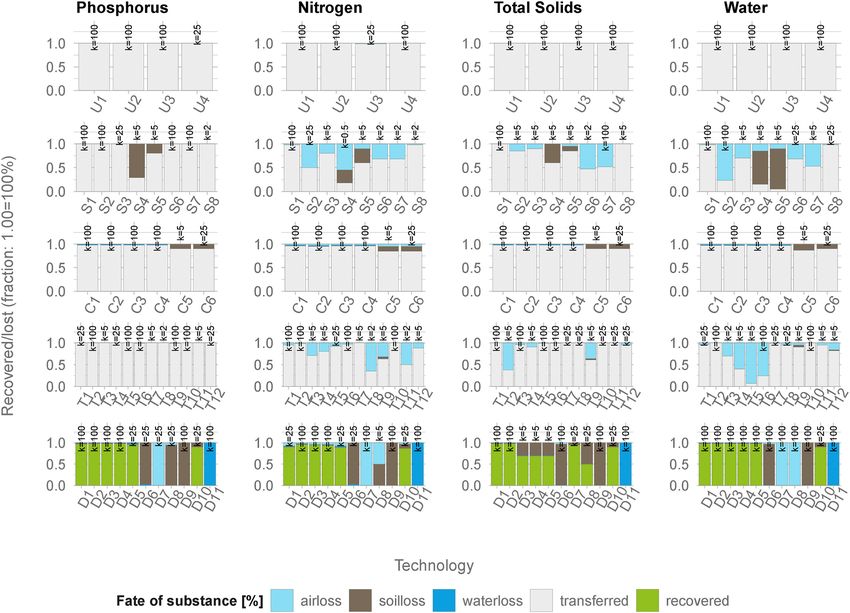
D. Spuhler et al. Journal of Environmental Management 280 (2021) 111785
F = F ⋅ P + F ext (2)
F = Fext ⋅ (I − P)− 1
(3)
The flow at steady state from node i to node j is consequently defined
as
flowi,j = Fi ⋅Pi,j (4)
The recovery ratios are defined only by the sinks. The total losses are
obtained by summing all the losses from all Techs within a SanSys.
Because we have different external inflows and transfer coefficients for
each substance, the calculations are repeated separately for each sub
Fig. 1. Overview of the required elements to quantify resource recovery and stance that is to be modelled.
loss ratios ex-ante for a large and diverse set of sanitation systems. The system
builder and the substance flow models are described in the methods. The data 2.4. Transfer coefficients
elements required for the model are in grey and provided in the results section.
The model output are the resource recovery and loss ratios.
Each technology needs to be characterised with a TC for each output
flow and substance of interest. For a given substance, the TC for the i-th
point of generation to the final point of reuse or disposal (Maurer et al., output flow of a technology (TCi ) is the fraction of the sum of the input
2012; Spuhler et al., 2018; Tilley et al., 2014). This definition is generic flows that leave the technology through outflow i:
and could be applied to any unit process, infrastructure, or service.
Sanitation products are materials that are generated either directly by outi
TCi = ∑n (5)
humans (e.g. urine, faeces, greywater), the urban environment (e.g. j=1 inj
stormwater), or by some Techs (e.g. sludge, biogas). Each Tech is
defined by the possible input and output products and the stage within a where n is the total number of inputs to this Tech. The output flows are
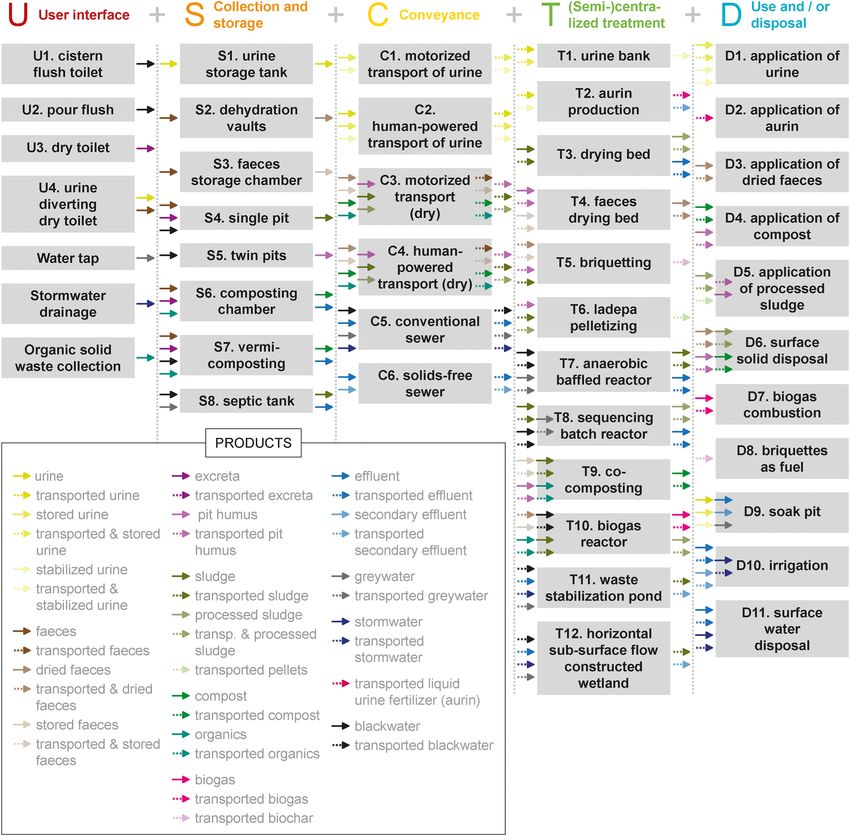
system (functional group) it can apply to (see Fig. 2). Sources could be the output products as well as the losses to the environment: to air, soil/
toilets, handwashing stations, stormwater collection tanks, organic solid groundwater, and surface water. Input flows are defined only by the
waste bins. In this paper, we focus on toilet sources only. input products as we assume a system with no biological fixation. Thus,
the sum of all TCs of a technology must always be 1 and all TCs positive.
Three types of TCs can be distinguished:
2.3. Substance flow modelling
(i) Input-output TCs. For every output a TC needs to be defined; the
The product connections between the technologies in each sanitation number of outputs depends on the Tech.
system define the flow paths of the substances (see also Fig. 2). Transfer (ii) Input-loss TCs. Quantifying the fraction of substances transferred
coefficients (TCs) define how much of substance entering a technology is to air, soil or groundwater, and surface water. We only consider
transferred to one of the output products, or lost to the environment. the losses (e.g. leaching of phosphorus from a single pit into the
These TCs and the connections can be expressed in a matrix P, where Pi,j soil) and not the subsequent interactions (e.g. transfer of the same
is the fraction of the substance leaving Tech i that is transferred to Tech j. phosphorus from the soil to the surface water).
Additionally, we define a row vector Fext (t), where the i-th element (iii) Recovery TCs. Besides losses, sink technologies also have a TC to
represents the external inflow to Tech i at time t (e.g. the dry toilet Tech quantify the fraction of a substance that can be recovered (e.g.
receives 0.548 kgyear− 1 of phosphorus per one person). Based on this over 90% of phosphorus is recovered through the sink ‘applica
information, we can calculate the total inflow into Tech i at time t. We tion of stored urine’).
define a row vector F(t) where the i-th element represents the sum of all
inflows to Tech i at time t (e.g. the amount of phosphorus entering a Fig. 3 provides an example of the flows and the TCs for the tech
single pit through excreta). nology single pit and the substance total phosphorus (TP). The example
The mass flows at time t + 1 are obtained by also shows the high variability of the data found in literature. Therefore,
we need a systematic method to consider and model this uncertainty.
Ft+1 = Ft ⋅ P + F ext t+1 (1)
If we assume a constant inflow F (t) = F , we have a steady state
ext ext
2.4.1. Estimation of transfer coefficients and their uncertainty
flow F that is calculated by We use two different ways to determine transfer coefficients. If
Fig. 2. A valid sanitation system is a set of technol
ogies which in combination manage sanitation prod
ucts from the point of generation to a final point of
reuse or disposal. Technologies contained in a system
can be organized in five functional groups (FGs): user
interface (U), on-site storage and treatment (S),
conveyance (C), (semi-)centralized treatment (T), and
reuse or disposal (D). Technologies belonging to U are
sources, technologies belonging to D are sinks. To
quantify resource recovery and loss ratios, substance
flows are modelled along the system allowing to then
quantify how much of inflowing mass of substance is
either lost, transferred, or can be recovered.
3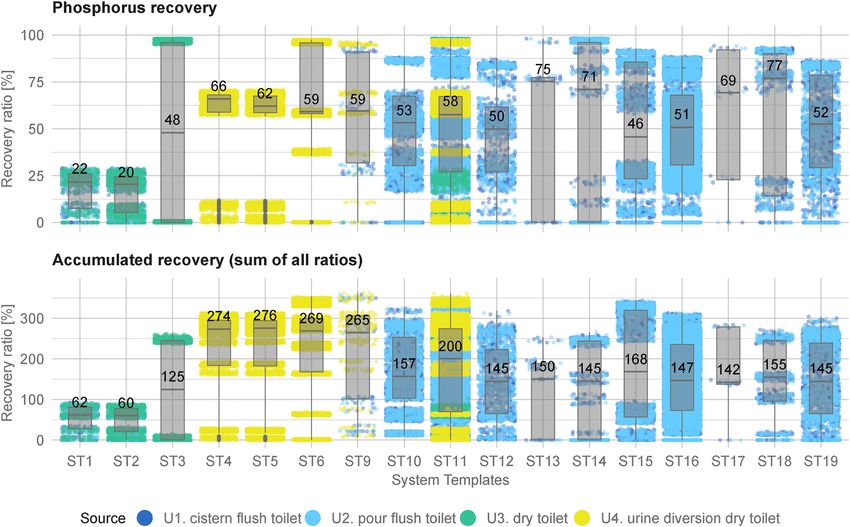
D. Spuhler et al. Journal of Environmental Management 280 (2021) 111785
Fig. 4. Three examples of concentration factors k for a set of four transfer
coefficients (0%, 20%, 30% and 45%). For k = 100, the distributions are
relatively narrow (small variability range of up to 10% expressed as standard
deviation). For k = 5, the variability ranges are up to 40%.
Table 1
Fig. 3. Illustration of the approach used to quantify transfer coefficients (TCs) Six standardized intervals are used to translate the variability of ranges observed
using the example of total phosphorus (TP) pathways in a single pit. The TCs are in literature into the concentration factor k. The variability range of a transfer
estimated based on literature values in mass and in percentage as mean values. coefficient i (TCi) is defined by the range between the lowest and the highest
In parenthesis we provide the variability range resulting from the literature value data points reported in literature.
data points. From the 100% of phosphorus entering the single pit via black Observed variability ranges in Concentration factor for the Dirichlet
water, 29% are transferred to sludge and 71% are lost to the soil. But the un literature data distribution (k)
certainty resulting from the TC data results in a variability of 18–40 and
60–82% respectively. [0, 0.1] (0–10%) 100
]0.1, 0.2] (10–20%) 25
]0.2, 0.4] (20–40%) 5
literature data was available, we defined the expected value μi for TCi as ]0.4, 0.6] (40–60%) 2
the median of the data points collected from the literature. In absence of ]0.6, 0.8] (60–80%) 1
literature data, we used expert judgement. For expert judgment we ]0.8, 1] (80–100%) 0.5
collected information on the chemical and physical processes to make a
best guess or contacted colleagues directly involved in the development bimodal. The effect of k is visualized in Fig. 4.
of the technology to do that for us. To simplify the application of the approach, we define six generic
Because TCs depend on the environmental conditions, the design and values for k and use two different approaches to define k for a given TC:
implementation of a technology, the qualities and quantities of inputs, one for the case when literature data is present and based on the liter
and ignorance (especially for novel technologies), exact definition is not ature data variability; and one for the case of expert judgement based on
possible. It is therefore important to consider uncertainties attached to the confidence in the judgement.
the TCs. A suitable model is the Dirichlet distribution as it encodes the Concentration factors k based on literature observation: The
sum constraint. Thus, the probability density of the transfer coefficients range between the lowest and the highest values of all data points, the
TC = [TC1 …TCn ] of a given Tech is: variability range ri , is determined and used to define the concentration
1 ∏n αi − factor k with the help of Table 1. In the example presented in Fig. 3, total
TC̃f (x) = xi 1
(6) phosphorus transferred to sludge in a single pit, we found TC values in
B(α) i=1
the literature between 18% and 40%, resulting in ri = 0.40–0.18 = 0.22
where B is the Beta function and n is the number of TCs for a given Tech and thus k = 5. As the ri for different TCi s of one Tech are not identical,
(Johnson et al., 1995). We define αi = μi ⋅k, where μi is the expected we use the largest ri to define k. Table 1 shows the k associated with each
value of TCi and k is the concentration describing the variability range ri variability range ri . The values are based on an approximation using 45
of the TCs. The smaller the k, the larger the standard deviation of the possible scenarios of TCs sets and their variability ranges (details are
observations. For a very small k, the marginal distributions become provided in supplementary information SI-A).
Table 2
Experts’ knowledge about the technology and confidence in the substance are used to define the concentration factor k for transfer coefficients based on expert
judgement. Confidence in the technology depends on different factors such as its development stage and the process used. Nitrogen and total solids have lower
confidence, while phosphorus and water have medium and high confidence.
Concentration factor used in the Dirichlet distribution (k) Confidence in knowledge about technology (technology readiness level)
low medium high
Confidence in substance Low 1 2 5
Medium 2 5 25
High 5 25 100
4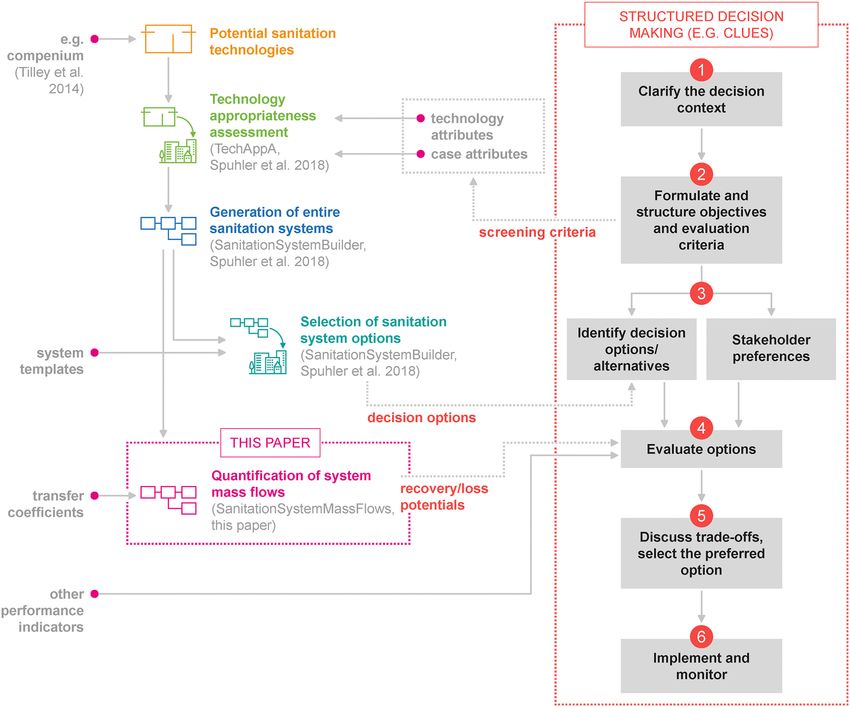
D. Spuhler et al. Journal of Environmental Management 280 (2021) 111785
Concentration factors k for TCs defined by expert judgement: We 2.6. Integration in the planning process
define the concentration factor k as a statement of the experts’ confi
dence in two dimensions: (i) confidence in knowledge about the tech The approach from Spuhler et al. (2018) and the extension presented
nology, and (ii) confidence in knowledge about the specific substance, as here are designed to provide input to strategic planning. As strategic
shown in Table 2. The knowledge about the technology is defined by the planning framework, we use structured decision making (SDM) which
readiness level and its complexity. The knowledge in the substance is covers six steps generic to any decision-making process (Gregory et al.,
defined by a judgement how well the substance behaviour can be 2012) as shown in Fig. 5. The integration of our methods into a regular
predicted. SDM planning process happens at steps 2, 3 and 4. In Spuhler et al.
(2020) we detailed the procedure and the requirements for this inte
2.5. Uncertainty propagation gration. Here we shortly explain how the appropriateness of sanitation
system can be evaluated and how this can be used to pre-select a set of
Monte Carlo simulations are used to propagate the uncertainty of the sanitation system planning options.
TCs through the substance flow model and to quantify their effect on the The main input are: (1) a set so screening criteria that can be used to
resource recovery and loss ratios. The TCs for each Tech are sampled evaluate the appropriateness of a given technology; (2) the data
from their Dirichlet distribution and used to compute the mass flow of describing the local conditions; and (3) the number of options that
the entire SanSys in repeated runs. We used a total of 300 runs which should be pre-selected.
proved to be sufficient for stable results (see SI–B). The screening criteria (appropriateness criteria) are obtained
together with stakeholders and based on the definition of sustainable
sanitation. They cover technical, legal, socio-cultural and institutional
aspects (see also the SI of Spuhler et al., 2020; Spuhler et al., 2018)). In
Fig. 5. Overview of the methods developed in Spuhler et al. (2018) and the expansion presented in this paper and how they are integrated into a structured
decision-making (SDM) framework. Spuhler et al. (2018) provies the procedure to generate sanitation system options. In this paper we present an approach that
supports step 4 consisting in the automatic evaluation and comparison of nutrient, solids and water recovery and loss ratios of the sanitation systems.
5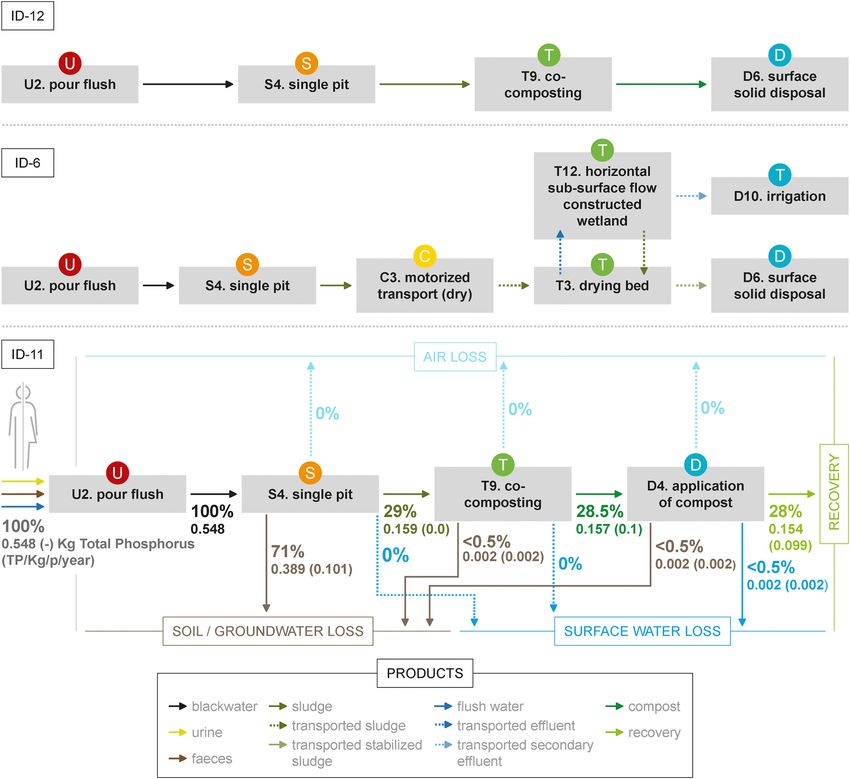
D. Spuhler et al. Journal of Environmental Management 280 (2021) 111785
order not to bias the final decision, only criteria which are agreed on by a manageable number (e.g. something between three and 50 options).
all stakeholders and are not expected to involve trade-offs can be used Thus, an additional step is required. This step consists in selecting a set
for pre-selection. Typical screening criteria are groundwater table, water of options which is appropriate but also diverse in order to further avoid
and energy availability, space availability, operation and maintenance bias. The diversity is defined by system templates (Spuhler et al., 2018;
skills availability, etc. Each technology is characterised for these criteria Tilley et al., 2014). Using nine binary conditions, we define 19 templates
with data in the technology library. The data for the local conditions is as shown in Table 3. By selecting the most appropriate sanitation system
provided by the SDM process. By matching the technology data to the from each template, a set of sanitation system planning options is ob
local conditions, a technology appropriateness score (TAS) is calculated. tained which is locally appropriate, of manageable size, and diverse.
By aggregating all TAS within a system, the system appropriateness
scores (SAS) is obtained. The SAS varies between 0 and 100% and ex 2.7. Implementation
presses the confidence in the suitability of the system for the local
conditions (Spuhler et al., 2018). All algorithms used in this paper are implemented in Julia (Bezanson
The appropriateness assessment is not enough to limit the options to et al., 2017) and available for download as a package at https://github.
Fig. 6. Overview of the set of sanitation technologies currently available in the technology library for five functional groups. Each box represents a technology. The
arrows represent the input and output products. So far only toilet sources are implemented, although greywater, stormwater, and organic waste sources can also be
considered by the model.
6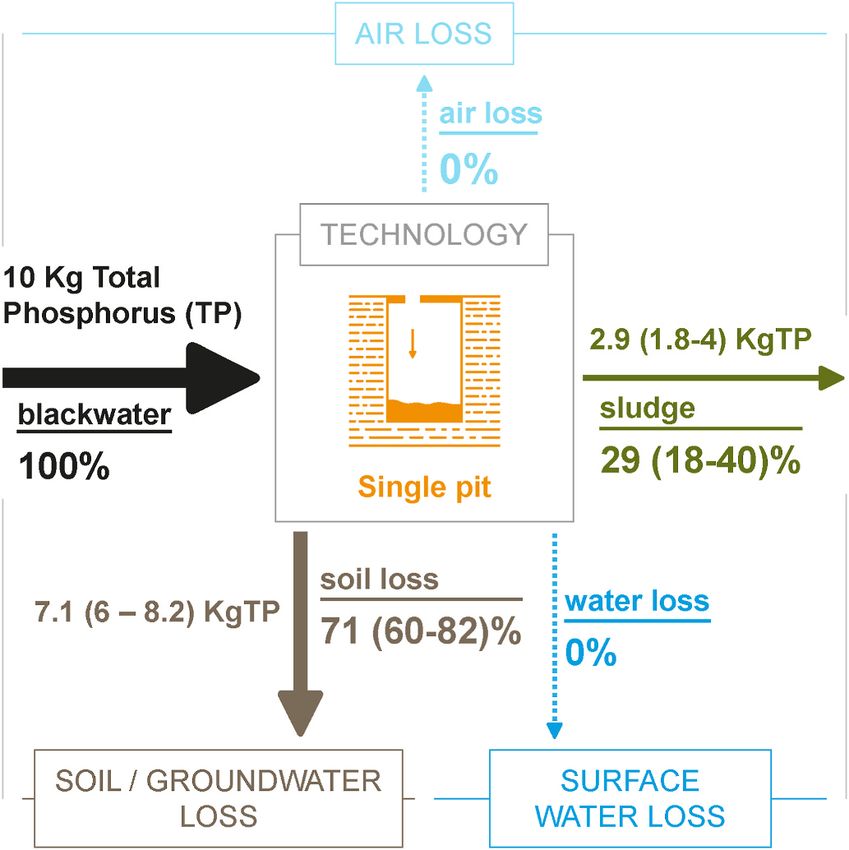
Table 3

                                                                                                                                                                                                                                   D. Spuhler et al.
    System templates (ST) used to characterize the sanitation system (SanSys) options. The STs are adapted from Spuhler et al. (2018). Each of the 19 STs has a unique profile defined by a value for the nine properties. ‘1’
    means that the property applies; 0 means that the property does not apply; and ‘ND’ (not defined) means that the property does not apply to this ST.
     Group          Name                              System template profiles                   Dry material (pit   Onsite       Urine   Blackwater   Transported       Effluent    Biogas,      Transported          Onsite
                                                                                                 humus,              sludge                            black- or brown   transport   biochar or   biogas, biochar,     single
                                                                                                 compost, dried      production                        water                         briquettes   or briquettes        pit
                                                                                                 or stored faeces)

     Onsite         ST1     Dry onsite storage        Onsite single pits with sludge             ND                  1            0       ND           0                 0           0            0                    1
      simple                with sludge               production.
                            production without
                            effluent transport
                    ST2     Dry onsite storage        Onsite single pits with sludge             ND                  1            0       ND           0                 1           0            0                    1
                            with sludge               production and with effluent
                            production with           transport.
                            effluent transport
                    ST3     Dry onsite storage and    Onsite storage of excreta and              1                   0            0       0            0                 ND          0            0                    0
                            treatment without         transformation to either pit humus or
                            sludge production         compost.
     Urine          ST4     Dry onsite storage        Simple onsite storage of dry or wet        ND                  1            1       ND           0                 0           0            0                    1
                            without treatment         toilet products with sludge
                            with urine diversion      production (e.g. single pits, double
                            without effluent          pits, twin pits) with onsite effluent
                            transport                 management (e.g. soak pits).
                    ST5     Dry onsite storage        Simple onsite storage of dry or wet        ND                  1            1       ND           0                 1           0            0                    1
                            without treatment         toilet products with sludge
                            with urine diversion      production (e.g. single pits, double
                            with effluent transport   pits, twin pits) with effluent transport
                                                      to offsite management.
                    ST6     Dry onsite storage and    Urine diversion dry toilets (UDDTs)        1                   0            1       0            0                 ND          0            0                    0
                            treatment with urine      or dry composting systems with urine
7

                            diversion                 diversion.
                    ST7     Onsite blackwater         Onsite composting systems with urine       1                   0            1       1            0                 ND          0            0                    0
                            without sludge and        diversion.
                            with urine diversion
                    ST8     Offsite blackwater        Sewer systems with urine diversion.        ND                  ND           1       1            1                 ND          0            0                    ND
                            treatment with urine
                            diversion
     Biofuel        ST9     Onsite biogas,            Biogas reactors or other fuel              ND                  ND           ND      ND           0                 0           1            0                    ND
                            biochar, or briquettes    producing technologies (e.g. ladepa)
                            without effluent          with onsite effluent management (e.g.
                            transport                 soak pit).
                    ST10    Onsite biogas,            Biogas reactors or other fuel              ND                  ND           ND      ND           0                 1           1            0                    ND

                                                                                                                                                                                                                                   Journal of Environmental Management 280 (2021) 111785
                            biochar, or briquettes    producing technologies (e.g. ladepa)
                            with effluent transport   where effluent goes to simplified
                                                      sewer.
                    ST11    Offsite biogas,           Offsite production of biofuel from pit     ND                  ND           ND      ND           0                 ND          1            1                    ND
                            biochar, or briquettes    humus or sludge (e.g. from septic
                            without blackwater        tanks).
                            transport
                    ST12    Offsite biogas,           Offsite co-digestion of blackwater         ND                  ND           ND      1            1                 ND          1            1                    ND
                            biochar, or briquettes    collected through sewer lines.
                            with blackwater
                            transport
     Blackwater     ST13    Onsite blackwater         Blackwater stored, dewatered, and          1                   0            0       1            0                 0           0            0                    0
                            without sludge and        transformed to compost or pit humus
                            without effluent          (e.g. twin-pits), onsite effluent
                            transport                 management (e.g. soak pit).

                                                                                                                                                                                                        (continued on next page)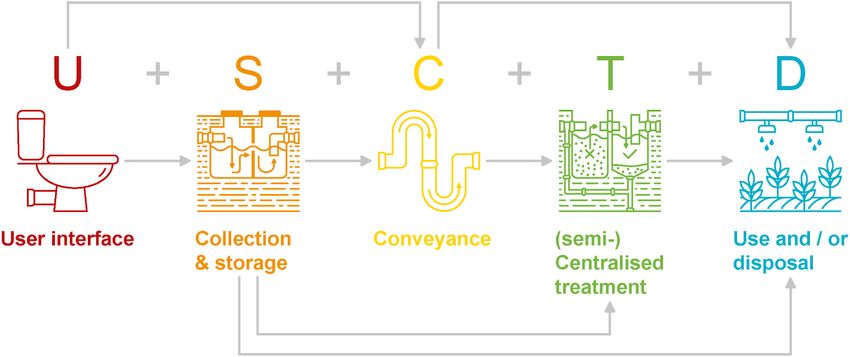
D. Spuhler et al. Journal of Environmental Management 280 (2021) 111785
Table 4
Onsite
single
pit
Overview of estimated inflow substance masses based on international literature
per person and year. TP: total phosphorus, TN: total nitrogen, TS: total solids,
0
0
0
0
0
0
H2O: water. The amount of TP, TN, and TS are the same for all sources; only
water inflow masses depend on the flush volume. The assumed amount of
biogas, biochar,
flushing water is 2 L/day/person for the pour flush toilet and 60 L/day/person
or briquettes
Transported
for the cistern flush toilet. Details on the assumptions and literature references
are provided in SI–B.
Substance U1. U2. pour U3. U4. urine
0
0
0
0
0
0
cistern flush dry diversion dry
flush toilet toilet toilet (UDDT)
biochar or
briquettes
toilet
Biogas,
Inflows in kg TP 0.548
ND
year− 1 for 1 TN 4.55
0
0
0
0
0
person TS 32.12
equivalent H2O 22447.1 1277.1 547.1
transport
Effluent
1
0
1
0
1
1
com/Eawag-SWW/SanitationSystemMassFlow.jl (v1.0). A newer
version can be accessed at https://github.com/santiago-sanitation-sys
black- or brown
tems/Santiago.jl. Case specific scripts are not included but can be
Transported
shared upon request. The technology appropriateness model is sepa
rately implemented in R (R Development Core Team, 2018) and can be
water
used independently. It is accessible at https://github.com/Eawag-SWW/
0
0
0
0
0
1
TechAppA (v1.0).
Blackwater
Data and code used for the didactic application are available in the
associated data package 1: https://doi.org/10.25678/0000HH ([data
set] Spuhler, 2020)). The input data contains the definition of Techs
1
1
1
1
1
0
including their transfer coefficients and appropriateness profiles. The
Urine
output data contains plots of all systems, a table with the characteristics
ND
ND
ND
ND
ND
ND
and mass flow results of all systems, and a Julia database to load and
work with the data interactively.
production
The technology library including the TCs, a detailed description of
each technology, and instructions how to add or modify technologies is
sludge
Onsite
provided in the associated data package 2: https://doi.org/10.256
0
1
1
0
0
0
78/0000ss ([dataset] Spuhler and Roller, 2020) and in Spuhler and
Roller, 2020. The data package also contains a comma separated file for
Dry material (pit
or stored faeces)
compost, dried
more convenient modification and which can be directly read by the
models.
humus,
ND
ND
3. Results
1
0
0
0
onsite effluent management (e.g. soak
transformed to compost or pit humus
basic treatment (e.g. septic tank) with
basic treatment (e.g. septic tank) with
Compact onsite wastewater treatment
Compact onsite wastewater treatment
units (e.g. SBR) with effluent going to
Storage technologies including some
Storage technologies including some
effluent going to simplified sewer or
units (e.g. SBR) with onsite effluent
Blackwater stored, dewatered, and
(Semi-)centralized sewer system.
(e.g. twin-pits), effluent goes to
Table 5
Characteristics of systems generated in the didactic application. Only the mass
simplified sewer or similar.
simplified sewer or similar.
System template profiles
flow results for total phosphorus (TP) are shown and expressed in % of entered
substances. The full results are provided in the associated data package 1 ERIC:
https://doi.org/10.25678/0000HH ([dataset] Spuhler, 2020) and in SI-E. ID:
unique identification number: Length: number of technologies contained in the
management.
system. The value in parentheses “()” represents the standard deviation (SD)
similar.
resulting from the Monte Carlo simulation.
pit).
ID Length TP recovery ratio TP air loss TP soil loss TP water loss
[%] [%] [%] [%]
with effluent transport
1 6 10 (9) 0 89 (9) 1 (1)
with sludge without
without sludge and
treatment without
Offsite blackwater
2 9 10 (8) 0 89 (9) 1 (1)
Onsite blackwater
Onsite blackwater
Onsite blackwater
Onsite blackwater
Onsite blackwater
effluent transport
effluent transport
effluent transport
effluent transport
with sludge and
3 9 6 (5) 0 93 (6) 1 (1)
treatment with
4 5 28 (17) 0 71 (18) 1 (1)
treatment
5 5 0 0 99 (1) 1 (1)
6 7 7 (7) 0 91 (7) 1 (1)
7 6 10 (10) 0 89 (10) 1 (1)
8 5 10 (9) 0 89 (9) 1 (1)
9 5 28 (18) 0 71 (18) 1 (1)
Name
ST14
ST15
ST16
ST17
ST18
ST19
10 5 0 0 99 (2) 1 (2)
Table 3 (continued )
11 4 28 (18) 0 72 (18) 0
12 4 0 0 99 (1) 1 (1)
Group
To use the developed substance flow model, we require the potential
technologies, a priori data on the transfer coefficients and their
8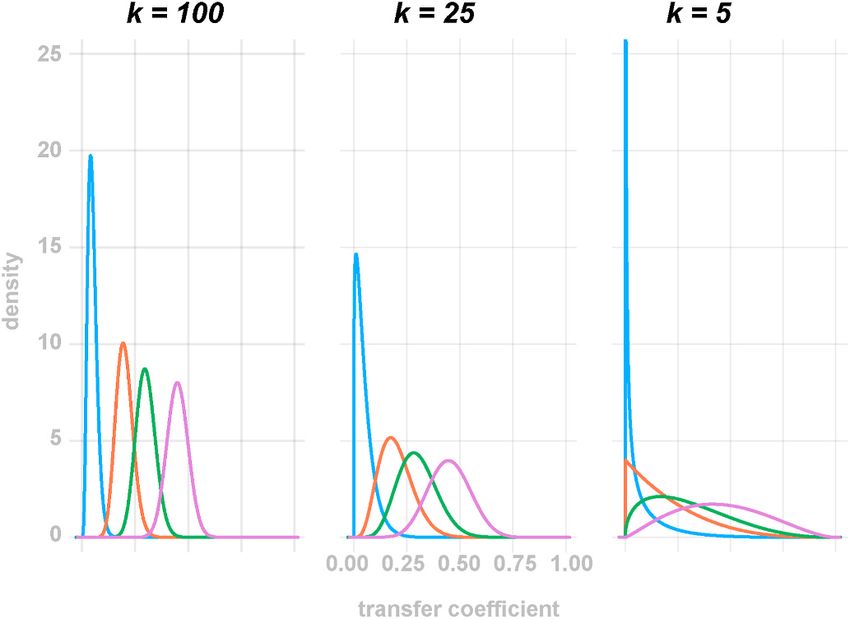
D. Spuhler et al. Journal of Environmental Management 280 (2021) 111785
Fig. 7. Overview of losses, transfers, and recoveries for all four substances and 41 technologies. Each bar represents a technology, the colours indicate the fate of the
substances which is either lost, transferred, or recovered. From top to bottom the technologies are grouped by functional group (rows). U: user interface, S: storage
and treatment, C: conveyance, T: (Semi-)centralized treatment, D: reuse or disposal. The k is the concentration factor indicating the uncertainty. A low k means high
uncertainty. See Fig. 6 for the technologies behind the labels (e.g. T9 = Co-composting). (For interpretation of the references to colour in this figure legend, the reader
is referred to the Web version of this article.)
uncertainties, as well as the masses per person and year entering a pelletizing (Septien et al., 2018b). The resulting 41 technologies
system. To exemplify the use of the model and its outputs we present a currently available in the technology library are shown in Fig. 6.
didactic case. To illustrate the entire potential of the model we apply it This technology library has two important features:
to all 41 technologies resulting in 101,548 valid system configurations.
To show the relevance for strategic planning and implications for • First, it covers a set of technologies which is able to represent the
practice we use the case of a rapidly growing small town in Nepal pre entire system option space including different concepts (dry, wet,
viously presented in Spuhler et al. (2018). urine diversion, biofuel product) and degrees of centralisation (from
onsite to decentralized, centralized, and hybrid systems). This is
3.1. Technology library illustrated by the system templates described in section 2.6 and used
in the full-scale example application (section 3.6).
The aim of the technology library is to cover a large and diverse set of • Second, using the generic definition of Techs and products, the li
conventional and emerging technologies. To compile the library we used brary can easily be extended with any (future) technology.
as starting point the list of technologies provided by Spuhler et al. (2018)
and Tilley et al. (2014). We complement this list here with five novel 3.2. Substances: total phosphorus, total nitrogen, total solids, and water
technologies: liquid urine fertilizer (aurin) production and application
(Bonvin et al., 2015; Etter et al., 2015; Fumasoli et al., 2016), briquet For every technology we added the transfer coefficients for four
ting based on the process implemented by Sanivation in Naivasha substances with different properties: Total Phosphorus (TP), Total Ni
(Jones, 2017), and latrine dehydration and pasteurization, ladepa trogen (TN), Total Solids (TS) and water (H2O). TP and TN are both
9
D. Spuhler et al. Journal of Environmental Management 280 (2021) 111785
Fig. 8. Three systems resulting from the didactic application. ID-12 is the least complex system; ID-6 is the most complex system, integrating loops; and ID-11 is a
system with very high phosphorus recovery. For SanSys-ID11 we provide all flows for total phosphorus (TP). All numbers are either in kg person− 1year− 1 or %. The
standard deviations (SD) resulting from the uncertainties of the transfer coefficient (TCs) are given in parentheses. ID: unique identification number.
important macronutrients with significant environmental pollution po 3.3. Transfer coefficients
tential and at the other hand predicted to deplete soon. TS can be used as
a proxy for energy, for example in the form of briquettes or biochar (e.g. The literature review and collection of expert knowledge resulted in
Andriessen et al., 2019; Motte et al., 2013), and for organic matter that the definition of transfer coefficients for the 41 technologies and the four
can be used as soil amendment (e.g. Diener et al., 2014; Septien et al., substances. For the literature review, preference was given to peer-
2018a). Water in many urban areas is under increasing pressure and has reviewed literature, but other literature such as project reports, fact
become a scarce commodity. For TN and TS, the behaviour is also more sheets, and books were also considered. In absence of literature data, we
difficult to predict than for TP and water. Water is a special case because either made a best guess ourselves or contacted colleagues directly
the inflowing masses vary significantly depending on the source (e.g. dry involved in the development of the technology. This was the case for
toilet versus cistern-flush toilet) and from a sustainability perspective, aurin production, briquetting, and ladepa pelletizing. The detailed list of
both the requirement and the recovered masses are interesting. A more all TCs and corresponding literature references are available in the SI-D
detailed description of the four substances and their relevance can be and in [dataset] Spuhler and Roller, 2020. Because this data is generic
found in the technology library ([dataset] Spuhler and Roller, 2020). In and could be used for any other application, we present an overview in
summary, the choice of substances allows to quantify resource recovery Fig. 7. Each bar corresponds to a technology and the colours represent
and losses in terms of nutrients, energy, and water and to demonstrate the fraction of a substance which is either transferred, lost to air, soil, or
the approach for substances with different properties. water, or recovered. This figure also indicates some pattern that are
10D. Spuhler et al. Journal of Environmental Management 280 (2021) 111785
confirmed by the analysis of recovery ratios from the full-scale and loss ratios, and the consequences of the TC uncertainties. The results
application: are fairly straightforward and intended to demonstrate that the fully
automatic procedure is capable of producing reasonable outcomes. The
• The functional groups storage and treatment (FG S) and (semi-) example is based on only nine technologies: U2. pour flush toilet, S4.
centralized treatment (FG T) have a stronger contribution to losses. single pit, C4. human transport of dry material, T3. sludge drying bed,
• Recovery can only occur in the sink technologies (FG D) and many of T9. co-composting, T12. horizontal subsurface flow constructed
the sink technologies provide either almost 100% recovery (recovery wetland, D4. application of compost and pit humus, D6. surface solids
sinks) or 100% losses (disposal sinks). disposal, D10. Irrigation. The details on the transfer coefficients and
their uncertainty is presented in SI-D and the associated data package 2
3.4. System inflows ([dataset] Spuhler and Roller, 2020).
We used literature data to provide the inflowing masses for the four 3.5.1. Overview on results
substances for one person and year (e.g. Lohri et al., 2010; Rose et al., The nine technologies can be combined into 12 systems listed in
2015). Although the masses vary depending on the diet of people, the Table 5. All of them are valid according to our definition and very
inflow masses presented in Table 4 provide an estiamte that can be plausible from a practical point of view (see supplementary information
applied to any case in the absence of more detailed knowledge. Details SI-E). The mass flow calculations provide the flows in each technology,
on the underlying calculations are provided in SI–B. As the current as well as the losses to air, soil, and surface water. These flows and losses
version of the technology library only considers toilet sources, the allow to calculate the recovery and loss ratios for the four substances for
inflowing mass is equal to the mass of substance contained in the urine, the entire systems. The recovery and loss ratios can be calculated as mass
faeces, and flushing water. The values can be scaled using the number of or as ratio in percentage. Both results include the uncertainties of the
inhabitants within an area or adapted if local data is available. transfer coefficients that can be expressed as standard deviation.
In Fig. 8, we present three SanSys in more detail:
3.5. Didactic application
• ID-12 is the simplest system possible with the nine technologies. But
This simple didactic application helps to illustrate the substance flow this system provides no phosphorus recovery, as it contains only a
model, the mass flow calculations, the estimations of resource recovery disposal sink.
Fig. 9. Recovery ratios of all sanitation system options for total phosphorus and accumulated for all four substances. The accumulated recovery corresponds to the
sum of the ratio for phosphorus (TP), nitrogen (TN), total solids (TS), water (H2O). The y-axis shows the recovery ratio. The x-axis shows the system templates STs
(no system from ST7 and ST8 was generated). Each dot represents a system. The colour represents the source of the system which is either a cistern flush toilet, pour
flush toilet, dry toilet, or urine diversion dry toilet. Because the results are shown in percentage and not in masses, the recovery ratios for the cistern flush and pour
flush toilet are identical and therefore only light blue dots are visible The grey box represents a boxplot of the same data with the line being the mean value. The
figure shows that system templates are no indicator for the recovery ratio and that therefore it is important to know the recovery ratios of all possible systems. To
optimise recovery, one of the systems at the upper edge of ST9 should be selected which combine urine diversion with biofuel production. (For interpretation of the
references to colour in this figure legend, the reader is referred to the Web version of this article.)
11D. Spuhler et al. Journal of Environmental Management 280 (2021) 111785
• ID-6 is the most complex system which also integrates loops. would be interested in high phosphorus recovery, you would prob
• ID-11 is similar to ID-12 but contains a recovery sink (‘the applica ably go for a system from one of these two templates.
tion of compost’) and is therefore the system with the highest • But for the accumulated recovery ratio, the results are different.
resource recovery ratio for phosphorus. Urine diversion templates (ST4 to ST6) show the highest mean
accumulated recovery, followed by the biofuel templates (ST9 to
For ID-11 we provide in details the flows for phosphorus. This is ST12) and some blackwater templates (ST14, ST16). Thus, if the
interesting, because it shows that the recovery ratio is mainly influenced objective is resource recovery in general, you would prioritise the
by one technology: the single pit where 72% of phosphorus is lost to soil. templates ST4 and ST5.
For total nitrogen (TN) and total solids (TS), more important losses occur • However, if you are not interested in the templates, but are interested
in the co-composting process to the air. Not only the losses, but also the in the optimised recovery of phosphorus, then you would choose one
uncertainties are dominated by the single pit where the standard devi of the systems at the upper edge of ST 3 (onsite composting) or ST14
ation for the TP to soil is 18% (Table 5). (onsite blackwater systems). These systems include few treatment
Analysing the results of all 12 system we can identify three groups. steps and are therefore particularly short. Urine diversion systems
Group 1 includes systems with recovery sinks (co-composting and are generally longer (more products, more bifurcation) and losses are
application of compost, ID4, ID9, ID11) and high phosphorus recovery generally high for very long systems. Short systems reduce the risk
ratios. Group 2 includes systems with both loss sinks (sludge drying beds for losses but can also result in very low effluent quality (e.g. direct
and surface solids disposal) and recovery sinks, ID1, ID2, ID3, ID6, ID7, irrigation after a septic tank).
and ID8) and low phosphorus recovery ratios. Group 3 includes systems • If you are independently of the templates interested in optimising
with only loss sinks (ID5, ID10 and ID12) and no phosphorus recovery at accumulated recovery (not only phosphorus), then the choice would
all. be one of the systems at the upper edge of ST9 which combines urine
From this example we learn four things: diversion with the production of biofuel.
• The model is capable of creating reasonable system configurations 3.6.2. Dependencies with other sustainability criteria
and automatically calculating reasonable mass flows through the To illustrate the integration with the planning process and the de
systems. pendencies of resource recovery with other sustainability criteria we use
• Resource recovery depends on the technology interaction. For the case of Katarniya, a rapidly growing small town in Nepal already
instance, the fraction of inflowing mass that can be recovered in a used in Spuhler et al. (2018). 15 screening criteria from the library
sink depends on how much losses occur on the way. ([dataset] Spuhler and Roller, 2020) are used to calculate the sanitation
• There are some key technologies that have a major impact on the system appropriateness scores SAS. In Fig. 10 we plot again all 101,548
recovery ratios and the uncertainties (single pit in this example). systems comparing the resource recovery ratio with the SAS. For TP, TN,
Thus, in some instances, the recovery ratio can be significantly and TS we show the ratio in percentage. For water, we provide the ab
enhanced or reduced by exchange only one technology. solute volume [m3year− 1], as this is the more relevant information for
• Knowing uncertainties allows to assess the robustness of the results. comparing different systems. The coloured dots indicate the selected
The uncertainties obtained by the model are substantial, but com systems which are those with the highest SAS from each template. From
parable to those obtained in studies using a conventional post-ante this figure we learn two things:
material flow analysis (e.g. Montangero and Belevi, 2008).
• The selected systems are distributed over the entire range of recovery
3.6. Full-scale application confirming that templates are no indicator for resource recovery (see
previous Fig. 9).
Using all the 41 technologies from the library, the system builder • There exist no clear “winners” solutions. For some templates (for
generated 101,548 valid SanSys of 17 system templates as defined in instance for ST3 or ST 19) there exists a high probability that systems
Table 3. The substance flows were modelled for 1000 people equivalent could be found that are both, appropriate and enhancing recovery.
(corresponding to a larger neighbourhood) and for all 101,548 systems But for others recovery ratio and appropriateness are diverging.
and four substances total phosphorus (TP), nitrogen (TN), total solids Similar trade-offs would be expected for other sustainability in
(TS), and water (H2O). dicators such as costs. Moreover, there exists also some systems that
have a high recovery ratio for one substance but not for another
3.6.1. Resource recovery ratios implying that there exist also trade-offs among different types of
In Fig. 9 we show the results of the resource recovery ratios grouped reuse (e.g. energy versus nutrients).
by system template as defined in Table 3 which are indicated in the x-
axis. Each dot represents one of the 101,548 systems. The colour rep These results highlight the need for an automated model that enables
resents the source of this system which is either a cistern flush toilet, the consideration of resource recovery ratios already at the pre-selection
pour flush toilet, dry toilet, or urine diversion dry toilet. No system from phase in order to make trade-offs explicit and thus negotiable.
ST7 and ST8 was formed because the urine diversion flush toilet was not
considered. The y-axis shows the recovery ratio between 0 and 100%. 4. Discussion
Because the results are shown in percentage and not in masses, the re
covery ratios for the cistern flush and pour flush toilet are identical and 4.1. Lessons from the model applications
therefore overlap (only light blue dots visible).
As expected across the more than 100,000 systems, all four sub The application of the model provided us with following insights:
stances showed recovery ratios from nothing to almost 100% even
within the same templates. The only exceptions are the simple onsite • The amounts of resources potentially recovered in sinks designed for
templates (ST1 and ST2) with exclusively low recovery ratios. This reuse is limited by the resources that are lost on the way. This is a
shows that system templates are not enough indicator for resource re simple example showing the importance of technology interactions
covery. Fig. 9 provides additional information: on system level for resource recovery and cannot be evaluated based
on single technology alone.
• For phosphorus recovery, the simple onsite blackwater systems
(ST13 and ST14) have the highest mean recovery ratio. Thus, if you
12D. Spuhler et al. Journal of Environmental Management 280 (2021) 111785
Fig. 10. Point plots of recovery ratios of all sanitation systems compared to the system appropriateness scores. For water, we provide the absolute volume
[m3year− 1], as this is the more relevant information for comparing different systems. The selected systems (highest SAS) from each system template (ST) are shown as
coloured dots and marked with the system ID. The templates are described in detail in Table 3. The figure shows that some of the appropriateness show low recovery
ratio, confirming that templates are a good indicator for diversity. However, given that almost all templates also include systems with high recovery ratio, there exists
a high probability that systems with both high recovery and high SAS could be found.
• Some system characteristics, like the integration of a specific tech • First, the model it is generic and thus can be easily extended to
nology or the length (number of technologies) can provide hints on accommodate new technologies or products.
the potential resource recovery, but no reliable guidance. • Second, the model is automated. This allows an application to a
• There are trade-offs between different potentially recovered re diverse and large range of sanitation technologies and systems
sources (e.g. phosphorus and water). Only some systems such as from simultaneously with minimal manual labour.
ST9 manage to combine different reuse optimising the accumulated • Third, all the data to apply the model ex-ante are available and
recovery ratios. There are similar trade-offs expected to arise in uncertainties are systematically considered.
comparison with other sustainability criteria such as appropriateness
or costs. Because there are no clear predefined winners or losers, it is In the following, we discuss some of these aspect in more detail.
important to know the resource recovery ratios of all systems options Generalisation and automation: the generic definition of tech
for the pre-selection and not only for some options during the nologies and systems enabled the automation. This generalisation brings
detailed evaluation. however also a number of limitations which are discussed below.
Integration of literature data: A major strength of our approach is
The relevance of technology interaction shows that an automated the quantitative integration of data from literature. The data in the
approach that can look at all possible systems instead of single tech associated data package 2 at ERIC: https://doi.org/10.25678/0000ss
nologies is useful. Because of the trade-offs, the model must be appli ([dataset] Spuhler and Roller, 2020) are based on an extensive litera
cable ex-ante in order to support strategic planning. ture research, are complemented with expert knowledge, and present a
compact and accessible overview of the currently available knowledge
on the performance of conventional and emerging technologies. Confi
4.2. Advantage and novelty of the approach dence in knowledge about the performance of a specific technology is
reflected in the defined uncertainties. This large body of independent
The presented approach integrates algorithms, literature data and knowledge is integrated to the local planning process through the model
expert knowledge into a systematic tool. This provides three main results.
advantages:
13D. Spuhler et al. Journal of Environmental Management 280 (2021) 111785
Uncertainty estimations: For each recovery and loss ratio, the Importantly, these simplifications allow the automation and gener
model also quantifies the uncertainties arising from the transfer coeffi alization of the model application. Consequences of the simplifications
cient uncertainties. For instance, in the didactic application the mean are captured in the uncertainty calculations. As the model is generic and
phosphorus recovery ratio is 0.154 kg per person and year (see Fig. 8) flexible, the user is free to be more specific in the definitions of the input
with a standard deviation of 0.099 kg (the uncertainty is relatively high data for technologies, products, or transfer coefficients if more accuracy
due to the single pit). The detailed interpretation of these uncertainties is needed.
is not trivial, as they aggregate different types of uncertainties: (i)
related to local environmental conditions, (ii) specific to the imple 4.4. Implications for practice
mentation of a technology, (iii) related to the technology in general, and
(iv) related to ignorance, particularly of novel technologies and their The main intention of the substance flow model is to provide infor
implementation at scale. However, this interwoven mix of uncertainty mation for the strategic planning in order to enable the prioritisation of
sources is certainly not unique for this model. Once the uncertainties are resource efficient systems at an early planning phase. The approach
quantified, the robustness of each result can be evaluated (e.g. Scholten complements the systematic generation of sanitation system options
et al., 2015). Moreover, we observed overall uncertainties of maximally from Spuhler et al. (2018) by quantifying relevant indicators for
28% (standard deviations for the recovery ratio of TN) in the full-scale resource efficiency and environmental protection in an ex-ante analysis.
application. This accuracy is comparable to other studies using clas The information can be integrated at two levels of a structured
sical ex-post material flow analysis (Keil et al., 2018; Meinzinger et al., decision-making process:
2009; Montangero et al., 2007).
Comparison with other approaches: Existing approaches to eval • The resource recovery and loss potentials can be used at the at the
uate resource recovery from sanitation systems are either based on pre-selection stage if resource recovery or losses are part of the non-
qualitative expert judgement (e.g. McConville et al., 2014) or use ma negotiable decision objectives. A possible example would be to make
terial flow analysis and substance flow modelling (e.g. Espinosa and the low nutrient losses a precondition for appropriateness in the case
Otterpohl, 2014; Montangero and Belevi, 2008; van der Hoek et al., of the presence of highly sensitive surface waters. Another example
2016; Yoshida et al., 2015). The first approach is limited in its trans would be, to make optimised resource recovery as a precondition in
parency (e.g. what is the absolute scale and how do different expert line with SDG 6.
interprets the various score). The second approach requires detailed • The information can also be used together with other sustainability
knowledge about the technology implementation and large amount of indicators during the detailed evaluation of pre-selected options
data and can therefore only be applied post-ante for few options at a using any multi-criteria decision analysis (MCDA) method. It is
time (e.g. (Dahlmann, 2009; Meinzinger et al., 2009; Montangero et al., obvious that additional information, such as costs and value func
2007; Ormandzhieva et al., 2014; Schütze and Alex, 2014; Ushijima tions, would be required in the MCDA for different stakeholders (e.g.
et al., 2012; Woltersdorf et al., 2016; Yiougo et al., 2011). To our phosphorus recovery might not have the same value for a given
knowledge, the here presented approach is the first one which is stakeholder as costs). If MCDA is not the preferred evaluation
applicable for the entire sanitation system option space and ex ante. method, the results could also be fed into life cycle analysis (LCA).
The results could also be used for research. Either one could check
4.3. Limitations the resource recovery ratio of newly developed technologies when in
tegrated into entire systems. Or the full-scale application results could
The approach presented here cannot replace a detailed mass flow serve to identify system characteristics for resource recovery and guide
analysis for existing systems (ex-post analysis). It is intended for auto future technology and system configurations.
mated ex-ante analysis to provide guidance based on the limited It is also important to note, that in principle, our model could be
knowledge for strategic planning. Other limitations are due to a number applied for any substance. We have chosen the substances which are
of simplifications: most relevant to the discourse on sustainable sanitation, water man
agement, and resource recovery. Implementing the model for additional
• How technologies are defined has an impact on the modelling results substances should be straightforward, as the substances already calcu
and should be carefully verified for a specific case. An example is the lated exhibit very different properties.
very generic definition of a single pit, which allows all sorts of input.
As a consequence, this technology dominates the uncertainties and 4.5. Outlook
also in some cases the losses of a system (especially for phosphorus).
However, local experience with specific implementations, which Generic results: The here presented full-scale application is, except
would provide additional data, can decrease the uncertainty and for the appropriateness assessment based on generic information. As a
provide a better estimation of the transfer coefficient. result, the relative resource recovery ratios are independent of the
• Similarly, transfer coefficients are designed to be generic and inflow masses and therefore fully transferrable. Compiling these data
therefore ignore many factors such as size of the technology or into a catalogue would allow to make it available as a low-level planning
ambient temperature. support.
• The third simplification concerns the definition of ‘products’. The Detailed evaluation of the full-scale results: As the full-scale case
model uses a standardized set of products based on (Tilley et al., is representative for many cases, a detailed analysis of the results could
2014). The purpose of which is to define the compatibility of two allow better understanding about how some system characteristics
technologies (Maurer et al., 2012). It might be required to integrate relate to resource recovery. System templates, for instance, proved to be
context-specific information (e.g. quantity and quality of products, insufficient predictors for resource recovery. On the other hand, the
legal requirements) to validate systems from an engineering results showed, that some key technologies, mainly from the functional
perspective (Spuhler et al., 2018). group S (storage) and T (treatment) have a mayor influence on losses.
• Another simplification is the requirement that the sum of all TCs for Moreover, the type of source, the type of sinks, or the length could have
every substance of a Tech is equal one. This boundary condition an effect. We also observed that the combination of different reuse
enables the modelling of steady states but also means that biological pathways (e.g. urine diversion and biofuel production) allows to opti
fixation is ignored. But for many cases this is not very relevant and mise recovery. An interesting next step would be the further analysis of
can therefore be neglected. these results in order to investigate how these characteristics could
14You can also read