IMPROVING THE SECURITY AND QOE IN MOBILE DEVICES THROUGH AN INTELLIGENT AND ADAPTIVE CONTINUOUS AUTHENTICATION SYSTEM - MDPI
←
→
Page content transcription
If your browser does not render page correctly, please read the page content below
sensors
Article
Improving the Security and QoE in Mobile Devices
through an Intelligent and Adaptive Continuous
Authentication System
José María Jorquera Valero 1 , Pedro Miguel Sánchez Sánchez 1 , Lorenzo Fernández Maimó 2 ,
Alberto Huertas Celdrán 3, *, Marcos Arjona Fernández 4 and Sergio De Los Santos Vílchez 4
and Gregorio Martínez Pérez 1
 1   Department of Information and Communications Engineering (DIIC), University of Murcia, 30100 Murcia,
     Spain; josemaria.jorquera@um.es (J.M.J.V.); pedromiguel.sanchez@um.es (P.M.S.S.); gregorio@um.es (G.M.P.)
 2   Department of Computer Engineering (DITEC), University of Murcia, 30100 Murcia, Spain; lfmaimo@um.es
 3   Telecommunications Software & Systems Group, Waterford Institute of Technology, Co.,
     X91 K0EK Waterford, Ireland
 4   Innovation and Labs, ElevenPaths, Cybersecurity Unit of Telefónica Digital España, 29071 Málaga, Spain;
     marcos.arjona@11paths.com (M.A.F.); ssantos@11paths.com (S.D.L.S.V.)
 *   Correspondence: alberto.huertas@um.es; Tel.: +34-868887646

 Received: 30 September 2018; Accepted: 31 October 2018 ; Published: 4 November 2018

 Abstract: Continuous authentication systems for mobile devices focus on identifying users according
 to their behaviour patterns when they interact with mobile devices. Among the benefits provided
 by these systems, we highlight the enhancement of the system security, having permanently
 authenticated the users; and the improvement of the users’ quality of experience, minimising
 the use of authentication credentials. Despite the benefits of these systems, they also have open
 challenges such as the authentication accuracy and the adaptability to new users’ behaviours.
 Continuous authentication systems should manage these challenges without forgetting critical
 aspects of mobile devices such as battery consumption, computational limitations and response
 time. With the goal of improving these previous challenges, the main contribution of this paper is
 the design and implementation of an intelligent and adaptive continuous authentication system for
 mobile devices. The proposed system enables the real-time users’ authentication by considering
 statistical information from applications, sensors and Machine Learning techniques based on anomaly
 detection. Several experiments demonstrated the accuracy, adaptability, and resources consumption
 of our solution. Finally, its utility is validated through the design and implementation of an online
 bank application as proof of concept, which allows users to perform different actions according to
 their authentication level.

 Keywords: cybersecurity; continuous authentication; adaptability; sensors; applications; mobile
 devices; machine learning; anomaly detection

1. Introduction
     Continuous authentication systems for mobile devices aim to identify the owner of the device
permanent and periodically but not only at a given moment, as traditional systems do. This approach
provides several advantages like, for example, the improvement of both the level of security and the
user’s quality of experience (QoE) during the interaction with applications requiring authentication.
The fact of having the user permanently authenticated, and not from time to time, contributes to
providing a higher level of security and confidence compared to traditional methods. Additionally,
continuous authentication systems minimise the use of credentials during authentication processes [1].

Sensors 2018, 18, 3769; doi:10.3390/s18113769                                   www.mdpi.com/journal/sensors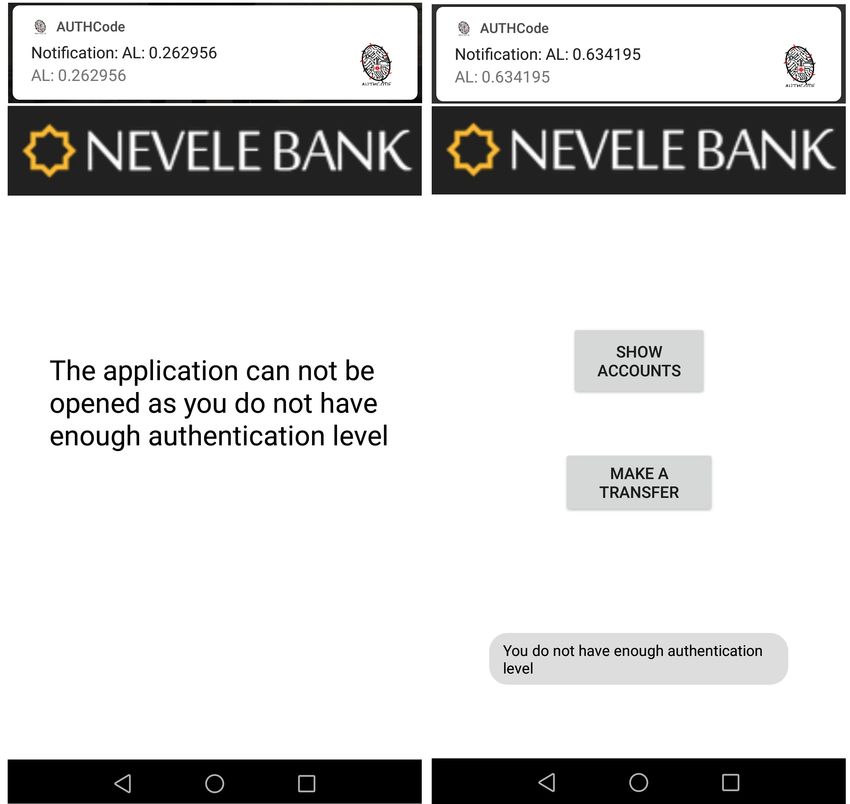
Sensors 2018, 18, 3769                                                                                2 of 29

The previous aspects justify the relevance of continuous authentication systems in the present and
near future due to the amount of heterogeneous contexts with privacy concerns where sensitive or
confidential information should be protected.
      The lifecycle of continuous authentication systems starts by modelling the users’ behaviour when
they interact with their mobile device for a given period of time (usually, some weeks is sufficient).
Once the data is acquired, it is preprocessed and stored in a dataset that contains relevant information
about the users’ behaviour patterns. To generate an accurate dataset with the user’s profile, the
right selection of characteristics or features belonging to different dimensions of the device (sensors,
applications, communications, screen gestures, etc.) is critical. Once the profile has been generated,
the last step consists in the comparison of the current mobile usage with the well-known user’s
behaviour stored in the dataset. This comparison is performed in real time and usually made using
semi-supervised or unsupervised Machine Learning (ML) techniques [2]. At this point, it is important
to highlight the suitability of using ML techniques. The set of different behaviours obtained from
the device while it is operated by the user is assumed to form a manifold embedded in the space of
features [3]. ML techniques try to compute an estimation of this region of the space. According to
that, a new behaviour is considered an anomaly if it is far away from this area. The manifold can be
so complex that it may not be easily represented by other simpler mechanisms as, for example, those
based on rules.
      Despite the relevant benefits provided by current continuous authentication systems, they also
have open challenges that still require more effort and work from a research point of view. Among them,
we highlight the following ones:

•     The selection of dimensions and features allowing for modelling the user’s behaviour in a precise and
      effective fashion. The combination of several dimensions and features of mobile devices is one of
      the critical aspects to obtain a great accuracy during the authentication process. Currently, most
      of the proposals found in the literature only consider features belonging to one dimension [4].
      This fact reduces the accuracy of the authentication system by obviating anomalous behaviours
      detectable through complementary dimensions.
•     The adaptability of the authentication systems to changes in the user’s behaviour. The decision of how
      and when the user’s profile should be updated with new behaviours is critical to reach the desired
      adaptability of continuous authentication systems. Additionally, forgetting old behaviours is
      also an important aspect of an adaptable authentication system. In this context, the majority of
      the existing solutions do not take into account adaptability aspects when they authenticate their
      users [5].
•     Continuous authentication enables a complete set of attack vectors for real-time behaviour spoofing.
      Innovative spoofing techniques embedded at impersonating bots allow real-time human dynamics
      acquisition and simulation, enabling precise behaviour replication on the user side [6]. Integrating
      authentication mechanisms should also involve additional recognition measures to avoid artificial
      actors—for instance, using non-simulable dimensions such as traceable hardware sensors.

     With the goal of improving the previous challenges, the main contribution of this paper is the
design and implementation of an intelligent and adaptive system of continuous authentication for
mobile devices. The proposed solution relies on modelling and creating users’ profiles that contain data
and features related to the usage of the applications and sensors of the device. ML-based techniques
based on anomaly detection [7] are considered by our solution to measure the level of similarity
between the current usage of the device and the well-known usage. Different experiments provided
promising results in terms of accuracy, adaptability and resource consumption of the proposed
solution. Finally, to demonstrate the utility of our intelligent continuous authentication system, we
have designed and implemented an online bank application that allows users to perform different
sensitive actions according to their authentication level.
Sensors 2018, 18, 3769                                                                              3 of 29

     The remainder of the paper is structured as follows. Section 2 discusses some related work from
the academia and industry focused on continuous authentication for mobile devices. Section 3 shows
the design details of the proposed solution. Section 4 shows the different decision to implement
the proposed intelligent and adaptive continuous authentication system. Section 5 depicts different
experiments that support the design decisions and demonstrate the suitability of our solution. Section 6
highlights the improvement of our solution with regard to the existing ones. A use case is shown in
Section 7 to demonstrate the utility of our system. Finally, conclusions and future work are drawn in
Section 8.

2. Continuous Authentication Systems
     This section reviews and analyses, from different perspectives, existing continuous authentication
systems belonging to the academia and industry.

2.1. Continuous Authentication in the Academia
      Among the continuous authentication solutions that we can find in the academia, one of the
most relevant is focused on identifying users through typing patterns and biometric behaviour [8].
Specifically, the authors acquired data such as rotation, vibration, or pressure by considering
touchscreens and sensors of mobile devices. Once the data was collected, they used semi-supervised
learning techniques to classify the profile according to the user’s behaviour. Another relevant article
is presented by Patel et al. in [4]. In this article, the authors performed an interesting analysis
about the different dimensions and ML algorithms that can be used in continuous authentication
systems. The analysed dimensions were facial recognition, gestures, applications and location.
The main conclusion of the authors was that the fact of merging data belonging to different
dimensions allows for obtaining better results in terms of accuracy and error rate. On the other
hand, Ehatisham-ul-Haq et al. in [9] presented a solution based on the use of sensors (accelerometer,
gyroscope, and magnetometer) to identify the users’ interaction with their device. Based on the users’
habits, the authors inferred different positions where the device could be located (pocket, at waist
height, in the upper arm, and on the wrist). In addition, after performing several tests with different
classification algorithms such as k-Nearest Neighbours [10], Bayes Net [11], Decision Tree [12] and
Support Vector Machines (SVM) [13], they concluded that the SVM algorithm is not appropriate for
mobile devices due to its high computational consumption. In contrast, Bayes Net is more appropriate
due to its trade-off between accuracy and consumption. Once the device position is determined,
the system calculates the Euclidean distance between the evaluated instance and the same position
training instances.
      Another interesting work was presented by Fridman et al. in [14]. The authors considered
different features like the text written by the user, location, applications usage, and visited websites.
These features were evaluated separately to later combine the results obtained from the classification
process and determine if the user is authorised or not. A recent work of special interest is proposed
by Centeno et al. in [15]. This article proposed to perform the ML processes in the cloud, reducing
the consumption load in the device and making possible the execution of complex algorithms. In this
sense, they used Autoencoders to authenticate users, which allows a greater precision and resources
consumption by doing the operations on the cloud. Li et al. [16] evaluated the combination of telephone
calls, text messages, and application statistics to recognise users. In addition, the vectors generated on
each of these dimensions included data of the location of the device to provide extra information. This
study was carried out with 76 volunteers and the vectors of each of them were labelled. Finally, the
authors demonstrated that the use of dynamic datasets has a positive impact on the system accuracy.
      It is also worth noting the work done by Li et al. [17], where the authors proposed a system that
applies data augmentation techniques [18], such as scaling, cropping, and jittering, on data obtained
from accelerometer and gyroscope sensors. Data augmentation improves the generalisation capacity of
the system. The ML method selected was One-Class SVM [19] after comparing it to others like Kernel
Sensors 2018, 18, 3769 4 of 29
Ridge Regression (KRR) [20] and k-Nearest Neighbours (kNN). Another interesting solution is the
proposed by de Fuentes et al. [21]. The authors of this work used non-assisted sensors, such as battery,
transmitted data, ambient light and noise to authenticate the user. This study collected information of
50 users over 24 months and then used supervised ML classification algorithms to identify the users.
Specifically, they used k-NN, Adaptive Hoeffding Tree [22] and Naive Bayes [23] algorithms. Finally,
SenGuard [24] is a continuous authentication system that combines movement data, voice, location,
and touches on the screen. The authors of this solution proposed classification algorithms since they
had information belonging to four users.
2.2. Continuous Authentication in the Industry
The industry also is interested in the continuous authentication topic. One of the most relevant
solutions that we can find in the Android and iOS markets is the one provided by BehavioSec
(San Francisco, CA, USA) [25]. Through the use of behavioural biometric techniques, features belonging
to users’ behaviours are acquired and combined to guarantee a good accuracy of detection of anomalous
behaviour. This company offers a software development kit (SDK) for integrating the system in client’s
applications, and this SDK is available for Android, iOS and Web Browser apps. Another interesting
solution is presented by Veridium (Boston, MA, USA) [26]. It provides an SDK, for Android and iOS
devices that allows for integrating biometric authentication in any business application. Heterogeneous
features coming from the camera, sensors, touchscreen, and multiple biometric factors are acquired
and used to perform the authentication process. This solution ciphers the user information and stores
half of the information of features in the server and the other half in the device to improve its security.
The company Aware (Bedford, MA, USA) [27] provides another product to authenticate users
through behavioural and physiological biometric parameters, but not continuously as the previous
ones. This solution makes use of speech, facial, dynamic keys and fingerprint recognition. Its/user
product is named Knomi [28] and performs a biometric authentication through a collection of SDKs
that run on the devices (iOS and Android) and on the cloud. Knomi software enables a distributed
architecture on the cloud or a centralised deployment on the device.
Zighra (Ottawa, ON, Canada) [29] is another company that offers a product based on continuous
authentication. Specifically, Zighra offers a platform of continuous authentication and detection of
threats through the use of Artificial Intelligence for both mobile devices (with iOS and Android) and
web pages [30]. One of its products, SensifyID, combines knowledge of generative behaviour models
and biological systems. Specifically, this solution considers data from location, sensors, networks and
user’s writing techniques. This product is based on task-based authentication techniques. It means
that the user interacting with the device is asked to take specific actions to determine whether he/she
is the legitimate owner.
Despite the results provided by the previous solutions, both in academia and industry there
are open challenges such as the issues of adaptability, the improvement of the accuracy through
the selection of significant features, and the selection of ML algorithms. Furthermore, continuous
authentication systems should store and manage the users’ profiles according to the privacy regulation
established by the General Data Protection Regulation (GDPR) [31].
3. Design of the Adaptive and Continuous Authentication System
This section describes in detail the four phases making up the design of our intelligent and
adaptive continuous authentication system. In this context, the proposed system is based on the
acquisition of sensors and applications usage data to model the behaviour patterns of the device owner.
After examining the acquired data, we considered the use of machine learning techniques focused on
the detection of anomalies. The goal of using these algorithms is to learn the usual behaviour of the
device owner and detect when someone else is using the device. In the proposed solution, we have
also considered the automatic and real-time adaptability to user’s new behaviours, which is a missingSensors 2018, 18, 3769 5 of 29
aspect in the majority of the related works. The previous decisions have been made by considering the
restrictions of mobile devices in terms of battery, computational power and storage.
1. Phase 0: Feature engineering. This is a preliminary and non interactive stage where we make a
first selection of dimensions and features. This initial set is subsequently refined by using feature
selection techniques. It is important to notice that the whole process is done before deploying the
system in the mobile device.
2. Phase 1: Acquisition of behavioural data and dataset generation. This phase consists of
acquiring data from the mobile device and extracting the relevant features selected in phase
0. By doing it, we are able to capture the user’s behaviour and create a dataset. This dataset will
be updated in real time with the new user’s behaviours.
3. Phase 2: Computation of the authentication level. During this stage, an ML algorithm is trained
to fit a model from the user’s behaviour contained in the dataset. Periodically, the new user’s
behaviour is sampled and, then, evaluated by the fitted model which returns an authentication
level score.
4. Phase 3: Automatic adaptability to new behaviours. The last phase focuses on enabling the
system adaptability through the elimination/inclusion of old/new behaviours to the dataset.
A diagram with the different steps composing the design process is depicted in Figure 1. The rest
of the section describes in detail these phases.
1. Identification of relevant
dimensions
Phase 0: Feature engineering
2. Identification of significant
features
3. Acquisition and storage of
valuable data
Phase 1: Acquisition of behavioural
data and dataset generation
4. Dataset creation
5. Anomaly detection training
Periodic evaluation
Phase 2: Computation of the
Correctly authentication level
unlocked
6. Anomaly detection evaluation
Positive evaluation Negative evaluation
7. Insertion of the user's 9. Anomalous behaviour
new behaviour detected
Phase 3: Automatic adaptability to new
x3 Negative behaviours
evaluations
8. Removal of the user's
10. Lock device
old behaviour
Figure 1. Phases and processes of the proposed adaptive and continuous authentication system.
3.1. Phase 0: Feature Engineering
A critical aspect of continuous authentication systems is the selection of the dimensions that provide
relevant information to model users’ behaviour (step 1 of Figure 1). Among the most well-known sources
of information available in mobile devices, the most relevant are the following ones:
• Sensors: the accelerometer, gyroscope, or GPS are examples of sensors available in mobile
devices. These sensors provide relevant information about physical movements, inclination,
or geographical position, respectively.Sensors 2018, 18, 3769 6 of 29
• Gestures and touchscreen interactions: this dimension allows authentication systems to get relevant
data such as the pressure made by users when they touch the screen, the typical gestures, the area
of the screen used, or the speed sliding the fingers on the screen.
• Application statistics: aspects like the number of opened applications, the opening order, the time
of use, or the number of applications running in the background provide relevant information
about the user’s behaviour when he/she uses the mobile device.
• Typing patterns: the typing speed, repetition of words, number of mistypes, or expressions usage
also can be used to identify users.
By considering the previous dimensions, the typing patterns of the user were discarded in this
proposal due to the necessity of using the keyboard. This input method is not extensively used by the
the majority of applications, and besides, when used, it supposes only a small percentage of the total
device usage. In this sense, this dimension just could provide relevant information about the user’s
behaviour a limited number of times [9]. On the other hand, the touchscreen interactions were not
considered because they cause a high impact on the battery consumption [9]. Another drawback of
this dimension is that the touchscreen interactions can be different (or ineffective) depending on the
application type. For example, there are applications that just allow users to do limited actions that do
not provide as relevant information as, for example, pressing a button. In contrast, other applications
allow a rich variety of gestures, hence providing relevant information.
By considering the previous drawbacks, the continuous authentication system proposed in
this article considers the statistics of applications as well as the sensor information as the most
suitable dimensions to create a user’s behaviour profile. The statistics of applications provides useful
information about the user behaviour since they can model patterns such as a common application
opening order or user’s most used apps. These patterns can be used to identify the user and, therefore,
to authenticate him. Moreover, it is proved that this information is commonly used in several
papers and investigations, as shown in Section 2. Some papers that use this solution to classify
behaviour patterns are [14,32]. On the other hand, the sensors dimension is selected because it provides
information about how the user holds the device and moves it in a normal use. In addition, it is widely
used in other state-of-the-art systems (Section 2). Some related papers are [8,9,15,24], where it was
proved that it can model the user behaviour.
The next step was to identify significant features or characteristics belonging to the selected
dimensions (step 2). For that end, we started choosing a sufficiently wide set of features, which,
theoretically, might provide a differentiated modelling of user’s profiles and the subsequent
authentication of the user when he/she uses the mobile device. The first experiment of Section 5
describes both the initial feature set and the process followed to select the most discriminative set,
which was finally used in the Phase 1. The Table 1 lists the final features for each dimension.
Table 1. Final features selected for each category.
Dimension Features
√
Mean value for X, Y, Z and Magnitude (calculated as X 2 + Y 2 + Z2 )
Maximum value for X, Y, Z and Magnitude
Sensors (Gyroscope and Accelerometer) Minimum value for X, Y, Z and Magnitude
Variance value for X, Y, Z and Magnitude
Peak-to-peak value (max-min) for X, Y, Z and Magnitude
Number of apps and number of different apps opened for
the last day and the last minute.
App most times used and number of times used in the last
Application usage statistics minute. The same for the last day.
Last and next-to-last apps used.
Application most frequently used just before the currently
active application.
Bytes sent and received during the last minute.Sensors 2018, 18, 3769 7 of 29
Table 1 shows a new calculated coordinate called Magnitude. This value is used in [9,17] to
minimise the orientation sensitivity of the inertial sensors since X, Y and Z coordinates lectures can
have a negative value depending on the device orientation. Using this value allows the system to have
an always positive value, not sensitive to orientation.
3.2. Phase 1. Acquisition of Behavioural Data and Dataset Generation
Once our system is deployed in the user’s mobile, a preliminary dataset acquisition starts.
This acquisition will last for a configurable number of days (15 days in our experiments). During this time,
we periodically acquire and store the raw data needed to create the user’s behaviour profile (step 3).
The majority of continuous authentication solutions that we can find in the current state of the art
are based on temporal patterns. These solutions need a period of time probably longer than 15 days
in order to identify patterns at different scales to model the global user’s behaviour. Nevertheless,
our approach is based on the user’s statistical digital fingerprint obtained during their interaction
with the mobile device. Moreover, our goal is not to model the global user’s behaviour, but their
local behaviour within a given time window. Therefore, these 15 days are just an initial period of
time needed to have sufficient data to allow the ML algorithm to do the first evaluations adequately.
Additionally, the proposed system is adaptive; that is, it inserts each user’s new behaviour in the
dataset (when the behaviour is considered as belonging to the owner). In this way, we model not
only the user’s behaviour during the first 15 days, but we enrich continuously the dataset. Similarly,
the user’s oldest behaviours are progressively forgotten, thus maintaining an updated window of
features for a configurable period of time.
More information about the set-up of the collection process is provided in Section 4. Once the
relevant data has been stored, we process them through different mathematical operations and we
obtain the list of features shown in Table 1. After that, the features are grouped in vectors forming the
dataset (step 4).
3.3. Phase 2: Computation of the Authentication Level
The main goal of this phase consists of comparing the vectors of the dataset with the current
vector generated by the person that uses the mobile device in that particular moment. After this
comparison, we evaluate their level of similarity and decide if the confidence in the current user is
enough to consider him authenticated or not.
To perform this evaluation, it is critical to choose a suitable technique. In this sense, our solution
makes use of ML techniques based on anomaly detection. The anomaly detection algorithm used
during this phase is based on semi-supervised ML techniques, since all the generated vectors has the
same class (user class). The first time the algorithm is trained, only owner’s samples are used and
these vectors are supposed to be normal. After that, a vector generated in real time cannot be labelled
since the algorithm does not know beforehand if it belongs to the device owner or to a non-authorised
person. The operation of these anomaly detection algorithms is based on the existence of a dataset that
reflects the behaviour of the owner. Thus, the anomaly detection method is responsible for determining
in a non-intrusive way whether a current event (feature vector) fits into the patterns defined by the
available dataset. The process of using these techniques has the following two stages.
• Training. ML algorithms implicitly maintain an internal model. In this stage the model is fitted
with the updated dataset (step 5) in order to improve the accuracy of its predictions. Particularly,
ML techniques applied to anomaly detection usually compute a distance measure from the normal
cluster to the new sample and uses it to decide if it is anomalous or normal. Eventually, the
quality, variety, and quantity of the training data, together with the complexity of the internal
model determine the accuracy of the ML algorithm.
• Evaluation. ML algorithms evaluate the current vector of features extracted from the interaction
between the user and the mobile device. This evaluation is made by means of the model fitted inSensors 2018, 18, 3769 8 of 29
the training phase (step 5), and a distance is returned indicating the degree of similarity between
the current behaviour of the user and those learned by the model (step 6). If the level of similarity
is greater than a given threshold, the current user is deemed to be the owner and the current
vector is included in the dataset (step 7). This inclusion allows our system to ensure its automatic
adaptability. Furthermore, after adding the new vector to the dataset, we perform a maintenance
process to remove another one representing an old behaviour (step 8). In contrast, when the level
of similarity is lower than the given threshold, the current vector is discarded due to an anomalous
behaviour (step 9). If the current user generates three negative evaluations consecutively, the
device will be locked (step 10), so the authentication system avoids possible attacks such as
zero-effort attacks [33]. Section 5 describes in detail how the threshold was determined.
Anomaly detection techniques have been used in the cybersecurity field with excellent results,
for example, to detect anomalous network traffic or to reduce the latency in 5G networks [34,35].
Nowadays, we can find different anomaly detection algorithms such as OneClass-SVM (OC-SVM) [19],
Lineal Outlier Factor (LOF) [36], or Isolation Forest (IF) [37]. However, not all of these algorithms
can be used in devices with computational resource constraints. Table 2 shows a comparison of the
previous algorithms in terms of computational complexity. In these equations, n is the number of
instances in the dataset, nsv is the number of support vector, t, the number of trees, v, the number of
random samples taken from the dataset, k is the number of neighbours, and d is the dimension of the
feature vector. In that sense, IF has the lowest complexity because it can be reduced to O(n). It is due to
the fact that t and v values do not depend on either the number of instances or the size of each instance
(they have been set to 100 and 256 respectively).
Table 2. Computational complexity of IF, OC-SVM, and LOF. The variables are explained in the text.
Computational Complexity
Algorithm Training Evaluation of One Sample
Isolation Forest [37] O(nt · log(v)) O(t · log(v))
One-Class SVM [38] Between O(n2 d) and O(n3 d) O(nsv d)
Local Outlier Factor [36] O (1) O(nd)
In addition to the previous aspects, we have considered two main factors when choosing the
proper anomaly detection algorithm for our system: training execution time and evaluation execution
time. This is due to the fact that energy consumption is a critical issue in mobile devices. The ML
algorithm should consume as few resources as possible because it will be periodically training and
evaluating. Therefore, we have selected IF due to it has the lowest computational resource consumption
among the three ML methods proposed.
3.4. Phase 3: Automatic Adaptability to New Behaviours
Finally, the last phase is aimed at guaranteeing the adaptability of the continuous authentication
system to changes in the user’s behaviour. It is an important point of our proposal, which is missing
in most of the related works. This adaptability process is performed in real time and relies on the
periodical update of the dataset by inserting new behaviours and removing the old ones, whereupon
the ML model is retrained:
• A new user’s behaviour is inserted in the behavioural dataset when the evaluation phase is
positive, that is, the vector received an authentication level score indicating that it belongs to the
owner, or it is an acceptable deviation (step 7). This aspect allows our continuous authentication
system to learn a new user’s behaviour.
• The vectors associated with old behaviours will be progressively discarded as new vectors are
inserted to assign more importance to new user’s behaviours (step 8). This fact allows our solutionSensors 2018, 18, 3769 9 of 29
to ensure the right to be forgotten as well as to avoid an increasing execution time in training and
evaluation due to the size of the dataset.
4. Deployment
This section is devoted to the implementation details of the proposed system. In this context,
we have designed and implemented a mobile application for the Android operating system that
implements our adaptive and continuous authentication system. The acquisition of some important
features, defined in Phase 0, is possible only with Android 5.0 (Application Programming Interface,
API, level 21) or newer. However, this requirement is fulfilled by more than 80% of mobile devices [39].
Figure 2 depicts a diagram of the most relevant classes making up our mobile application. These
classes implement the functionality described in Section 3. The collection services used to acquire the
user’s behaviour and create the dataset (Phase 1), the training and evaluation of the ML algorithm
(Phase 2), as well as the maintenance of the dataset adding and removing new behaviours (Phase3),
are some parts of the diagram that deserve an special mention. For clarity’s sake, we have drawn the
elements of Figure 2 using the same colors as the phases defined by Figure 1).
Phase 1: Acquisition of behavioural data
and dataset generation.
Phase 2: Computation of the
BroadCastReceiver authentication level.
Phase 3: Automatic adaptability to new
behaviours.
BootReceiverImp AlarmManagerImp
BOOT_COMPLETED BootReceiver
start()
AlarmManager
start() launch()
launch()
DeviceAdminReceiver
IntentService
SensorEventListener
onHandleIntent()
onSensorChanged()
Inherits
Inherits
Inherits
DataSensorsIntentService AnomalyDetectionImp DatosAppsIntentService DeviceLocker
Anomaly Detection Imp
DataSensorsIntentService DataAppsIntentService
(IF)
onHandleIntent() buildClassifier() onHandleIntent() lockDevice()
saveFeatureVector() distributionForInstance() saveFeatureVector()
evaluateData() addPositiveEvaluatedVector() evaluateData()
removeOldFeatures()
lockDevice()
saveFeatureVector() saveFeatureVector()
evaluateData() evaluateData()
buildClassifier()
buildClassifier()
Dataset Sensors
addPositiveEvaluatedVector() addPositiveEvaluatedVector() Dataset AppStats
removeOldFeatures() removeOldFeatures()
lockDevice()
Figure 2. Diagram of the most important classes and processes of the system.
With the goal of carrying out the acquisition of relevant data from sensors and applications (the
step 3 of Phase 1), we have implemented the following classes and methods. Each class is tagged
with the value (A) when it belongs to the Android libraries, and the value (O) when it is one of our
implemented classes:
• BootReceiverImp (O). This class is the starting point. It inherits from BroadcastReceiver [39], which
belongs to the Android library. BootReceiverImp receives an event when the mobile device is
turned on and configures the alarms needed to execute the functionality of our mobile application,
even when the application is not running.Sensors 2018, 18, 3769 10 of 29
• AlarmManagerImp (O). Its functionality focuses on reducing the consumption of battery by
executing the services periodically and not continuously. The launch() method is in charge
of scheduling periodically the data collection services using the setExact() method from
AlarmManager class [39].
• IntentService (A). This class allows the execution in background of the needed operations to obtain
the data from which the features will be computed.
• DataAppIntentService (O). This class utilises the Android.app.usage class [39] to gather data about
the applications usage. The onHandleIntent() method is responsible for the periodical collection
of the application data and the calculation of the related features. Every 60 s, if the device is
unlocked, this method gathers the list of applications used in that minute, ordered by the moment
in which each app was put in foreground; the opening sequence; and the time of use of each
application since there are statistics. After that, it carries out different operations to obtain and
calculate the application features enumerated in Table 1.
• DataSensorsIntentService (O). This class obtains data coming from the device sensors. It implements
the Android.hardware.SensorEventListener interface, which is used to receive notifications from a
variety of sensors. The onHandleIntent() method periodically acquires data coming from different
sensors. Specifically, every 20 s, if the device is unlocked, this method reads the X, Y and Z
sensors (accelerometer and gyroscope) values for 5 s. Then, a moving average with a window of
three samples is applied to these values, having an effect similar to a low-pass filter and, hence,
reducing the measurement error. These filtered values are then aggregated into the sensor features
show by Table 1.
After obtaining periodically the features, the next step is to generate the dataset that models the
user’s behaviour. In this context, the DataSensorsIntentService and DataAppIntentService classes
have a common method, saveFeatureVector(), in charge of saving periodically the features in two
different datasets. One for the sensors’ features, and another one for the applications. In this point,
it is important to clarify that the datasets are generated after monitoring the user’s behaviour for 15
days. This period of time has been defined after performing several experiments with different time
duration, concluding that it is an acceptable time to obtain accurate authentication results.
Once the dataset has been created, Phase 2 starts (step 5 of Figure 1). In this phase, we used the
implementation of IF provided by the Weka library [40]. Our mobile application implements the
AnomalyDetectionImp class, which uses some of the methods provided by the Weka library to train and
evaluate IF; specifically, the buildClassifier() and distributionForInstance() methods, respectively.
Regarding the training phase, we use the buildClassifier() method to build two IF: one for detecting
anomalies in the sensor dataset, and another for detecting anomalies in the application dataset.
The configuration parameters set for the IF training are shown in Table 3.
Table 3. Configuration parameters to train the Isolation Forest algorithm.
Method Frequency Parameters Return
After phase 1 Dataset (15 days),
buildClassifier() Every positive evaluation Number of decision trees (100), Nothing 1
Sample size (256)
1 Although BuildClassifier() does not return anything, this method is responsible for generating decision trees
that later will be used during the evaluation phase.
The first training of our models is performed after finishing the Phase 1 (15 days) with the
aforementioned dataset containing feature collection. Each of them uses one different dataset: sensor
dataset and application dataset. From that particular moment, in this proof of concept, the IF algorithms
are trained separately every positive evaluation, but it can be configured according to the requirements
of the scenario.Sensors 2018, 18, 3769 11 of 29
On the other hand, the evaluation of the new two feature vectors (sensors and apps) are also
carried out separately and every 60 s, which coincides with the acquisition frequency of feature vectors.
However, it could be different, and we could reduce the frequency for energy consumption restrictions.
To reach that goal, the AnomalyDetectionImp class executes the distributionForInstance() method for both
IF algorithms, receiving as parameters the corresponding vector to be evaluated. As a result, we obtain
the scores of the two current vectors of features (sensors and applications), that is, a number between 0
and 1 (where 0 means highly anomalous and 1 completely normal). The configuration parameters,
considered to evaluate the IF algorithm, are shown in Table 4.
Table 4. Configuration parameters to evaluate the Isolation Forest algorithm.
Method Frequency Parameters Return
distributionForInstance() Each 60 s Current features vector Double (0.0–1.0)
Once evaluations for sensors and applications are performed, the scores should be normalised
before combining them to get a unique and final score. This score will represent the authentication
level of the user interacting with the device in that particular moment. In this sense, a min-max
normalisation is required because each evaluation is computed by a different IF algorithms, resulting
in output values belonging to different ranges of the interval [0, 1]. The normalisation expression can
be found in Equation (1), where NS is the normalised score, x is the current evaluated vector value,
and max, min are the maximum an minimum values obtained during the evaluation of the dataset:
( x − min)
NS = . (1)
(max − min)
After normalising the two evaluations, Equation (2) shows the next step, which consists in
combining and calculating the final authentication level score:
Lss + Pss
AL = Las · Wa + · (1 − Wa). (2)
2
In the previous equation, AL is the Authentication Level score [0, 1] calculated by our solution to
indicate how similar the behaviour of the current user is compared to the owner. Las is the classification
score of the last application vector (normalised), Lss is the classification score of the last sensor vector
(normalised), and Pss is the classification score of the penultimate sensor vector (normalised). Wa is a
constant parameter that indicates the weight or importance of the last application vector in the final
result. In this case, Las has the value of 0.5 because we assumed that sensor and application dimensions
have the same relevance to determine whether the behaviour of the current user belongs to the owner
of the device. As previously, this parameter can be modified according to the scenario characteristics.
If the AL score is higher than a given threshold, which has been previously defined by us
(explained in the Section 5.1.5), the user is positively authenticated by the proposed system. In this
case, the AnomalyDetectionImpIF class has two different methods in charge of providing adaptability
to new user’s behaviours in real time. On the one hand, the addPossitiveEvaluatedVector() method
inserts the new vectors of features in both datasets (sensors and applications). On the other hand, the
removedOldFeatures() method removes old vectors of features stored in both datasets. However, if the
AL score is lower than the threshold, the user is not authenticated and the datasets are not updated.
Furthermore, if the AL is not over the threshold after three consecutive evaluations, the lockDevice()
method will be called, which uses DeviceLocker class to lock the device screen. This class inherits from
Android.app.admin.DeviceAdminReceiver [39] and uses the Android.app.admin.DevicePolicyManager [39]
class functionality to lock the device. As said in Section 3, this action is performed to prevent a
zero-effort attack.Sensors 2018, 18, 3769 12 of 29
5. Experiments
This section shows different experiments carried out to validate the viability of our intelligent and
adaptive continuous authentication system. Specifically, to design and implement our system, we have
performed a pool of experiments related to the accuracy of the system, its adaptability to changes in
the user’s behaviour, its resiliency against adversarial attacks, and its resource consumption in terms
of energy, storage, and time.
5.1. First Experiment: Feature Engineering and Anomaly Detection Performance
This first experiment is part of the aforementioned Phase 0 and it focuses on the selection of
relevant features, as well as the determination of the threshold used to distinguish between anomalous
and normal behaviours. To reach those goals, the experiment has been carried out by using the
preliminary dataset obtained in stage 0. Its aim is to extract the most discriminative features from the
initial feature set (listed in Table 5), train two IF algorithms with each set of features and test whether
the selected set has a better classification performance by means of precision vs. recall AUC (Area
Under Curve) measure. After that, a suitable threshold to separate normal from anomalous samples
was determined for the winner model in order to obtain an estimation of the classification performance
reached. Finally, the suitability of the previous threshold has been validated with 50 different users.
5.1.1. Data Collection
Table 5 lists the set of features used to obtain our initial dataset from two different users: UserA (the
owner) and UserB (an unknown person). To perform this experiment, the owner of the mobile device,
UserA, trained our authentication system for 15 days. Once this process was finished, we created one
dataset with all the application usage features, and another with all the sensor features. In the case of
the application usage dimension, vectors were generated every 60 s when the device was not locked.
As a result, once the training was completed, the owner had generated 8700 vectors (780 KB). In the
case of sensor dimension, vectors were acquired every 20 s when the device was not locked. The total
number of vectors generated by this dimension is 13,800 (4 MB). Both datasets were labelled as normal.
After that, a new user, UserB, started using the UserA’s mobile device. The user data was collected for
five days, generating two new datasets labelled as anomaly.
Table 5. List of initial features.
Dimensions Features
√
Mean value for X, Y, Z and Magnitude (calculated as X 2 + Y 2 + Z2 ).
Sensors (Gyroscope, Maximum value for X, Y, Z and Magnitude.
Accelerometer and Magnetometer) Variance value for X, Y, Z and Magnitude.
Minimum value for X, Y, Z and Magnitude.
Peak-to-peak (max-min) value for X, Y, Z and Magnitude.
Number of apps and number of different apps, open since the system
has information. The same for the last day and the last minute.
Apps most frequently used, average use time, and number of
Application usage statistics times used in the last minute. The same for the last day.
Last and next-to-last apps used, number of times and average use time.
Application most frequently used just before the currently
active application and number of uses.
Bytes sent and received during the last minute.
5.1.2. Feature Selection
Since dimensionality reduction usually provides an improvement in the detection of
anomalies [41,42], a selection of the most relevant features was performed. First, after carrying out a
variety of tests and analysing their results, we concluded that the data acquired from the magnetometer
sensor were erratic, since the values depend on the geographical orientation of the device. After that,Sensors 2018, 18, 3769 13 of 29
we decided to do feature selection by using a random forest in order to obtain a subset of the features
with the most discriminating properties.
For this procedure, an auxiliary labelled and balanced dataset was created by combining both
application and sensor information from UserA and UserB. The new vectors were created concatenating
every vector from the sensor dataset with the corresponding application vector closest in time.
The resulting dataset was then labelled accordingly (UserA’s samples as normal and UserB’s as
anomaly), and the random forest was trained.
One interesting property of random forest is that, after training, it provides an estimation of the
discriminating power of each feature during the classification process. These values represent the
relative weight or importance of each feature in the decision [43]. These coefficients were used to select
a subset of features that covered 95% of the total relative weight. The selected subset was already
presented in Table 1, whereas the initial feature set can be found in Table 5.
5.1.3. Application and Sensor Datasets’ Aggregation
Once we have the two sets of characteristics, the next step is to combine the relevant features of
each dimension to evaluate the user’s behaviour and detect anomalous patterns using the IF algorithm.
Only one IF would be necessary for anomaly detection. However, we realised that the
performance was improved if a specialised IF was trained with each dataset (applications and sensors).
After training, a sample is then classified by obtaining the anomaly score from each IF, averaging the
two scores, and using this result together with a decision threshold to predict whether the sample is
normal or anomalous.
The output of our model had to combine the outputs of the two aforementioned IFs, but each
output had a different range. To make them compatible, the scores from each IF in the training stage
were normalised to the range [0, 1]. Then, they were averaged to obtain a single value of anomaly
estimation. This procedure was done twice: once with the initial set of features and the other one with
the set selected by means of the random forest. As a result, we obtained two models to be compared in
order to decide which had a better performance.
5.1.4. Performance Comparison for Feature Set Selection
In order to determine whether the new feature set had a better performance than the initial set, we
needed to obtain a measure of the performance for every threshold. In our case (an anomaly detection
context), the dataset is highly unbalanced, making the accuracy meaningless. In this case, a more
suitable estimator is the precision vs. recall AUC. The next equations define a classification algorithm,
the concepts of precision (3), recall or TPR (True Positive Rate) (4), and F1-score (5), which combines
precision and recall in a single value for comparison purposes:
True Positives
Precision = , (3)
(True Positives + False Positives)
True Positives
Recall or TPR = , (4)
(True Positives + False Negatives)
2 × Precision × Recall
F1-score = . (5)
Precision + Recall
In other words, the precision tells us how good our classifier is detecting real anomalies, that is,
the higher the precision, the lower the false alarm percentage; recall indicates how good it is recognising
all the real anomalies, that is, the higher the recall, the fewer anomalies remain undetected; finally,
F1-Score is the harmonic average of precision and recall. F1-score allows for summarising in one value
both precision and recall, making the comparison of results easier.
Figure 3 plots both precision vs. recall curves and shows that the selected feature set has a greater
AUC. It can also seen that it has better classification performance for every threshold since filteredSensors 2018, 18, 3769 14 of 29
features line (blue) is always over the unfiltered features line (green); therefore, the set of selected
features was chosen for the next step.
1
AUC=0.8435
0.8
AUC=0.5978
0.6
Recall
0.4
Filtered features
0.2
Unfiltered features
0
0.2 0.4 0.6 0.8 1
Precision
Figure 3. Area under the curve (AUC) of our model trained with both the initial and selected set
of features.
5.1.5. Determination of the Optimal Threshold
In our anomaly detection context, a sample is considered normal if its classification score is over
a given threshold; otherwise it is considered anomalous. In order to reach an optimal classification
performance, we need to determine the optimal threshold. Figure 4 depicts three curves: precision,
recall and F1-score vs. threshold. The figure shows how, when the threshold is very low (less than
0.30), the precision is 1 (every normal known behaviour is evaluated as normal) and recall is 0 (every
anomalous known behaviour is evaluated as normal). In the same way, when threshold is too high
(more than 0.93), the precision value is 0.50 and recall is 1 because every behaviour evaluated will
be taken as anomalous, even the known normal ones. Thereby, threshold should be established at
an intermediate value that provides the best performance. Here, the chosen threshold will depend
strongly on our requirements. A common selection criterion is the maximum F1-score (0.84 in this
case, corresponding to a precision of 0.77 and a recall of 0.92), resulting in a threshold of 0.728. In our
case, we preferred this last threshold because the highest F1-score guarantees a good balance between
precision and recall, without prioritising any of them.
1
0.8
0.6
Value
0.4
Precision
0.2 Recall
F1 Score
0
0 0.2 0.4 0.6 0.8
Threshold
Figure 4. Recall, precision and F1-score vs. threshold when our model is trained with only the selected
features from UserA’s dataset, and evaluated on users A and B.Sensors 2018, 18, 3769 15 of 29
5.1.6. Anomaly Detection Results
Once the threshold was selected, our system was tested with UserA and UserB. Table 6 shows the
confusion matrix with the classification results of a test set with 200 new samples (100 normal samples
from UserA and 100 anomalous from UserB) together with the precision and recall.
Table 6. UserA (normal) vs. UserB (anomalous) confusion matrix.
UserB Vectors UserA Vectors Precision/Recall Score
Predicted as anomaly TP: 92 FP: 27 Precision 77%
Predicted as normal FN: 8 TN: 73 Recall 92%
In addition, we performed some additional tests to validate the model and demonstrate that our
continuous authentication system could accurately classify as anomalous the behaviour of users others
than UserB. In this sense, fifty new users, who had not used the device during the training phase,
started using our solution. The TPR measurements obtained after evaluating 100 samples from each
new user (anomalous behaviour) are shown in Figure 5.
1
0.9
0.8
0.7
True Positive Rate
0.6
0.5
0.4
True Positive Rate
0.3
0.2
0.1
0
5 10 15 20 25 30 35 40 45 50
User
Figure 5. True positive rate for the 50 evaluated anomalous users.
Figure 5 shows how TPR measurements of the fifty users range from 48% to 98%. This variability
indicates that, depending on the users’ behaviour, the proposed system recognises the anomaly more
or less accurately. By analysing the results, we realised that the users interacting with the mobile device
lying on a table obtained a lower TPR. This is motivated by the fact that the owner sometimes operated
the device on a table, resulting in almost constant sensor measurements and, hence, evaluations with a
higher AL score. Additionally, it is important to notice that the mean TPR of all evaluations is 82%,
which is aligned to the results shown in Table 6, where the TPR is 92% and the True Negative Rate
(TNR = TN/(TN + FP)), associated with the performance of the device owner, is 73%.
In conclusion, the proposed solution is able to distinguish the normal user’s behaviour (UserA)
among another 50 anomalous users with satisfactory performance. Regarding the recall value, it is
92% and the precision is 77%.
5.2. Second Experiment: Adaptability to New Behaviours
This experiment demonstrates how the proposed system is able to adapt itself to changes in the
user’s behaviour in real-time. For that end, our model is based on the combination of two IF algorithms
(sensors and applications) trained with selected features stored in the sensor and application datasets,
respectively. The output of our model is called AL (Authentication Level) and its expression can beSensors 2018, 18, 3769 16 of 29
found in Equation (2). In order to make our system adaptive, we propose the partition of the AL score
in four segments, meaning respectively: certainly anomalous, possibly anomalous, possibly normal
and certainly normal. To determine the range of values of each segment, we based our decision on
the precision of the model obtained in the first experiment. Once the four ranges are established,
our system uses them to decide when and how to adapt to a change in the user’s behaviour. Every 60 s,
our system uses the ML model to generate a new AL score from the application and sensor information,
summarising the behaviour of the user during that period of time. The actions that our system takes to
adapt itself depend on the score segment to which the value belongs. When new vectors are added,
the oldest vectors will be discarded; therefore, the dataset will always contain a fresh set of user’s
behaviours. The rest of the section describes in detail this experiment.
5.2.1. Certainty Classes
Our first step was to define the four score segments. To this end and using the behaviour dataset
collected from UserA and UserB, the classification precision that our model gives for each label
(“normal” and “anomaly”) was computed for each possible threshold. Figure 6 plots the two precision
curves obtained.
1
0.8
0.6
Value
0.4
0.2 Anomaly precision
Normal precision
0
0 0.2 0.4 0.6 0.8
Threshold
Figure 6. Precision curves on both normal and anomalous behaviours.
The curves of Figure 6 show the collected behaviour vectors evaluated by the model, obtaining an
AL score, which was used to classify them with respect to a given threshold. If the AL value is lower
than the threshold, the vector is classified as anomalous; otherwise, the vector is considered normal.
The precision curve of the “normal” label in Figure 6 shows that every vector with an AL score above
0.78 is correctly classified as normal. Similarly, the precision curve of the anomaly label shows that
every vector with an AL score below 0.35 is correctly classified as anomalous. Additionally, there is
a value where both curves cross, that is, 0.67. Below this value, the number of samples classified as
anomalous exceeds the number of samples classified as normal, and above this value the opposite is
true. Table 7 shows the different certainty classes established.
Table 7. Certainty classes defined for the threshold values.
Threshold Possible User Behaviour
[0.0, 0.35) Certainly anomalous
[0.35, 0.67) Possibly anomalous
[0.67, 0.78) Possibly normal
[0.78, 1.0) Certainly normalYou can also read