World Economic Forum In collaboration with Accenture - Shaping the Future of Energy and Materials System Value Framework - Brazil Market Analysis ...
←
→
Page content transcription
If your browser does not render page correctly, please read the page content below
World Economic Forum
In collaboration with Accenture

Shaping the Future of Energy and Materials
System Value Framework – Brazil Market Analysis
October 2020
Contents

       1   Brazil executive summary             2

       2   Brazil electricity market overview   7

       3   COVID-19 recovery solutions          18

       4   System Value dimensions              24
System Value of the clean energy transition in Brazil
The System Value framework more holistically evaluates economic, environmental, social and technical outcomes of potential energy solutions across
markets. The framework aims to shift political and commercial focus beyond cost to include value.
Economic, environmental, societal
Using the System Value and energy value
framework, the World Economic
Forum, supported by Accenture,
conducted analysis across several
geographies as part of market
evaluations that examined Air Quality and Foreign Direct
Health Investment
recovery opportunities to Impacts to human health and Market attractiveness for FDI with
natural environment reliable energy and skilled
accelerate economic growth and from air and water resources
pollutants, land use Energy Productivity
the clean energy transition. Jobs and Flexibility
and Systemic Efficiency Ability to manage generation, demand
Economic Impact Energy efficiency plus systemic efficiency and power flows (incl. power quality)
Influx of jobs due to
Key system value dimensions for energy transition and renewables
(optimization of interactions among energy
value chain elements) to
across the grid,
enabled by digitalization
maximize energy and storage
Brazil have been prioritized across productivity
Cost and Investment
the framework based on current CO2 Access to Electricity Reliability and Competitiveness
Emissions Physical and economic access to Service Quality Market attractiveness and policy
market dynamics and its relative CO2 emissions based on energy
clean electricity to support
individual or society development
Life cycle approach to ensuring certainty to businesses and
source, generation mix and load high system availability; improved policymakers for investment
maturity of transition towards net- changes customer service including R&D and levelized
cost of energy
zero integrated energy system. Water Resiliency and System Upgrade
Security Technology (incl. digital) and capital
Footprint investments in T&D (incl.
Water footprint based on energy Uninterrupted and diversified energy
interconnections) to upgrade
source, generation mix and load supply at affordable prices and the
the system for variable
changes ability to
renewables and distributed energy
bounce back from
resources (DER)
disruptions
Priority outcomes for Brazil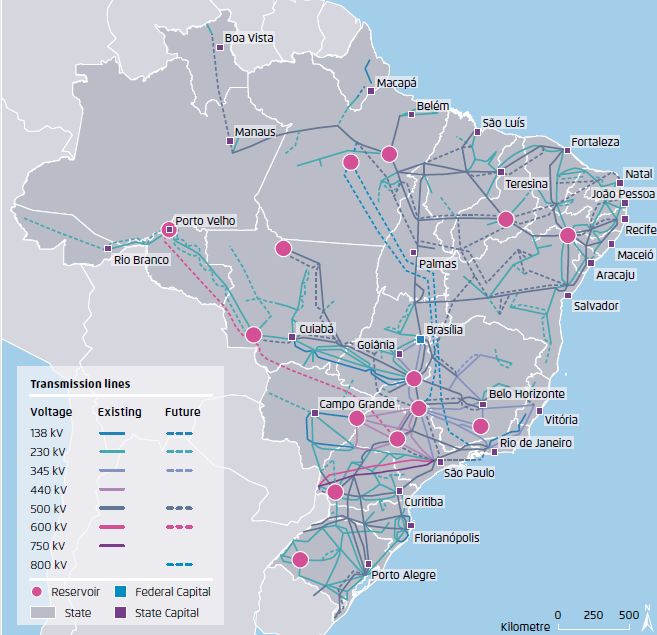
Brazil recovery solutions
Solutions to deliver power sector modernization
Non-Hydro Renewables Expansion
Accelerate non-hydro renewables expansion (~7 GW wind and solar) through
                                                                                                  34 Mt                                     >132k                                     $2.8bn
multiple initiatives such as fostering the liberalized market (ACL) with innovative         Less CO2 emissions from                       Direct and indirect                     Human health benefits
                                                                                             electricity generation                       jobs created from                          from air quality
power purchase agreements (PPAs), developing a new structured solution for the                    through 2025                              wind and solar                        improvements through
                                                                                                                                            through 2025                                  2025
Energy Reallocation Mechanism (MRE), and fossil thermo-plant substitution.
                                                                                         Note: Above CO2 and human health benefit figures represent cumulative, incremental
                                                                                         savings in addition to 2025 base case projections.

Digitalization of Transmission and Distribution (T&D)
Address reliability and power quality issues through foundational distribution network            14 Mt                                 Up to 29k                                        $1bn
investments, then digitize and modernize Brazil’s grid through smart grids, smart           Less CO2 emissions from
                                                                                             electricity generation
                                                                                                                                      Potential jobs created by
                                                                                                                                         grid digitalization
                                                                                                                                                                                  Human health benefits
                                                                                                                                                                                     from air quality
meters, internet of things (IoT) and distributed energy resources (DER).                          through 2025                               initiatives                          improvements through
                                                                                                                                                                                          2025

                                                                                         Note: Above CO2 and human health benefit figures represent cumulative, incremental savings in addition to 2025 base case
                                                                                         projections. Estimated job potential based on US figures, adjusted for population.

Smart and Efficient Cities
Invest in smart cities via development of a digital energy network, enabling energy
efficiency and new business models to support distributed generation, DERs and                    45 Mt                                         1m                                    $3.4bn
                                                                                            Less CO2 emissions from                  Potential jobs across smart                  Human health benefits
electric mobility, as well as public services such as public lighting and vegetation         electricity generation
                                                                                                  through 2025
                                                                                                                                              buildings,
                                                                                                                                        appliances, efficient
                                                                                                                                                                                     from air quality
                                                                                                                                                                                  improvements through
management.                                                                                                                                    lighting                                   2025
                                                                                         Note: Above CO2 and human health benefit figures represent cumulative, incremental savings in addition to 2025 base case
                                                                                         projections. Estimated job potential based on US figures, adjusted for population.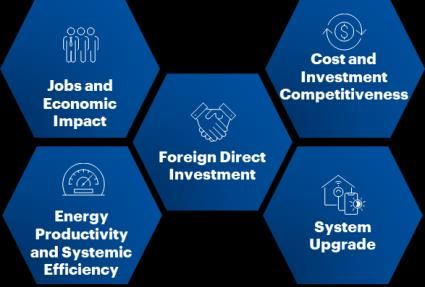
Brazil’s path to maximize System Value
               Markets are moving from addressing                            …through “pivot points” where generation mix hits 20-30% annual                                  … acceleration to a net-zero integrated
              core elements of the electricity sector                                   variable renewables (>50% instantaneous)                                              energy system with a strong focus on
                           transition…                                                   and transformational elements enable…                                                          systemic efficiency

                                                                                                                                                                            Brazil is advancing core transition elements
                                                                                                                                                                            towards a pivot point.
                                                                                                                  Net-zero integrated
                                                                  Transformational                                  energy system                                           Recovery solutions deliver against core
                                                                      elements
                                                                                                                                                                            transition elements and push forward past
                                     Core
                                   elements                                                                                                                                 the pivot point towards elements of an
                                                                                                                                                                            integrated energy system.
                                                                     Power market reform                     End use electrification
                                                                                                       (e.g. transport, heating, cooling)
                                                                                                                                                                            Brazil’s large hydropower resources can be
                  Renewables                                                                     Increasing digitalization, stakeholder collaboration                       leveraged to maximize System Value
                                                     Efficiency
                   expansion                                                                          and systemic efficiency across solutions                              outcomes throughout the transition.

                                                                                                         Demand
                                                                                                       optimization                          Beyond electrification (e.g.
                                 Grid upgrades and                                                                                                  hydrogen,
                                  interconnection                     Smart flexibility solutions                                                 co2 solutions)
                                                                  (e.g. storage, balancing services)

Note: Icons represent solution types which deliver
System Value outcomes. Flag indicates market
progression along the path.
Analysis purpose and overview
The World Economic Forum, supported by Accenture, has developed the System Value
framework to move beyond cost to a more holistic evaluation of energy sector
opportunities across economic, environmental, societal and energy system value
dimensions.

Brazil’s electricity market was one of several markets chosen to demonstrate how the
System Value framework can be used to evaluate opportunities that accelerate economic
recovery and a clean energy transition.

The following analysis of Brazil’s electricity market aims to answer several key questions for energy
industry leaders and can be leveraged to consider opportunities to pursue and prepare for
conversations with a range of stakeholders.

•   What is the state of COVID-related stimulus and recovery activity for Brazil?
•   What short-term growth opportunities exist that can spur economic recovery and accelerate the
    clean energy transition?
•   How can stakeholders move beyond a cost-centric dialogue to consider the value of outcomes to
    the economy, environment, society and energy system?

                                                                                                        6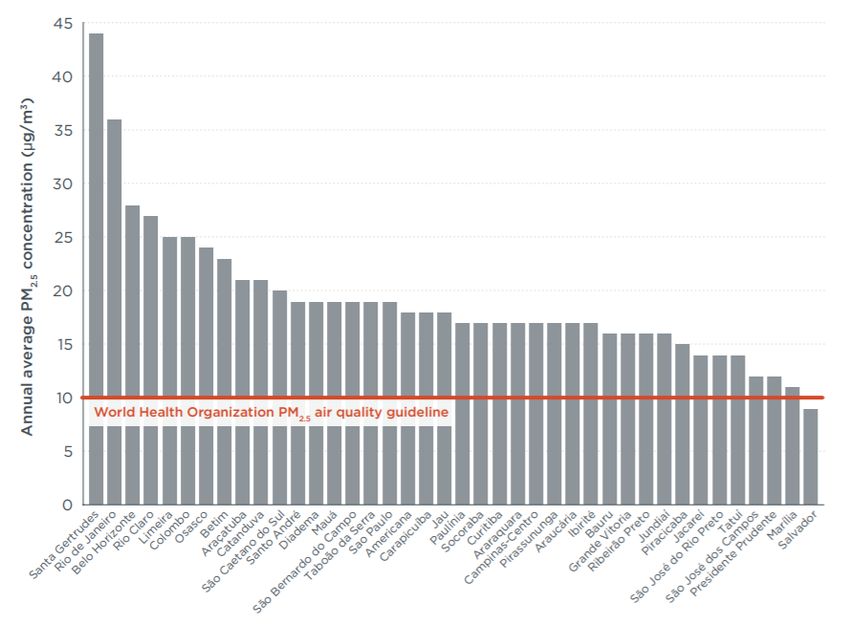
Contents

       1   Brazil executive summary             2

       2   Brazil electricity market overview   7

       3   COVID-19 recovery solutions          18

       4   System Value dimensions              24
Energy transition trends shaping Brazil’s electricity industry
• Demand growth: According to Brazil’s Energy Research Office (EPE), annual electricity demand in Brazil is set to triple by 2050 to 1,605 TWh.
Increasing electrification • Access to electricity: Although Brazil has achieved almost universal access to electricity, quality of supply measured by frequency and duration of
outages still lags behind developed countries.
• Non-hydro renewable goals: Targets of 27 GW of onshore wind and 9 GW of utility-scale solar targeted by 2030.
Growth of green • Increasing distributed energy generation: Expected to grow fromDigitalization underpins the energy transition
Routine tasks executed without Mobility solutions extending to
human intervention (e.g. customers and field workers
substation inspections) AUTOMATION MOBILITY
Integration of
Physical activities conducted
operations and
by machines
information
technologies across IT/OT Digital is an enabler for all ROBOTICS
networks energy transition trends
Cloud platforms Cognitive analytics and big
providing new ways of data applications (e.g.
delivering energy generation and demand
PLATFORMS ANALYTICS
services forecasting)
Protection for the Premium collaboration and
connected ecosystem multidisciplinary decision-making
SECURITY SOCIALCOVID-19 impacts to energy transition trends in Brazil
• Electricity demand drops: Electricity demand falls 12% and 10% in April and May 2020, respectively.
Increasing electrification • Low oil prices hurt EV adoption: Cost competitiveness of electric vehicles weakened by steep decline in oil prices.
• Government turns to green finance: Support for a green bond program will help channel funding towards solar PV (8 GW), wind (25 GW), small hydro
Growth of green installation (3 GW) and energy-from-waste facilities.
technology • Calls for recovery through solar: Brazil witnessed a 53% surge in solar generation in April 2020. Solar association ABSOLAR and manufacturers urge
for the sector to become a key pillar for pandemic recovery, proposing low-income tariff scheme.
• Distribution companies receive bailout: Brazil's energy sector regulator, ANEEL, approved a $3.1 billion bailout package for power distribution
companies suffering from drop in demand and high consumer delinquency rates.
Network of the future • Auctions postponed: Scheduled for May 2020, auctions for both generation and transmission capacities have been indefinitely delayed by the
Ministry of Mines and Energy.
Digitalization
Enterprise customer • Delay of privatization: Having already faced multiple delays, the Brazilian government has pushed back the privatization of state-owned utility
Eletrobras until 2021 in order to focus its efforts on handling the COVID-19 pandemic.
goals • Cost-cutting focus: Brazilian companies take measures to cut costs and protect their bottom lines.
• Community organizations take lead: Community groups, health workers, local officials and private donors have set up campaigns, developed
Consumer activism response measures and set up quarantine centres to combat the virus.
• Company finance focus: As a result of COVID-19, greater focus on company financial health and improving operational efficiencies than additional
capital expenditures.
Investor activism • ESG investors: Investment funds managing close to $4 trillion in assets called on Brazil to halt deforestation of the Amazon in an open letter warning
that biodiversity loss and carbon emissions pose a systemic risk to their portfolios.
• Air quality improves: During the partial lockdown, São Paulo saw drastic reductions in NO (~77%), NO2 (54%) and CO (~65%) concentrations,
compared to pre-lockdown levels and five-year monthly average.
Cities in transition • Irregular access to water: Inconsistent water access, particularly in cities such as Rio de Janeiro, threatens efforts to contain the pandemic and
heighten risks for favela residents.
• R&D expenditures likely to fall: Balance sheet difficulties could curtail corporate R&D efforts in sectors such as automotive.
Investment in clean
• COVID impact on ethanol competitiveness: Lower gasoline prices reduced the price competitiveness of ethanol, where hydrous ethanol experienced
energy technology a 40% drop in price from February to April 2020.
Sources: Accenture analysis; Economic Times; Globo; Latin Finance; PV Magazine; T&D World; MercoPress; PV Tech (1, 2, 3); Science of the Total Environment; RioOnWatch; Independent; The New Humanitarian; Dialogo ChinoOverview of Brazil’s electricity market
Brazil electricity generation projected to increase 6% by 2025
• As per the New Industry Law, electricity sector was
unbundled, i.e. separation of generation, TWh
+6%
700
transmission, distribution
Structural Biomass
components of • Eletrobras, directly and via subsidiaries, is the largest 600 27 33 Solar
7 11 17 21
entity, owning 31% of generation and 48% of 1 4 6
49 63
Brazil’s market 500 033 32 41 48 82 87 96 104 Wind
transmission
Installed capacity in Brazil is ~172 GW with 63% share 400
from conventional hydropower
300
Hydropower
• Electricity demand is expected to grow modestly by 1% 200
Nuclear
annually until 2025 to 654 TWh 100 Coal
Growing demand • Demand growth expected to triple to 1,605 TWh by 2050 Natural gas
• While the generation share of hydro is expected to 0
and diversifying 2016 2017 2018 2019 2020 2021 2022 2023 2024 2025
generation maintain its dominance, the share of solar and wind is
expected to double by 2025 Share of wind and solar generation projected to double by 2025
100%
Biomass
0% 0%
• Renewable energy targets 90% 6% 6% 1%
7%
1% 1% 2% 3% 3% 4% 5% Solar
8% 8% 10%
80% 13%
• 27 GW wind deployed by 2026 14% 15% 16% Wind
(15 GW as of end of 2019) 70%
• 9 GW utility-scale solar deployed by 2026 (3.7 60%
Climate and GW as of end 2019) 50% 69% 69%
69% 69% 67%
renewable energy 66%
65%
• 23% share of non-hydro renewables in energy 40% 64% 64% 63% Hydropower
goals
mix by 2030 30%
Nuclear
• CO2 emission goal 20%
Coal
• Economy-wide reduction in CO2 emissions of 10% Natural gas
37% by 2025 0%
2016 2017 2018 2019 2020 2021 2022 2023 2024 2025
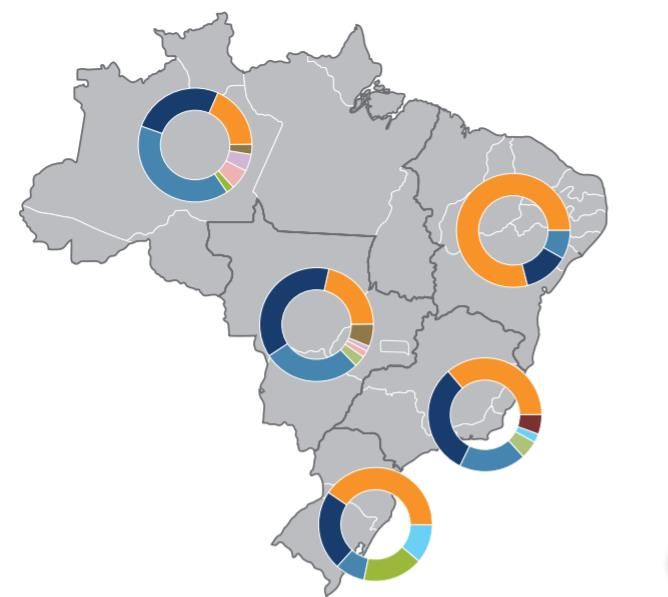
Sources: Central Electricity Authority; Agora; EPE; US EIA; UNFCCC; BNEF; Accenture analysisBrazil electricity market structure
Several rounds of reforms have allowed for separation of generation, transmission and distribution; Eletrobras controls large parts of the value chain,
with 31% of generation and 52% of transmission market shares, respectively.
Generation Transmission Distribution and End Consumption
Retail
Free market participants can directly
negotiate bilateral purchase agreements
with generators
Other Public
Private Transmission
Concessionaries, IPPs1 and Traders Free Market (ACL)
Companies
Self Producers
69% of generation; 48% market share including foreign 32% of overall consumption and
market is fragmented with companies such as China’s State 78% of industrial consumption
largest private company Grid (5% share)
having
~5% market share
Eletrobras Eletrobras Concessionaries Regulated Market (ACR)
31% of generation directly 52% market share directly Total of 63 concessionaries with top 68% of overall consumption (includes households,
and via subsidiaries controlled ten companies accounting for 68% commercial and small industrial); ACR customers have
market share no choice over their retail power provider
Legend Private Government Public + private
companies companies Cos
1IPPs refer to both private standalone generation companies as well as private industrial companies that invest in generation capacity for captive purposes
Source: Central Electricity AuthorityCOVID-19 impact on Brazil’s electricity market
Brazilian daily load change in TWh (2020 vs. 2019)
• Electricity demand down double digits year-on-year in
the month of May 2020.
Electricity demand • Decline in free market (proxy for industrial -0.4% -12% -10%
down across sectors consumption) down by 10% with automotive and 69.1 68.8 68.7 67.0
services sectors falling 47% and 38% respectively. 60.8 60.1
• Distribution companies estimated to see a 10%
reduction in revenues with the majority of malaise
coming from industrial and commercial customer March April May
Deteriorating health segments.
of distribution • Energy traders expect a negative impact of c. R$5 billion
companies due to requests for flexibility and lower consumption by
their customers. Estimated distribution companies revenue from customer segments
• Brazilian government has negotiated a package of R$10
Figures in billion Brazilian real
billion in loans. -10%
13,5
12,2
24% 13%
• Brazil could produce 10-20% more CO2 emissions in 9% 8%
2020 due to deforestation and farming compared to
49% 59%
2018.
C02 emissions not
• The principal source of emissions, land use change (44%
expected to fall 18% 20%
of emissions in 2018), is booming due to the rise in
April 2019 April 2020
Amazon deforestation, which is advancing despite the
pandemic. Commercial Industrial Residential Outros
Source: Accenture Analysis
Sources: Terra; Reuters; Globo; Instituto Acende Brasil, White Paper Edition 23; EPE; Canal Energia; Accenture analysisCOVID-19 impact on Brazil’s economy
Quarterly GDP turns negative in Q1 2020
• GDP projected to contract by 9.1% in 2020 according
to the IMF as of June 2020.
1.0%
• However, local market expectations paint a relatively
more bullish outcome projecting a c.6% decline in 0.5%
Severe GDP impacts
GDP for 2020 followed by a rebound of c.3% in 2021.
in Q2 0.0%
• Most significantly impacted sectors were the
provision of services and the extractive industry. -0.5%
-2%
-1.0%
-1.5%
1Q 2018 2Q 2018 3Q 2018 4Q 2018 1Q 2019 2Q 2019 3Q 2019 4Q 2019 1Q 2020
Fiscal deficit rises
• Due to fiscal stimulus from Brazilian government,
with stimulus
debt to GDP is now projected at 82% by end of 2020 Brazil unemployment rate (three-month moving average)
packages and
and is expected to rise to 93% by end of 2021.
economic pain
13.0%
12.5%
12.0%
11.5%
• Unemployment rate in the three months leading to
11.0%
Unemployment May spiked to 12.9% vs 12.2% during the same period
last year. 10.5%
remains stubbornly
high 10.0%
• Labour force fell 7% in quarter ending May 2020
compared to prior quarter ending February 2020. 9.5%
9.0%
May-19 Jul-19 Sep-19 Nov-19 Jan-20 Mar-20 May-20
Sources: IMF; UOL via Reuters; CNBC; Globo; CronistaBrazil COVID-19 stimulus timeline
Brazil’s R$750 billion ($150 billion) stimulus package to counteract the economic impacts of COVID-19 is projected to comprise 11% of the country's
GDP.
24 March 2020: Several states enter lockdown for initial 15
days, despite President Jair Bolsonaro downplaying the danger
of the virus and focusing on its economic impact. Reactions
among Brazil’s 27 state and district governments varied widely.
Lockdown
2020 2021
Jan Feb Mar Apr May Jun
2019
28 May 2020: Brazil’s financial bailout package set at R$16.1 billion ($3 billion) for power distribution firms hit
by liquidity issues in the economic slowdown caused by the COVID-19 pandemic.
26 March 2020: Economic
stimulus package of R$750
• A total of 61 Brazilian power distribution firms will take advantage of the financial bailout.
Stimulus billion ($150 billion)
• The companies will be able to access loans from 19 banks, with an 11-month grace period which will come
announced. Most aid measures
due in 54 months and annual interest of 2.9% over the Brazilian interbank rate (CDI).
(72%) affect financial markets.
• Funds will be repaid through consumer power bills for five years but is structured in a way to avoid further
rate hikes for the next 12 months. This mechanism has been hailed to facilitate a solution to the crisis
without the need to access federal resources.
ANEEL (National Electric Energy Agency) authorised the transfer of R$2.02 billion ($400 million) to guarantee
liquidity to companies in the electricity sector during the crisis generated by the coronavirus pandemic. The
funds will come from a reserve fund composed of charges from electricity bills.
Sources: Reuters; KPMGPower sector modernization (1 of 2)
PLS 232 is a milestone regulatory approach for the Brazilian power sector
Key issues addressed by PLS 232 Purposes
Market liberalization
Hydrological risk management
Tariff rationalization
▪ Better symmetry of cost and
Cost reallocation risk allocation between captive
and free markets
PLS 232 (2016) Spot price formation
▪ Subsidies rationalization
Alternative energy subsidies review
Commercialisation model review ▪ Market-driven price formation
Contracting model review
Tariff transparency
Sources: PLS 232, Accenture analysisPower sector modernization (2 of 2)
PLS 232 highlights a number of issues and considerations that must be mentioned when considering modernization
Issue Measure Implications
• Gradual reduction of load/voltage requirements for consumers to choose • Allows small load consumers to be able to choose their power
Market liberalization
their power suppliers suppliers
• Guidelines for use of locational signal in transmission and distribution
Tariff rationalization • Potential transportation costs reduction
tariffs
• Migration costs (from regulated to free market) split among all consumers
(regulated and free) • Migration costs presently allocated mostly to regulated
consumers
• Mechanisms to deal with over contracting by distribution companies
Cost reallocation • Potential cost reduction for consumers
• Guidelines for the payment of grants when extending the concession
period for existing power plants, alleviating taxes over tariffs • Reduction of disputes around costs charged to self producers
that were not forecasted in the original investment
• Clarity over charges to be paid by self producers
Spot price formation • Hourly spot price through bid/ask process • Market-driven spot price
• Substitution of transportation discounts by valuing the benefits of
alternative generation sources
Rationalization of subsidies • Dependent on valuation criteria to be established
• Subsidies should be granted in exchange for environmental and social
requirements for those who benefit from them
• Improvement of financial guarantees for spot market • Enhance safety for short-term market
Commercial model
• Fostering the development of power exchange hubs • Better liquidity and power price visibility
• Separating capacity and energy prices; capacity to be paid by all • More isonomic cost allocation (free consumers presently do
Contracting model
consumers (free and captive) not pay for systemic security)
Source: Accenture analysisContents
1 Brazil executive summary 2
2 Brazil electricity market overview 7
3 COVID-19 recovery solutions 18
4 System Value dimensions 24Recovery solution selection criteria
Selected recovery solutions are required to
meet the following criteria:
2 Stimulates economic
recovery
Implementation of the recovery
solution should stimulate job
1 Accelerates the energy
creation by 2021+
transition
The recovery solution moves the System
market closer to net zero Value
3 Enables meaningful System
Value assessment
It should be possible to model and
assess the recovery solution for
meaningful results within a 2025
horizonThree recovery solutions for Brazil to support the economy and advance the
clean energy transition
Enabled by PLS 232 market reforms
Digitalization of Transmission
Non-Hydro Renewables Expansion Smart and Efficient Cities
and Distribution
Brazil can accelerate non-hydro renewables Brazil can invest in smart cities via setting up a digital
Brazil can pursue several opportunities to improve
expansion through multiple initiatives such as energy network, enabling energy efficiency and new
network quality and digitize and modernize its grid
Solution fostering the liberalized market (ACL) with business models schemes to support distributed
overview
ranging from basic investments and incentives in
innovative PPAs, developing a new structured generation, DERs and electric mobility, as well as
distribution to smart grids, smart meters, internet of
solution to MRE, and fossil thermo-plant public services such as public lighting, vegetation
things, and distributed energy resources
substitution management
• ~7% efficiency gains by 2025
Capacity and generation • 3.5 GW incremental wind capacity through 2025 • Technical loss reduction by 0.8% (5 TWh)
• Reduced generation by 41 TWh (6 TWh coal, 8
impact • 3.3 GW incremental solar capacity through 2025 • Non-technical loss reduction by 1.6% (11 TWh)
TWh natural gas and 27 TWh hydropower)
CO2 34 Mt 14 Mt 45 Mt
emissions Cumulative reduction in electricity base Cumulative reduction in electricity base Cumulative reduction in electricity base
case CO2 emissions through 2025 case CO2 emissions through 2025 case CO2 emissions through 2025
Water 62bn litres 1,888bn litres 6,156bn litres
footprint Cumulative reduction in electricity base Cumulative reduction in electricity base Cumulative reduction in electricity base
case water footprint through 2025 case water footprint through 2025 case water footprint through 2025
Jobs >132k Up to 29k >1m
impact Direct and indirect jobs created Potential jobs created by grid Potential jobs across smart buildings,
from incremental wind and solar through 2025 digitalization initiatives based on US figures appliances, efficient lighting based on US figures
Air quality $2.8bn $1bn $3.4bn
and health Cumulative human health benefits from Cumulative human health benefits from Cumulative human health benefits from
lower air pollutants through 2025 lower air pollutants through 2025 lower air pollutants through 2025
Notes: Figures in above solutions assume each initiative is enacted in isolation. CO 2 emissions represent cumulative reduction through 2025 relative to 2025 base case total from coal and natural gas. Water footprint represents cumulative reduction through 2025 relative
to 2025 base case total, excluding biomass. Estimated human health benefits in $US from reduced coal generation and associate d air pollutants. Mt = million (metric) tonnes.Non-Hydro Renewables Expansion
Solution areas to stimulate non-hydro renewables generation investment Projected utility-scale solar and wind capacity additions (GW)
Innovative PPAs: As a key pillar of financing renewables in Brazil, developers are investigating several 12 Solar 30 Wind
10 28
trends in PPAs applicable to Brazil: 27
10 Base case
• Dollar-indexed PPAs: Inflation indexed to $US to hedge against currency risk 8
25
24 24 +13%
Accelerated case
• Downward price curves: A pricing option to reduce the impact of Brazilian inflation indexation in 8 6 +53% 22
7 20
future years, where the PPA price decreases throughout the PPA tenor 6 5 6 20
• Self-generation PPAs: Incentives to self-generate and sell power back to grid 4 2 2
3
4
5
16 17
16
15 15 15
• EACs: Mechanisms to easily trade environmental attribute certificates from PPA contracts 2 2 2
3
15
2019 2020 2021 2022 2023 2024 2025 2019 2020 2021 2022 2023 2024 2025
Structural solution for MRE: The MRE (energy relocation mechanism) is an accounting hedging
mechanism by which a country-wide pool of hydro-generation resources is drawn from to cover
shortfalls for hydro plants in need. However, the MRE was designed over 20 years ago and did not Physical guarantee and revised load forecast
anticipate conditions such as such as large-scale implementation of wind and solar capacities, the ability
85 85 85 85 85
to contract reserve energy at zero variable (marginal) cost, limitations to reviewing the physical 85
guarantees of generation ventures, reduction of storage capacity, changes in hydrological conditions 80
Original load forecast
and consumptive uses. Additionally, the MRE uses outdated parameters to calculate physical 75 Revised load forecast
guarantees.
70 Physical guarantee
To support renewables growth at utility scale and integrate into the National Integrated System (SIN), 65
the MRE structure must be revised. A structural solution for the MRE would be to rescale the physical 60
2020 2021 2022 2023 2024
guarantee and solve for the GSF (Generation Scale Factor), which is an integral issue in Brazilian power
market and has contributed to approximately R$8 billion in defaults.
Fossil thermo-plant substitution: Phased decommissioning of coal and oil power plants is needed in
System Value impacts of Non-Hydro Renewables Expansion
order to comply with emissions targets. Power capacity should be replaced with non-hydro renewable
sources such as solar and wind. According to José Goldemberg, former Secretary of Environment of the
State of São Paulo, terminating PPA contracts with thermo plants (up to 1.5 GW) could lead to a
reduction in approximately 10 Mt of CO2 and eliminate ~R$1 billion in subsidies.
34 Mt 62bn L 132k $2.8bn
Cumulative reduction in electricity Cumulative reduction in Direct and indirect Cumulative human
base case CO2 emissions through electricity base case water jobs created health benefits from
2025, footprint through 2025, from incremental wind and lower air pollutants
13 Mt CO2 emission reduction in 24 billion litre reduction in solar through 2025 through 2025
2025 2025
Sources: Instituto Acende Brasil, Accenture analysisDigitalization of Transmission and Distribution
Overview
T&D losses (% of total generation)
Despite having almost universal access to electricity, Brazil struggles with power supply quality. Power outages are far
longer and more frequent than in developed nations. Additionally the average electricity price on a purchasing power basis
is among the highest in Latin America and is on par with European peers such as Germany and Italy.
Technical losses Non-technical losses Total losses
Modernising the transmission and distribution (T&D) network through basic investments and incentives in distribution and
digital initiatives can improve quality of power supply, reduce energy losses and enhance O&M efficiency of T&D 7.5% 6.5% 14.0%
companies. Additionally, modernization of the T&D network would be conducive to increasing penetration of variable 7.5% 7.3% 6.5% 14.0%
renewable energy sources such as wind and solar as well as improving system reliability. However, to scale up digital 7.2% -0.8% 6.1%
7.0% 13.4%
initiatives to achieve such benefits, mitigating impediments (tariff structure, cost and risk allocation) and creating a 7.0% 6.8% 6.0% 13.5%
conducive incentive structure for investing in digital technologies (e.g. smart meters) must be considered to stimulate 5.7%
-1.6% 12.8%
13.0% -2.4%
private investment. 6.5% 6.8% 5.5% 5.3%
Smart grid and digitalization initiatives 12.5% 12.3%
4.9%
Smart meters: Investment in smart meters in Brazil is mainly restricted to pilot smart grid projects, although some 6.0% 5.0%
12.0% 11.7%
companies are planning for more significant deployments. Smart meters would enable reduction of electricity losses and 4.9
theft, ultimately contributing to reduced energy prices and increased affordability. However, incentives for large-scale 5.5% 4.5% 11.5%
11.6
implementation of smart meters should be considered based on international experience. For example: tax/depreciation
benefits to distribution companies to write off existing analogue meters from their balance sheet. 5.0% 4.0% 11.0%
2020 2022 2024 2026 2020 2022 2024 2026 2020 2022 2024 2026
Internet of things (IoT): Using IoT ensures that utilities would digitally connect to most sources of power, users of power,
and wires and transformers – enabling data flows across all these assets. IoT would enable utilities to reduce operational Base case Accelerated case
costs and increase overall system reliability, as well as optimize system operations and reduce energy transport losses.
Distributed energy resources (DER): DER encompasses distributed generation, demand response, distributed storage,
microgrids and electric vehicles, and have the potential to reduce overall system cost and losses by providing power closer
to demand. Fostering DER within a smart, digital grid would increase overall efficiency of the electricity system. To
sustainably grow penetration of DER, several factors must be considered: regulation surrounding net metering, capex
System Value impacts of Digitalization of T&D via reduction in losses
assistance for low-income households and the revision of the current volumetric-only tariff structure. Policy-makers should
be cognizant of the potential for unintended consequences of DER adoption in order to avoid creating unintended subsidies
for high-income consumers that can afford installation of rooftop solar panels to the detriment of all other users of the
grid.
Modernization of control systems and control centres: The increased digitalization of the T&D grid will imply more
complexity and thus require modernised control applications, supported by modern advanced distribution management
system (ADMS) solutions. 14 Mt 1,888bn L 29k1 $1bn
Cumulative reduction in electricity Cumulative reduction in electricity Potential jobs created via Cumulative human
base case CO2 emissions through base case water footprint through smart grid and micro grid health benefits from
2025, 2025, initiatives based on US lower air pollutants
4 Mt CO2 emission reduction in 558 billion reduction figures through 2025
2025 in 2025
Sources: Smart Energy, IEA, Global Data, Elsevier, Stanford University, EESI
1 Job calculations are based on US figures adjusted for population, with US as a proxy for a mature market that has undergone a high degree of digitisationSmart and Efficient Cities
Overview
With more than 80% of Brazil’s population living in cities, the deployment of a modern, reliable and affordable power
Impact of energy efficiency investments
infrastructure in urban hubs is mandatory to create a smart, efficient and sustainable system to boost the economy, while
achieving Brazil’s climate pledge1 and transitioning to net-zero cities. According to the Brazilian Observatory of Smart Cities
(OBCI), smart cities are expected to generate $59 billion in investments in Brazil in the coming years. Estimated energy efficiency gains through 2025
7.5 Estimates based on the national
Smart cities require a digital energy network which is highly connected, flexible, open and interoperable to foster
electricity energy efficiency target of
collaboration, value sharing and new business models among all stakeholders, facilitating further integration of 7.1%
7.0 10% by 2030.
renewables, DER and other public services, such as traffic control (via intelligent traffic lights), security and vegetation
management. While biofuels account for majority of transport decarbonisation, a nascent e-mobility sector is developing.
6.5 7.1% efficiency gains by 2025 would
6.2% 6.6% reduce demand by 41 TWh, with
Digitalization and efficiency initiatives for smart cities reduced generation split across coal (6
6.0
• Network digital twins: A digital twin is a 3D virtual replica of the local electricity infrastructure comprised of sensors. 5.8% TWh), natural gas (8 TWh) and
The use of digital twins enables energy savings through greater understanding of energy use and energy efficiency, 5.4% hydropower (27 TWh).
5.5
given access to dynamic data from IoT/smart network devices. This improves service quality through real-time status
communication, predictive maintenance, remote assistance and other augmented reality (AR) and artificial intelligence 5.0 An estimated $1.3B+4
(AI) capabilities. For example, The Urban Futurability digital twin demonstration project involves the full digitalization of incremental investment through 2025
the Vila Olimpia district in Sao Paulo, paving the way for smart cities, where the project can further integrate built 4.5 is expected in order to achieve
environment applications for smart city infrastructure, such as sustainable construction and smart street lighting to 2021 2022 2023 2024 2025 efficiency targets.
address affordable housing and energy efficiency.
• Distributed generation: Brazil has surpassed 250,000 DER systems connected to the network, including solar panels, use
Source: Oxford Energy, Accenture Analysis
of biomass and small-scale hydro plants of up to 5 MW. DER projects such as solar PV installation are particularly strong
job creators. However, a revision of resolution RN 482 is needed to provide appropriate cost allocation among
prosumers and other customers.
• Net-zero carbon buildings (ZCB) certification: Unlike the EU or US, there are currently no government incentive System Value impacts of Smart and Efficient Cities
programs or deadlines in place for ZCBs. However, Brazil’s Green Building Council has set up voluntary ZCB certification
tracks (i.e. building labels), which involve implementing high levels of energy efficiency combined with on- or off-site
renewable energy.
• Public street lighting financing: As municipalities take ownership of lighting assets from utility companies, the energy
efficiency improvements of their lighting assets become a strong motivator to reduce costs. Standardising financing
mechanisms such as COSIP2 increase the attractiveness of efficiency investments in the sector.
• Electrification of transport: Brazil can benefit from increased electrification of its transport sector, especially with 45 Mt 6,156bn L >1M+ $3.4bn
further incentives for public transportation as Brazil deploys electric buses. Cumulative reduction in Cumulative reduction in electricity basePotential jobs across smart Cumulative human
electricity base case CO2 case water footprint through buildings, appliances and health benefits from
emissions through 2025, 2025,1,469 billion litres reduction in efficient lighting based on lower air pollutants
11 Mt CO2 emission reduction 2025 US figures3 through 2025
in 2025
Notes: (1) Nationally determined contribution (NDC) of 37% reduction by 2025, and indicatively 43% by 2030. (2) Contribution for Costs of the Public Lighting Service (COSIP). (3) EESI Energy Efficiency Jobs by Sector; job calculations are based on US figures
adjusted for population, with US as a proxy for a mature market. (4) Based on previous period of PROCEL investments ( IEEE, Procel Edifica; Accenture analysis)
Sources: Enel; Energy and Buildings; Carbon Brief; World Economic Forum; WRI (1, 2, 3); WGBC; IEEE; ICCT; WBG; World Bank; Polemica Paraiba; ElectriveContents
1 Brazil executive summary 2
2 Brazil electricity market overview 7
3 COVID-19 recovery solutions 18
4 System Value dimensions 24System Value of clean energy transition
System Value benefits are seen across Brazil’s recovery solutions
Economic, environmental, societal and energy value
System Value dimension with
quantitative analysis Access to Electricity System Upgrade
Physical and economic Air Quality and Health Energy Productivity and Systemic Reliability and Service Technology (incl. digital) and
CO2 Emissions access to clean electricity Impacts to human health and Efficiency Quality capital investments in T&D to
System Value dimension with CO2 emissions based on to support individual natural environment Energy efficiency plus Life cycle approach to upgrade the system for variable
qualitative analysis energy source, or society development from air & water pollutants, systemic efficiency to ensuring high system renewables
generation mix and load land use maximize energy availability; improved and DERs
changes productivity customer service
Resiliency and Security Cost and Investment
Priority System Value Flexibility
Water Footprint Jobs and Uninterrupted and diversified Foreign Direct Competitiveness
Ability to manage generation,
dimension Water footprint based on Economic Impact energy supply Investment Market attractiveness and policy
demand and power flows
energy source, Influx of jobs due to at affordable prices Market attractiveness for certainty for investment incl.
(incl. power quality) across
generation mix and load energy transition and and the ability to FDI with reliable energy R&D
the grid, enabled by
changes renewables bounce back from and skilled resources and levelized
digitalization
disruptions cost of energy
and storage
34 Mt 62bn litres 132k
Top onshore wind
Non-Hydro Cumulative reduction $2.8bn projects in Brazil
Cumulative reduction Direct and indirect expected to operate
in electricity base case Human health
in electricity base case jobs created
Renewables emissions through
water footprint
from incremental
benefits through 2025 at LCOE of $24/MWh;
through 2025, 24 from decreased air solar and wind
Expansion 2025,
billion reduction in
wind and solar
pollution dropping to $20 MWh
13 Mt in 2025 through 2025 by 2030
2025
14 Mt 1,888bn litres
Cumulative reduction Up to 29k $1.0bn
Cumulative reduction
Digitalization in electricity base case
in electricity base case Potential job creation Human health
water footprint by grid digitalization benefits through 2025
of T&D emissions through
2025,
through 2025, 558 initiatives based on US from decreased air
billion reduction in figures pollution
4 Mt in 2025
2025
45 Mt 6,156bn litres >1m
Cumulative reduction $3.4bn
Cumulative reduction Potential jobs across
Smart and Efficient in electricity base case
in electricity base case
smart buildings,
Human health
water footprint benefits through 2025
Cities emissions through
2025,
through 2025, 1,469
appliances and
efficient lighting based
from decreased air
billion reduction in pollution
11 Mt in 2025 on US figures
2025
Analysis performed for given System Value dimension System Value dimension not as relevant to Relative System Value dimension benefit for given recovery solution within market
and recovery solution. For more detail, please see geographic market or not considered with
specific solution and/or relevant System Value given recovery solution. High benefit Medium benefit Minimal-to-no benefit
dimension slide(s).System Value dimension: Jobs impact
Given the relatively high unemployment in Brazil, investments in non-hydro renewables, grid digitalization and smart cities can be strong drivers of high-
quality job creation.
Direct and indirect jobs created
Pre-COVID direct and indirect renewable energy and fuels jobs
by incremental wind and solar through 2025
0 20,000 40,000 60,000 80,000 100,000 120,000 140,000
0 200,000 400,000 600,000 800,000 1,000,000
Onshore wind 47,898
Biofuel 832,000 Solar PV 84,222
Total 132,120
Hydropower 203,000 Sources: Sustainability, ABSOLAR, Accenture analysis
Potential job impact across Digitalization of T&D
Wind 34,000 and Smart and Efficient Cities recovery solutions
0 200,000 400,000 600,000
Buildings (construction, materials,
renewable heating/cooling) 424,984
Solar heating
and cooling 41,000
Appliances (efficient HVAC) 382,972
Appliances (efficient lighting) 238,380
Solar PV 15,600
Smart and micro grids 29,029
Source: IRENA 2019 Note: Based on US jobs in the energy efficiency sector in 2018 (EESI)
Note: Job figures for Digitalization of T&D and Smart and Efficient Cities recovery solutions are based on US figures adjusted for population, with US as a proxy for a mature market that has undergone a high degree of digitisationSystem Value dimension: Energy productivity and systemic efficiency
Efficiency improvements to remove waste and optimize the electricity system across the value chain can be achieved through identified recovery
solutions.
Energy productivity and systemic efficiency benefits by recovery solution
Non-Hydro Renewables • Leveraging the existing hydropower to complement the load profile of wind and solar and support variable renewables growth will
Expansion create systemic efficiencies on the supply side
• Digitalization initiatives such as smart metering would reduce non-technical losses as well as improve efficacy of invoicing and bill
Digitalization of Transmission collection for power distribution companies (discoms)
and Distribution
• Increased penetration of distributed generation has potential to lower T&D losses due to more local generation in remote areas
• The use of digital twins, a 3D virtual replica of the local electricity infrastructure made up of sensors, enables energy savings through
Smart and Efficient Cities
greater awareness of energy use and energy efficiency opportunities, given access to dynamic data from IoT/smart network devices
Relative System Value dimension
benefit for given recovery solution High benefit Medium benefit Minimal-to-no benefit
within marketSystem Value dimension: Foreign direct investment
FDI into the power sector represented 5.5% in 2018, lagging behind the oil and gas sector; many areas can benefit from additional foreign investment
Overview Brazil historical FDI inflows ($ billion)
Brazil represents an attractive destination for foreign direct investment (FDI) given its large
population, favourable demographics and extensive natural resources. FDI inflows increased by $105
20% between 2018 and 2019 and reached $72 billion. Brazil is the 9th largest recipient of FDI $100
in the world in terms of inflows, and the largest in Latin America and the Caribbean. $95
However, Brazil has complex tax, labour and information security systems that need to be $90
revised and improved in terms of process and transparency to facilitate and attract more $85
investments. $80
In 2018, power and gas sector in Brazil represented 5.5% of FDI inflows, which is half that of oil $75
and gas extraction at 11.4%. Given the current conditions, there are several areas that can still $70
benefit from domestic and foreign investment. $65
$60
Key highlights of PDE 2029 (10-year energy plan)
2010 2011 2012 2013 2014 2015 2016 2017 2018 2019
• PDE 2029 indicates that the investments required for the next 10 years in the energy
sector amount to approximately R$2.3 trillion, of which R$1.9 trillion in oil, natural gas and
biofuels and R$456 billion in electricity generation and transmission.
• Total investments in transmission lines projected to reach approximately R$103 billion Recovery solution impact on System Value dimension
over the decade, with R$73 billion in lines of transmission and R$30 billion in substations
including border facilities.
Non-Hydro Renewables Digitalization Smart and Efficient
• PDE foresees an increase of 55,800 km in transmission lines, and an increase of 172 GVA in Expansion of T&D Cities
transformation capacity.
• Expansion of the installed capacity of electric generation of the National Interconnected
System (SIN) forecast for the 10-year horizon is 75.5 GW, of which 60 GW is centralized
generation and 15.5 GW is self-production and distributed generation.
Strong intent and supportive policy to Large-scale programs to Smart city demonstration projects
grow capacity in non-hydro renewable modernize/digitize grid infrastructure and dedicated efficiency initiatives
sources of power will attract foreign would attract global players in this attract further investment into
direct investment space to invest in Brazil building low-carbon cities
Relative System Value dimension
Sources: World Bank, Santander, MME benefit for given recovery solution High benefit Medium benefit Minimal-to-no benefit
within marketSystem Value dimension: System upgrade
Challenges Energy system technologies supported by new regulation and tariffs
• Brazil struggles with its reliability of supply, with power outages longer and more frequent than
developed nations.
• The average electricity price on a purchasing power basis is among the highest in Latin America Internet of Things
New Technologies Energy Storage
and is on par with European peers such as Germany and Italy. (IoT)
• Brazil’s energy intensity, measured as primary energy consumption per unit of GDP, continues
to increase by 2% per year. Demand-Side
Electric Vehicles Distributed Generation
• Increasing variability of Brazil’s energy mix will require more active grid management including Management
demand side response only possible with smart grid.
• Greater electrification is needed to lower CO2 emissions particularly in transport.
Smart Meters Demand Response Energy Efficiency
Modernising Brazil’s energy system
• Brazil expects to have invested $86 billion in its transmission networks between 2013-2023, Enabled by new regulations (non-exhaustive):
New Tariffs - Distributed Generation (RN nº 687/2015)
with a key goal to increase power system flexibility while maintaining reliability. - IoT (Law 9,854/2019)
e.g. White Hourly Tariff,
• For distribution, massive investments into basic grid infrastructure are needed alongside better Prepayment, Tariff Flag -
-
Energy Efficiency (Law 13,280/2016)
Electric Vehicles (RN nº 819/2018)
System
renumeration and incentives to improve network quality. - National Plan for Digital Transformation (Decree 9,319/2018)
• Solutions and smart grid technologies are needed that will optimize grid management and Source: Dranka and Ferreira (2020)
improve network congestion. Policies for distributed generation (DG), demand-side
management (DSM) and new tariff schemes are on a path of accelerated deployment in Brazil. Recovery solution impact on System Value dimension
• This, coupled with data and digitalization will improve the visibility of networks allowing for
better prediction and management of faults. Digitalization can also reduce grid congestion and
Non-Hydro Renewables Digitalization Smart and Efficient
allow for demand to be matched with local generation, improving resilience and reducing
Expansion of T&D Cities
costs.
• Technology adoption plays a crucial role, where the introduction of IoT and smart meters
allows for more demand-side initiatives. Demonstration projects such as the Urban Futurability
digital twins project and growing interest in smart cities will play a crucial role in upgrading
infrastructure to decarbonise transport and the built environment. Grid digitalization will bring material Efficiency and e-mobility initiatives
No material impact benefits through better planning, will deliver critical infrastructure
active management, and efficiency required to decarbonise transport
and the built environment
Relative System Value dimension
Sources: IEA, Energy Policy, International Energy Efficiency Scorecard, CCEE benefit for given recovery solution High benefit Medium benefit Minimal-to-no benefit
within marketSystem Value dimension: Cost and investment competitiveness
Onshore wind and solar are competitive to Brazil’s existing coal and oil power plants, and to natural gas.
Levelized cost of energy (LCOE) [$/MWh] 2018 LCOE1 ($/MWh)
• According to BNEF, LCOE of wind and solar is expected to
drop below $20/MWh by 2030.
$70
• Top onshore wind projects in Brazil are expected to Solar
operate at LCOE of $24/MWh – lowest in the world $196
ahead of the US at $26/MWh.
• The cost of equity and debt financing amounts to 60% of
the LCOE for solar PV and wind projects. $39
Wind
• LCOE can be driven down further through lower cost of $64
capital from foreign institutional investors if risks
associated with renewable projects are mitigated. -50% -36%
$78
CCGT
$129
$247
Gas peaker
$307
Min Max
Note(s): 1. LCOE costs do not include transmission
Sources: Lazard, BNEFSystem Value dimension: CO2 emissions
Brazil can decrease its CO2 emissions from fossil fuel electricity generation (relatively low due to high presence of hydro) through implementing the three
recovery solutions, with combined effect of 40% lower emissions compared to base case by 2025.
2025 CO2 emission Total impact of recovery solutions on 2025 power sector CO2 emissions (Mt)
impact by recovery solution
-40%
70
Non-Hydro 13 Mt 13
Renewables 18% of projected 2025
Expansion base case footprint
4
11
42
4 Mt
Digitalization of T&D 6% of projected 2025
base case footprint
Smart and Efficient 11 Mt
16% of projected 2025
Cities base case footprint
2025 Base case Non-Hydro Digitalization of Smart and 2025 Accelerated
Renewables T&D Efficient Cities case
Note: Emissions from energy sources outside coal, natural gas, oil and hydro were not evaluated for this analysis. Mt = million (metric) tonnes.System Value dimension: Net water footprint
Brazil could reduce its power sector’s water footprint – relatively high due to the large generation share of hydro – by 3.6% if all three recovery solutions
are implemented.
Total power sector annual water footprint
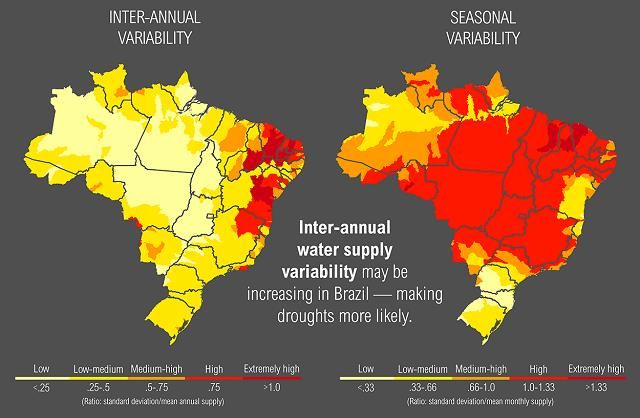
Water supply variability in Brazil
across recovery solutions1
Inter-annual variability: measures -3.6%
YoY water supply variation 56,407
24
558
Seasonal variability: measures
water supply variation among the
months of the year 1,469
54,357
Source: WRI Aqueduct project
2025 Base Non-Hydro Digitalization of Smart and 2025 All
• Brazil’s water resources and population are unevenly distributed, as ~50% of available water resources are case Renewables T&D Efficient Cities scenarios
based in the Amazon River basin serving only 4% of the population. About 40% of the urban population
faces medium to extremely high water stress, as they rely on local river basins.
• Water supply variability is another issue, with Brazil’s pronounced wet and dry seasons. Areas of high Cumulative water footprint impact by recovery solution
variability store freshwater underground and in reservoirs during wet periods. Non-Hydro
Digitalization Smart and Efficient All focus
• Deforestation is a major driver of drought and other serious dry periods, where initiatives to restore forests Renewables
of T&D Cities areas
Expansion
can help boost resilience to growing water crises. For example, restoring 2% of São Paulo's forestland could
generate a 28% return on investment over 30 years in the form of reduced water treatment costs, removing 24bn 558bn
1,469bn litres 2,051bn litres
one-third of sediment pollution and reducing turbidity by 50%. litres litres Reduction in electricity Reduction in electricity
Reduction in electricity Reduction in electricity base case water footprint base case water footprint
base case water footprint base case water footprint in 2025 in 2025
in 2025 in 2025
Sources: WRI (1, 2); Accenture analysisSystem Value dimension: Access to electricity
Brazil has near universal access to electricity for its citizens
Universal access to power Brazil’s grid at a glance
• As of 2018, Brazil has recorded 100% access to electricity, according to the
World Bank (global average of 89%).
• Brazil has a large transmission grid, the National Interconnected System (SIN),
which is operated by the National System Operator (ONS) and comprises 99%
of the country’s transmission lines with only parts of the northern substations
that are unconnected.
• Unconnected regions usually rely on diesel generators to provide electricity.
Recovery solution impact on System Value dimension
Non-Hydro Renewables Digitalization of T&D Smart and Efficient
Expansion Cities
No material benefit Implementation of smart grids is likely No material benefit
to reduce technical losses and improve
grid reliability which will improve
quality of power supply
Relative System Value dimension
Sources: World Bank, Agora benefit for given recovery solution High benefit Medium benefit Minimal-to-no benefit
within marketSystem Value dimension: Air quality and health
Recent revisions to national air quality standards support further reduction in PM2.5 concentrations.
Nearly all of Brazil’s cities have PM2.5 levels above
Brazil overview
WHO air quality guidelines
• Air pollution kills approximately 49,000 Brazilians annually, with 50% of deaths
attributed to outdoor air pollution.
• Deaths related to air pollution represent 1 in 26 deaths across all causes, the ninth
largest mortality risk for Brazilians.
• PM2.5 causes the greatest risk, and major cities such as São Paulo have measured
double the World Health Organization’s (WHO) 10µg/m3 limit. Approximately 7,000
lives could be saved by reducing the maximum outdoor PM2.5 exposure in cities to the
WHO third interim target of 15µg/m3.
• Given the high concentration of hydro in the generation mix, the electricity sector is far
less culpable for air quality concerns relative to industries such as transport.
Policy and enforcement
• Brazil updated their National Air Quality Standards (NAQS) in November 2018,
considering the WHO 2005 guidelines. The NAQS now include PM2.5 as a criteria
pollutant, and interim targets were proposed for each pollutant.
COVID-19 impact
Source: ICCT
• During the partial lockdown, São Paulo saw drastic reductions in NO (~77%), NO2 (54%)
and CO (~65%) concentrations, compared to pre-lockdown levels and a five-year monthly
mean. Cumulative air quality and health impact by recovery solution
Recovery solution analysis Non-Hydro Renewables Digitalization
Smart and Efficient Cities All solutions
• The cost of air pollution was estimated based on oil, natural gas and coal related PM2.5 Expansion of T&D
emissions.
$2.8bn $1bn $3.4bn $7.3bn
Human health benefits Human health benefits Human health benefits Human health benefits
cumulative through 2025 cumulative through 2025 cumulative through 2025 cumulative through 2025
Sources: Copenhagen Consensus, WRI, Science of the Total Environment, Scielo
Note: Differences in figure summation result from roundingYou can also read