Empowering Developers to Estimate App Energy Consumption
←
→
Page content transcription
If your browser does not render page correctly, please read the page content below
Empowering Developers to Estimate App Energy
                             Consumption

                                       Radhika Mittal‡ , Aman Kansal† , Ranveer Chandra†
                              ‡                                                      †
                                  IIT Kharagpur, Kharagpur, India                        Microsoft Research, Redmond, WA
                        radhikamittal.iitkgp@gmail.com                                   {kansal,ranveer}@microsoft.com

ABSTRACT                                                                                  cloud. However, such platform layer improvements do not suffice
Battery life is a critical performance and user experience metric on                      by themselves since poorly written software can callously eat into
mobile devices. However, it is difficult for app developers to mea-                       the resultant extra battery juice.
sure the energy used by their apps, and to explore how energy use                            A significant portion of the battery is used when the phone is
might change with conditions that vary outside of the developer’s                         actively used in interactive foreground apps. While OS designers
control such as network congestion, choice of mobile operator, and                        spend significant effort in optimizing the battery impact of back-
user settings for screen brightness. We present an energy emula-                          ground OS services, the foreground apps are largely controlled by
tion tool that allows developers to estimate the energy use for their                     app developers. Very few tools are available for developers to im-
mobile apps on their development workstation itself. The proposed                         prove the energy efficiency of their apps. In fact, most developers
techniques scale the emulated resources including the processing                          are not even aware of the amount of energy their app consumes un-
speed and network characteristics to match the app behavior to that                       der a typical usage pattern. While they could use a power meter
on a real mobile device. We also enable exploring multiple op-                            to measure the energy draw for their app during test runs, such an
erating conditions that the developers cannot easily reproduce in                         approach is not used in practice because it is tedious and expensive.
their lab. The estimation of energy relies on power models for var-                       It is very difficult to perform these measurements for multiple de-
ious components, and we also add new power models for compo-                              vices, network conditions, user settings for screen brightness, and
nents not modeled in prior works such as AMOLED displays. We                              so on. Even if measurements are performed, they are biased to the
also present a prototype implementation of this tool and evaluate it                      network conditions at the developer’s location. Measurements by
through comparisons with real device energy measurements.                                 themselves do not give any insight into how much each component
                                                                                          (CPU, network, or display) contributed to battery drain, making it
                                                                                          harder to focus the optimization effort.
Categories and Subject Descriptors                                                           One alternative for developers is to use the “battery use” tool on
C.4 [Computer Systems Organization]: Performance of Systems;                              Android phones, the Nokia Energy Profiler (NEP) or power mod-
D.2.2 [Software]: Software Engineering—Design Tools and Tech-                             eling tools such as eProf [15]. While these tools can circumvent
niques                                                                                    the need for power metering equipment, they are still limited in
                                                                                          exploring multiple configurations, user settings, or network con-
General Terms                                                                             ditions. The profiled behavior remains biased to conditions at the
                                                                                          developer’s location.
Algorithms, Experimentation, Measurement, Performance, Design
                                                                                             In this paper we present WattsOn, a system that allows a devel-
                                                                                          oper to estimate the energy consumed by her app in the develop-
Keywords                                                                                  ment environment itself. WattsOn can (i) identify energy hungry
energy efficiency, display power, developer tools                                         segments during the app run, and (ii) determine which component
                                                                                          (display, network or CPU) consumes the most energy. For instance,
1.     INTRODUCTION                                                                       an developer may determine if the battery drain is dominated by the
                                                                                          download of a high resolution image is consuming more energy, the
   Poorly written apps can sap 30 to 40% of a phone’s battery [10].
                                                                                          app display using a white background, or the computation that the
Battery lifetime is a common cause of frustration in smartphone
                                                                                          app is doing. The developer may compare the energy impact of
users. Several efforts in research and industry are investigating
                                                                                          design choices such as developing a portable browser based app
techniques to improve the battery life, such as through use of higher
                                                                                          that downloads most content on the fly or a native app that only
battery density, dedicated low power processors for offloading com-
                                                                                          downloads incremental updates.
putations from the application processor, or even off-loading to the
                                                                                             Furthermore, WattsOn allows what-if analyses, to answer ques-
                                                                                          tions, such as: How much energy is consumed on a different phone
                                                                                          model? How does energy consumption change if the user has a 2G
Permission to make digital or hard copies of all or part of this work for                 or a 3G network? What if the brightness is set to high? or, What if
personal or classroom use is granted without fee provided that copies are                 the app is used under a low signal strength area?
not made or distributed for profit or commercial advantage and that copies                   Our current WattsOn prototype emulates the power consumption
bear this notice and the full citation on the first page. To copy otherwise, to           for the display, network, and CPU, since these are the dominant
republish, to post on servers or to redistribute to lists, requires prior specific
permission and/or a fee.
                                                                                          energy consumers on a smartphone, consuming between 800mW
MobiCom’12, August 22–26, 2012, Istanbul, Turkey.                                         to 1500mW in their highest power states. Other components such
Copyright 2012 ACM 978-1-4503-1159-5/12/08 ...$15.00.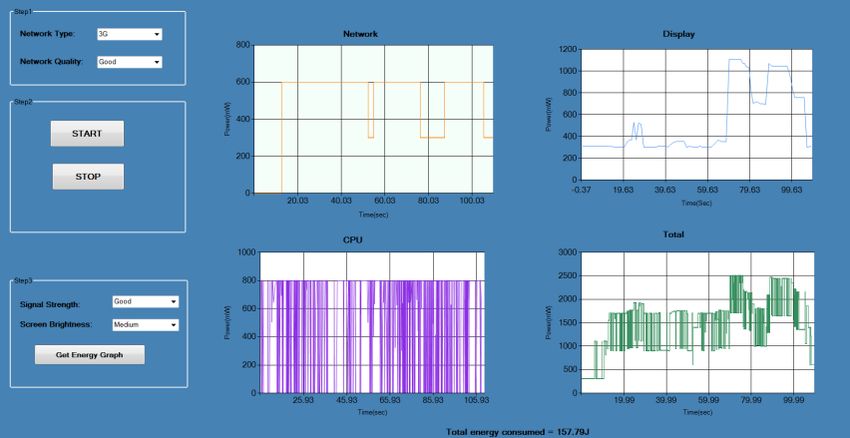
as the GPU (peaking to 250mW - 350mW) and A-GPS (160mW                     tests. WattsOn extends existing emulators to estimate app battery
- 350mW, across various chip sets), while significant, account for         consumption.
a smaller fraction of the total power consumption for interactive             The two major techniques used in WattsOn design are power
foreground apps. These components can be added to our frame-               modeling and resource scaling.
work provided appropriate resource consumption counters, relevant             Power Modeling: One way to measure app energy is to use
power models, and emulation strategies are available.                      power metering equipment [7]. However, requiring every app de-
   Specifically, we make the following contributions.                      veloper to install such equipment is an arduous ask. Also, measure-
   First, we present the first system that can estimate an appŠs en-       ments have variability due to differences in network conditions,
ergy consumption in different operating conditions (carrier, signal        background activities running on the phone, not all of which can
strength, brightness) without requiring expensive lab equipment            disabled by the developer. For instance, the measured energy after
and explicit measurements with repeated runs for each operating            an energy reducing change made by the developer may turn out to
condition.                                                                 be higher than before the change, due to degraded network quality
   Second, we enable energy to be profiled within the development          at the time of the new measurement. Further, the measurement does
environment without requiring a specific mobile device. To achieve         not separate out the impact of display, network, and CPU that can
this, we scale the development machine’s resources including the           be important for the developer to make their optimization decisions.
CPU and the network to match the characteristics of a real phone.          To overcome these limitations, WattsOn computes energy from the
The app thus behaves as if on a real phone and its energy impact on        resource utilization counters using power models [2, 4, 6, 8, 17, 20].
all components, such as idle display power-on time while waiting              Resource Scaling: Resources consumed by the app on the de-
for a download, is correctly emulated. The combination of power            veloper’s workstation are very different from those on the phone.
modeling and resource scaling required for WattsOn design implies          This leads to two challenges. First, the resource counters measured
that only those power models and scaling techniques can be ap-             on the developer workstation cannot be fed directly into the phone
plied that are mutually compatible. WattsOn allows the app to use          power models. Second, timing of events might be different when
external resources such as web services from the Internet. These re-       running the app on the emulator than on the phone. Network pack-
quirements are in contrast to other energy emulators, such as Power        ets may arrive much faster on the development machine, causing
TOSSIM [22], based on event driven simulation, where all com-              the user clicks for the subsequent tasks to be occur sooner, drasti-
municating nodes are within the simulator. Hence techniques such           cally changing the time spent on application tasks. Resource scal-
as virtual clocks cannot be applied in WattsOn for resource scal-          ing addresses these challenges.
ing. Processor power models based on architecture specific perfor-
mance counters are also not amenable to use with scaled resources.         2.1     Design Overview
   Third, we expand the catalogue of power models available for               A block diagram of WattsOn is shown in Figure 1. The leftmost
mobile devices. Power models for many components have been                 blocks represent the measurement of real device power character-
established previously in [2, 4, 6, 8, 17, 20] at varying levels of com-   istics required for power model generation1 . These measurements
plexity and accuracy. We use previously proposed models for CPU            may be performed by the smartphone manufacturers, mobile OS
and WiFi. For displays, while LCD and OLED displays have been              platform developers, or even volunteers using automated modeling
modeled in detail [5, 25], prior work did not provide a model for          methods [6]. The mobile app developer simply downloads the ap-
AMOLED displays. Hence we develop a new power model for                    propriate models.
AMOLED. For cellular networks, while the power model exists [18],             On the developer machine, the app code for the mobile device
measurements for model parameters with varying signal strengths            runs in a mobile device emulator. We insert resource scaling tech-
and operators were not available in published literature. We per-          niques between the emulator and the actual hardware. As the app
form new measurements to fill in some of the missing data.                 is executed on the emulator, we monitor its resource consump-
   Finally, we have validated WattsOn with multiple applications,          tion using resource profiling methods available on the development
devices, network conditions, and carrier networks. Average energy          workstation. The resource consumption monitored on the scaled
error varied from 4% to 9% across the apps tested. The accuracy            resources is used in the energy calculation block to estimate the
of energy estimation when compared with the variability in hard-           app energy using power models.
ware energy measurement for the same task over multiple runs indi-            We describe resource scaling and power modeling methods for
cates that WattsOn can offer a better energy estimate by eliminating       each of the modeled components below.
several variable factors such as background activity on the mobile
device. We also show how the component energy break-down pro-              2.2     Cellular Network (3G)
duced by WattsOn can help application designers.                             The cellular network interface [17] consumes significant energy
   While the concepts of power modeling and resource scaling have          and we emulate it as follows.
been developed before, to the best of our knowledge, this is the
first work that investigates the suitable selection of modeling and        2.2.1     Resource Scaling
scaling techniques for development-time mobile app energy emu-               The goal of resource scaling is to obtain the network resource
lation, and validates their use through fine grained hardware mea-         consumption of the app as if executed on a real cellular data link.
surements.                                                                 Multiple scaling options may be considered:
                                                                             Virtual Clock: Event driven simulators such as ns-3 and Power
                                                                           TOSSIM [22] simply record time in ticks and the ticks can be
2.    WattsOn SYSTEM DESIGN                                                mapped to the real time for the network nodes of interest while they
   Most mobile development toolchains provide an emulator to as-           may run much faster (or slower) on the simulation workstation.
sist in app development such as the Android Emulator, the iOS Sim-         1
                                                                             Power models may be developed for all mobile devices of interest;
ulator, or the Windows Phone Emulator. While the emulators do              the number of models required may be reduced by considering rep-
not accurately reproduce all mobile device characteristics, the low        resentative devices in various device classes with different screen
overhead of their use makes them very beneficial for a variety of          sizes and cellular network types.
Device                             Test Application                            location, and other factors. To keep the number of varying condi-
                                                            Developer
   Manufacturer, or
   OS Provider Labs
                                                            Workstation           tions manageable, we bin the network quality into three levels, de-
                                       Mobile Phone
                                                                                  noted good, average, and poor, and based on [23], set the parameter
    Target Mobile Device                Emulator                                  values as shown in Table 1.
                                      Resource Scaling   Resource                      Network quality      Download (kbps)        Upload (kbps)
     Resource      Power
     Profiling    Profiling                              Profiling
                                    Hardware Resources                                     Good                  2500                  1600
        Power Model                                                                       Average                1500                  900
                                        Developer
         Generation                     Workstation                                         Poor                  500                   200

                                                                     App               Table 1: Network scaling parameters for bandwidth.
                              Energy Calculation
                                                                     Energy use

                                                                                     Loss: We model losses using the well known Gilbert Elliot Chan-
Figure 1: Block diagram of WattsOn components. Blocks                             nel Model and the corresponding parameters measured for 3G links
shaded gray are used in existing systems; WattsOn adds the                        from [26]. According to this model, the network is assumed to be in
other blocks for energy emulation.                                                one of two states, denoted good and bad, each with a different loss
                                                                                  rate. The model also describes the transition probabilities between
                                                                                  the two states, that allows simulating the losses over time during an
                                                                                  emulation run.
This technique is not suitable for WattsOn because the emulated
                                                                                     In certain instances, when the developer is using a slow Inter-
app uses external resources such as web services on the Internet
                                                                                  net connection for their developer machine, such as a home Inter-
that are not operating on simulated tick time.
                                                                                  net connection, then the underlying network may itself have non-
    Trace Stretching: Another possibility is to capture the packet
                                                                                  negligible latency and losses. In this case, WattsOn should first
activity over the high speed network connection of the developer’s
                                                                                  probe and estimate the network latency using known methods [11]
machine and then stretch the timing characteristics to match those
                                                                                  and then add on any additional resource scaling to the measured
on a lower speed link. For example, suppose a 10 second trace
                                                                                  characteristics.
would take 30 seconds over the cellular interface, one could multi-
ply all time intervals in the Ethernet packet trace by 3. One could               2.2.2     Power Modeling
even replay the trace from the high speed interface on a lower speed                 The power model for the 3G network must model not only the
interface simulated using a fine grained packet level simulator, such             active energy consumption when communicating data but also the
as QualNet or ns-3 and get more accurate stretching. However,                     “tail” time, or the time for which the radio interface remains in a
this technique has several drawbacks. A slower interface will af-                 higher power state after finishing the communication activity. Part
fect other parameters of the network flow, such as the TCP window                 of the tail time is spent in the active state (DCH) itself, and part in
size, which are not captured by stretching the high speed packet                  an intermediate state (FACH), where the radio power consumption
trace. Also, stretching the network trace alone will not produce the              is reduced but any further communication requires a small channel
corresponding impact on other resources such as the timing of user                acquisition overhead. Some radios may have a second lower pow-
clicks or other tasks in the app that depends on network activity.                ered intermediate state (PCH). This model, called ARO model, was
    Link Shaping: The approach we have taken is to shape the net-                 studied in depth in [17, 18], and allows back-calculating the radio
work link bandwidth and latency such that the emulated network                    power state from a network packet trace.
activity in terms of packets sent and received is similar to the activ-              However, the number of mobile operators for which the model
ity that would be observed on a cellular data link for the same task.             parameters have been measured is limited [18]. Second, the en-
We introduce our resource scaling code at layer 2.5 in the network                ergy consumed at varying received signal strengths has not been
stack, that is, between IP and the MAC layer. The delay, loss and                 reported for the ARO model, though dependence on signal strength
bandwidth parameters are chosen to mimic different network con-                   is well known [21]. To fill in the above gaps, we set up two experi-
ditions. The other components of the network remain the same as                   ments (Figure 2).
used by the app on a real device.
    The latency, bandwidth and loss parameters for cellular networks
have been studied in several prior works in wireless communica-
tions, and we rely on the existing literature to guide our choice
of these parameters. Using measured distribution based models,
rather than physical measurements, has the advantage that the esti-
mate is much more representative for a wide population of users.
It is not biased to the developer’s specific phone location, and does
not show uncontrolled fluctuations from measurement to measure-
ment. Parameter values may be updates as technology evolves. In
our prototype, we selected the parameter values as follows.
    Latency: The measurement and modeling work in [9, 12] has                     Figure 2: Experimental setups for the network power measure-
characterized the cellular data link latency for 3G networks using a              ments.
normal distribution (with mean = 200ms, and standard deviation =
100ms) and we use this characterization.                                             Signal Strength. We used an Ericsson cellular data develop-
    Bandwidth: We use the measurements from [23] that have ex-                    ment board that exposes the antenna ports and allows controlling
perimentally characterized 3G HSDPA download and upload band-                     the received signal strength via an RF signal strength attenuator.
widths. The bandwidth varies due to various reasons including                     The setup was located where we typically observed good signal
changes in network congestion, wireless channel quality at the phone              strength. Measurements were performed on a weekend when the
network was lightly loaded. We varied the amount of data down- Operator DCH FACH PCH
loaded and uploaded at different signal strengths and measured AT&T (3G) 5s 12s 0
the DCH and FACH power and tail times. Since a developer will T-Mobile (3G) 5s 1s 1s
likely only emulate their application with a small number of signal T-Mobile (4G HSPA) 4s 2s 1s
strength variations, we discretize the signal strength to three levels Verizon (3G) 6s 0 0
(Table 2). These power measurements are taken using a radio in- Sprint (3G) 10s 0 0
terface board and not a phone, implying that the idle power of the
board can be different from that of the phone. However, the differ- Table 3: Tail state times for different operators. SOme opera-
ences between the power levels at different signal strengths comes tors do not use all intermediate states resulting in zero tail times
primarily from the radio and can be used to adapt the power model in those states.
for varying signal strengths. The tail times for DCH and FACH did
not vary with signal strength.
Power Model: The WiFi power model uses the PSM state model
described in [13]. The model uses four states - Deep Sleep (10mW),
Signal Strength DCH (mW) FACH (mW) Light Sleep (120mW), Idle (400mW), and High (600mW). The
High 600 300 power consumption is slightly different for transmit vs. receive but
Medium 800 300 since the difference is small and switching between these states is
Low 1500 400 very frequent, we use a common power value, denoted as the high
state.
Table 2: Cellular interface power variation with signal strength When not communicating, the interface remains in Deep Sleep.
for the AT&T network. Brief power spikes of 250mW at intervals of 100ms are observed
in this state, corresponding to reception of beacons from an asso-
Mobile Operators. The second setup uses a power meter at-
ciated AP. When a packet is to be transmitted, the interface moves
tached to the battery terminals of a smartphone to measure power.
to the High state immediately. If a packet is to be received, the ra-
We connected multiple devices from different mobile operators avail-
dio learns about it at the next beacon, and moves to the High power
able in our region: AT&T (Samsung Focus), T-Mobile (HTC HD7),
state. Once the transfer is completed, the radio moves to Idle. From
Verizon (HTC Trophy), and Sprint (HTC Arrive). T-Mobile and
Idle it can immediately move to High in case of a transmit or re-
AT&T use GSM based networks with the UMTS standard from
ceive. If no network activity occurs in Idle state for 1s the radio
3GPP for data. Verizon and Sprint use the Evolution-Data Op-
moves to the Light Sleep. The Light Sleep tail time is 500ms, after
timized (EVDO) standard from the CDMA2000 family provided
which, if no network activity occurs, it falls back to Deep Sleep. If
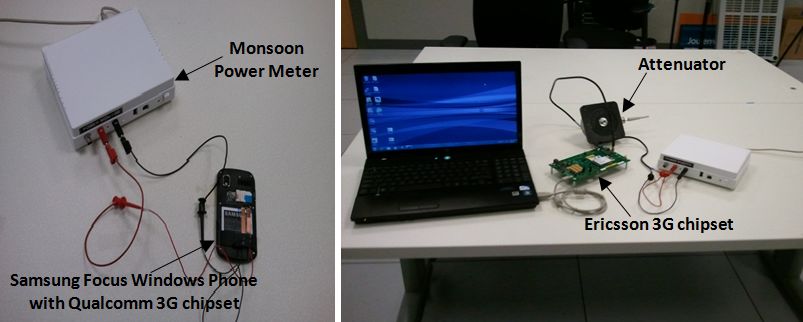
by 3GPP2. A sample power trace for a download using Sprint’s
network activity does occur in either the Idle or Light Sleep state,
network is shown in Figure 3. As expected, the radio stays in a
the state changes to High. Both Idle and Light Sleep states also
high power state long after the data communication has completed.
have regular spikes of additional 250mW of power spaced at 100ms
Similar measurements were performed for other operators and all
to receive beacons.
measured tail times are listed in Table 3.
The above power state transitions can be re-created, and energy
can hence be computed, using the (scaled) network packet trace
2500 captured using a network sniffing library.
2000 2.4 Display
Power (mW)
1500 As for other components we need to resource scale the display
and model its power consumption. Fortunately, existing mobile de-
1000 vice emulators already perform resource scaling for the display:
the emulated app is provided only a small screen area representing
500 the mobile device display. The only scaling needed is that the em-
ulator window may be re-sized to a larger view by the developer,
0 changing the number of pixels in the display and to overcome this,
0 5 10 15 20 25 one may simply multiply the number of pixels by the appropriate
Time (s) scaling ratio.
While the peak power of the display is similar to that of the CPU
Figure 3: Network tail energy measurement for Sprint. The and the network, the fraction of energy consumed by the display
data communication ends near time = 7s along the x-axis but can be much larger than the other components since the display is
the radio stays in a higher power state for an additional 10 sec- constantly active throughout an application’s use. An accurate esti-
onds after that. mation is thus important for this most dominant energy consumer.
The power model for the display depends on the display technology
used. Prior work has provided power models for LCD and OLED
2.3 WiFi Network displays [5, 25]. However, several modern mobile devices use Ac-
The resource scaling and power model methods for WiFi used tive Matrix OLED (AMOLED) displays, that do not fit existing
are as follows. models.
Resource Scaling: For cases where the developer machine is The OLED power model shows linear and additive properties:
connected to the Internet using WiFi (as is common for laptops), the energy consumption of the display as a whole is the sum of the
resource scaling is not needed. Otherwise, resource scaling is per- energy consumption of the R,G, and B components of the individ-
formed using the same layer 2.5 approach as for the cellular net- ual pixels. Further, the power model for the R,G, and B compo-
work. The scaling parameters are based on well-studied WiFi char- nents is linear, provided the colors are converted from the standard
acteristics [1]. RGB (sRGB) color space to linear RGB. This does not hold forAMOLED. Figure 4 shows the power measured for the AMOLED values is also different for the two colors: s2 is significantly greater
display (on a Samsung Focus smartphone) set to different colors. than s1.
The R,G and B components labeled are converted to linear RGB.
While the linear model holds at low magnitudes, it breaks down at RG - Meaured
1480
high magnitudes (the colors in the surface labeled B=255). RG - OLED Model
1280
BR - Measured s1
1080 BR - OLED Model
Power (mW)
880 s2
1400 680
1200 480
B=255
1000 280
Power (mW)
0 25 50 75 100 125 150 175 200 225 250
800
Linear R,G,B
600
400
Figure 6: Change in power with color.
200
300 B=0 With display technologies being highly proprietary, the exact
300 mechanisms used to control power are not widely available. Given
200
200 the dependence on color and lack of explicit knowledge of the
100
100
underlying power optimizations, the AMOLED power model be-
R 0 0
comes difficult to parameterize. Thus, we use a lookup table span-
G
ning the entire R,G,B gamut of values, discretized to 16 color mag-
nitudes per component, yielding a table with 16 × 16 × 16 = 4096
Figure 4: Power measurements for different colors on an entries. The entries of this table contain the power value measured
AMOLED display. if the entire screen was set to that color, and in effect models the
power scale down compared to the additive model at 100% area
Both the additive and linearity properties break down. As seen coverage for that color. The lookup table cannot be used directly
in the figure, power can increase or decrease with increasing color however because the power value does not follow the lookup ta-
component values, implying that linearity does not hold. More ble when a color occupies less than the entire screen, and then
measurements reveal that the power consumed is not just a func- its power consumption is closer to that predicted by the additive
tion the color of a pixel but also depends on the properties of the OLED model. Rather than fitting 4096 individual curves to model
other pixels in the image. Thus, the additivity does not hold ei- the area dependant power variation for the basis colors, we make a
ther. Figure 5 shows the power consumption at varying fractions simplifying approximation that is based on the observation that the
of the screen set to white. The graph shows the power predicted deviation from the OLED model is only significant for higher color
using the additive OLED model where the power would increase magnitudes. The deviation does become significant at different
linearly with the area, as well as the observed ground truth. Power threshold for different colors and we approximate that using four
decreases when a greater portion of the screen is emitting brighter different thresholds: one for R+G+B magnitude, and one each for
light levels. R+G, G+B, and B+R magnitudes, denoted τRGB , τRG , τGB and
τBR respectively. The power scale down is assumed to be propor-
2500 tional to the fraction of such high intensity pixels.
Measured OLED Model The final model is summarized as follows. Suppose the lookup
2000 entry for a color indexed by [r, g, b] by finding the nearest index in
the lookup table is denoted l(r, g, b). Let the power consumption
1500 of the entire screen, obtained by summing up the powers over all
Power (mW)
pixels of a screen-shot s, be denoted L(s). Suppose the fraction of
1000
pixels in s that exceed either of the thresholds τRGB , τRG , τGB and
500 τBR is denoted β(s). Also, suppose that the power consumption
for the display using the additive OLED power model is computed
0 as O(s). Then the power consumption when the screen display
10 30 50 70 90 matches s is computed as:
White display fraction (%)
Pdisplay = β(s) ∗ L(s) + (1 − β(s)) ∗ O(s) (1)
Figure 5: AMOLED power changes as the fraction of white One further optimization to the above model is that instead of
colored pixels changes. considering all pixel values on the screen, we could randomly select
a smaller fraction of the pixels and use those as representative of the
Further measurements reveal that reduction in power compared entire screen. The accuracy of this model along with sub-sampling
to the OLED model not only depends on the area but varies by is evaluated in Section 4.
color. Figure 6 shows an example measurement for two colors, From an implementation perspective, the pixel information of
compared with the OLED model based predicted values. While the the display is easy to obtain when an app is being emulated. We
predicted values are different for the two colors, what is important simply capture the developer machine’s screen and extract the re-
to note is that the difference between the measured and predicted gion corresponding to the emulator’s display area.For completeness, we also measured the power consumption of ecution time did not vary greatly across these tasks and for this pair
LCD displays with varying screen sizes at two different color levels of processors, the slow down was a factor of 7.2, implying that a
(Table 4). The LCD can be modeled using simply the brightness 100% CPU utilization on the phone processor can be approximated
level as the variation with color is not significant. As expected, using a 100/7.2 = 13.8% utilization of one core on the devel-
devices with different screen sizes do consume different amounts oper machine processor2 . The emulator can now be restricted to
of energy. a fraction of the overall processor that yields the same slow down
in execution speed. The fraction of restricted cycles is not exactly
Brightness Color 3.6in 4.3in equal to the desired slow down ratio since the emulator may have
Low Black 132 mW 294 mW additional overheads other than the execution of the test app3 .
White 127 mW 330 mW The actual mechanism to restrict the number of cycles allocated
Medium Black 363 mW 557 mW to the emulator depends on the operating system used on the de-
White 359 mW 573 mW veloper’s workstation. For instance, in Linux, one may use the
High Black 559 mW 778 mW cpulimit utility. In Windows the same can be achieved via re-
White 554 mW 790 mW stricting the emulator to a virtual machine and restricting the CPU
fraction allocated to it.
Table 4: Power measurements for LCD displays for HTC Ar-
rive (3.6in screen size) and HTC HD7 (4.3in screen size).
2.5.2 Power Modeling
Power models for the CPU are available in the literature [20] and
we used a simple utilization based power model where the CPU
2.5 CPU power is expressed as a linear function of the phone’s CPU utiliza-
Mobile devices use much lower power processors due to their tion:
battery constraints compared to the processors used on the devel- Pcpu = α ∗ ucpu (2)
oper workstations. The processor frequency, cache hierarchy, and
various computational units are different, resulting in very differ- Here, ucpu represents the phone CPU utilization and α is a power
ent execution performance across the two processors for the same model parameter. The CPU utilization measured by WattsOn for
computation. Since processor designs have been extensively stud- the emulator process on the developer machine is scaled according
ied, many techniques for emulating performance and power have to the scaling factor in Section 2.5.1 to obtain ucpu .
been developed for CPUs. We select resource scaling and power We measured the value of α on the Samsung Focus device for
modeling methods that are mutually compatible and work with the different computations. The above linear model being one of the
full system app energy emulation constraints. simplest CPU power models is not perfect, and actual power con-
sumption at the same peak utilization varied between 665mW to
2.5.1 Resource Scaling 781mW (a range of 16% w.r.t. the average) depending on type of
One approach to resource scaling would be to use a cycle-accurate computation performed. However, this model has the advantage
simulation of the processor. Detailed cycle-accurate simulation has that the scaling of the resource counter as described above works
excessive computational overheads, and is impractical, especially directly.
since it may not run in real time and result in inaccuracies and de- Other processor power models that are more accurate than equa-
lays in the timing of other components. The existing Android Emu- tion (2) are available in the literature. While they can be used for
lator uses instruction set simulation through binary translation, built run time energy profiling, their use in emulation is non-trivial be-
upon QEMU [16]. The Windows Phone Emulator similarly uses cause they require the use of multiple processor performance coun-
processor virtualization with support for memory and GPU emula- ters. Scaling all performance counters is challenging since most
tion. While these lighter weight approaches followed by Android of the additional counters are highly dependent on processor archi-
and Windows Phone emulators allow capturing certain CPU char- tectures that vary a great deal between the developer workstation
acteristics and memory limitations of the mobile device, they do not and the mobile device. For instance, the last level cache (LLC)
preserve the timing characteristics and do not model the processor miss counter is often found useful to improve power model accu-
architecture in sufficient detail to provide accurate resource coun- racy. However, given that the cache hierarchy varies drastically be-
ters. The Android Emulator allows for developer driven scaling of tween the two processors, scaling the LLC miss counter becomes
speed through a delay parameter that can take values between 0 and impractical. Using the linear model from (2) enables a reasonable
1000 to add a non-deterministic delay to the application execution. approximation at emulation time.
However, the choice of the delay input is left to the developer. GPU: Some of the other components are also significant from an
In WattsOn, we scale down the performance of the emulated app energy standpoint. The most notable one is the Graphics Processor
running on the development machine by restricting the number of (GPU). The GPU is mostly hardware managed and no software ob-
processor cycles available to the mobile device emulator. The goal servable metrics regarding its utilization level are easily available.
is primarily to preserve the timing characteristics on the CPU. This Power models for the GPU are thus not widely studied in the liter-
is only an approximation because the nature of computation can af- ature. Resource scaling for the GPU will also be non-trivial. We
fect how the number of cycles on one processor map to the other 2
The scaling factor can easily be adapted for a new developer ma-
processor, given that the processor architectures are vastly different chine by measuring the execution time for a known processing task
and aside from the number of cycles, the size of processor caches, for which the phone size execution time is already known
3
accelerators and bus speeds will matter as well. We compare the ex- This approach assumes that the multi-threading characteristics of
ecution time on a mobile device processor (Samsung Focus with a the app are preserved across the phone and workstation processors,
1GHz Scorpion CPU) and a development machine using a 2.7GHz i.e., if the app uses n threads on the phone, it will not use more
than n threads on the developer workstation and the slow down is
Intel Core-2 Quad-core processor for a few simply computational thus governed by the same bottleneck thread. The mobile device
tasks including floating point computations, fixed point computa- emulator generally ensures that this is indeed the case, especially if
tions, and memory intensive compute tasks. The slow-down in ex- the instruction set of the phone processor is being simulated.largely omit the GPU from our model. We measured the power configurations of test conditions are likely to emerge. The primary
consumption on a mobile device for several video playback tests overhead of including any new configurations is that a one time
and found that while some portion of the power measurement can measurement of that configuration must be performed with a hard-
be explained using the CPU and display, a significant portion re- ware power meter, and provided for download to all developers
mains attributable to the GPU: on an average 231mW across three using the tool.
different videos. Thus, if the emulated app is detected to be playing
video, we can add this power value for the duration that the video
is played. Other uses of the GPU such as graphics intensive games, 4. PERFORMANCE EVALUATION
are not covered by this approximation. The accuracy of the energy estimate produced by WattsOn de-
pends both on the correctness of resource scaling as well as the
3. IMPLEMENTATION accuracy of the power models used. To evaluate the overall perfor-
mance, we compare the estimated energy use as well as the mea-
Our implementation of WattsOn integrates the resource scaling
sured energy use for multiple tasks performed on the mobile device.
and power modeling techniques described above, with the Win-
Since apps cannot be downloaded to the emulator from the app mar-
dows Phone Emulator. Mobile emulators for other platforms such
ketplace, we developed our own apps to perform these tests.
as th Android and iOS also execute on the developer workstation
Application 1: Display only. We begin our evaluations with the
and most of our power models and network resource scaling tech-
display power model. While the LCD and OLED power models
niques apply to them as well. However, Android uses a different
are available in prior work, the AMOLED model is new and we
CPU emulation strategy and preservation of timing characteristics
evaluate its accuracy using an application that consumed energy
may require additional changes.
only in the display.
WattsOn also adds a graphical user interface that allows the de-
We first test the accuracy of our discretized lookup table that
velopers to explore multiple operating conditions for the run, such
only stored 4096 colors out of the possible 255 × 255 × 255 =
as network conditions (good, medium, bad), display brightness (low,
16581375, which is approximately only 0.024% of all possible
medium, high), phone brand and model, network carrier (AT&T,
color values. This test is performed with 100 random colors that
Verizon, T-Mobile, or Sprint), and received signal strength. Since
are not in the lookup table, set to occupy 100% of the display area.
display brightness and signal strength do not affect the timing of
This tests the accuracy of the modified AMOLED model for color
the app execution, these parameters can even be changed after the
dependent power scaling. Figure 8 shows both the estimated an the
test run and the energy estimates are updated on the fly using a
measured power and suffers from very little error.
previously obtained resource consumption trace.
The inputs to WattsOn include the power model parameters and
the resource scaling parameters, encapsulated for a specific device 1400
into an XML file. Energy use across multiple devices may be em- Measured
ulated by simply changing the parameter file, without requiring ac- 1200 Modeled
cess to a large number of physical devices. Errors
1000
The output of WattsOn includes: (i) a time series of power con-
Power (mW)
sumed for every component, and (ii) the total energy consumed. 800
Using the battery capacity specification, we can also estimate how
long the battery would last if a user continuously ran the app on 600
her phone. A screenshot of WattsOn output is shown in Figure 7.
The UI elements on the left allow the developer to change operating 400
conditions while the 4 graphs show the energy used on the network,
200
display, CPU, and the overall device respectively.
0
0 20 40 60 80 100
Color Number
Figure 8: Testing the AMOLED display power model with 100
random colors.
For a more realistic test, we use an application that simply dis-
plays a static image and performs no CPU or network activity.
Thirty different images encompassing various typical app displays
including simple GUIs to rich textures and photographic imagery
were included in this set. Figure 9 shows the measured and esti-
mated energy (using equation (1)) for all 30 images. The energy
estimated using 1% randomly selected pixels instead of consider-
Figure 7: WattsOn output showing energy data. The UI ele- ing all pixels is also shown. Again the model has very little error.
ments on the left allow varying emulated operating conditions
and technology characteristics. Another parameter worth exploring is the loss in accuracy suf-
fered if we sub-sample only a small fraction of the pixels rather
While the prototype implementation includes power models for than recording all pixels. Sub-sampling can reduce the display trac-
various environmental conditions such as multiple network signal ing data overhead and may be important for long running tests. We
strengths, user settings such as screen brightness, and also multi- report the incremental increase in error sub-sampling at 1% and
ple hardware technologies such as LCD and AMOLED, additional 0.1% of the pixels in Figure 10. Reducing to 1% from 100% does1500 2000
Power (mW)
Measured
Estimated, All Pixels
Estimated, Subsampled 1% 1000
1000
Power (mW)
0
0 5 10 15 20 25 30
Time
(a) Raw Trace
500
1000
Power (mW)
Measured
Emulated
0 500
5 10 15 20 25 30
Image Number
0
0 5 10 15 20 25 30
Figure 9: Measured and emulated energy for Application 1, Time
with 30 different images. Images are sorted by the measured
(b) Averaged over 1s
energy used.
not degrade the accuracy significantly (the gray bars indicating the Figure 11: Comparing measured and emulated energy for Ap-
loss in accuracy are very small). plication 2.
25 and emulated is shown in Figure 12. Each measurement is averaged
All Pixels over 5 random runs and the standard deviations are shown as error
Subsampled 1% bars. Since the resource scaling can behave differently from one
20 Subsampled 0.1% run to another, the emulated energy can also vary slightly across
runs. Overall, the emulated energy is lower since certain back-
ground activities are absent from the emulated trace. The mean
15
Error (%)
error across all these runs is 9.3%. The primary factors leading
to the error include any errors in the power model, the fact that
background activities cause the measured energy to be artificially
10 higher, and the error in resource scaling that may cause the emu-
lated CPU usage to be different from measured.
5
25 Measured
0
0 5 10 15 20 25 30 Estimated
Image Number 20
Energy (J)
Figure 10: Display model error when all pixels are considered, 15
or only 1% or 0.1% of the pixels are considered.
10
Application 2: Local Computation. This test is designed to
model applications that use the processor and display, without net- 5
work use or heavy graphics. The test app has a simple GUI, and
user clicks perform computations executing over 5s to 20s. An ex- 0
ample power trace captured using the power meter is showed in 5s 10s 20s
Figure 11(a). For the same task, the measured power trace aver-
aged over 1s intervals as well as power emulated using WattsOn Figure 12: Experimental evaluation of emulation accuracy for
is shown in Figure 11(b). Power was measured with the mobile Application 2.
device in the airplane mode to avoid cellular network background
activity. However, the device does have some background activity Application 3: Networked Apps. Next we consider applica-
as seen in the raw trace near time 13s, and such activity, being inde- tions that use the network in addition to the CPU and display. A
pendent of the app, should be excluded from consideration for the simple application is developed that can download files of different
app developer. This is difficult in the measured power but is easy sizes from a predetermined web server. A sample power measure-
when using WattsOn. ment is shown in Figure 13 and depicts the total power consumed
Performing such an evaluation for the three different compute by the display, network and CPU during one run. Performing the
units, the total energy consumed over a 30s period, as measured above test for different downloaded file sizes ranging from small toPower (mW) 2000 100
Measured Estimated
80
1000
Energy (J)
60
0
0 5 10 15 20 25 30 40
Time
20
Figure 13: Example data capture for Application 3.
0
large, and repeating each test 5 times, the measured and estimated Wiki ACM MSDN Goog NPS
energy use is shown in Figure 14. The emulation energy is close
enough for the developer to make the correct design choices based Figure 15: Accuracy evaluation for Application 4.
on the estimates provided by WattsOn. Average error is 4.73%
across all tests.
4.1 Case Study: Multi-Component
Optimization
30 Measured Let us consider an application that uses multiple components
(CPU, network, display) and has design options to increase or re-
Estimated
25 duce their use. A simple weather application suffices to demon-
strate the trade-offs involved. While the application is simple, it
Energy (J)
20 allows illustrating how the break-down of energy use across multi-
ple components provided by WattsOn helps understand the design
15 choices more clearly.
The developer has multiple design decisions to make that may
10 impact energy use:
5 1. Portability: The app may always download the entire con-
tent to be displayed from the web. Such application de-
0 signs are sometimes referred to as hybrid apps and using
1kB 100kB 1MB the HTML5 standard, such apps can operate seamlessly on
multiple platforms. Alternatively, the app may locally sup-
Figure 14: Estimated and measured energy for Application 3 ply bulk of the content including weather images and only
with varying download sizes. download succinct weather data from its web server. The lat-
ter approach reduces the amount of data downloaded from
the Internet at run time but requires a platform specific app
Application 4: Internet Browsing. This application downloads
implementation on each mobile platform of interest.
a webpage and renders it on the display. We test emulation accuracy
over five different web pages (Table 5) differing in content size and 2. Rich Graphics: The app may use different images for de-
complexity. The web pages are chosen to be static pages without picting the same weather condition: a simple cloud icon (such
variable advertisement content to make the experiment repeatable as Figure 16-(a)) only 18kB in file size, or a rich photo-
across a real device and WattsOn. graphic cloud image which requires a larger 138kB file to
Web page Size Images be stored or downloaded (Figure 16-(b)). Richer graphics
AMOLED Wiki Page 357kB 9 may allow for more sophisticated application UI designs but
ACM 353kB 16 at the cost of higher data sizes.
MSDN Mobile Apps 828kB 9 3. Animation: The developer could even use an animated im-
Google 117kB 4 age of moving clouds to create a more engaging user expe-
NPS/Yose 532kB 14 rience, e.g., an animated image with two frames, one frame
shown in Figure 16-(c), using a 90kB file. Animation would
Table 5: Webpages used for testing Application 4. use up processor resources, and possibly require a larger im-
age file than a simpler icon.
Energy is measured over a common session length of 50s for
each URL. A variable portion of the session is spent on fetching A quantitative energy cost estimate for each of the above three
the webpage for each case. There are variations across multiple app features is necessary for the developer to determine whether to
runs due to network and web server variability. The measured and include them, and WattsOn can provide that with very low devel-
estimated energy is shown in Figure 15. The average error over all opment overhead.
these experiments is 4.64% which is very similar to the variability The decision depends on understanding energy consumption in
in measurement one may observe even with real device measure- multiple dimensions. Simply optimizing the app for lower CPU
ments due to changing network conditions and device background utilization will not necessarily reduce energy. Also, the display
activity. power model depends on color implying that even two images thatlines [25] is a more recent work that presents tools for automated
execution of test benchmarks and measurement of power, to enable
generation of power models for various components on the mo-
bile device. The modeling approach was enhanced further in [6] to
eliminate the need for external power measurement equipment, by
using the battery drain measurements available on the mobile de-
vice itself. Aside from full system models, specific models for key
(a) (b) (c) components have also been studied in depth, including OLED dis-
plays [4], LCD displays [25], 3G cellular networks [17–19,21], and
Figure 16: Sample images considered for an app. WiFi networks [19]. We leverage these established power model-
ing techniques in our design, and where needed, expand the set of
models to cover additional technology variations.
appear similarly bright may consume different energy. Trying the Prior work has also looked at app energy accounting at run time.
multiple options in the app and recording the WattsOn output, while A key challenge for run time methods is the attribution of energy
running the app for the same duration in each case, we obtain the among multiple applications simultaneously using the device. In [24]
data summarized in Figure 17. resource usage of each component is tracked per application, and
power models from the data sheet specs are used to estimate app
80 energy. PowerScope [7] tracks the application with the active con-
Display CPU Network text on the processor (a single core CPU without hyper-threading
was used) and measures the power at fine time resolution. The total
60
power consumed when the application had active processor con-
Energy (J)
text is attributed to that application. Another powerful modeling
40 approach, eProf [15], traces system calls made by applications and
uses power state models for various components to infer energy
20 used. It can incorporate tail-energy use, such as when a component
remains in a higher energy state after the application is closed. We
leverage similar power models but rather than profiling on a real
0 mobile device we extend the work to enable energy emulation on
Image 1 Image 2 Image 3 the developer machine itself.
Energy emulation at development time has previously been de-
Figure 17: Energy breakdown into multiple components. veloped in Power TOSSIM [22]. However, the event based simula-
tion approach used in that work does not directly apply to mobile
Several facts become obvious from this data. First, even though app emulation due to the interaction with external resources such
Image 1 is much simpler and has a smaller file size, it does not help as web services and interdependence among the timing characteris-
save any energy on the network. This happens because for such tics of the network and other components. Different resource scal-
small downloads the network energy is dominated by the tail states ing techniques and compatible power models are hence required
of the radio. A related implication is that saving the images locally for WattsOn. Energy emulation methods using fine grained pro-
and only downloading the text data related to weather will not help cessor architecture models have also been developed [2]. However,
save much energy. Hence, including rich graphics and designing such models are not available for all key mobile device components
for portability has negligible energy overhead for this app. and have an extremely high resource overhead. Their use for full
Second, the display is consuming the largest fraction of the en- system emulation during app development with real time external
ergy for this scenario. Clearly an image that saves energy on the interactions remains an open problem.
display is likely to be beneficial, and other factors are less impor-
tant to worry about during app energy optimization. 6. CONCLUSIONS AND FUTURE WORK
Third, looking in detail at the component breakdowns, one also
notices that the CPU energy consumption of the third image is the In this paper we presented a system to estimate the energy con-
highest. Looking at the emulation output from WattsOn (not shown sumption of apps during development. This enables app developers
for brevity) also shows that, while for the first two images the CPU to use this feedback to write more energy efficient code. WattsOn
energy is nearly zero, after the download completes, the CPU is scales down the emulation environment (network, CPU, display) to
consuming an average of 150mW continually while Image 3 (ani- mimic the phone and applies empirically-derived power models to
mation) is displayed. Since WattsOn shows the exact overhead of estimate app energy consumption. This approach gives us the flex-
animation, the developer can determine if animation is important ibility to test an app’s energy consumption under various scenarios
for their app scenario or not. Armed with such data, the developer and operating conditions. While we leverage known power mod-
can also decide if the app should highlight important information, eling and resource scaling concepts, their combination for app en-
such as a hazardous weather alert, using brighter colors or anima- ergy emulation introduces certain constraints that requires a careful
tion. selection of compatible modeling and scaling techniques. We dis-
cussed such suitable techniques and experimentally validated their
use.
5. RELATED WORK We have prototyped WattsOn for the Windows Phone platform
WattsOn builds upon a large body of work on energy model- and shown its effectiveness for a variety of apps. Moving forward,
ing for phones [3, 6, 25]. The work in [3] focused specifically WattsOn is just the first step in improving the energy efficiency of
on a Palm device and measured several components including the apps. Other useful steps include obtaining energy measurements
CPU, LCD, device buttons, touch pen, and the serial link which from the wild to provide developer feedback based on real world
was the primary communication channel on that device. On similar usage patterns. Techniques to augment power models with realmeasurement data to overcome modeling limitations [14] are also systems, applications, and services, MobiSys ’11, pages
of interest. Together, we believe that these efforts will help de- 253–266, 2011.
velopers produce apps that will significantly increase the battery [14] J. C. McCullough, Y. Agarwal, J. Chandrashekar,
lifetime of mobile phones. S. Kuppuswamy, A. C. Snoeren, and R. K. Gupta. Evaluating
the effectiveness of model-based power characterization. In
7. REFERENCES Proceedings of the 2011 USENIX annual technical
[1] A. Balasubramanian, R. Mahajan, and A. Venkataramani. conference, USENIXATC’11, pages 12–12, 2011.
Augmenting mobile 3g using wifi. In Proceedings of the 8th [15] A. Pathak, Y. C. Hu, M. Zhang, P. Bahl, and Y.-M. Wang.
international conference on Mobile systems, applications, Fine-grained power modeling for smartphones using system
and services, MobiSys ’10, pages 209–222, 2010. call tracing. In Proceedings of the sixth conference on
[2] D. Brooks, V. Tiwari, and M. Martonosi. Wattch: a Computer systems, EuroSys ’11, pages 153–168, 2011.
framework for architectural-level power analysis and [16] Qemu: open source processor emulator.
optimizations. In ISCA, pages 83–94, 2000. http://wiki.qemu.org/Main_Page.
[3] T. L. Cignetti, K. Komarov, and C. S. Ellis. Energy [17] F. Qian, Z. Wang, A. Gerber, Z. Mao, S. Sen, and
estimation tools for the palm. In Proceedings of the 3rd ACM O. Spatscheck. Profiling resource usage for mobile
international workshop on Modeling, analysis and applications: a cross-layer approach. In Proceedings of
simulation of wireless and mobile systems, MSWIM ’00, International Conference on Mobile Systems, Applications,
pages 96–103, 2000. and Services, MobiSys ’11, pages 321–334, 2011.
[4] M. Dong, Y.-S. K. Choi, and L. Zhong. Power modeling of [18] F. Qian, Z. Wang, A. Gerber, Z. M. Mao, S. Sen, and
graphical user interfaces on oled displays. In Proceedings of O. Spatscheck. Characterizing radio resource allocation for
the 46th Annual Design Automation Conference, DAC ’09, 3g networks. In Proceedings of the 10th annual conference
pages 652–657, 2009. on Internet measurement, IMC ’10, pages 137–150, 2010.
[5] M. Dong and L. Zhong. Chameleon: a color-adaptive web [19] M.-R. Ra, J. Paek, A. B. Sharma, R. Govindan, M. H.
browser for mobile oled displays. In Proceedings of the 9th Krieger, and M. J. Neely. Energy-delay tradeoffs in
international conference on Mobile systems, applications, smartphone applications. In Proceedings of the 8th
and services, MobiSys ’11, pages 85–98, 2011. international conference on Mobile systems, applications,
[6] M. Dong and L. Zhong. Self-constructive high-rate system and services, MobiSys ’10, pages 255–270, 2010.
energy modeling for battery-powered mobile systems. In [20] S. Rivoire, P. Ranganathan, and C. Kozyrakis. A comparison
Proceedings of the 9th international conference on Mobile of high-level full-system power models. In Proceedings of
systems, applications, and services, MobiSys ’11, pages the 2008 conference on Power aware computing and
335–348, 2011. systems, HotPower’08, pages 3–3, 2008.
[7] J. Flinn and M. Satyanarayanan. Powerscope: A tool for [21] A. Schulman, V. Navda, R. Ramjee, N. Spring, P. Deshpande,
profiling the energy usage of mobile applications. In C. Grunewald, K. Jain, and V. N. Padmanabhan. Bartendr: a
Proceedings of the Second IEEE Workshop on Mobile practical approach to energy-aware cellular data scheduling.
Computer Systems and Applications, WMCSA ’99, pages In Proceedings of the sixteenth annual international
2–, 1999. conference on Mobile computing and networking, MobiCom
[8] R. Fonseca, P. Dutta, P. Levis, and I. Stoica. Quanto: tracking ’10, pages 85–96, 2010.
energy in networked embedded systems. In Proceedings of [22] V. Shnayder, M. Hempstead, B.-r. Chen, G. W. Allen, and
the 8th USENIX conference on Operating systems design and M. Welsh. Simulating the power consumption of large-scale
implementation, OSDI’08, pages 323–338, Berkeley, CA, sensor network applications. In Proceedings of the 2nd
USA, 2008. USENIX Association. international conference on Embedded networked sensor
[9] J. Huang, Q. Xu, B. Tiwana, Z. M. Mao, M. Zhang, and systems, SenSys ’04, pages 188–200, 2004.
P. Bahl. Anatomizing application performance differences on [23] W. L. Tan, F. Lam, and W. C. Lau. An empirical study on the
smartphones. In Proceedings of the 8th international capacity and performance of 3g networks. IEEE
conference on Mobile systems, applications, and services, Transactions on Mobile Computing, 7:737–750, June 2008.
MobiSys ’10, pages 165–178, 2010. [24] H. Zeng, C. S. Ellis, A. R. Lebeck, and A. Vahdat.
[10] S. Jha. Poorly written apps can sap 30 to 40% of a phone’s Ecosystem: managing energy as a first class operating system
juice., June 2011. CEO, Motorola Mobility, Bank of America resource. In Proceedings of the 10th international conference
Merrill Lynch 2011 Technology Conference. on Architectural support for programming languages and
[11] H. V. Madhyastha, T. Anderson, A. Krishnamurthy, operating systems, ASPLOS-X, pages 123–132, 2002.
N. Spring, and A. Venkataramani. A structural approach to [25] L. Zhang, B. Tiwana, Z. Qian, Z. Wang, R. P. Dick, Z. M.
latency prediction. In Proceedings of the 6th ACM Mao, and L. Yang. Accurate online power estimation and
SIGCOMM Conference on Internet Measurement, IMC ’06, automatic battery behavior based power model generation
2006. for smartphones. In Proceedings of the eighth
[12] J. Manweiler, S. Agarwal, M. Zhang, R. Roy Choudhury, and IEEE/ACM/IFIP international conference on
P. Bahl. Switchboard: a matchmaking system for multiplayer Hardware/software codesign and system synthesis,
mobile games. In Proceedings of the 9th international CODES/ISSS ’10, pages 105–114, 2010.
conference on Mobile systems, applications, and services, [26] X. Zhao, Y. Dong, H. tao Zhao, Z. Hui, J. Li, and C. Sheng.
MobiSys ’11, pages 71–84, 2011. A real-time congestion control mechanism for multimedia
[13] J. Manweiler and R. Roy Choudhury. Avoiding the rush transmission over 3g wireless networks. In Communication
hours: Wifi energy management via traffic isolation. In Technology (ICCT), 2010 12th IEEE International
Proceedings of the 9th international conference on Mobile Conference on, pages 1236 –1239, nov. 2010.You can also read