Tourism and Transport in New Zealand - Implications for Energy Use Susanne Becken
←
→
Page content transcription
If your browser does not render page correctly, please read the page content below
Tourism and Transport
      in New Zealand

    Implications for Energy Use

                     Susanne Becken

                     Report No.54/2002
Tourism and Transport
in New Zealand –
Implications for Energy use
Source of advertisement: www.purenz.com
TRREC Discussion Paper
July 2002
Susanne Becken
beckens@lincoln.ac.nz
This discussion paper is part of a PhD project on energy use in the New Zealand tourism sector. The research is
supported by Non Specific Output Funding of Landcare Research New Zealand Ltd and the Human Sciences
Division at Lincoln University through the supervision of Prof. David Simmons.Contents
Contents ..................................................................................................................................i
List of Tables ......................................................................................................................... ii
List of Figures ....................................................................................................................... ii
Equation ................................................................................................................................ ii
Chapter 1 Introduction .................................................................................................3
Chapter 2 Transport in Tourism Studies .......................................................................4
Chapter 3 Energy Use of the New Zealand Transport Sector........................................6
Chapter 4 Supply of Transportation – A Tourism Perspective ......................................7
Chapter 5 Energy Intensities of Transport Modes ........................................................9
5.1 Road Transport ...................................................................................9
5.2 Rail, Sea and Air Transport ..............................................................12
5.3 Comparison Between Alternative Modes ..........................................12
Chapter 6 Options to Reduce Energy Use and Emissions ...........................................15
6.1 Efficient Use of Vehicles ..................................................................15
6.2 Modal Shift ......................................................................................16
6.3 Regional Promotion..........................................................................17
6.4 Economic Mechanisms .....................................................................18
6.5 Alternative Technologies ..................................................................19
Chapter 7 Conclusion ................................................................................................21
References ............................................................................................................................22
iList of Tables
Table 1 Average fuel consumption per 100 km (MoT, 1995)............................................... 10
Table 2 Energy consumption for different vehicle types in New Zealand............................. 13
Table 3 Comparison of different transport modes for a trip from Christchurch to Dunedin .. 14
List of Figures
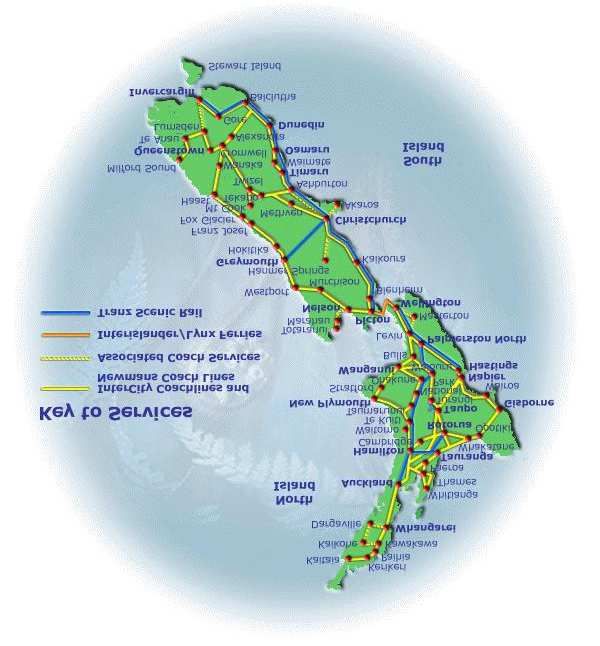
Figure 1 Routemap of the Travel Pass New Zealand (InterCity Coachlines, 2001).................. 8
Equation
Equation 1 Energy intensity of a specific transport mode............................................................ 9Chapter 1
Introduction
Securing and conserving our long term future is the number one objective of the recently
released New Zealand Tourism Strategy (2001). Previous research showed that an essential
impediment to achieving sustainable tourism is the heavy use of transport by tourists and the
environmental impacts resulting from this travel (Müller, 1992; Gössling, 2000). The
associated energy use is a major concern, since it does not only undermine the goal of
efficient resource use as outlined by the New Zealand Tourism Strategy 2010, but it also
contributes to the failure of New Zealand in achieving its goals set by the Kyoto Protocol in
1997. This report discusses previous research in this field, describes the present transport
sector’s greenhouse gas emissions in New Zealand, discusses the supply of tourism transport
infrastructure, and provided senergy intensities of main New Zealand transport modes.
Different transport modes are hypothetically juxtaposed on an analysis of a journey from
Christchurch to Dunedin. Suggestions for reducing transport energy use are discussed.
Clearly, to achieve the stakes set by both the Tourism (Tourism Strategy Group, 2001) and
the Energy Strategy (Energy Efficiency and Conservation Authority [EECA], 2001), transport
of tourists plays a critical role.Chapter 2
Transport in Tourism Studies
Transport has long been part of tourism studies. In a tourism system approach, for example,
transportation connects tourist generating and destination regions via transit routes (Leiper,
1990). Hall (1999) distinguished four different roles of tourism transport: 1) transport to get to
the host destination, 2) transport to ensure mobility within a destination, 3) mobility within a
tourist attraction, and 4) travel along recreational routes. Clearly, transport is not only a means
to get from one place to another, but it also constitutes an attraction in itself as in the case of
cruising trips, scenic flights, and railway journeys (Page, 1999). Despite the existence of
tourism research related to transport, Page (1999) argued that attempts to build a framework
for transport and tourism, with the aim of understanding the tourist’s need for transportation
and the significance of transport for the tourist experience, have so far been unsuccessful.
Previous research on transport and tourism reflects different disciplines and viewpoints. For
example, geographical studies on the travel behaviour of tourists analysed the spatial
movement with different transports modes (e.g. Oberdries & Forer, 1995; Oppermann, 1995).
Technological innovations in transport have strongly influenced travel behaviour, and, by
reducing travel times and costs, led to a physical and psychological “shrinking” of the world
(Tolley & Turton, 1995). In particular the development of jet aircraft has supported the steady
growth of tourism. Consequently, the field of air travel has attracted both transport and
tourism researchers. The main areas of interest are global and regional passenger or tourist
flows (Oppermann & Cooper, 1999; Schafer & Victor, 1999), air travel demand now and in
the future (Crouch, 1994), economic impacts associated with air travel (Raguraman, 1997)
and regional (tourism) development (Bowen, 2000; Prideaux, 2000).
While air travel is seen as important facilitator for tourism, it is also criticised for its
"!
# $ %& "'%(*)+ $,-/.0 0 012%3
& 4 -56 67.98+:Interdisciplinary questions on tourism and transport have rarely been analysed. This may be
explained by uncertainties about an unknown range of impacts due to tourists’ travel
behaviours, along with the general constraint of differentiating between tourists,
recreationists, and non-tourists. Hall (1999) identified the lack of such a discriminatory policy
as an important obstacle to introduce policies, such as road pricing, carbon taxes or other
restrictions on road usage. This has often inhibited discussions on environmental problems
and the internalisation of adverse effects.
5Chapter 3
Energy Use of the New Zealand Transport Sector
Transport is the dominant sector in terms of energy consumption in New Zealand, accounting
for 40.1 per cent of the total energy use (442.3 PJ) in 2000 (Ministry of Economic
Development, 2001). Total CO2 emissions from fuel combustion were 27 million tonnes in
1999, with transport making up 43.2 per cent of this figure. This makes transport the single
largest source of CO2 emissions in New Zealand. This is not only critical with regard to
climate change and New Zealand’s international agreements, but also in terms of dependence
on imported fossil fuels. Of the 767.3 PJ total primary energy supplied in New Zealand in
1999, 223.1 PJ (29.1%) stem from imported oil (ibid). Most of this imported oil (about 90%)
is used by transportation.
The energy use of the transport sector is increasing at an annual rate of 3.8 per cent and is
expected to make up about 52 per cent of the total consumer energy by 2020 (EECA, 1999a).
These figures include passenger and freight transport, whereby passenger transport accounts
for 65 per cent of all transport energy use. Passenger transport breaks down into a share of 89
per cent (99 PJ) for cars, 7.4 per cent for domestic air travel (8 PJ), 2.9 per cent for buses (2.1
PJ), and 0.3 per cent for rail transport (0.3 PJ) (EECA, 1999b, p.4). New Zealand has the
second highest car ownership in the world with 69 vehicles per 100 people (Gillespie, 2001).
New Zealand is furthermore characterised by an inefficient and ageing fleet of cars that is not
subject to any emission controls (ibid.).
The New Zealand Tourism Satellite Account (TSA) 1997 reports tourism industry ratios,
which give the proportion of industry’s gross output that is consumed by both domestic and
international tourists (Statistics New Zealand, 2001). From these ratios, it can be seen that
tourism contributes considerably to the transport industries. Tourists consume 23 per cent of
the products supplied by the (aggregated) ‘Road passenger and Rail Transport’ industry, 17
per cent of the ‘Water Transport’ industry, and 81 per cent of air transport. In addition,
tourism induces demand for commodities that are transported to tourism resorts. This kind of
transport is reflected in the share of 29 per cent within the ‘Other Transport, Storage and
Transport Services’ industry (Statistics New Zealand, 2001). According to the TSAs 1998-
2000, 45 per cent of all tourist expenditures (international and domestic) are on transport, with
air transport making up 23 per cent of total expenditures, other transport 12 per cent, and
retail of fuel and automobile products 10 per cent (ibid).
6Chapter 4
Supply of Transportation – A Tourism Perspective
In the year ended 2000, almost a third of all international visitors travelled by domestic air at
some stage during their stay in New Zealand. All together, Air New Zealand transported 4.46
million passengers within New Zealand. The network of Air New Zealand National and Air
New Zealand Link (Air Nelson Limited, Eagle Airways Limited, Mount Cook Airline
Limited) provides more than 430 flights a day to 26 destinations throughout New Zealand
(Air New Zealand, 2000). Additionally, there are several locally operating airlines, such as
Sounds Air (Picton to Wellington) or Mt Aspiring Air. Air New Zealand’s revenue from
domestic passenger sales increased by 21 per cent in 2000, accompanied by an increase in
total domestic seat capacity of 4.7 per cent. The load factor (average passenger occupancy)
increased to 67 per cent, which almost equals the factor of international flights (70%) (Air
New Zealand, 2000). The connection between air travel and public road transport is relatively
good, with all but five of the airports linked to scheduled transport to and from the airport.
Road transport is the most frequent form of travel for tourists, with private and rental cars,
camper vans, and coaches being the most popular modes. New Zealand’s road network offers
57,772 km of sealed roads, of which 18.5 per cent are State Highways, 27.0 per cent are urban
and the remaining 54.4 per cent are rural roads. In addition, there are 34,281 km of unsealed
roads (Transit New Zealand, 2001). Some of the roads are built or sealed particularly for
tourism purposes, such as the Milford Sound road. The currently ongoing discussion about the
construction of roads in the Hollyford Valley and the Kahurangi National Park also has a
strong tourism link. The transport network is a large cost producer, with one kilometre of
sealed road costing the country between $3,030 (local roads) and $24,370 (State Highways)
per year for maintenance (Transit New Zealand, 2001).
Rental cars are used by 32.8 per cent of all international tourists (Tourism New Zealand,
2001). Telecom New Zealand’s Yellow Pages list 919 rental car and 16 rental motorcycle
companies in New Zealand. Along with the rental car or motorcycle, companies often offer
so-called ‘self-drive’ holidays with a suggested itinerary and pre-booked accommodation. An
example of such an itinerary starts in Christchurch, leading to Franz Joseph (West Coast),
Queenstown, Te Anau and Milford Sound, Dunedin, and back to Christchurch. This itinerary
covers 1,930 km in seven days, with the first and fifth day being stationary. ‘Fly and Drive’
packages include the international flight and a hired vehicle, and also offer tour suggestions,
such as the ‘Kiwi Grand 23 Days and 22 Night Tour’, a “…monster holiday in NZ featuring
top tourist spots in the North - Paihia, Rotorua and Coromandel, and a complete South Island
circuit - lakes, mountains, wilderness, forests, and glaciers”(Wings’n Wheels, 2001).
Another increasingly popular mode of road transport is the camper van or motor home. At
least 36 companies (Telecom New Zealand’s Yellow Pages) offer camper van hire, with the
Australian-based Britz being among the largest. The daily cost ranges between $67 and $303,
depending on size (two to six persons) and season. Britz has operated in New Zealand since
1994. During this time it has continued to expand, with the company having recently ordered
(for purchase) more than 200 new Mercedes vans (Britz Camper van Rentals, 2001). Besides
self-driven, individual tours, there is a broad spectrum of organised tours and public transport.
Classical organised tours offer a complete package of transport, accommodation, and
activities, and can be booked both overseas and in New Zealand. A more casual form of
organised coach travel is the backpacker bus, used by 3.3 per cent of all international visitors
7(Tourism New Zealand, 2001). Kiwi Experience, for example, offers ‘Backpacker Passes’,
ranging from $284 (min. 8 days, North Island) to $1013 (min. 28 days, complete New
Zealand circuit), and serves about 30,000 backpackers per year with 18 buses (pers. comm.
Kiwi Experience, May 2001).
New Zealand offers an extended network of public transport with scheduled buses, mainly
InterCity and Newmans Coachlines (Figure 1.). Several discounted and flexible coach passes
have been developed to suit the needs of independent travellers. InterCity offers eight passes
on the North Island (e.g. Coromandel Trail Pass, Twin Coast Discovery) and seven on the
South Island (e.g. West Coast Passport, Milford Bound Adventurer). Passes cost for example
$119 (North Island Value Pass from Auckland to Wellington) or $142 (East Coast Explorer,
from Picton to Dunedin). The ‘Travelpass New Zealand’ combines bus, ferry, and/or rail and
air.
In addition to the large networks there are smaller coach and shuttle operators that often
operate on a local level, which allows them to adapt to diverse travellers’ needs. For example,
Abel Tasman Coachlines operates regularly between Nelson and Abel Tasman National Park,
offering both transport-only options and one-day packages including a water taxi cruise (New
Zealand Tourism Online, 2001). The New Zealand train network is another transport option,
comprising eight long-distance trains (Figure 1), some of them with “panoramic wagons”
(TRANZ Rail Holdings Ltd., 2000). However, due to financial restrictions there is currently
debate to what extent the existing network will be maintained.
Figure 1: Routemap of the Travel Pass New Zealand (InterCity Coachlines, 2001)
8Chapter 5
Energy Intensities of Transport Modes
Energy consumption varies considerably between different modes of transport. Although
international literature on vehicles’ energy consumption is abundant (e.g. Waters, 1992;
Maibach et al., 1995), country specific factors need to be taken into account. Moreover,
energy figures vary due to different research frames, for example the consideration of primary
energy instead of consumer (secondary) energy. The extension from consumer energy to
primary energy consumption can result in differences of more than 20 per cent (Lenzen,
1999). The energy figures used in this study are mainly derived from reports of the New
Zealand Ministry of Transport (1995, 1997) and EECA (1999b) and are therefore reported as
consumer energy. Some modal components (camper vans, motorcycles, recreational boats)
required additional investigations to determine respective energy intensities.
Energy intensities are either expressed as energy use per vehicle km (MJ/km) or per passenger
km (MJ/pkm) depending on the availability of passenger load factors. Another parameter is
energy use per available seat km, which reflects the maximum potential for energy intensity
of a vehicle. The fuel consumption for a specific mode of transport depends on several factors
(Van den Brink & Van Wee, 2001):
• Vehicle-specific fuel consumption (L/km)
• Fleet composition (e.g. age of vehicles, fuel source, vehicle types)
• Calorific value of fuel
• Other factors (e.g. load, driving behaviour, road type distribution)
The vehicle fleet composition is an important factor, as for example the introduction of
modern cars or a change in the diesel to petrol car ratio alter the average fuel consumption.
Therefore, the energy intensity measure in megajoules per kilometre (MJ/km) of a specific
transport mode is calculated by multiplying each vehicle type’s share within the fleet (e.g.
number of diesel and petrol cars) with the specific consumption and the energy content of the
fuel (e.g. diesel and petrol cars). Consequently, the vehicle types’ shares of the energy
intensity are added up for all types within a mode (Equation 1). The energy content is based
on gross calorific values (GCV) (Baines, 1993).
Equation 1: Energy intensity of a specific transport mode
>@? AB4CD%EGF9AHJIKML N O%P
QMR
SUTWV$XZY\[^]J_G`abc de_gfihjkc dlXmVJnfo[^h p c h c"p
j
kc dc ]rq`s k$ba$`tj3uh`
5.1 Road Transport
A study on road transport in New Zealand by the MoT (1995) compiled data on the average
fuel consumption of commonly used road vehicle types (Figure 1). These figures appear to be
low compared with the average fuel consumption of 9.65 L/100 km for New Zealand cars in
1997 (EECA, 1999b) and the average fuel consumption of the Australian fleet of 11.5 L/100
km (Lenzen, 1999). Nevertheless, the MoT figures were applied in this study, since they
constitute the most comprehensive and disaggregated data source available in New Zealand.
9Table 1: Average fuel consumption per 100 km (MoT, 1995)
Car Rental – Petrol
Car Ex-Overseas –
Taxis – Petrol
Bus - Diesel
Car - Petrol
Car - Diesel
Bus - Petrol
Motorcycle
Car – CNG
Car - LPG
Petrol
Fuel
consumption 9.2L 9.5L 9.0L 6.7L 6.6L 47.9L 62.3L 3.5L 8.2kg 7.7kg
rate1
1. L: L/100 km; Kg: kg/ 100km
5.1.1 Private and Rental Cars
Generally, diesel cars use less fuel than petrol cars, which can be explained by the more
efficient combustion technology (Van den Brink & Van Wee, 2001). Moreover, the New
Zealand fleet of diesel vehicles is younger on average (7.6 years compared with 10.6 years for
all cars) (MoT, 1998a). Vehicles previously registered overseas made up 16 per cent of the
fleet in 1992 (MoT, 1995, p. 53). Considering the greater energy use of these ex-overseas cars
compared with other petrol cars, the average consumption of a petrol car was assumed to rise
from 9.2 to 9.3 L/100 km (Table 1).
According to the MfE (2000), the New Zealand car fleet consisted in 1999 of 93.7 per cent
petrol and 6.2 per cent diesel cars. The alternative fuel sources CNG, LPG and electricity
contributed less than 1 per cent, and are therefore not considered in the following calculations.
By applying Equation 1 (see above) for private cars, the average energy use was calculated to
be 3.16 MJ per km. The Automobile Association (AA) (pers. com., April 2000) reports an oil
consumption of 1 litre per 2,500 km for petrol cars. This was assumed to be similar for diesel
cars. The energy use per kilometre thus increased slightly to 3.18 MJ per km. This compares
to the range of 3-4 MJ per km in other OECD-countries (EECA, 1999b).
Rental cars are on average 2.8 years old, explaining the more efficient energy use. However, it
is argued that despite the technically more advanced rental car fleet, increasing use of
technical extras, such as air condition, possibly outweighs or encompasses this effect (EECA,
1999a). The fleet of rental cars comprises a larger proportion of diesel vehicles (11.2 %)
compared with petrol cars (88.6 %). Only 0.21 per cent of all rental cars use gas (either CNG
or LPG) or other energy sources (MoT, 1997) and, therefore, are not considered any further in
this analysis. As there is no information on the consumption of rental diesel cars, it was
assumed that it is similar to that of private diesel cars. Hence, the energy consumption of
rental cars was calculated to be 2.33 MJ per km or 2.35 MJ, including both fuel and oil.
5.1.2 Camper Vans
Most camper vans are diesel fuelled (approximately 80 %), with the remaining vans using
petrol (20 %) (pers. com. Maui, Kea Campers and Kiwi Campers, February, 2000). The
average fuel consumption for diesel vans is 11.8 L/100km and for petrol vans 13.4 L/100km.
According to the three companies interviewed, oil is consumed with a rate of one litre per
2,000 km. Considering the proportion of diesel and petrol camper vans, the average energy
intensity is 4.52 MJ/km including fuel, and 4.54 MJ/km including fuel and oil. No previous
research on the energy use of camper vans could be found to verify these figures.
105.1.3 Coaches (tour buses and scheduled buses)
The coaches category comprise a variety of vehicles either classified by weight or by number
of seats. EECA (1999b) reports an average fuel consumption of 30-50 litres per 100 km for
buses over 12 tonnes in OECD countries. Buses in Great Britain, consume 42 litres per 100
km for 46-seaters and 44 litres per 100 km for 53-seaters (Waters, 1992). For consistency
reasons, this study refers to the New Zealand figures (Table 1), although they seem somewhat
elevated. New Zealand buses mainly use diesel (91.7%, compared with 8.3% petrol) (MoT,
1998a, p. 47). Electric buses in Wellington were excluded, as they are not particularly tourism
related. The oil consumption of coaches was assumed to be one litre per 5,000 km (pers.
com., Coach Service Centre Christchurch, March 2000). Consequently, an average coach
consumes 23.1 MJ per km for fuel and 23.2 MJ per km for fuel and oil.
This energy intensity as energy use per vehicle km is employed for organised coach tours and
backpacker buses, when the passenger loading is known. Since, however, it is difficult to
obtain data on occupancies of scheduled coaches (e.g. InterCity), it is practical to use average
passenger numbers and, hence, energy use per passenger-kilometre (pkm). The New Zealand
intensity of 0.75 MJ per pkm (EECA, 1999b) compares to 0.85 MJ per pkm for Australian
public country buses (Lenzen, 1999), and to 0.65 MJ per pkm for public transport in
Scandinavia (Carlsson-Kanyama & Linden, 1999).
5.1.4 Motorcycles
Motorcycles use 3.5 litres of petrol per 100 km (Table 1). This is consistent with information
obtained from Christchurch companies stating a consumption of 4.5 litres per 100 km petrol
and one litre of oil per 5000 km (pers. com. motorcycle retailer, March 2000). Based on a
consumption of 3.5 litres per 100 km and the oil use above, the energy use of a motorcycle
equals 1.22 MJ/km. This compares to 1.88 MJ/km primary energy use for motorcycle in Great
Britain (Waters, 1992).
5.1.5 Shuttle Buses and Vans
Some assumptions were necessary to calculate the energy use of shuttle buses and vans. A
shuttle bus or van is a vehicle carrying a maximum of 12 passengers, including the driver. The
fuel consumption was presumed to be that of light goods vehicles of 9.7 L/100 km for petrol
vehicles and 7.9 L/100 km for diesel vans (MoT, 1997). The total fleet of light commercial
vehicles consisted in 1998 of 58.8 per cent petrol and 41.2 per cent diesel vehicles (MoT,
1998). Therefore, an average shuttle or van consumes 3.21 MJ/km. Assuming the same oil
consumption as for cars, the total energy use is 3.22 MJ/km.
5.1.6 Hitchhiking
Hitchhiking involves stopping vehicles that are already ‘en route’. In this study, hitchhiking
was considered to be a form of car-pooling, which results in an increased vehicle occupancy
and, thus, decreased energy use per passenger. Since the average occupancy of cars in New
Zealand is 2.15 persons (EECA, 1999b), a hitchhiker enhances this to 3.15 passengers.
Building upon the calculated energy consumption for private cars of 3.23 MJ/km an average
energy use of 1.03 MJ/km for hitchhikers was calculated.
115.2 Rail, Sea and Air Transport
5.2.1 Rail Transport
Rail transport in New Zealand is mainly freight transport, as only eight passenger trains exist.
The energy intensity of rail transport is 1.44 MJ/pkm in 1998 (EECA, 1999b). This is
relatively high compared with other OECD countries, mainly due to low occupancy rates, and
hilly terrain that only allows for short trains.
5.2.2 Sea Transport
Sea transport comprises inter-island transport (Cook Strait), other ferries (e.g. Great Barrier
Island or Stewart Island), and transport with recreational boats. The vessels serving Cook
Strait use diesel and heavy marine diesel. The average energy consumption of a vessel for the
96 km-one way trip is 275,340 MJ (based on Tranz Rail 2000 figures). Except for the Lynx,
all vessels carry freight and passengers. A weighting of freight (tonnes) and passengers
(numbers) was undertaken by applying a similar procedure as used to calculate energy
intensities of aircraft, where one passenger accounts for 90 kg multiplied by a factor of 1.7
(considering on-board equipment and staff) (Knisch & Reichmuth, 1996). Energy use was
calculated per tonne and, thus, allocated to freight and passenger service. Since each vessel
transports different loads of freight in relation to passengers, the calculated energy use per
passenger ranges between 8.10 MJ/pkm (passenger vessel) and 0.52 MJ/pkm (vessel with
dominantly freight transport). By weighting the actual passenger numbers on each vessel in
1999, the average energy use resulted in 2.40 MJ/pkm.
Other ferries operate to connect off-shore islands with the main land. The most important
ones are Stewart Island and Great Barrier Island. The energy use of 8.70 MJ/pkm for a ferry
ride to Stewart Island is known from previous research (Becken, 1999). Other ferries are
assumed to be similar to vessels operating in Australian transport systems, such as Sydney
harbour ferries (3.53 MJ/pkm) (Lenzen, 1999).
According to a Christchurch boat retailer (pers. com. J. O’Grady, April 2000) an ‘average
family boat’ with a 90 hp outboard motor and a cruising speed of 55 km/h consumes
approximately 15 litres of petrol per hour. Consequently, the fuel consumption is 0.27
litres/km, translating into an energy use of 9.4 MJ per km or 9.6 MJ per km including oil
(considering a petrol to oil ratio of 50:1).
5.2.3 Domestic Air Transport
The total aviation turbine fuel supply in 1992 amounted to 823 million litres plus an
additional 5.1 million litres of Aviation gas. This is equivalent to 30.5 PJ of energy, shared
between international air (71%) and domestic air (29%) (MoT, 1995). Technological
improvements lead to a continuous decrease in fuel consumption, which is now reported to be
2.75 MJ/pkm (EECA, 1999b).
5.3 Comparison Between Alternative Modes
A direct comparison of the different transport modes’ energy intensity was made based on per
passenger energy use (Table 2). This was calculated by using average load factors gained in a
tourist survey on New Zealand’s South Island (West Coast). A more detailed description of
the survey is provided elsewhere (Becken, Simmons & Frampton, 2001). Sea and air transport
12appeared to be high-energy modes, and the camper van was the most energy intensive vehicle
in the medium energy use category. Low energy modes are collective or public transport
vehicles (coaches and shuttles), the motorcycle and backpacker buses. It can be seen that the
energy intensity depends strongly on the vehicle occupancy, which, for example, leads to the
efficient use of mostly fully booked backpacker buses, compared with other organised coach
tours. Caution needs to be exercised due to the small sample sizes for calculating load factors
(e.g. 11 for recreational boats, 29 for backpacker buses). The occupancies need to be validated
for further research.
Table 2: Energy consumption for different vehicle types in New Zealand
Energy use per
Energy use per vehicle Average load factor
Transport mode passenger kilometre
kilometre [MJ/vkm] [pax]
[MJ/pkm]
High energy modes
Stewart Island Ferry NA NA 8.70
Other Ferries NA NA 3.53
Domestic Air NA NA 2.75
Cook Strait Ferry NA NA 2.40
Medium energy modes
Camper van 4.54 2.20 2.06
Recreational boat 9.62 5.49 1.75
Train NA NA 1.44
Private car 3.25 3.16 1.03
Hitchhiking 3.25 3.16 1.03
Coach (tour bus) 23.10 22.9 1.01
Rental car 2.35 2.50 0.94
Low energy modes
Scheduled coach NA NA 0.75
Motorcycle 1.22 1.40 0.87
Shuttle bus, van 3.22 5.46 0.59
Backpacker bus 23.10 39.8 0.58
NA= not applicable/available
When planning a trip, tourists probably consider mainly two aspects: convenience and cost.
Environment could be a third aspect in future planning. Convenience may be measured as
travel time along with other factors, such as transfers and baggage allowance. In a study on
snow sport recreationists travelling to ski fields in Switzerland, the number of transfers was
used to measure ‘comfort’ associated with different transport modes (Trösch & Messerli,
2000).
A hypothetical journey from Christchurch to Dunedin was analysed to compare transport
alternatives with regard to convenience, cost, and energy use (Table 3). This example was
chosen because it represents a commonly travelled route, which is equally served by a wide
range of different modes. The travel distance from Christchurch to Dunedin is 362 km (329
by air), and can be travelled in between three and a half hours (by air including time spent on
transfer and check-in) and seven hours (by train or public bus). The car is convenient in that it
is readily available and allows for larger amounts of luggage. Since the shuttle service offers a
free pick-up, no transfer is necessary. However, this pick-up system may increase the travel
time, if many passengers are picked up and dropped off at numerous places. The remaining
transport modes all require additional transport (or walking) to and from the terminal.
Luggage restrictions apply mainly for the plane. Transport costs depend on the travel time, the
time booked in advance, discount fares (e.g. student), and special offers. The aircraft is the
most costly option, whereas bus travel is comparatively cheap. The per capita cost for the
13rental car depends on the number of passengers. The cheap train fare refers to a ‘backpacker
fare’, whereas the $89 fare represents a standard adult fare. The highest energy use is
associated with air travel. However, a car with a single person consumes almost as much
energy. The shuttle bus operates efficiently, since it is usually well occupied. With three
passengers in a rental car, the per capita energy use is lower than that of train passengers.
Regression analysis between travel cost and energy use for the alternatives demonstrates that
92 per cent (F=45.6, p= 0.003) of the variation in energy use can be explained by the
(respective cheaper) travel fares (66% for the standard fares with F= 8.1 and p= 0.046). This
means that expensive transport modes are also likely to be energy intensive ones. Saving
energy is often equivalent with saving money.
For many other trips between two locations in New Zealand the chosen transport mode
depends to a stronger degree on the origin and destination. For example, for trips between the
North and South Islands, air travel gains some advantage in travel time and cost when
compared with the alternative of car and ferry travel. Furthermore, connections between main
centres are considerably shorter when travelled by plane compared with road travel. In
contrast, remote locations often lack a connection to the public transport network, and the
private car appears to be the single possible travel mode.
Table 3 Comparison of different transport modes for a trip from Christchurch to
Dunedin
Energy
Mode Travel time Cost (NZ$) Comments
use (MJ)
Rental car Pick up/drop off
5 hrs $603 (car) + $38 (petrol) = $98 851
(1 person) car
Rental car Pick up/drop off
5 hrs $20 (car) + $13 (petrol) = $33 283
(3 persons) car
6 hr 45 min (train)
$40 - $79 (train) + transfer (0-10) Transfer, baggage
Train + 15 min (transfer) 521
= $40 - $89 limit
= 7 hrs
InterCity/ 6 hr 45 min (bus) +
$24 - $48 (bus) + transfer ($0 - $10) Transfer, baggage
Newman’s 15 min (transfer) 272
= $24 - $58 limit
Coachlines = 7 hrs
Shuttle1
5 hrs $35 214 Free pick-up
(5.5 persons)
2hrs (flight inc.
check in) + 30min $96 - $224 (flight) = $10 - $40
Transfer, baggage
Domestic Air2 (check out) + 1hr (transfer to and from airport) 905
limit
(transfer) = $106 - $264
= 3hrs 30 min
1) South Island Connections
2) Air New Zealand one-way fare
3) Fare for a small rental car for one day
14Chapter 6
Options to Reduce Energy Use and Emissions
6.1 Efficient Use of Vehicles
The most efficient use of an independent vehicle is the one that is adapted to the actual needs
of the traveller. Often these needs are ‘over-matched’, as for example in the case of hired
four-wheel drive vehicles, solely because of fashion reasons and a greater flexibility that most
tourists won’t ever exploit. It appears that rental companies promote hiring powerful vehicles
to increase revenue. Not only type or make can be chosen wisely, but also the size. Customer
choice should consider the actual number of people who will travel with the vehicle. An
increase in passenger number for a given vehicle, for example by ride share or car-pooling,
will improve its efficiency. A current practice in backpacker hostels, for example, is the
informal advertisement of rides on black boards, mostly on the basis of expense sharing. It is
conceivable to establish a formal, generally accessible (via the Internet) database for tourists,
similar to the rideshare programme developed by EECA for staff/students at Lincoln and
Canterbury University (EECA, 2000a) to connect tourists with similar itineraries or travel
lags. This may appeal to free independent travellers (FITs)
Driving behaviour can effect the fuel consumption considerably. For example, ‘aggressive
driving’ as compared with ‘restrained driving’ increases the specific fuel consumption by
about 30 per cent (Van den Brink & Van Wee, 2001). The use of air-conditioning increases
the fuel bill by 10 to 15 per cent, and an extra load of 100 kg increases the fuel consumption
by another 7 to 8 per cent (ibid). Changing driving behaviour and increasing public awareness
were found to be among the most promising measures to reduce passenger transportation
emissions in Canada (Transportation Association of Canada, 1999). Information brochures
with fuel saving tips are already distributed by Budget Rent-a-Car in Europe (Green Globe
Asia Pacific, 2000). Optimising driving behaviour does not only concern tourists, but also
operators who offer transport services as part of their tourism business. A number of case-
studies report on possible measures, such as driving at a constant speed of about 95 km/h,
adjusting tyre pressure, and driver training (Green Globe Asia Pacific, 2000). Reducing the
fuel bill is a win-win-win situation for the tourist, the company and the environment.
An interesting idea are so-called ‘City Centre Car Clubs’ or ‘ Pay-as-you-use personal
transport’ developed in Europe, which offer flexible rental options for commuters or other
users in cities. Cars are hired for as little as an hour and are charged on a time and mileage
basis. These systems were designed to work hand in hand with public transport systems and
the hire of cycles (Green Globe Asia Pacific, 2000). Obviously, the reason behind such
programmes is to reduce pollution, congestion and parking problems. These arguments are
not as viable in the New Zealand context, especially in rural and remote areas where many
tourist attractions are located. Nevertheless, the introduction of more flexible rental systems
based on the city examples could benefit rental companies by increasing customer numbers,
tourists by offering adapted rental schemes, and the environment by a wiser use of rented
vehicles. The current system, which is based on daily (unlimited kilometres) rental fares, does
not encourage tourists to reduce travel distances or to refrain from the car for a whole day. A
fare-system, which puts more emphasis on the mileage, would provide a more realistic price
for car usage and constitute an incentive for travelling less.
15Time efficiency is not the major issue in travel (Høyer, 2000), and it could be assumed that
slow means of transport that often stops on the way could be made more popular. Often, the
tourist does not gain anything by travelling fast to a destination and missing out points of
interest en route. A ‘gain in time’ leads to the need for further activities and entertainment at
the destination. By considering travel as an attraction in its own right, slower transport modes
offer a greater chance to relax and enjoy the environment. In this sense, energy for transport is
used more efficiently, the longer it takes to travel. For example, cyclists travel at a very slow
pace, strongly motivated by exploring the area in more detail and experiencing nature and
scenery (Ritchie, 1998). In fact, cycle tourists spend 75 per cent of their time on cycling
(ibid), and consequently have a lower demand for other, potentially energy consuming,
activities. In contrast, air travellers reach their destination quickly at the expense of a large
amount of energy, and have additional time to participate in other activities (e.g. jet boating).
6.2 Modal Shift
A modal shift from individual motorised transport to public or non-motorised transport would
reduce overall energy costs for transport. The modal share is strongly influenced by broader
transport policy and planning and the allocation of funds and labour. In New Zealand, the
strong emphasis on road transport and the neglecting of public transport have supported the
trend towards increasing use of private vehicles. A study by Transit New Zealand found that
the sealing of the Milford Sound road caused a shift from bus travel to individual car travel
(Travers Morgan New Zealand Ltd, 1995). A similar study in Waipoua Forest on the North
Island showed that the sealing of roads increased visitor numbers, particularly those of
holiday-makers (Booz•Allen & Hamilton New Zealand Ltd, 1997). In terms of planning for
public transport, Eaton and Holding (1996) emphasise that national targets need to be
complemented by localised targets.
6.2.1 Public Transport
Public transport is often rejected for several reasons, among them inconvenience, cost, and
inflexibility. To overcome these barriers, the Transportation Association of Canada (1999)
identified the following factors for inter-city travel with public transport: 1) increasing the
price of car and air travel, 2) subsidising public transport, 3) improving speed and
convenience of bus and rail, 4) improve terminals, 5) co-ordinate carriers, and vi) provide
adequate information on the systems.
In terms of tourism, locals often resist the substitute of individual travel by collective forms
because they fear that tourists chose another destination instead of adapting to public transport
systems (Eaton & Holding, 1996). In fact, it was found that public transport to National Parks
is only accepted if the transport constitutes an experience in its own right, for example as in
the case of “novelty vehicles” (Eaton & Holding, 1996, p. 63). Following this idea, the
development of special packages at various locations is conceivable. National Parks that are
accessed from a centre and not from a transit route are best suited for such projects. While, for
example, Milford Sound, Mount Cook, and Urewera National Park, are situated at a ‘dead
end’ in terms of main tourist trunks, Arthur’s Pass, Paparoa, Tongariro and Westland National
Park are likely to be transited by tourists in their own vehicle anyway. Packages could take
several forms. First, a scheduled bus without any interpretation provides a basic and cheap
transport option. Second, guided one-day tours with interpretation of the surrounding natural
or cultural environment could attract people with special interest, who join an organised tour
for the sake of ‘learning something’. Third, bus passes or packages for several days with a
16‘hop-on hop-off system’ constitute a flexible alternative to explore one region or National
Park (e.g. ‘Magic Bus’, Northland Pass).
6.2.2 Cycle Tourism
Although little research has been done on cycling in relation to tourism, there is potential of
growth, especially in the market of FIT’s (Free Independent Travellers) (Ritchie, 1998). The
key element of tourist cycling seems to be that it is perceived as an integral part of the holiday
(Lumsdon, 2000). In New Zealand, it was found that cycle tourists belong mainly to the group
of ‘extreme cyclists’ whose main travel purpose is cycling. Only 50 per cent of them use or
intend to use a mode of transport other than the bike. Moreover, the cycle market consists of
backpacker-like, individual travellers staying for a long time (Ritchie, 1998). This is different
in Europe, where cycle tourism is often experienced by families as a short break holiday.
The implementation of cycle networks seems crucial for the successful promotion of cycle
tourism. As noted by Lumsdon (2000), isolated cycle trails tend to stimulate day visitation,
which is often car based and does not lead to a reduction in motorised transport. The
successful UK National Cycle Network, for example, offers 5000 miles of connected cycling
routes on traffic-free trails, traffic-calm roads, and minor roads (Lumsdon, 2000). Besides a
connection between cycle paths, the access to a cycle route or network from urban centres is a
critical point. The Danube Cycle Route in Austria is a good example of the successful
integration of a cycle route in public transport systems. The route, which goes from Passau to
Vienna, is linked to bus, boat and train services, and recorded an increase of almost 50 per
cent from 1987 to 1991 (ibid). In New Zealand the development of such routes is in its
infancy, with many road controlling authorities perceiving cycling not to be an important
mode of transport (Cambride & Francis, 2000). There is both a lack of understanding of
cyclists’ needs and consistent guidelines for designing cycle paths (ibid). Consequently, the
main drawbacks perceived by cycle tourists are quality of driving, overall road safety, and
biking services (Ritchie, 1998). Isolated initiatives in urban centres such as Christchurch and
Hamilton, and the establishment of scenic or historic cycle routes, such as the Otago Central
Rail Trail, are first steps in this direction. The Otago Central Rail trail opened in 2000 and
offers150 km of trail and 60 bridges to cyclists and walkers (EECA, 2000b). Despite not
being part of a network, there is a service offering collective transport from Dunedin. The
ongoing existence of such projects, however, depends strongly on their promotion as tourist
attractions, as was found for the alternative Catlins Southern Scenic Route, which serves as an
example of effective marketing (Ritchie, 1998).
Apart from the obvious benefits resulting from cycling and cycle tourism, such as health
issues, reduced congestion and pollution, cycling is also a promising means of dispersing
tourists and their expenditures into more rural, peripheral areas. Finally, cycling appears to be
a very cost-efficient alternative to motorised road transport: an 8000-mile network would cost
the same as three miles of urban motorway (EECA, 2000b).
6.3 Regional Promotion
New Zealand is often promoted as country, where very different scenery and attractions can
be visited within a short holiday time. The average travel distance of international tourists is
estimated to be between 3,000 and 4,000 km. Camper van companies, in particular, engage in
promoting freedom and flexibility with slogans, such as “for people who are going places”
(Paradise Motorhome Rentals) and “where the journey is the adventure” (Britz Camper van
17Rentals). This counteracts the objective of decreasing travel distances. Instead, a longer stay
within a region could be promoted to: 1) reduce vehicle usage, 2) provide the tourist with an
in-depth experience on a smaller scale, and 3) disperse tourist spends more widely on a local
level.
The idea of regional promotion fits well in the objective of improving regional management
as declared by the New Zealand Tourism Strategy 2010. Marketing and attracting a large
number of tourists to a region are not the overarching goal any longer, but sustainably
managing tourists at one destination. For example, the supply of a large variety of activities
that are accessible by a collective shuttle transport from a centre (as for example in the case of
Queenstown) could satisfy tourists’ needs for experience and excitement, while keeping them
‘off the road’. Along these lines, Tourism New Zealand suggest on their web-page “100 per
cent Pure New Zealand” travelling only one island, when being in New Zealand for a limited
time (2000). Moreover, this site offers a regional descriptions of New Zealand with a range of
options for activities within each region. Not only it is important to keep touring tourists more
local or regional, but also to attract new groups that arrive explicitly for the attributes of a
specific region. This happens currently with the Australian marketing strategy, where it was
found that New Zealand’s image is more attractive, when selected features are promoted
separately (e.g. beach holiday in the Bay of Islands or tramping in Fiordland). Ski tourism is
probably the one product, where regional marketing is already in place.
6.4 Economic Mechanisms
Economic mechanisms to manage fuel consumption have been described as a ‘carrots and
sticks’ analogy (Holding, 2001). Incentives for sound travel alternatives (‘carrots’) are often
favoured by the public and politicians, but alone are considered insufficient, while ‘sticks’,
being more efficient at changing behaviour, are unpopular and generally opposed by the
public. A possible ‘stick’ is full cost pricing, that would include costs already charged for the
use (e.g. insurance), plus costs met by direct government subsidies (e.g. highway
construction), external costs (e.g. pollution and accidents) (Transportation Association of
Canada, 1999).
The Transportation Association of Canada (1999) identified different views on fuel taxes.
Supporters of fuel taxes think that currently low fuel prices neither provide an incentive to
develop more efficient technologies, nor encourage people to change their travel behaviour.
The pricing of fuels would be a step towards the consideration of external environmental costs
in transportation, and could be used to fund more environmentally sound (public) transport
projects. However, opponents argue that fuel taxes do not guarantee changes in consumer
behaviour and are the source of inequity in several aspects. The trucking business and sectors
that depend strongly on trucking are put at a competitive disadvantage. Also, exports could
suffer from price increases. Both lower-income earners and the rural population are hit harder
than high-income earners or urban dwellers. Finally, the study suggests that fuel taxes could
harm tourism, and lack a general political and public support (Transportation Association of
Canada, 1999, p. 116). In Canada fuel prices would have to more than double to decrease
emissions to the level targeted by the Kyoto Protocol. New Zealand had already started
thinking about petrol taxes in the early 1990s and already had suggested implementing taxes
by 2000 if the Kyoto targets were not reached (Ministry for the Environment, 1997 and 1998).
This has not happened so far, however, in a recently released discussion document, the New
18Zealand Government suggests an emission charge of not more than $25 per tonne of CO2
equivalent after 2007 (New Zealand Climate Change Project, 2002).
6.5 Alternative Technologies
There are several reasons for switching to cleaner fuels. First, increasing carbon dioxide
emissions jeopardise the stability of the global climate. Second, other pollutions, including the
formation of ground-level ozone, hydrocarbons, and sulphur dioxide decreases the air quality
of humans’ living space. Finally, alternative fuels or technologies offer new choices for
consumers and decrease their dependency on oil (Environmental Protection Agency [EPA],
2001).
When comparing alternative technologies and fuels it is critical to analyse the complete life-
cycle, since some fuels may emit little or no carbon dioxide during vehicle use, but during
vehicle manufacture or other upstream activities (Transportation Association of Canada,
1999). The use of electricity, for example, has the potential of zero emissions when generated
from renewable energy sources. When, however, generated in thermal power plants (e.g. coal
or gas) emissions can be high, in particular as a result of the poor efficiency (approx 36%) of
electricity generation (MED, 2001). It is argued by the German Office of Technology
Assessment at the German Parliament (Büro für Technikfolgen-Abschätzung beim Deutschen
Bundestag [TAB] (2000) that emissions other than carbon dioxide can be more effectively
controlled at power plants than at a large number of mobile sources.
The same applies for fuel cells that run on hydrogen, which is produced using energy from
renewable sources or from petroleum fuels. Fuel cells generate electricity through a chemical
reaction of hydrogen and oxygen to produce water as a by-product. This is a highly efficient
mean to store and generate power, compared with traditional combustion engines. Hydrogen
is considered a long-term option for transportation (TAB, 2000). Hydrogen fuel cells based on
renewable energy sources are favourable with regard to all parameters, while those based on
fossil fuels are still cleaner with regard to acidification and photo-smog than conventional
engines (ibid). Fuel cell vehicles cost about NZ$2,000 more than present diesel vehicles, and
NZ$ 5,000 more than petrol vehicles in a high production scenario (TAB, 2000). While
hydrogen fuelled public transport is already in place (e.g. Canada and Germany), cars will be
produced for the general market by 2004 (EECA, 2000a). EECA (2000a) argues that, based
on the availability of renewable sources and the growing dependence on imported oil, New
Zealand has a great potential, and need, for the use of fuel cells.
Another alternative is the hybrid-electric-drive vehicle, which has two power sources
(electricity and petrol or diesel), and shows reductions in carbon dioxide emissions of
between 20 and 25 per cent (Transportation Association of Canada, 1999). After being
introduced in Japan and Germany, the hybrid car entered the New Zealand market (WWF,
2000). Hybrid cars are seen as an intermediate step to the mass production of fuel cells
(EECA, 2000b)
The use of compressed natural gas (CNG) and liquefied petroleum gas (LPG) reduces carbon
dioxide emission by about 25 per cent. The gases contain less carbon, the recovery and
processing are less energy intense (Transportation Association of Canada, 1999), and other
emissions (e.g. carbohydrates) are less toxic (EPA, 2001). A clear drawback is the
inconvenience of accommodating the heavy high-pressure tanks. Propane is a by-product of
19petroleum refining and is widely used as transport fuel. Bio-diesel (e.g. ethanol) can be
extracted from corn and blended in gasoline with different results in emission reductions for
different mix ratios. E85 (ethanol blended in up to 85% petrol) achieves reductions of about
40 per cent. The advantage of lower mix ratios (e.g. 10%) is that cars do not require changes
in the fuelling system (Transportation Association of Canada, 1999).
The Transportation Association of Canada (1999) identified several barriers to the
introduction of alternative fuels. First of all, new technologies tend to have a higher purchase
price, since mass-production is still to develop. Furthermore, public refuelling stations for
alternative fuels are lacking, and people are restricted in their travel flexibility. In addition, the
range of the vehicle is shorter compared with traditional combustion engines. There is also
concern about the reliability and utility of alternative vehicles (e.g. luggage space). In New
Zealand the trend toward LPG vehicles is declining. However, cities seem to be increasingly
interested in low-emission vehicles, mainly to reduce pollution problems. Christchurch, for
example, introduced three electric buses (backed up by a diesel engine) that circle the city
centre and allow free travel for everyone.
20Chapter 7
Conclusion
Transport is a crucial requirement for tourism, since the key characteristic of tourists is their
mobility. This mobility, however, has increased dramatically in the last decades; mainly as a
result of technological progress and an increase in disposable incomes. While high mobility in
itself is the main driver underpinning environmental concern, it is also the popularity of
energy inefficient transport modes that results in increasing energy use and the emission of
greenhouse gas emissions. Despite a considerable increase in efficiency, air travel is still a
large energy consumer, when compared with other transport modes on a per passenger per
kilometre basis. Only water transport, especially on the open sea, consumes more energy per
passenger kilometre than air travel. This, however, is of less concern, since overall passenger
numbers of water transport are comparatively small and travel distances are generally short.
Clearly, individual transport modes, such as the car and the camper van, are other important
sources of energy use. Energy intensity is strongly dependent on vehicle occupancy. A fully
occupied car is competitive with public transport, while offering additional convenience with
regards to availability, transfer, and luggage.
The New Zealand infrastructure is strongly concentrated on road transport, with an extended
network and a considerable amount of money spent on sealing of new roads and road
maintenance. As opposed to European countries, New Zealand does not provide a competitive
rail network. Moreover, New Zealand trains are not superior to other transport modes due to
their relatively large energy intensity, and inconveniences for travellers associated with
additional transfers to and from railway stations.
A strategy to reduce tourists’ energy use for transport will have to address stakeholders at
different levels, as well as the tourists themselves. Tourists can contribute by travelling wisely
and changing transport behaviour toward more efficient use of their vehicles, shifting to
public transport or zero energy modes (at least for parts of their holiday) and reducing overall
mobility by staying longer at one destination. Governmental and industrial actions have to
encourage and support these behavioural shifts. Incentives (‘carrots’) to travel less distance
and use alternative means of transport are conceivable, as are penalties (e.g. taxes) for non-
efficient travel. Government action should also be directed towards supporting new and
energy-efficient technologies. To reduce travel distances, a shift from New Zealand’s
promotion as ‘touring destination’ to a more regional focus seems an unavoidable step. Travel
passes for an ameliorated network of public transport could support this trend. Tourism New
Zealand (2001) identified the need for “city guides that outline public transport routes” that
encourage tourists to explore local activities, events, and sights. It is important to keep in
mind that “…a tourism which is developed detached from the restrictions implied in a
sustainable mobility, will not be in accordance with demands for sustainable development”
(Høyer, 2000, p. 156).
21You can also read