Post-COVID-19 travel behaviour patterns: impact on the willingness to pay of users of public transport and shared mobility services in Spain ...
←
→
Page content transcription
If your browser does not render page correctly, please read the page content below
Awad-Núñez et al. European Transport Research Review                  (2021) 13:20                                                   European Transport
https://doi.org/10.1186/s12544-021-00476-4
                                                                                                                                        Research Review

 ORIGINAL PAPER                                                                                                                                     Open Access

Post-COVID-19 travel behaviour patterns:
impact on the willingness to pay of users
of public transport and shared mobility
services in Spain
Samir Awad-Núñez1* , Raky Julio2 , Juan Gomez2 , Borja Moya-Gómez2                                                   and Julián Sastre González3

  Abstract
  Background: The COVID-19 crisis has meant a significant change in the lifestyle of millions of people worldwide.
  With a lockdown that lasted almost three months and an impulse to new normality, transport demand has suffered
  a considerable impact in the Spanish case. It is mandatory to explore the effect of the pandemic on changes in
  travel behaviour in post-COVID-19 times.
  Methodology: A nationwide survey was carried out during the lockdown in Spring 2020 to overview the recent
  changes. The survey collected both stated preferences (socio-demographic characteristics and mobility-related
  attributes), and revealed preferences (individuals’ habits, especially in the frequency of the trips according to the
  trip purpose, and opinions regarding the willingness and acceptability of these changes, and which actors would
  have to drive them, and how) of individuals. This paper aims to study and understand the willingness to adopt a
  set of measures to improve the safety conditions of public transport and shared mobility services against possible
  contagion from COVID-19 and the willingness to pay for them.
  Results: The results obtained show that some measures, such as the increase of supply and vehicle disinfection,
  result in a greater willingness to use public transport in post-COVID-19 times. Similarly, the provision of covers for
  handlebars and steering wheels also significantly increases individuals’ willingness to use sharing services. However,
  respondents expect that these measures and improvements would be implemented but maintaining the same pre-
  COVID-19 prices. The results of this research might help operators deploy strategies to adopt their services and
  retain users.
  Keywords: Post-COVID-19 mobility, Post-COVID-19 travel behaviour, Heckman modelling, Discrete choice modelling

1 Introduction and state of knowledge                                                     The first confirmed cases appeared in Wuhan, China,
The lifestyles of a large worldwide population have                                    in December of 2019. Despite the local government’s ef-
abruptly changed during the first half of 2020. The                                    forts to contain the disease, it rapidly extended world-
COVID-19 pandemic, caused by the virus SARS-CoV-2,                                     wide [23, 26]. By January 30, 2020, the World Health
is the first pandemic in decades that nearly stopped the                               Organization (WHO) declared COVID-19 as a Public
world, and its most adverse impacts are yet to be seen                                 Health Emergency of International Concern [35]. By
further in time.                                                                       March 11, 2020, the WHO updated its status, declaring
                                                                                       it as a worldwide pandemic [36].
* Correspondence: samir.awad@universidadeuropea.es                                        Governments had to deploy severe measures to con-
1
 Department of Civil Engineering, Universidad Europea de Madrid, Villaviciosa          tain the virus spreading and try to flatter the incidence
de Odón, Spain
Full list of author information is available at the end of the article                 curve. The standard strategy laid on two main

                                       © The Author(s). 2021 Open Access This article is licensed under a Creative Commons Attribution 4.0 International License,
                                       which permits use, sharing, adaptation, distribution and reproduction in any medium or format, as long as you give
                                       appropriate credit to the original author(s) and the source, provide a link to the Creative Commons licence, and indicate if
                                       changes were made. The images or other third party material in this article are included in the article's Creative Commons
                                       licence, unless indicated otherwise in a credit line to the material. If material is not included in the article's Creative Commons
                                       licence and your intended use is not permitted by statutory regulation or exceeds the permitted use, you will need to obtain
                                       permission directly from the copyright holder. To view a copy of this licence, visit http://creativecommons.org/licenses/by/4.0/.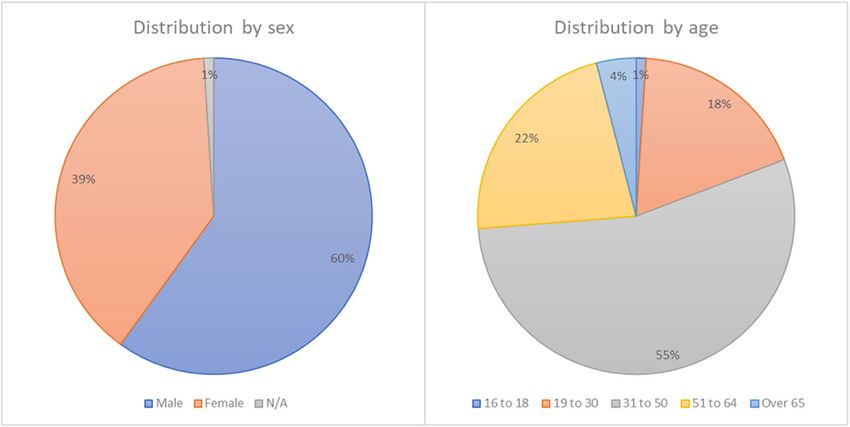
Awad-Núñez et al. European Transport Research Review   (2021) 13:20                                                    Page 2 of 18

fundamentals: to restrain mobility and promote social                 academics, as WTP is the central input for pricing and
distancing. Mobility restrictions were applied at different           decision making [33] In the field of transportation, WTP
levels, at local and regional ones (e.g., restraining the             has been widely studied in many different aspects, such
length of walking or motorised displacements), and at                 as public transport crowding reduction [25], road safety
national and even international levels (closure of entire             [30], and facilities improvements [31], among others.
regions [10]), as the burden of COVID-19 patients col-                   As noted in Haghani et al. [18], the COVID-19 “has
lapsed hospitals on the most severely affected countries.             triggered an avalanche of scientific research, both within
   Social distancing in Western Europe was positively en-             and outside the medical domain”. Even though the infor-
couraged, when not mandatory. In Spain, one of the                    mation generated is vast, this exhaustive analysis of
most affected countries by COVID-19 during spring                     COVID-19’s scientific publications has evidenced the
2020, a mandatory lockdown was decreed on March 15                    lack of research on the effects of the COVID-19 pan-
to avoid physical-social interaction by closing schools               demic on transportation. Previous studies have mainly
and most of the economic activities and allowing citizens             focused on the relationship between transportation and
mobility only to a few activities, such as going to the               disease spread processes, such as modelling and simula-
grocery or access to medical care [8]. Moreover, some                 tion, both on short-scale commuting flows [12] and
Spanish regions enabled preventive measures before the                long-distance airline traffic [6]. A research gap may then
mandatory lockdown. For instance, the region of Madrid                be identified regarding the study of WTU and WTP for
enacted closing schools on March 11 [7], and almost all               COVID-19-safety measures on urban transportation ser-
of them recommended reducing physical-interactions.                   vices. In this context, this paper explores individuals’ ac-
These measures, known as non-pharmaceutical Inter-                    ceptability towards a set of generic measures related to
ventions (NPIs) were already used on previous airborne                biosafety in the field of mobility in Spain, such as the
pandemics, such as influenza outbreaks [1, 29] and their              mandatory use of face masks, gloves, intensive disinfec-
effectiveness was evaluated by Jefferson et al. [22] or               tion protocols, and their influence on the use of different
Fong et al. [16]. Some recent studies assess the effective-           shared transport modes.
ness of these measures on COVID-19 [9, 27].                              This research topic is of particular importance due to
   During the lockdown in Spain, mobility to workplaces               the imminent reduction in transport demand in the
dropped 80% compared with pre-COVID-19 trends [17,                    short-term after the lockdown. Then it will be crucial
28]. The most affected mode was public transport rather               for transport operators to deploy strategies and mea-
than private cars [4]. Moreover, Spain reported the low-              sures to retain users and reverse the negative tendency,
est vehicle miles travelled (VMT) in Europe, with only                first being aware of the WTU the available transport op-
12% of the pre-COVID-19 VMT during the second week                    tions and then understanding the WTP for these mea-
of April [21]. The lockdown in Spain was partially loos-              sures. To that end, we conducted a nationwide survey in
ened by the end of May, and a period of “new normality”               Spain, which was carried out during the country’s lock-
started, in which the most severe measures were slightly              down period.
eased, but preserving some fundamentals of the NPIs.                     This paper is structured as follows. Section 2 shows
   Due to this extreme change in people’s habits, the                 the methodology, the modelling approach, and the first
COVID-19 pandemic may have pervasive effects on the                   findings of the descriptive analysis of the survey. Section
way people interact and travel later on. The implications             3 presents modelling results and discussion. Finally, Sec-
of social distancing might be drastic. It can be expected             tion 4 sets out the main conclusions of the research.
that people will travel less and try to avoid public trans-
port [14]. Shared options such as car-sharing, moped                  2 Methodology
scooter-sharing, bike-sharing, or ride-hailing may be less            This paper explores individuals’ willingness to use and
attractive, given the fear of exposure to the virus [20].             to pay for using public transport and shared mobility
Meanwhile, walking and private cycling might gain par-                services given a set of COVID-19 safety measures to be
ticular importance [32]. To keep users, operators of pub-             implemented after the lockdown. Due to the particular
lic transport and shared mobility services will have to               circumstances during lockdown conditions, neither face-
invest resources in biosecurity measures [15] to satisfy              to-face focus groups nor interviews were feasible. There-
governmental requirements and give users a higher                     fore the required information was collected via online
safety sensation that encourages their use. Many ques-                surveys, from April 28, 2020.
tions arise on individuals’ willingness and acceptability
of these measures, which actors should impulse them,                  2.1 Survey
and how.                                                              The survey was structured into three main sections: (1)
   Willingness To Use (WTU) and Willingness To Pay                    socio-demographic information, (2) mobility behaviour
(WTP) are highly relevant concepts for managers and                   in pre-COVID-19 pandemic times, and (3) the possible
Awad-Núñez et al. European Transport Research Review   (2021) 13:20                                                       Page 3 of 18

user adoption of post-COVID-19 adaptations of public                  order to correct the problem of sample selection bias.
transport and transport sharing services.                             Below, its most essential aspects are outlined.
   The survey included questions regarding both Re-                     Heckman approach is a two-equation model, eq. 1: se-
vealed Preferences (RP) and Stated Preferences (SP).                  lection, and eq. 2: outcome. First, willingness-to-use a
Firstly, RP questions characterise individuals’ socio-                specific mode of transport (Yn) is a binary variable mod-
demographic and mobility behaviour, including travel                  elled in the selection equation. It indicates whether each
frequency according to the purpose of the trip, and the               case in the sample is observed or unobserved. Particu-
transport mode was chosen for each particular purpose.                larly, Yn = 1 if the individual n would be willing to use a
These questions refer to the situation before and after               specific transport mode in post-COVID-19 times; 0
the lockdown. Secondly, SP questions foresee the                      otherwise. Second, the dependent outcome variable to
changes in the habits and collect respondents’ opinions               be estimated is yn (willingness to pay for using a specific
towards some potentially implemented measures. These                  transport mode in post-COVID-19 times), which is an
measures are related to possible post-COVID-19 adapta-                ordinal variable in our model. Willingness to pay was
tions of public transport and shared mobility services                collected in the questionnaire, and is expressed in the
(car-sharing, moped scooter-sharing, bike-sharing, and                model in relative terms (that is, percentage increase over
kick scooter-sharing) and hailing services (including                 current prices) to adapt to the different levels of prices
ride-hailing and taxi). Therefore, these questions capture            and to purchase power across metropolitan areas and re-
individuals’ acceptance of each measure and their will-               gions in Spain. Data on yn are only available if Yn > 0.
ingness to pay if they involve an extra cost that the                 Both variables yn and Yn are jointly modelled in the
transport operator transfers to the user. Finally, some               Heckman procedure to handle the sample-selection
control questions are also included to ensure that re-                problem.
sponses are coherent throughout the questionnaire. The                  In the first step (eq. 1: selection), a binary probit re-
information collected is exploited to conduct a model-                gression is performed with the whole sample to deter-
ling approach to design policies directed at maintaining              mine the likelihood of Yn being observed (Yn > 0):
the sustainability of the transport system. Table 1 shows
the set of variables collected in the survey.
   The survey was open to receive answers for two weeks,                  Y n ¼ 1  γp Xnp þ En > 0                               ð1Þ
and 984 respondents participated with valid responses.
We considered valid responses if the respondent would
completely answer that subsection of the survey. All                  where Xnp are vectors of regressors for the selection
valid responses are used in section 3.                                equation, γp are vectors of parameters to be estimated,
                                                                      1(·) is the indicator function, and En is a random-error
2.2 Heckman model                                                     term.
We adopt a choice modelling framework based on Heck-                    In the second step (eq. 2: outcome), the modelling co-
man specification to explore individuals’ willingness to              efficients are calculated using the sample’s portion with
use and willingness to pay regarding specific transport               observed values for the dependent variable solely (indi-
modes in post-COVID-19 time. Five different transport                 viduals willing to use a specific transport mode). An or-
options were included in the questionnaire: i) public                 dered probit model is adopted in terms of the
transport, ii) car-sharing, iii) taxi/ride-hailing, iv) bike-         probability of accepting a specific willingness-to-pay
sharing/kick scooter-sharing, and v) moped scooter-                   level. Then, we assume that the probability of a specific
sharing. They all imply transport options in which clean-             choice (the ordinal outcome yn being equal to a specific
liness and sanitising would be managed by the operators,              value jk), is given by the probability that the utility of in-
either public or private.                                             dividual n (Un = βp xnp) falls within τk and τk-1
   In this respect, willingness to pay values were only re-           thresholds:
ported by the subsample of individuals who were willing

to use a specific transport mode. According to Heckman                    P y ¼ jk ¼ Fðτk − Un Þ − Fð τ k − 1 − Un Þ
[19], if a dependent variable is estimated just from a set
                                                                                    ¼ P τ k − 1 < βp xnp þ en < τ k               ð2Þ
of nonrandom observed values, thus modelling estimates
may be biased. This fact is because there is a correlation
between the errors that determine whether a case is un-               where τ1,…,m represent the thresholds defined, xnp are
observed/missing (in our case, individuals not willing to             vectors of regressors for the outcome equation, βp are
use a specific transport option) and the errors determin-             vectors of parameters to be estimated and en is a
ing the outcome variable (in our case, willingness to                 random-error term. The model can be also expressed as:
pay). Heckman [19] proposed a two-step method in
Awad-Núñez et al. European Transport Research Review (2021) 13:20 Page 4 of 18
Table 1 Explanatory Variables collected in the research
Part of the survey Categories
Respondent profile
Age 16–29, 30–49, 50–64, 65 or more
Gender Male, Female, No answer
Residential location Open response
Net monthly salary [Euro] Below 500; 501–1000; 1001–1500; 1501-2000; 2001-2500; 2501-3000; Above 3000
Occupation of respondent
Occupation before COVID-19 Unemployed, Student, Houseworker, Retired/pensioner/disabled, Worker, Worker, and Student,
Others
Expected occupation after COVID-19 Unemployed, Student, Houseworker, Retired/pensioner/disabled, Worker, Worker, and Student,
Others
Working mode Face-to-face, Teleworking
Respondent travel
Frequency of travel by mode of transport Intensive (once per month or less), Non-intensive (more than once per month)
before COVID-19
Travel frequency according to the reason for Intensive (once per month or less), Non-intensive (more than once per month)
travel before COVID-19
Expected frequency of travel by mode of Intensive (once per month or less), Non-intensive (more than once per month)
transport after COVID-19
Expected travel frequency according to the Intensive (once per month or less), Non-intensive (more than once per month)
reason for travel after COVID-19
Reason to change or maintain the mode of Possibility of contagion, the supply of public transport, car ownership and driving license,
transport congestion, price, environmental reasons
Potential changes
Use of public transport If the supply increases so that vehicles are less crowded, If vehicles are cleaned and disinfected
daily, If masks, gloves, or hydroalcoholic gels are provided with each use, If only those not
contracting/positive for COVID-19 are certified to use the service, Other measures
Use of car-sharing If masks, gloves, or hydroalcoholic gels were provided with each use, If the vehicles were
cleaned and disinfected daily, If it was certified that none of the customers of the day had tested
positive for COVID-19 through the service app, If it was certified that only those who had not
contracted/positive for COVID-19 could use the service, Other measures
Use of ride-hailing If masks, gloves, or hydroalcoholic gels were provided with each use, If the vehicles were
cleaned and disinfected daily, If it was certified that none of the customers of the day had tested
positive for COVID-19 through the service app, If it was certified that only those who had not
contracted/positive for COVID-19 could use the service, Other measures
Use of bike−/scooter-sharing If they give masks, gloves, or hydroalcoholic gels with each use, If they use helmets that do not
have contact with mouth, nose, and eyes, If it is certified that none of the customers of the day
has tested positive in COVID-19 through the app of the service, If it is certified that only those
who have not contracted/tested positive in COVID-19 can use the service, If they give covers for
handlebars and steering wheels, Other measures (specify)
Use of moto sharing If they give masks, gloves, or hydroalcoholic gels with each use, If they use helmets that do not
have contact with mouth, nose, and eyes, If it is certified that none of the customers of the day
has tested positive in COVID-19 through the app of the service, If it is certified that only those
who have not contracted/tested positive in COVID-19 can use the service, If they give covers for
handlebars and steering wheels, Other measures (specify)
Extra cost willing to pay 0%, up to 5%, up to 10%, up to 15%,... up to 100%
8
>
>j1 if U n ≤ τ 1 1 ρ
< Σ¼ ð4Þ
j2 if τ 1 ≤ U n ≤ τ 2 ρ 1
y¼ ð3Þ
>
> …
:
jmþ1 if τ m ≤ U n The Heckman procedure has been widely utilised for
econometric analysis, mainly to calculate wage equations
Furthermore, we should note that the error terms En based on observed and unobserved wages (see e.g. [5]).
and en have a bivariate normal distribution with mean In the transport field, the Heckman procedure has been
zero and the following variance matrix: used within the context of ride-sourcing platforms toAwad-Núñez et al. European Transport Research Review (2021) 13:20 Page 5 of 18
analyse the two-step decisions made by drivers: to work travelling for this reason sometimes a week increased by
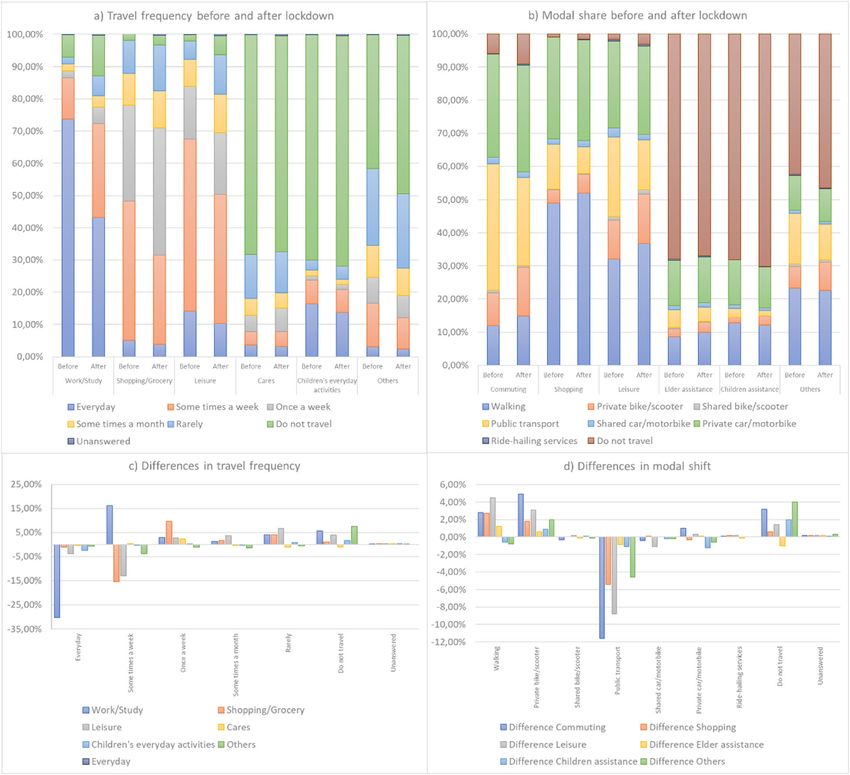
or not, and if so, how long to work [34]. The reader is 16.2%. However, as can be seen in Fig. 3, travel fre-
referred to as Xu et al. [37] to know more about the ad- quency is reduced for all trip purposes. Trips related to
vantages of Heckman procedures concerning unob- shopping/grocery and leisure activities, which in most
served heterogeneity and selectivity bias/endogeneity cases took place once a week, reduced their percentage
problems simultaneously. Additionally, further details on by 15.5% and 13.1%, respectively. Respondents expected
the Heckman procedure for ordered categorical out- to stop making a large number of trips. The trips that
comes are provided in de Lucca & Perotti [13]. they expected to be avoided the most (7.5%) are those
included in the “others” category. The following reasons
3 Modelling results: willingness to use and to pay are “work/study” and “leisure”. In the first case, it was
for transport services expected that 5.6% of the trips would not be made, while
3.1 Demographics and uses trends in the second case, it was thought that 3.9% would be
Although the questionnaire had been opened for two avoided. Only travelling for “care” reasons was expected
weeks in Spring 2020, most of the answers were received to increase by 1.2%.
in the first days. At that time, the lockdown was still in According to the responses obtained, the mode of
progress. Thus, the responses received are conditioned transport mostly expected to be reduced is public trans-
by the widespread paralysis of economic sectors, the port. Its use was reduced for all travel purposes, espe-
high uncertainty about the working future of many cially for “work/study” (− 11.6%), “leisure” (− 8.8%) and
workers, and the break-in classes at schools and univer- “shopping/grocery” (− 5.4%). By contrast, the transport
sities. Figure 1 shows the distribution of respondents by modes most expected to grow were walking and private
sex and age. bicycles and kick scooters. In the case of walking, it
The evolution in the activity before and after the lock- mainly increases regarding “leisure” trips (+ 4.5%). In the
down (Fig. 2) highlights that many workers expected ei- case of private bicycles and kick scooters, they mainly
ther not to return to their jobs or telework at least a few grow for “work/study” (+ 4.9%) and “leisure” (+ 3.1%)
days a week. The number of unemployed respondents is purposes. Shared transport services remain fairly con-
expected to double, from around 5% before lockdown to stant, with slight differences between + 0.20% (shared bi-
10% after lockdown. These results have important impli- cycle/moped scooter for commuting or leisure) and −
cations for the number of trips. 1.1% (shared car/motorbike for commuting or leisure).
Regarding modality for those who expected to con- Ride-hailing services were also expected to remain
tinue working after COVID-19 lockdown, 38% reported constant for all trip purposes. Private car and motorcycle
that they would telework, 38% that they would work in would also show few changes, with the most significant
person, and 24% do not know which modality they changes for commuting trips (+ 1.0%) and taking care of
would do so. These responses reflect the general drop in children (− 1.2%). A preference for the use of individual
travel frequency for commuting reasons. For instance, means of transport is then detected, with private car and
travelling daily for commuting reasons, including going walking/bicycle/kick scooter options standing out. The
to work/education centre, decreases by 30.3%, while main reasons reported were fear of contagion and less
Fig. 1 Respondents distribution by sex and ageAwad-Núñez et al. European Transport Research Review (2021) 13:20 Page 6 of 18
Fig. 2 Activity before and after the lockdown
congestion (20% and 14% of those who change modes of Public transport is the option with the highest willing-
transport, respectively). The reasons for changing mode ness to be used. 89.7% of individuals reported that they
and starting to walk or ride a bike or scooter were the would use these services in post-COVID-19 times (Table
same. 2), which seems somewhat high, given that the survey
These results are reasonable, especially given the high was conducted in the critical period of the lockdown.
uncertainty regarding the future employment situation Interestingly, around 64.3% of total respondents declared
of many respondents and the limited information avail- that they would pay more (compared to pre-COVID-19
able about the virus when the survey was launched. times) for using public transport services if operators
implemented sanitising measures.
As Table 3 shows, the main measures demanded
3.2 Preliminary findings among public transport users to use this mode are in-
This subsection presents the main findings regarding in- creasing supply to avoid crowding (70.6%) and increas-
dividuals’ opinions towards the use of specific transport ing cleanliness and sanitising (52.1%). These findings
modes in post-COVID-19 times, namely: i) public trans- may indicate that these measures seem to be enough to
port; ii) car-sharing; iii) taxi/ride-hailing; iv) bike- keep pre-COVID-19 levels in public transport demand
sharing/kick scooter-sharing, and v) moped scooted- and that citizens reasonably trust sanitising processes
sharing. Respondents were asked whether they would conducted under public transport authorities. It is worth
use (willingness to use) a specific mode of transport if noticing that 52.9% and 40.0% of these individuals would
the operator would implement a specific measure. For pay more, respectively, if operators implemented add-
individuals with an affirmative response were asked itional supply and sanitising actions. These results may
about their willingness to pay for these measures if they indicate that individuals would not perceive such a dan-
would imply an extra cost to be assumed by the user. gerous option in public transport (in terms of sanitary
Preliminary findings on survey valid responses are dis- conditions), or that they are captive of this transport
played about the five modes, regarding both the whole mode and would use it in any case.
sample (Table 2) and the subsample of potential users, The willingness to use bike-sharing or kick scooter-
i.e., individuals willing to use a specific transport mode sharing is reasonably high, around 67.7% among the
(Table 3). As can be observed, the willingness to use sample (Table 2), which seems somewhat surprising
transport modes in post-COVID-19 times greatly varies given that demand for these transport alternatives was
throughout the sample. marginal in Spain in pre-COVID-19 times. This resultAwad-Núñez et al. European Transport Research Review (2021) 13:20 Page 7 of 18 Fig. 3 Travel frequency and modal share before and after lockdown may be explained by the fact that individuals find more but noticeable percentages are observed for additional comfortable or safer transport options that provide an measures such as providing masks, gloves, and sanitiser open environment. Nevertheless, the willingness to pay gel before each use. particular measures against COVID-19 is relatively low: Similarly to taxi/ride-hailing, data for car-sharing rein- only 36.4%. The measures more demanded by people forces the importance given by individuals to the in- (Table 3) are, by far, the provision of covers for handle- crease of cleanliness and sanitising and the provision of bars and steering wheels (51.3%), and the provision of masks, gloves, and sanitiser gel. These measures seem masks, gloves, and sanitiser gel (38.1%). However, only essential for transport options involving closed spaces 36.4% and 27.5% potential user would pay more. and operated by private companies. The willingness to use taxi/ride-hailing services is in Tables 2 and 3 also include the distribution of survey the same order of magnitude (66.4% of total respon- responses concerning other transport modes addressed dents) than bike-sharing or kick scooter-sharing. We in the questionnaire, such as moped scooter-sharing. should note that 76.3% of people would use these ser- Comparatively lower positive responses (albeit notice- vices would demand increasing cleanliness and sanitisa- able) regarding this transport can be interpreted by the tion, and 48.9% of them would pay more for it. Lower fact that it was a marginal transport option in pre-
Table 2 Individuals’ willingness to use specific transport modes: distribution across socio-demographics
VARIABLES                   PUBLIC TRANSPORT                 CAR-SHARING                BIKE-SHARING / KICK                 TAXI / RIDE-HAILING       MOPED SCOOTER-SHARING
                                                                                         SCOOTER-SHARING
                    WILLING     WILLINGNESS TO     WILLING    WILLINGNESS TO        WILLING   WILLINGNESS TO        WILLING     WILLINGNESS TO       WILLING   WILLINGNESS TO
                    TO USE      PAY                TO USE     PAY                   TO USE    PAY                   TO USE      PAY                  TO USE    PAY
                    (POST-                         (POST-                           (POST-                          (POST-                           (POST-
                                ONLY     WITH                 ONLY         WITH               ONLY         WITH                 ONLY        WITH               ONLY     WITH
                    COVID)                         COVID)                           COVID)                          COVID)                           COVID)
                                WITH     HIGHER               WITH         HIGHER             WITH         HIGHER               WITH        HIGHER             WITH     HIGHER
                                SAME     PRICES               SAME         PRICES             SAME         PRICES               SAME        PRICES             SAME     PRICES
                                PRICES                        PRICES                          PRICES                            PRICES                         PRICES
Monthly Below       97.3%       30.1%    67.1%     69.9%      28.8%        41.1%    74.0%     24.7%        49.3%    72.6%       28.8%       43.8%    56.2%     14.0%    42.1%
Income 500 Euro
         500 to    89.5%        31.4%    58.1%     57.0%      27.9%        29.1%    62.8%     24.4%        38.4%    73.3%       33.7%       39.5%    47.7%     19.7%    27.9%
                                                                                                                                                                                 Awad-Núñez et al. European Transport Research Review

         1000 Euro
         1000 to   89.3%        26.5%    62.8%     52.6%      18.4%        34.2%    70.4%     24.5%        45.9%    65.3%       24.5%       40.8%    45.4%     20.2%    25.2%
         1500 Euro
         1500 to   91.7%        25.9%    65.9%     54.6%      20.5%        34.1%    71.2%     25.4%        45.9%    67.3%       24.4%       42.9%    42.4%     17.0%    25.5%
         2000 Euro
                                                                                                                                                                                     (2021) 13:20

         2000 to   88.9%        21.7%    67.2%     50.0%      13.1%        36.9%    66.7%     23.7%        42.9%    72.7%       27.8%       44.9%    43.9%     13.7%    30.2%
         3000 Euro
         Above     81.7%        15.9%    65.9%     51.2%      13.4%        37.8%    53.7%     18.3%        35.4%    72.0%       26.8%       45.1%    36.6%     11.1%    25.5%
         3000 Euro
Age      Under 30   94.4%       27.7%    66.7%     68.2%      25.3%        42.9%    81.2%     27.9%        53.3%    78.0%       30.4%       47.6%    62.0%     22.8%    39.2%
         30 to 49   90.3%       24.7%    65.6%     51.5%      19.4%        32.1%    68.8%     24.6%        44.2%    68.7%       28.0%       40.7%    43.8%     16.3%    27.6%
         50 to 64   84.7%       26.8%    57.9%     53.2%      19.0%        34.1%    60.0%     21.1%        38.9%    64.8%       23.5%       41.3%    35.5%     14.6%    20.9%
         Above 64   87.5%       17.5%    70.0%     42.1%      5.3%         36.8%    32.4%     13.5%        18.9%    73.7%       26.3%       47.4%    16.2%     0.0%     16.2%
Gender   Male       87.9%       24.8%    63.1%     52.3%      19.0%        33.3%    66.7%     26.0%        40.6%    66.4%       27.0%       39.4%    42.9%     17.5%    25.4%
         Female     92.8%       25.7%    67.1%     58.0%      20.7%        37.2%    68.9%     19.8%        49.1%    75.4%       27.3%       48.1%    46.8%     14.4%    32.4%
Lost employment     86.2%       40.0%    46.2%     63.1%      38.5%        24.6%    64.9%     24.6%        40.4%    58.6%       22.4%       36.2%    42.1%     16.4%    25.7%
after COVID
TOTAL respondents 89.7%         25.4%    64.3%     54.6%      19.8%        34.7%    67.7%     24.0%        43.7%    66.4%       26.1%       40.3%    40.6%     11.4%    29.3%
with valid responses
in the transport
mode
                                                                                                                                                                                      Page 8 of 18
Awad-Núñez et al. European Transport Research Review (2021) 13:20 Page 9 of 18
Table 3 Potential users’ willingness to use specific transport modes and potential measures to protect against COVID-19
Measures to protect against WILLING TO USE WILLING TO USE WILLING TO USE WILLING TO USE WILLING TO USE
COVID PUBLIC TRANSPORT CAR-SHARING BIKE-SHARING/KICK TAXI/RIDE-HAILING MOPED SCOOTER-
SCOOTER-SHARING SHARING
% % willing % % willing % % willing % % willing % % willing
willing to pay willing to pay willing to pay willing to pay willing to pay
to use if more to use if more to use if more to use if more to use if more
… … … … …
Increasing supply to avoid 70.6% 52.9% 30.7% 20.0% * * 13.3% 9.0% * *
crowding
Increasing cleanliness and 52.1% 40.0% 54.9% 37.5% * * 76.3% 48.9% * *
sanitising
Providing masks, gloves and 38.1% 27.9% 32.9% 22.6% 38.1% 27.5% 40.7% 27.6% 35.6% 22.0%
sanitiser gel
Certifying that only those non 14.9% 11.4% 26.3% 17.6% 10.3% 6.7% 19.9% 13.6% 10.5% 7.1%
infected by COVID-19 can use
the service
Certifying that user within the * * * * 14.8% 10.6% * * 11.5% 7.9%
same day was not infected by
COVID
Providing helmets with no * * * * 25.3% 19.1% * * 38.5% 26.7%
contact with mouth, nose and
eyes
Providing covers for * * * * 51.3% 36.4% * * 41.4% 27.7%
handlebars and steering
wheels
TOTAL potential users 843 604 501 319 593 383 624 379 382 275
COVID-19 times in Spain. Moped scooter-sharing fol- general sample. For instance, 40.0% of these individuals
low the same trend observed for bike-sharing/kick declared that they would not be willing to pay more for
scooter-sharing, regarding the importance of providing using public transport if additional sanitising actions
covers for handlebars and steering wheels, masks, gloves would be implemented, compared to the percentage ob-
sanitiser gel. Additionally, it is also relevant for this served for the global sample (25.4%). This result is pre-
transport option to provide helmets with no contact sumably explained by the loss of purchasing power
with mouth, nose, and eyes (38.5% of potential users generated by the pandemic for this segment of
would demand this measure). individuals.
These trends should be observed in parallel with the It is also remarkable that demanding operators policies
potential influence that socio-demographic and mobility to only accept recently COVID-19-negative tested users
attributes may have on individuals’ responses (Table 2). while using their services are the least demanded option
Due to length limitations, only the most noticeable for every transport mode. However, potential users of
trends are commented. For instance, a noticeable higher car-based transport modes are more demanding: their
proportion of females (75.4%) were willing to use taxi/ willingness to use is 26.3% for car-sharing and 19.9% for
ride-hailing services in post-COVID-19 times, compared taxi/ride-hailing, but only 17.6% and 13.6% would pay
to males (66.4%), which would reflect females’ prefer- more for these kinds of measures.
ence towards ‘private’ modes. Additionally, as seems rea- Finally, there is a general reluctance to pay more, i.e.,
sonable willingness to use bike-sharing, kick scooter- the low willingness to pay, for all the means of transport
sharing, moped scooter-sharing, and car-sharing de- when respondents were also asked how much more they
creases with age, which is consistent with previous lit- would pay at the service’s current price because of
erature on shared mobility (see, e.g. [3]). implementing those measures (Fig. 4). Interestingly, the
Similarly, the effect of age seems to be behind the fact most significant willingness to pay is perceived in public
that students present a higher willingness to use ride- transport, even to a large extent accepting surcharges
hailing, car-sharing, and moped scooter-sharing options above 50%. This result is striking since it is the mode
compared to other occupations. Finally, individuals who that would expect a higher decrease in the number of
lost their job with COVID-19 lockdown reported lower passengers. This high WTP occurs mostly among those
willingness to pay for using specific transport modes, who would be willing to use public transport if its fre-
such as public transport or car-sharing, compared to the quency were increased and those who would do so ifAwad-Núñez et al. European Transport Research Review (2021) 13:20 Page 10 of 18
Fig. 4 Willingness to pay more for special sanitising measures, compared to pre-COVID-19
vehicles were cleaned and disinfected daily. This result sharing. Since these modes typically require the use of a
shows that those who will continue to use it know this smartphone, this result seems reasonable given the lower
type of measure’s high economic cost. tech-savviness among older segments of the population
(see, e.g., [24]. Additionally, modes such as shared bikes
3.3 Selection equation: willingness to use a specific or mopeds require being in good physical condition (see,
transport mode in post-COVID-19 times e.g., [2]). The positive and statistically significant results
A Heckman choice framework has been adopted to ana- obtained for students regarding taxi/ride-hailing and
lyse individuals’ responses more rigorously. Explanatory moped scooter sharing can be interpreted in the same
variables used in the models were mostly categorical, so line.
a base reference has been chosen in each case as referred Regarding gender, the higher likelihoods observed for
to in Tables 4 and 5 when necessary. Multiple tests con- females to use public transport and taxi/ride-hailing op-
ducted for checking the presence of a strong correlation tions have been widely referred to in the literature. Add-
among the explanatory variables showed no multicolli- itionally, according to the modelling results, individuals
nearity problems in our data. with higher income levels typically present a statistically
Table 4 shows the results for the ordered probit equa- significant higher willingness to use taxi/ride-hailing ser-
tion (willingness to pay, eq. 2: outcome), while results vices and a lower willingness to use public transport,
for individuals’ willingness to use a specific transport bike-sharing, or kick-scooter sharing. This result can be
mode in post-COVID-19 times (eq. 1: selection) are in- explained by the higher car prone attitude of wealthy in-
cluded in Table 5 and commented below. Most of the dividuals and their tendency towards separating or dif-
explanatory variables that resulted in non-statistically ferentiating from others as a signal of exclusivity as
significant were finally removed from the last version of noted by Chevalier & Gutsatz [11].
the model with no impact in the overall fitting, as con- Regarding mobility habits, the most noticeable results
firmed by multiple likelihood-ratio (LR) tests conducted. concern the lower likelihood to use public transport ser-
The results for the selection equation confirm what vices in post-COVID-19 times among individuals who
was observed in the preliminary findings. Regarding commuted intensively by using any other modes: private
socio-demographic attributes, we can observe that as age vehicle, personal bike, walking, shared modes, among
increases, individuals show a statistically significantly others. Nevertheless, we should remind that overall will-
lower willingness to use car-sharing, bike-sharing/kick ingness to use public transport services in post-COVID-
scooter-sharing, taxi/ride-hailing and moped scooter- 19 times was high in the sample, as noted above.Table 4 Modelling results, Heckman model: willingness to pay (eq. 2: outcome) to use a specific transport mode (ordered probit equation)
EQUAT. VARIABLES (Base reference) PUBLIC CAR-SHARING BIKE-SHARING TAXI / RIDE- MOPED
TRANSPORT / KICK HAILING SCOOTER-
SCOOTER- SHARING
SHARING
Coeff. p-value Coeff. p-value Coeff. p-value Coeff. p-value Coeff. p-value
WILLINGNESS SOCIODEMOGRAPHICS Gender (male)
TO PAY
Female
Lost employment after −0.319 0.056 −0.573 0.000 −0.163 0.033
COVID
MOBILITY HABITS Commuting (base case: intensive, public transport/sharing)
Intensive, walking 0.303 0.015
Intensive, private −0.987 0.068
bike
Non-intensive, public −0.508 0.036 −0.775 0.018 −0.608 0.022
Awad-Núñez et al. European Transport Research Review
transport
Non-intensive, −1.260 0.008
private bike
Leisure (base case: intensive, public transport/sharing)
Intensive, private car/ 0.213 0.058
(2021) 13:20
moto
Intensive, sharing 0.649 0.005
Non-intensive, 0.421 0.004
private bike
Non-intensive, 0.314 0.054
walking
Shopping (base case: intensive, public transport/sharing)
Intensive, public −0.668 0.003
transport
Intensive, private car/ −0.743 0.053 0.231 0.069
moto
Intensive, walking 0.199 0.019 −0.206 0.048
Non-intensive, public
transport
Non-intensive, −3.922 0.046
private car/moto
Non-intensive, 0.245 0.009
walking
Page 11 of 18Table 4 Modelling results, Heckman model: willingness to pay (eq. 2: outcome) to use a specific transport mode (ordered probit equation) (Continued)
EQUAT. VARIABLES (Base reference) PUBLIC CAR-SHARING BIKE-SHARING TAXI / RIDE- MOPED
TRANSPORT / KICK HAILING SCOOTER-
SCOOTER- SHARING
SHARING
Coeff. p-value Coeff. p-value Coeff. p-value Coeff. p-value Coeff. p-value
MEASURES TO PREVENT Increasing supply to 0.192 0.018 0.247 0.027
AGAINST COVID avoid crowding
Increasing cleanliness −0.580 0.060 0.321 0.001
and sanitising
Providing masks, gloves 0.125 0.099 0.202 0.035
and sanitiser gel
Certifying that only those non infected by 0.373 0.000 0.269 0.110
COVID can use the service
Certifying that no user within the same day 0.251 0.047
was infected by COVID
Awad-Núñez et al. European Transport Research Review
Providing helmets with no contact 0.191 0.076
with mouth, nose and eyes
Increasing bike-related 0.495 0.096
infrastructure
Providing covers for 0.341 0.000
(2021) 13:20
handlebars and steering
wheels
Constant 2.394 0.000 0.242 0.043 0.922 0.000 0.598 0.000 −0.109 0.925
No. Obs 833 851 840 833 767
Selected 749 461 568 581 286
observation
Log-likelihhod − − − − − 974.8
1685.6 1409.9 1517.6 1485.7
Wald Chi2 65.90 25.72 58.61 47.76 14.83
Page 12 of 18Table 5 Modelling results, Heckman model: willingness to use (eq. 1: selection) a specific transport mode
EQUAT. VARIABLES (Base reference) PUBLIC CAR-SHARING BIKE-SHARING / KICK TAXI / RIDE- MOPED SCOOTER-
TRANSPORT SCOOTER-SHARING HAILING SHARING
Coeff. p-value Coeff. p-value Coeff. p-value Coeff. p-value Coeff. p-value
WILLINGNESS TO SOCIODEMOGRAPHICS Monthly Income (below 500 Euro)
USE
500 to 1000 Euro
1000 to 1500 Euro
1500 to 2000 Euro 0.253 0.010
2000 to 3000 Euro 0.253 0.010
Above 3000 Euro −0.496 0.004 −0.255 0.093
Gender (male)
Female 0.221 0.098 0.231 0.019
Age (under 30)
30 to 49 0.000 0.003 0.033 0.005
Awad-Núñez et al. European Transport Research Review
−0.381 −0.388 −0.246 −0.360
50 to 64 −0.280 0.018 −0.613 0.000 −0.341 0.014 −0.535 0.000
Above 64 −0.280 0.018 −1.337 0.000 −0.535 0.000
Occupation (employed, no teleworking)
Student 0.329 0.032 0.368 0.014
(2021) 13:20
MOBILITY HABITS Commuting (base case: intensive, public transport)
Intensive, private car/moto −0.878 0.000
Intensive, bike −1.020 0.000 −0.233 0.071 −0.243 0.094
Intensive, walking −0.759 0.001 −0.211 0.095
Intensive, other −1.380 0.000
Non-intensive, public transport
Non-intensive, private car/moto −1.243 0.008
Leisure (base case: intensive, public transport)
Intensive, private car/moto −0.326 0.096
Intensive, bike −0.587 0.015
Intensive, walking −0.482 0.015
Non-intensive, public transport −0.249 0.042 −0.325 0.035 − 0.256 0.078
Non-intensive, private car/moto −0.431 0.058 −0.241 0.079
Non-intensive, walking −0.592 0.021
Non-intensive, other 0.850 0.051 0.760 0.058
Page 13 of 18Table 5 Modelling results, Heckman model: willingness to use (eq. 1: selection) a specific transport mode (Continued)
EQUAT. VARIABLES (Base reference) PUBLIC CAR-SHARING BIKE-SHARING / KICK TAXI / RIDE- MOPED SCOOTER-
TRANSPORT SCOOTER-SHARING HAILING SHARING
Coeff. p-value Coeff. p-value Coeff. p-value Coeff. p-value Coeff. p-value
Shopping (base case: intensive, public −0.800 0.028
transport)
Intensive, private car/moto 0.288 0.050
Non-intensive, private car/moto −0.441 0.004
Valuing comfort 0.068 0.013 0.088 0.048
Awad-Núñez et al. European Transport Research Review
(2021) 13:20
Page 14 of 18Awad-Núñez et al. European Transport Research Review (2021) 13:20 Page 15 of 18
Detailed results concerning the frequency of use regard- value sanitising measures in such a way to lead to a
ing any trip purpose and transport mode can be ob- higher willingness to pay.
served in Table 5. Regarding hailing services (taxi/ride-hailing), typically
with higher unitary costs per km, we can observe that
3.4 Ordered probit equation: willingness to pay more to willingness to pay would be higher in a statistically sig-
use a specific transport mode in post-COVID-19 times nificant way among users demanding higher supply (p-
Table 4 includes the modelling results regarding the value = 0.027), increase of cleanliness and sanitising (p-
Heckman regression equation (willingness to pay, eq. 2: value = 0.001), and a certification that only those non in-
outcome). As can be observed, socio-demographic vari- fected by COVID can use the service (p-value = 0.000).
ables play a minor role in explaining individuals’ willing- These results can be explained in the light of the central
ness to pay. Only statistically significant results were aspect: individuals with a higher purchasing power typic-
found for individuals losing their job after the beginning ally use ride-hailing services, therefore more open to
of the COVID-19 lockdown regarding car-sharing (p- paying more for certain services.
value = 0.000), scooter-sharing (p-value = 0.033), and Similar to the findings on public transport, for bike-
public transport (p-value = 0.058), which is reasonable sharing/kick scooter-sharing we can observe (Table 4)
given the loss in the purchasing power of this segment that several measures could lead to a higher willingness-
of the population. Other socioeconomic variables such to-pay, namely: providing masks, gloves, and sanitiser
as gender or age did not result statistically significant for gel (p-value = 0.035); certifying that no user within the
transport services analysed. same day was infected by COVID (p-value = 0.047); pro-
Regarding explanatory variables controlling for mobil- viding helmets with no contact with mouth, nose, and
ity habits, many coefficients appeared as statistically sig- eyes (p-value = 0.076) or providing covers for handlebars
nificant. Mainly, individuals who commute (intensively and steering wheels (p-value = 0.000). Surprisingly,
or not) by private bike present a lower willingness to pay cleanliness and sanitising actions negatively influences
for using bike-sharing systems, which seems evident the willingness to pay for these services. One may con-
given that using their own bike is cheaper and safer clude that this type of measure is viewed by individuals
against contagion. Nevertheless, the opposite effect is as prerequisites for using a transport services in post-
observed for those who use their private bike non inten- COVID-19 times, but not necessarily an element to lead
sively for leisure trips (p-value = 0.008). Additionally, oc- to a higher willingness to pay, despite the greater costs it
casional users of public transport for commuting imposes on operators. Additionally, it seems that bike-
purposes showed a statistically significant lower willing- sharing users demanding the improvement of bike infra-
ness to pay for additional costs for sanitary measures on structure (e.g., extending current bike lanes) would be
public transport (p-value = 0.036), car-sharing (p-value = willing to pay more in a statistically significant way since
0.018) and hailing (p-value = 0.022) services, in case an this result is close to being statistically significant (p-
additional cost was imposed to the user for implement- value = 0.096).
ing sanitation measures. Detailed results concerning the Finally, modelling results for moped scooter-sharing
influence of mobility habits on individuals’ willingness- present many similarities with car-sharing since almost
to-pay can be observed in Table 4. no measure increases willingness-to-pay for these ser-
More interestingly, Table 4 includes modelling results vices. The only exception would be certifying that only
controlling for willingness to pay in specific modes of individuals non infected by COVID-19 could use this
transport and potential measures to be implemented service, but this result is not statistically significant (p-
during post-COVID-19 periods. Reasonably, increasing value = 0.110). Thus we can again conclude that, despite
service supply to avoid crowding (p-value = 0.018) and, the higher costs that sanitising measures impose on op-
to a lower extent, providing masks, gloves, and sanitiser erators, they are not valued by users of moped scooter-
gel (p-value = 0.099) would increase individuals’ willing- sharing in such a way to result in a higher willingness to
ness to pay for using public transport. Together with the pay. On the contrary, are seen as prerequisites for using
preliminary findings above, these results are significant the service.
given the additional costs these measures imply to oper-
ators and current financing problems on public trans- 4 Conclusions
port services. By contrast, no measures are statistically Because of the COVID-19 pandemic, governments had
significant for car-sharing options, although one may ex- to deploy severe measures to contain the virus spread. In
pect that, e.g., improving cleanliness and sanitising or the case of Spain, the almost three-month lockdown re-
providing covers for handlebars and steering wheels, duced most of the economic activities to a halt. After
would increase willingness-to-pay for these services. this situation, with the new normality, economic activ-
Thus we can conclude that car-sharing users do not ities have not recovered the performance of pre-COVID-Awad-Núñez et al. European Transport Research Review (2021) 13:20 Page 16 of 18
19 situation: some people have lost their jobs, others are dropped up to 40–70% of the same period of 2019 in
teleworking, studying from home, among others. In this some of the biggest Spanish cities.
way, people’s mobility has changed, both in the fre- The willingness to use bike-sharing or kick scooter-
quency of travel and trip purposes. sharing is also relatively high (67.7%), a striking result
With the hypothesis that the fear of contagion could given that the demand for these modes of transport was
also have been a reason to change travel behaviour, marginal in Spain in the pre-COVID-19 period. This re-
given that people would opt more for individual modes sult is also the case, to a lower extent, for other shared
of transport, a survey has been carried out to find out modes and taxi/ride-hailing. We recommend taking
which measures can help public transport and shared these results with caution since the willingness to use is
mobility services to be used. Similarly, this work is on the side of casual trips, rather than for the most fre-
intended to provide an overview of users’ willingness to quent ones.
pay if the incorporation of these measures would entail Based on the results, it appears that the WTP extra
an extra cost for them. The results are particularly rele- costs are, however, moderate. In other words, transport
vant given that profit margins in the transport sector are is a well-established activity in Spain, and its adaptation
very low in Spain or, in many cases, public services have to the new needs imposed by the pandemic seems to be
to be subsidised because they are loss-making. taken for granted by the users, who do not consider that
According to the survey findings, the general willing- the value of the service adaptations requires a higher
ness to use different modes of transport in the post- payment than in the pre-COVID-19 period. There is
COVID-19 period varies greatly. The set of measures only one exception: taxi/ride-hailing services do seem to
that would help respondents accept or not use each be understood as luxury services. This result may be due
mode of transport after the lockdown period is detailed to the fact that most trips in Spain are made by public
in Table 6. transport, by private car and by walking [2]. Taxi/ride-
Public transport is, according to respondents, the op- hailing services are rarely used and for concrete reasons
tion with the highest willingness to use. 89.7% of individ- where the WTP more is reasonable, such as business
uals reported that they would use these services in the trips paid by companies or night-time trips made when
post-lockdown period, a figure that seems high given there is less public transport available and paying for the
that the survey was carried out during the critical period taxi/ride-hailing service means a significant saving of
of the lockdown when the demand of public transport time to return home after leisure or work.
Table 6 Classification of measures according to their high/low effect on WTU
MEAN OF TRAN HIGH EFFECT ON WTU LOW EFFECT ON WTU
SPORT
PUBLIC TRANSPORT Increasing the frequency of the service to avoid crowding Free masks, gloves, or hydroalcoholic gels
provided with each use
Intensive vehicle cleaning If only those not contracting/positive for
COVID-19 are certified to use the service
CAR-SHARING Intensive sanitising of the vehicles Increasing supply to avoid crowding
Steering wheel covers Free masks, gloves, or hydroalcoholic gels
provided with each use
If only those not contracting/positive for
COVID-19 are certified to use the service
BIKE-SHARING / KICK Free masks, gloves, or hydroalcoholic gels provided with each use
SCOOTER-SHARING
Handlebar covers If only those not contracting/positive for
COVID-19 are certified to use the service
Free masks, gloves, or hydroalcoholic gels provided with each use
TAXI / RIDE-HAILING Intensive sanitising of the vehicles Increasing supply to avoid crowding
Free masks, gloves, or hydroalcoholic gels
provided with each use
If only those not contracting/positive for
COVID-19 are certified to use the service
MOPED SCOOTER- Free masks, gloves, hydroalcoholic gels, and surgical scrub caps to avoid If only those not contracting/positive for
SHARING direct contact with the helmetsa provided with each use COVID-19 are certified to use the service
Handlebar covers
a
Should be positive to promote the visibility of this kind of special service already offered before COVID-19Awad-Núñez et al. European Transport Research Review (2021) 13:20 Page 17 of 18
For public transport, the measures most widely ac- It is necessary to take the results of this work with the
cepted are those related to increasing the frequency of proper caution. In this sense, it is necessary to clarify
the service to avoid crowding and intensive vehicle that the interaction through a survey would be com-
cleaning. In other words, those that are the most expen- pleted with other sources of mobility data and future
sive ones. Given the additional costs that these measures similar surveys. It is difficult to discern with complete
imply for operators and the current problems of finan- certainty whether the results towards the different
cing transport services, this resistance to payment can modes reflect a previous idea that is crystallising or
be problematic for the finance structure of the transport whether, by contrast, it is the shock produced by the
system. pandemic that produces this change in preferences.
For sharing services, the intensive sanitising of the ve- Also, due to the short period for sending papers for
hicles should be continuously advertised by operators, as this particular issue, we must say that for this paper we
it is a crucial measure for the users among all the shared have focused only on the case of Spain, but the survey
modes. Scooter-sharing services already offered special was carried out at an international level, obtaining re-
gear such as surgical scrub caps to avoid direct contact sponses from several Latin American countries. There-
with the helmets before the pandemic. It is recom- fore, in future analyses, we hope to study the differences
mended to promote the visibility of these measures, also, between regions and countries. Other important out-
to offer extra protection such as disposable gloves, steer- comes could be obtained due to the different mobility al-
ing wheel/handlebar covers and hydroalcoholic gel. The ternatives and socioeconomic characteristics of the
same as with public transport, the implementation of the different regions.
measures are taken for granted. Users do not seem will-
ing to have the cost of these measures passed on to Acknowledgements
The authors would like to thank the respondents who made this research
them, which is a problem for operators because operat- possible. We would also like to thank ECTRI for funding this Special Issue and
ing costs must be increased without affecting tariffs. the reviewers and the editor, as their comments have helped us significantly
This result is an exciting approach for researchers in- improve the paper’s quality despite the short deadlines required for a special
issue of this nature. Finally, B. Moya-Gómez would like to thank to the Span-
terested in more in-depth analysis. Nevertheless, it also ish Ministry of Science, Innovation and University for their financial support
allows to highlight the importance of increasing public through the Juan de la Cierva–Training Aids for Labour Contracts program
funding of the public transport system or establishing (FJC2018-036613-I).
new indicators of charging operators since some public
Authors’contributions
transport companies in Spain charge per passenger.
RJ, BM-G: Introduction. SA-N, JG: Data analysis. JG: Heckman model. All:
Thus, the mechanisms for charging per kilometre or per Model interpretation and conclusions. All: Survey preparation. SA-N: Coordin-
passenger-kilometre make it possible to support the sys- ation. The authors read and approved the final manuscript.
tem better. Given that Spain lacks a law on the financing
of public transport, the current situation might be a Funding
This research has been carried out with resources from Instituto de
catalyst to undertake this project in brief to avoid the Movilidad.
arising of financial problems for transport operators. It
is recommended that this funding law should prioritise Availability of data and materials
investment in public transport and the improvement of All data and materials used for the writing of this paper are the property of
the researchers. The survey database is the property of the researchers. It is
soft modes rather than sharing and taxi/ride-hailing ser- not yet publicly available but it is available from the corresponding author
vices. In case of the latter are to be financed, their ser- on reasonable request, and in compliance with Spanish data protection law.
vices will have to be regulated in a way that subsidies
ensure that services can be used on equal terms by all Competing interests
The authors declare that they have no competing interests.
users. This regulation should guarantee that public re-
sources are equitability invested. Author details
1
Finally, it is worth mentioning that this research has Department of Civil Engineering, Universidad Europea de Madrid, Villaviciosa
de Odón, Spain. 2Centro de Investigación del Transporte (TRANSyT),
some limitations due to the extraordinary situation when
Universidad Politécnica de Madrid, Madrid, Spain. 3Instituto de Movilidad,
it was conducted, which may open up future research Sevilla, Spain.
questions. Firstly, the answers obtained in such an ex-
Received: 18 August 2020 Accepted: 4 February 2021
ceptional period may be highly conditioned by traumatic
experiences during the lockdown and the high degree of
socioeconomic uncertainty about the evolution of the References
pandemic and its consequences when it ceases. It was 1. Aburto, N. J., Pevzner, E., Lopez-Ridaura, R., Rojas, R., Lopez-Gatell, H.,
difficult for the respondents to predict the magnitude of Lazcano, E., Hernandez-Avila, MA., Harrington, T. A. (2010). Knowledge and
adoption of community mitigation efforts in Mexico during the 2009 H1N1
the pandemic effects on day-to-day life, then the ob- pandemic. American Journal of Preventive Medicine, 39(5), 395–402. https://
tained responses were partially fulfilled. doi.org/10.1016/j.amepre.2010.07.011.You can also read