CHAPTER 6.4: TRANSPORT - GTAC
←
→
Page content transcription
If your browser does not render page correctly, please read the page content below
CHAPTER 6.4:
                                              TRANSPORT

ABSTRACT
South Africa’s Covid-19 lockdown has had a massive effect on the transport sector. Restrictions on the
movement of people and goods under the Disaster Management Act were supplemented by sector-
specific regulations that included cross-border road transport, air services, seaports, public transport
services, railway operations, and the provision of transport services in general. The financial impact
on public transport services has been substantial. Rail services initially came to a standstill, and
following vandalism during the lockdown, have difficulty resuming services at previous levels. Bus
operators reported significant disruption and sizeable operating losses. Likewise, minibus taxi
operators were severely affected by capacity restrictions and (ongoing) lower demand. The ban on
travel also translated into lower revenue for airlines (which had already been in a financial
predicament), cross-border transport services, and sea cruise operations.

Transport is essential to the functioning of the economy and society. Covid-19 has changed the face
of transport and underscored disparities in its provision. The pandemic offers the chance to address
systemic issues in the sector through, for example, a more equitable public transport subsidy policy,
travel demand management initiatives, and better integration between modes of transport to
enhance sustainability. Note that any conclusions on the strengths and limitations of the Covid-19
response in this chapter are still preliminary and will be refined based on stakeholder consultations
and feedback from readers.

DISCLAIMER
 This Country Report on the measures implemented by the South African government to combat the impact
 of the Covid-19 pandemic in South Africa (including individual research reports that may be enclosed as
 annexures) were prepared by various professional experts in their personal capacity. The opinions expressed
 in these reports are those of the respective authors and do not necessarily reflect the view of their affiliated
 institutions or the official policy or position of the South African government.

Chapter 6.4. Transport                        DRAFT 14/05/2021                                                      i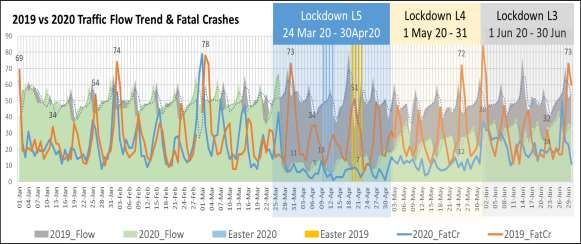
ACKNOWLEDGEMENTS
This research paper was prepared by:

 Name                               Designation and affiliation

                                    Adjunct Associate Professor, Department of Civil Engineering, University
 Prof. Johann Andersen (convenor)
                                    of Stellenbosch

 Ms Megan Bruwer                    Lecturer, Department of Civil Engineering, University of Stellenbosch

                                    Impact Area Manager: Transport Systems and Operations, Council for
 Dr Mathetha Mokonyama
                                    Scientific and Industrial Research

How to cite this report:
Bruwer, M., Andersen, S. J. & Mokonyama, M., 2021. Transport. South Africa Covid-19 Country Report
[Interim draft]. DPME (Department of Planning, Monitoring and Evaluation), GTAC (Government
Technical Advisory Centre) & NRF (National Research Foundation), Pretoria: May.

Chapter 6.4. Transport                     DRAFT 14/05/2021                                                    ii
ABBREVIATIONS AND ACRONYMS
ADT               average daily traffic
ADTT              average daily truck traffic
CoGTA             Department of Cooperative Governance and Traditional Affairs
PPE               personal protective equipment
PRASA             Passenger Rail Agency of South Africa
SANRAL            South African National Road Agency Ltd
WHO               World Health Organization

Chapter 6.4. Transport                      DRAFT 14/05/2021                     iii
CONTENTS
Introduction ...................................................................................................................................... 1
Measures and regulations in the transport sector .............................................................................. 1
Impact of the regulations .................................................................................................................. 2

Road-based travel ............................................................................................................................. 4
Local travel ........................................................................................................................................ 4
Long-distance travel .......................................................................................................................... 5
Road-based, cross-border travel via land ports .................................................................................. 7

Public transport ................................................................................................................................. 8
Rail services..................................................................................................................................... 10
     PRASA ....................................................................................................................................... 10
     Gautrain .................................................................................................................................... 11
Bus services ..................................................................................................................................... 12
Minibus taxi services ....................................................................................................................... 14
Passenger air transport ................................................................................................................... 15

Freight movement ........................................................................................................................... 17
International freight ........................................................................................................................ 17
Local freight .................................................................................................................................... 18

Road safety ..................................................................................................................................... 19

The changing face of transport ........................................................................................................ 20

Lessons learnt ................................................................................................................................. 20

Recommendations .......................................................................................................................... 21

References ...................................................................................................................................... 22

Chapter 6.4. Transport                                       DRAFT 14/05/2021                                                                       iv
LIST OF FIGURES Figure 6.4.1: National baseline: One-way trip generation for education and work on weekdays ........ 3 Figure 6.4.2: Impact of level 5 lockdown on distances travelled ......................................................... 3 Figure 6.4.3: Variation in ADT in Gauteng, January to December 2020 (% change year-on-year) ........ 5 Figure 6.4.4: Variation in long-distance ADT, January to December 2020 (% change year-on-year) .... 6 Figure 6.4.5: Daily variation in ADT, station 2554 (N1 north of Bloemfontein) .................................... 7 Figure 6.4.6: Cross-border arrivals and departures by road, 2020 ...................................................... 7 Figure 6.4.7: Public perceptions of high-risk areas for contracting Covid-19 ....................................... 9 Figure 6.4.8: Average daily Gautrain trips ........................................................................................ 12 Figure 6.4.9: Bus passengers, January to August 2020 (% change year-on-year) ............................... 13 Figure 6.4.10: Air passenger arrivals, January to September 2020 (% change year-on-year) ............. 16 Figure 6.4.11: Monthly unit value index of imports and exports, January 2019 to December 2020 .. 17 Figure 6.4.12: Monthly ADTT on long-distance routes (% change year-on-year) ............................... 18 Figure 6.4.13: Monthly freight payload (% change year-on-year) ..................................................... 19 Figure 6.4.14: Fatal crashes and traffic volume, 2019 and 2020 ....................................................... 19 LIST OF TABLES Table 6.4.1: Restrictions on local, intracity travel ............................................................................... 5 Table 6.4.2: Restrictions on long-distance, intercity travel ................................................................. 6 Table 6.4.3: Restrictions on passenger rail services .......................................................................... 10 Table 6.4.4: Restrictions on bus services .......................................................................................... 12 Table 6.4.5: Restrictions on minibus taxi services............................................................................. 14 Table 6.4.6: Restrictions on passenger air transport......................................................................... 16 Table 6.4.7: Resumption of passenger flights at local airports .......................................................... 17 Table 6.4.8: Restrictions on international freight ............................................................................. 18 Table 6.4.9: Easter Holiday road fatalities, per province, 2019 and 2020 .......................................... 20 LIST OF BOXES Box 6.4.1: Congestion at Beitbridge border post ................................................................................ 8 Box 6.4.2: Cape Town minibus taxi industry ..................................................................................... 15 Chapter 6.4. Transport DRAFT 14/05/2021 v
INTRODUCTION
The Covid-19 pandemic has significantly changed how people work and, hence, how they use transport.
It has also underscored disparities in the provision of transport in South Africa. This chapter reviews
government measures to limit the transmission of the virus through transport, along with the impact
of various Covid-19-related restrictions on the transport sector. It is based on a synthesis of published
information, empirical observations, interviews with selected stakeholders, and the interrogation of
various datasets.

MEASURES AND REGULATIONS IN THE TRANSPORT SECTOR
Restrictions on the movement of people and goods are ordinarily provided for in section 27 of the
2002 Disaster Management Act (RSA, 2003) when a state of national disaster is declared under the
auspices of the Department of Cooperative Governance and Traditional Affairs (CoGTA). Various
ministries must thereafter publish sector-specific regulations in support of the CoGTA regulations.

Following several Covid-19-related alerts by the World Health Organization (WHO) from early January
2020 (WHO, 2020a), the first reported case in South Africa (from Italy) on 5 March 2020 (NICD, 2020),
and the classification of Covid-19 as a pandemic on 11 March 2020 (WHO, 2020b), the South African
president imposed a ban on travel to and from specific ‘high-risk’ countries as from 18 March 2020.
These included China, Germany, Italy, Iran, South Korea, Spain, the United Kingdom, the United States,
and France (The Presidency, 2020a).

On 15 March 2020, the minister of transport (DoT, 2020a) announced additional measures, including
the following:
•   Public transport operators should develop risk management plans.
•   Operators should carry out a health and awareness campaign on Covid-19.
•   Operators should provide adequate sanitisation equipment.
•   Personnel in the transport industry should have sufficient personal protective equipment (PPE).
•   Operators providing food on board should take special precautions.
•   Train operators should provide marshals or security personnel on board to manage crowds and
    avoid overloading.

With rapidly rising Covid-19 cases, on 23 March 2020, the president announced a 21-day nationwide
lockdown, effective from midnight on 26 March 2020 (SAnews, 2020a). The minister of CoGTA
published nationwide lockdown regulations that included the following provisions (CoGTA, 2020a):
    All commuter transport services including passenger rail services, bus services, taxi services, e-
    hailing services, maritime and air passenger transport are prohibited, except bus services, taxi
    services, e-hailing services and private motor vehicles for purposes of rendering essential services,
    obtaining essential goods, seeking medical attention, funeral services and to receive payment of
    grants: Provided that: (a) bus services, taxi services and e-hailing services shall not carry more than
    50% of the licensed capacity; and (b) private vehicles shall not carry more than 60% of the licensed

Chapter 6.4. Transport                     DRAFT 14/05/2021                                              1
capacity, and that all directions in respect of hygienic conditions and the limitation of exposure of
persons to Covid-19, are adhered to.
Following the president’s announcement on 23 April 2020 of the risk-adjusted strategy for managing
Covid-19 – the five alert levels – transport regulations were adjusted for each level (The Presidency,
2020b). These regulations, summarised here, are discussed in more detail in the next sections:
• Level 4: Interprovincial travel was still not allowed. However, special provision was made between
1 and 7 May 2020 to allow persons who had not been at their place of residence or work before
the lockdown to travel to these places. Intra-provincial services for non-essential travel could
operate only between 05:00 and 20:00, similar to private car travel. The Gautrain could operate.
• Level 3: Interprovincial and long-distance (>200 km) buses and minibus taxis could operate at 70%
of capacity. Interprovincial travel was allowed. The Passenger Rail Agency of South Africa (PRASA)
was requested to carry out infrastructure maintenance and testing of its fleet before opening
lines, given that most of its network had been vandalised (discussed below). PRASA opened a few
lines on 1 July (Pienaarspoort–Pretoria Central; Cape Town–Retreat; Port Elizabeth–Uitenhage;
and East London–Berlin), limited to peak periods and at a capacity that ensured physical distancing
of 1,5 m, which effectively meant 15–20% of train capacity. Domestic passenger flights were
allowed at specific airports, but international flights were still prohibited.
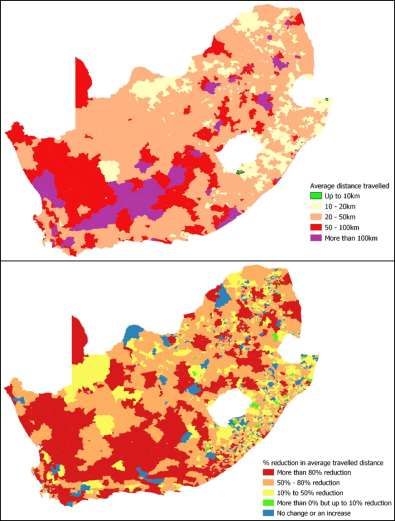
• Level 2: All non-long distance (Figure 6.4.1: National baseline: One-way trip generation for education and work on weekdays Note: Figures calibrated from the 2013 national household travel survey data. Source: Stats SA, 2014 Figure 6.4.2: Impact of level 5 lockdown on distances travelled Source: Generated by the CSIR using data provided by Vodacom (i.e. limited to Vodacom mobile phone subscribers) Chapter 6.4. Transport DRAFT 14/05/2021 3
To demonstrate the impact of the restrictions, Figure 6.4.2 above presents two extremes: the upper
map shows the average distance travelled per person, per municipal ward, on Wednesday, 4 March
2020. This represents a normal baseline weekday and includes travel for a variety of purposes. The
lower map in the figure depicts the average distance travelled on Wednesday, 1 April 2020, soon after
the start of the hard lockdown (alert level 5). Apart from a few isolated areas, mainly in rural parts of
the country, the overall average distance travelled was lower during the lockdown. The consequences
of such shorter travel distances include lower revenue generated by public transport services, lower
fuel consumption, reduced expenditure on vehicle maintenance, and a reduction in emissions.

The next sections discuss the impact of changes in trip generation and other travel characteristics on
road-based travel and public transport, drawing on data and information from the various alert levels.
This is followed by an overview of freight transport and a discussion of the effect of the reduction in
trips on road safety. The chapter concludes with some lessons learnt and recommendations. Note that
any conclusions on the strengths and limitations of the Covid-19 response are still preliminary and will
be refined based on stakeholder consultations and feedback from readers. Also, this chapter focuses
on the first and second waves of the pandemic. Transport during the further progression of the
pandemic will be discussed in the second edition of the Country Report.

ROAD-BASED TRAVEL
Data on road-based traffic volumes is aggregated for all modes of road-based transport to give a
general indication of the demand for travel during the different alert levels. The data, provided by the
South African National Road Agency Ltd (SANRAL), relates to daily traffic volumes, known as average
daily traffic (ADT). It was collected by roadside traffic sensors mainly along national routes, in both
urban and rural areas.

LOCAL TRAVEL
During alert levels 5 and 4, only limited local travel was allowed within cities (Table 6.4.1). Figure 6.4.3
shows daily travel for various locations in Gauteng, demonstrating that daily trips fell dramatically at
the start of the lockdown on 27 March. In April, traffic was at 20–30% of normal levels, and it increased
to 40–60% of normal levels during alert level 4. Traffic increased again at the start of alert level 3 and
then stabilised. In general, traffic in lower-income areas recovered faster than in affluent areas,
reflecting different patterns of employment. For example, traffic on the N4 west of Pretoria and the
N12 on the East Rand had recovered to 80% of 2019 ADT by alert level 3 and approached normal levels
by September 2020. In contrast, traffic on the N1 through Randburg, Lynnwood and Hatfield remained
subdued throughout level 3 and was still below 90% of 2019 levels by September. Traffic levels in
Gauteng appear to have reached 85–100% of normal levels by alert level 1, suggesting a recovery in
economic activity. In December 2020 traffic throughout the region approached 100% of normal levels;
however, it should be noted that traffic is usually lower in December than in the rest of the year
because of the festive season.

Chapter 6.4. Transport                     DRAFT 14/05/2021                                               4
Table 6.4.1: Restrictions on local, intracity travel
 Level                                 Restrictions
                                       Local travel permitted only for essential workers to reach their place of work and for members of
 5
                                       the public for grocery shopping and medical purposes
 4                                     Local travel to available services allowed, and travel to places of work allowed with permits
 3, 2 & 1                              All local travel permitted for allowed activities
Source: DPME, 2021

Figure 6.4.3: Variation in ADT in Gauteng, January to December 2020 (% change year-on-year)
                                 120

                                 100
     2020 ADT as % of 2019 ADT

                                  80
                                                                                                                       1834 N1 Lynnwood
                                                                                                                       2340 N4 Pretoria West
                                  60
                                                                                                                       1874 N1 Randburg
                                                                                                                       1980 N12 East Rand

                                  40                                                                                   2481 N1 Hatfield

                                  20

                                   0
                                         Jan Feb Mar Apr May Jun              Jul Aug Sep Oct Nov Dec

Source: Based on data from SANRAL

LONG-DISTANCE TRAVEL
Private, long-distance travel was strictly regulated during alert levels 5 and 4 (Table 6.4.2). Under alert
level 3, travel was only allowed for particular purposes. Figure 6.4.4 shows long-distance travel along
four major routes – the N1 north of Bloemfontein and near the border with Zimbabwe at Musina, the
N2 at Storms River, and the N3 at the Tugela Toll Plaza. Similar to the urban pattern, traffic dipped in
March 2020 and then dropped to 20–40% of normal levels in April. Traffic on three routes (the N1 in
both locations and the N3) recovered to over 60% of normal levels by May. Traffic on the N2 remained
below 40% of normal levels, probably because it is partly a tourist route. Long-distance traffic volumes
recovered steadily from May to October 2020. Interestingly, in December 2020 all traffic was relatively
lower than in the corresponding period in 2019. Closer inspection showed that this was not due to an
actual decline in traffic in the holiday period. Rather, traffic levels were fairly constant but simply much
lower than in previous holiday seasons. This suggests that relatively less long-distance travel was
undertaken over the festive season.

Chapter 6.4. Transport                                                    DRAFT 14/05/2021                                                     5
Table 6.4.2: Restrictions on long-distance, intercity travel
Level Restrictions
5 No travel permitted between provinces, metropolitan areas and districts
No travel permitted between provinces, metropolitan areas and districts
4 Once-off special dispensation for long-distance travel between 1 and 7 May 2020 for people who
were not at their place of residence when alert level 5 commenced to return home.
Long-distance transport between provinces, metropolitan areas and districts allowed for permitted
3
persons, according to a limited list of allowable trip purposes
2&1 Interprovincial travel permitted for all purposes
Source: DPME, 2021
Figure 6.4.4: Variation in long-distance ADT, January to December 2020 (% change year-on-year)
120
100
2020 ADT as % of 2019 ADT
80
2554 N1 Bloemfontein
60 2180 N3 Tugela Plaza
2540 N1 Musina
2404 N2 Storms River
40
20
0
Jan Feb Mar Apr May Jun Jul Aug Sep Oct Nov Dec
Source: Based on data from SANRAL
Figure 6.4.5 shows the daily variation in ADT along the N1 north of Bloemfontein from 1 March to 31
December 2020. Before the lockdown, very typical long-distance traffic patterns were evident, with
traffic increasing during the week, reaching a maximum on Fridays, and falling to a minimum on
Mondays. Two lockdown peaks can be observed: the two days before the start of the lockdown, when
traffic nearly doubled, and the first week of May, when people could return home under a special
dispensation. Throughout the rest of the lockdown, daily traffic has increased gradually. Since alert
level 3, traffic has reverted to the typical long-distance pattern, albeit at a lower level than before. By
November 2020, traffic patterns were fairly similar to those in March 2020, before the lockdown.
Traffic increased notably in the December festive season, as well as around the long weekend
associated with Heritage Day in September.
Chapter 6.4. Transport DRAFT 14/05/2021 6Figure 6.4.5: Daily variation in ADT, station 2554 (N1 north of Bloemfontein)
18000
16000 LEVEL 5 LEVEL 4 LEVEL 3 LEVEL 2 LEVEL 1
ADT (vehicles per day)
14000
12000
10000
8000
6000
4000
2000
0
Source: Based on data from SANRAL
ROAD-BASED, CROSS-BORDER TRAVEL VIA LAND PORTS
No travel across land borders was permitted during alert levels 5 to 2, other than for repatriation.
Borders were opened to international travellers only from alert level 1. Even before the official
lockdown, the pandemic had already affected cross-border migration. Total arrivals of South African
citizens in March 2020 were down 35,6% year-on-year (33,7% for foreigners), while departures
dropped by 45,0% for citizens and 25,2% for foreign travellers (Stats SA, 2020b). April 2020 saw a
dramatic change, as migration figures dropped by 97% for citizens (both arrivals and departures), and
arrivals of foreign travellers fell by 98% (Stats SA, 2020c).
Figure 6.4.6 summarises the impact of alert levels 5 to 1 on road-based travel across borders. Initially,
as noted, the main reason for cross-border travel was repatriation; travel increased slightly as
restrictions were eased. From the start of alert level 1 on 21 September 2020, cross-border travel was
allowed without special dispensation. Soon, the cross-border movement of both South African and
foreign nationals doubled; however, it remained dramatically lower than before. In December 2020,
the increase in cross-border movement was even more significant, presumably because both migrant
workers and holidaymakers travelled for the festive season. Box 6.4.1 discusses the resulting pressures
on one border post, Beitbridge.
Figure 6.4.6: Cross-border arrivals and departures by road, 2020
700
Number of people (thousands)
600
500
SA resident arrivals
400
300 SA resident departures
200 Foreigner arrivals
100
Foreigner departures
0
Source: Based on Statistics South Africa’s monthly Tourism and Migration Statistical Releases
Chapter 6.4. Transport DRAFT 14/05/2021 7Box 6.4.1: Congestion at Beitbridge border post The Beitbridge border post between South Africa and Zimbabwe was heavily congested in December 2020, and the resulting delays were severely criticised in the media. At the peak of the congestion, vehicle queues exceeded 15 km on both sides of the border. The line on the South African side stretched all the way into the town of Musina. It was reported in the media that four travellers, including two truck drivers, died waiting to cross the border during December 2020, reportedly from thirst, hunger, and exhaustion – some had waited to cross the border for about 5 days. The congestion was caused by a combination of factors, linked with regulations imposed by the Department of Home Affairs and customs operations. Thirty-three land ports had been closed, leaving the remaining 20 to deal with significantly more traffic. In December 2020, for example, about 2000 more trucks used the Beitbridge border post than in December 2019. When holding areas overflowed, trucks were forced to park on the side of the road and eventually in traffic lanes, completely blocking traffic. Also, many people did not have the requisite Covid-19 test results before reaching the border post. Many opted to be tested at the border instead, possibly because the tests were significantly cheaper in South Africa than in Zimbabwe. The high number of people who needed to be tested at the border post created serious backlogs. A final factor was the curfew imposed in South Africa, which required the post to be closed between 22:00 and 04:00, further disrupting traffic flows. In December 2020 the South African cabinet approved the draft One-Stop Border Post Policy, which aims to harmonise the movement of people and goods between the country and its neighbours. A project to upgrade the Beitbridge border post is underway, which will increase the capacity of the bridge and will separate freight from passenger traffic. However, the project has reportedly been hampered by the lack of counter-funds from the Government of Zimbabwe. The Department of Transport earlier requested the transfer of road ownership in the vicinity of border posts from the Department of Public Works and Infrastructure to SANRAL. However, the roads will be transferred to the Border Management Authority; the aim is to improve efficiency by providing a single authority to oversee all aspects of the border environment. Source: SABC News, 2020 PUBLIC TRANSPORT Public transport can be a rapid transmission medium for Covid-19 (Zhen, et al., 2020), because the virus is transmitted through air-suspended respiratory droplets lasting up to three hours or through objects contaminated with such droplets (known as fomites), on which it lasts from a few hours to a few days (UITP, 2020a). The risk of transmission increases in crowded, indoor spaces, especially where air is recirculated. The efficacy of physical distancing is limited indoors, particularly for longer exposures. Based on a survey of another influenza virus, H1N1, infected persons were six times as likely as uninfected ones to have recently used public transport (Zhen, et al., 2020). Precautionary measures to minimise transmission in public transport elsewhere in the world include encouraging people to reduce their use of public transport, making PPE compulsory, and rotating staff periodically. The pandemic saw a reduction in the use of public transport by as much as 80% in some parts of the world (UITP, 2020a). Still, analyses of reported cases suggest that public transport has been responsible for a relatively small proportion of community transmissions, for example as little as 0,2% in Germany and 1,2% in France (UITP, 2020b). That said, South Africa’s characteristically long commutes and highly peaked travel demand create particularly favourable conditions for infection. South African commuters were clearly aware of these risks, as demonstrated in research conducted by Ask Afrika’s (2020) market research (up to alert level 3). They found that: Chapter 6.4. Transport DRAFT 14/05/2021 8
•   Many users of public transport did not feel safe from the virus in buses or taxis (only 40% felt safe
    on buses and 31% on taxis). Commuters saw public transport as the highest risk factor for
    contracting Covid-19 (Figure 6.4.7).
•   Most people welcomed the requirement to wear masks on public transport.
•   Over half of people travelled by minibus taxi during the lockdown; the highest usage figure was in
    the townships (74%). Only 14% of township residents used buses to commute.
•   Most taxi commuters wore masks (96%) or sanitised their hands before (75%) and after (70%)
    leaving the taxi. They found social distancing difficult.

Figure 6.4.7: Public perceptions of high-risk areas for contracting Covid-19

Source: Ask Afrika, 2020

The minister of transport published regulations on 1 May 2020 (DoT, 2020b) to mitigate the spread of
the virus among people using public transport. These included the following:
•   All long-distance and interprovincial services would be prohibited throughout the lockdown.
•   Public transport would only be permitted to ferry essential service workers and could only operate
    from 05:00 to 09:00 and from 16:00 to 20:00.
•   No person would be allowed to travel while standing in a public transport vehicle.
•   All operators had to sanitise vehicles before picking up and after dropping off passengers.
•   All public transport operators had to provide disinfection information, materials and procedures.
•   All drivers had to wear a mask.
•   Marshals interacting with members of the public were required to wear a mask.

Chapter 6.4. Transport                     DRAFT 14/05/2021                                            9
Commuters who rely on public transport were severely affected by these regulations. Waiting times
were excessive during peak periods, and train users had to switch to more expensive modes (typically
paying two to three times more) because passenger rail services were halted. The impact on each
mode of public transport is addressed in the sections below.
RAIL SERVICES
PRASA
PRASA passenger rail services had been decreasing steadily even before the pandemic, because of
reduced operational capacity and poor service quality. In 2019 the number of rail passenger journeys
fell by about 31% year-on-year (Stats SA, 2020a). January and February 2020 also saw significant
decreases in passenger numbers – over 40% year-on-year. By April, lockdown restrictions meant that
no rail trips were made (Table 6.4.3). Passenger numbers recovered only marginally once the various
services came back online. In July and August 2020, when some PRASA services resumed, passenger
rail trips were still between 98% and 97% lower, respectively, than during the same months in 2019.
By November 2020 (alert level 1), PRASA operated about 250 weekday train trips, significantly fewer
than the about 1750 trips under its full timetable.
Table 6.4.3: Restrictions on passenger rail services
Level Restrictions
5 All public and private long-distance and commuter rail services are suspended.
PRASA and Metrorail long-distance and commuter rail services remain suspended.
4 Gautrain operations resume (except the airport service) at 50% coach capacity and during limited
hours of operation (05:00–12:00 and 15:00–20:00).
PRASA and Metrorail commuter rail services remain suspended at the start of alert level 3. From
1 July, some PRASA commuter routes are reinstated.
3
Long-distance rail passenger transport remains suspended.
Gautrain operations continue at 50% coach capacity, with the airport service reinstated.
The majority of commuter passenger rail services resume at 70% coach capacity.
2&1
All long-distance passenger rail services are permitted at 70% coach capacity.
Source: DPME, 2021
When commuter rail services in urban areas were stopped early in the lockdown, train stations were
severely vandalised, in part because of protracted legal battles between PRASA and security service
providers. A site visit to Soweto during alert level 3 found the Kliptown, Nancefield, Mlamlankunzi,
Mzimhlope, Dube and Ikwezi stations in poor condition. Entrance kiosks, toilets, offices, windows and
doors had been vandalised, and overhead high-voltage electricity cables had been cut (Nkosi, 2020).
In its 2019/20 annual report, PRASA (2021) confirmed that overhead traction equipment cables were
being stolen on daily basis, particularly in Gauteng, and some ticket offices had been badly vandalised.
This undermines its longer-term capacity to generate revenue. PRASA reported a loss of about
R100 million per month in April and May 2020, including the loss of tenant rental income. However, it
continued to receive an operational subsidy, which in 2019/20 covered all employee-related costs,
Chapter 6.4. Transport DRAFT 14/05/2021 10along with repairs and maintenance (PRASA, 2021). Limiting the service capacity and associated loading from 1 July 2020 worsened PRASA’s losses. Because electrical infrastructure on some lines had been vandalised, it deployed leased diesel locomotives for these lines, which further increased its operating costs. Some of these losses were offset by savings on energy and overtime payments. PRASA (2020) blamed delays in the roll-out of its capital programme on the pandemic, for reasons such as the Treasury prohibition on advertising bids during lockdown; the non-evaluation of closed bids; the prohibition on construction work; and a shortage of supplies. These claims are refuted by the Department of Transport, which attributes the delays to the general lack of project management capacity within PRASA. It notes that under the same circumstances, SANRAL was able to mobilise resources for construction work when permitted by the regulations (Moemi, 2021). In October 2020, the National Treasury approved R900 million for PRASA, mainly to fund a responsive security solution to the rampant vandalism. PRASA suggested it needed to increase its personnel from 3 113 to 10 693; the funds from the Treasury would not be sufficient to support such an increase. However, PRASA also benefitted from R1,2 billion converted from its capital expenditure budget to the operational budget to help fund the management of Covid-19-related risks (PRASA, 2021). Gautrain The Gautrain was permitted to resume operations at the start of alert level 4. Management focused on instilling confidence and ensuring passenger safety, and quickly put social distancing measures in place. In fact, Gautrain’s response in this regard set good practice standards. Specific interventions included running the maximum number of eight-car (rather than four-car) trainsets to facilitate social distancing, introducing midi-bus taxi services, reviewing Gautrain bus routes to augment the number of feeder and distribution routes around stations, and adding stops and changing routes to serve health workers in the catchment areas. Gautrain ridership was seriously affected by the pandemic; a decline was already evident in the week before the lockdown (Figure 6.4.8). As travel restrictions eased, patronage increased slowly, but by alert level 3, it was still only about 10% of normal levels. Parking bays at Gautrain stations remain grossly underutilised even at alert level 1. For example, the Hatfield Station’s 2300 parking bays used to be near full capacity, but fewer than 10% of bays were used on a weekday during alert level 1. By November 2020 passenger demand on the Gautrain stood at 30% of pre-Covid-19 levels; it was expected to remain low in the short run (National Treasury, 2021). The revenue risk to the Gautrain operator, Bombela Concession Company, is relatively limited, as it has a patronage guarantee arrangement with the Gauteng Provincial Government. For 2020/21, Gauteng estimated that the patronage guarantee fee would come in at R400 million more than its original budget (National Treasury, 2021). Chapter 6.4. Transport DRAFT 14/05/2021 11
Figure 6.4.8: Average daily Gautrain trips

Source: Based on data from the Gautrain Management Agency

BUS SERVICES
The restrictions on bus services (Table 6.4.4) led to a drop in passenger numbers of about 80% year-
on-year during alert level 5 (Figure 6.4.9). Bus passenger numbers increased somewhat in alert level
4, and by level 3, numbers stabilised at just below 60% of normal passenger volumes. The Southern
African Bus Operators Association, which represents about 70% of bus and coach public transport
operators, reported significant disruption to the sector. During alert level 5, only 10% of its national
bus fleet was in use; this rose to 33% during level 4. Many operators were not permitted to operate
at all during alert levels 4 and 5, when long-distance travel was prohibited. Contracted commuter
services experienced a decline in passenger numbers of 92% in April 2020.

Table 6.4.4: Restrictions on bus services
 Level   Commuter services                                Long-distance services
         Limited local operations for essential workers
 5                                                        Not permitted
         and permitted movements of other people
         Limited local bus operations between 05:00       Permitted during 1–7 May 2020 to help people
 4
         and 20:00 at 50% of passenger capacity           move to their homes in other areas
         Permitted at 50% of passenger capacity with      Allowed for permitted persons, and a limited list of
 3       no restrictions on operating times               purposes, at 50% of capacity
         From 16 July 2020: 100% capacity                 From 16 July 2020: 70% of capacity
 2&1     Permitted at 100% of passenger capacity          Interprovincial travel permitted at 70% of capacity
Source: DPME, 2021

The state contracts with subsidised commuter buses based on the number of kilometres operated or
number of passengers carried. The lockdown meant that these subsidy payments decreased by 51%
in April 2020 (29% in May and 16% in June). Passenger fare income decreased more significantly, by
82% in April, 66% in May, and 46% in June. When commuter bus services cannot operate for reasons

Chapter 6.4. Transport                       DRAFT 14/05/2021                                                12
beyond the control of the operators, they continue to receive a portion of the contract fee as
‘standing’ kilometres. In Gauteng, operators can claim about 60% of the agreed fee. However, for
many operators, overhead costs exceed 60% of the contract fee. They would normally offset these by
operating supplementary services for funerals, tours, church services, and other excursions. However,
such excursions had also been suspended under the lockdown. This implies that most bus operators
would have experienced operating losses. In addition, Covid-19 safety and hygiene protocol
requirements are estimated to cost about R180 per bus per day, or R100 million per month for the
sector as a whole (Govender, 2020).
Figure 6.4.9: Bus passengers, January to August 2020 (% change year-on-year)
120
100
2020 Bus trips as % of 2019 ridership
80
60
40
20
0
Jan Feb Mar Apr May Jun Jul Aug
Source: Stats SA, 2020a
Based on an industry survey, the Gauteng Department of Roads and Transport estimated that
operators would need to be supported to the tune of R6 576 per bus for PPE and cleaning and
sanitising of facilities (GDRT, 2020). It further estimated that a once-off relief package of over
R110 million would be needed to compensate bus operators for losses stemming from pandemic-
related regulations (about R60 000 per bus). The Department of Transport planned to source relief
funding for subsidised commuter bus services from savings made in the public transport operations
grant. However, spending in this regard appears to have slowed down over time, owing to forensic
investigations into the procurement of PPE (Moemi, 2021).
Long-distance buses typically carry labour costs of about R100 000 to R150 000 per month per bus
(Mokonyama, own calculations). Other standing costs, such as security, property-related costs and
insurance, add a further 30–50% of labour costs. This implies standing costs of about R130 000 to
R225 000 per month per bus. Long-distance bus operators would have incurred these costs without
generating any fare revenue, which is normally about R15 per kilometre. Given capacity restrictions
(i.e. a maximum 70% of capacity under alert level 1), long-distance bus operators would be losing a
minimum of about R4,50 per kilometre, even before taking additional spending on Covid-19 risk
mitigation measures into account.
Chapter 6.4. Transport DRAFT 14/05/2021 13MINIBUS TAXI SERVICES Of all the public transport modes, minibus taxis had the most to lose in the pandemic. This industry comprises about 200 000–300 000 vehicles and creates about 350 000 jobs (Mbalula, 2020). During alert level 5, vehicles were permitted to load only to 70% of licensed capacity (Table 6.4.5), and it is estimated that less than 60% of the minibus taxi fleet was in use. About 20% of the taxi industry faced a total loss of income, particularly long-distance and cross-border operators (Mbalula, 2020). The minibus taxi industry responded negatively to the restrictions on public transport operations, particularly the reduction in the allowable vehicle capacity. After reported threats of a strike by the industry, the minister of transport announced on 1 April 2020 that minibus taxis would be allowed to load to full capacity, provided passengers wore face masks (SAnews, 2020b). The minister further announced a government commitment to assist minibus taxi operators with supplies of surgical masks and sanitisers. However, taxis would not be allowed to load to full capacity if passengers were not wearing masks. Following another public outcry, this time about the full-capacity loading of minibus taxis, on 2 April 2020 the minister of CoGTA amended the lockdown regulations, limiting taxi services to no more than 70% of their licensed capacity (CoGTA, 2020b). Table 6.4.5: Restrictions on minibus taxi services Level Short-distance services (
Box 6.4.2: Cape Town minibus taxi industry
    Independent interviews were conducted with four taxi associations in the Cape Town area, which together
    operate about 240 minibus taxis. Services included local distribution routes in Khayelitsha and Mitchells Plain,
    as well as line haul operators providing services to Cape Town and Bellville central business districts.
    Taxi operators reported a 60–70% drop in demand for taxi services in alert levels 5, 4 and 3. Demand for
    services recovered somewhat in alert level 2, with passenger levels increasing to 50–80% of 2019 levels,
    depending on service types. Line haul movements were the most affected and remained subdued.
    To compensate for the reduction in passenger demand and to ensure that all operators would carry some
    passengers, the associations implemented a rotating operating schedule, with taxis operating on a one-day-
    on, one-day-off system. Vehicle owners reported that while no drivers were laid off, earnings decreased. Many
    owners were forced to default on vehicle financing repayments.
    Source: McLachlan, 2020

On 19 June 2020, the minister of transport announced a once-off relief package for the minibus taxi
industry to the tune of R1,135 billion (Mbalula, 2020). This would translate to about R5 676 per vehicle
for the estimated 200 000 minibus taxis on the road. These funds would be paid out in once-off
amounts to legal taxi operators with valid operating permits (i.e. just over than half of operators or
about 137 000 taxis) and would apply to various roles in the industry, including taxi owners, drivers,
rank managers and marshals. It would also provide relief to other taxi services, including metered taxi
operators (about 25 000 registered taxis) and e-hailing services (about 63 000 registered drivers). The
taxi industry rejected the proposed fund as too small; they cited the critical importance of the industry
and the massive size of the overall relief package announced by the president (R500 billion). Operators
requested relief of R20 000 per vehicle, to be paid directly to them and not to the associations.

The Department of Transport (Moemi, 2021) indicates that, ultimately, the taxi industry agreed with
the R1,135 billion relief package; however, they required this to be paid without any conditions, which
the department refused. The conditions (reportedly rejected by the industry) were:
•      Registration for income tax
•      Registration of formal businesses
•      Transferral of valid operating licences from individual operators to the registered businesses
•      Registration of industry employees with the Unemployment Insurance Fund
•      Compliance with sectoral determinations by the minister of employment and labour, including the
       payment of minimum wages.
In order to reduce the risk of losing the relief fund to the revenue fund by end-March 2021 (due to
non-expenditure), the Department of Transport plans to publish the relief conditions in a Government
Gazette. The aim is to allow individual operators who wish to comply with the conditions to apply for
the relief fund (Moemi, 2021).

PASSENGER AIR TRANSPORT
The airline industry had been in financial difficulty even before the pandemic. South African Airways
and SA Express were placed in business rescue in December 2019 and February 2020 respectively.
Comair voluntarily entered business recue in April 2020 (Zweigenthal, 2020). The pandemic greatly

Chapter 6.4. Transport                           DRAFT 14/05/2021                                                 15
exacerbated these problems. The Airlines Association of Southern Africa estimates that 40 000 jobs
are at risk in the directly related aviation sector, as are 270 000 jobs in related sectors. Many
employees had their salaries reduced, were forced to take paid or unpaid leave, or were retrenched.
Figure 6.4.10 shows international and domestic arrivals at OR Tambo and Cape Town International
Airport as a percentage of 2019 trips. In January 2020, all airports had seen growth in domestic and
international travel. International arrivals at OR Tambo International Airport dropped slightly in
February 2020 and all air travel dropped sharply in March 2020, suggesting that passengers had
already been wary of travelling before the lockdown. Passenger air travel was all but prohibited during
the lockdown, being limited to repatriation flights in alert levels 5 and 4 (Table 6.4.6). Unsurprisingly,
from April to June 2020, international arrivals fell by over 99% year-on-year (DT, 2020).
Figure 6.4.10: Air passenger arrivals, January to September 2020 (% change year-on-year)
120,0
OR Tambo International
100,0
OR Tambo Domestic
2020 values as % of 2019
80,0 Cape Town International
Cape Town Domestic
60,0
40,0
20,0
0,0
Jan Feb Mar Apr May Jun Jul Aug Sep Oct Nov Dec
Source: ACSA, 2020
Table 6.4.6: Restrictions on passenger air transport
Level Restrictions
All domestic and international passenger flights suspended
5&4
Repatriation flights can bring citizens home and return foreign nationals to their home countries
Domestic air travel allowed for business purposes, with authorisation based on the reason for travel
3 Flights operated from a few airports allowed to start operations in a phased approach
International passenger flights prohibited unless authorised by the minister of transport
Domestic air travel allowed for all purposes
2
International passenger flights prohibited unless authorised by the minister of transport
Domestic air travel allowed for all purposes
1 International passenger flights allowed, except where travel to and from South Africa had been
restricted by the destination country
Source: DPME, 2021
Under alert level 3, domestic travel was allowed from various airports (Table 6.4.7). This contributed
to a gradual increase in domestic passenger numbers from June 2020. Alert levels 2 and 1 saw an
increase in local air travel, recovering to 50% and 58% of 2019 levels in December at Cape Town and
Chapter 6.4. Transport DRAFT 14/05/2021 16OR Tambo International Airports respectively. With international travel again allowed from alert level
1, international movements increased suddenly from October 2020. However, it remained subdued
until the end of 2020, at about 20% of the normal passenger numbers.
Table 6.4.7: Resumption of passenger flights at local airports
01 June 29 June 21 July 25 August
Airports OR Tambo INT Bram Fischer East London Mthatha
opened Cape Town INT Kruger-Mpumalanga George Hoedspruit
King Shaka INT Pietermaritzburg Kimberley Phalaborwa
Lanseria INT Port Elizabeth Margate
Richards Bay
Skukuza
Upington
Source: DPME, 2021
FREIGHT MOVEMENT
INTERNATIONAL FREIGHT
Land, sea and airports were closed to passenger movement during the strictest part of the lockdown,
but freight movements through ports were allowed to continue, as shown in Table 6.4.8 (DPME, 2021).
Trends in the export prices of local produce and the prices of imported commodities (Figure 6.4.11)
suggest the pandemic has had little influence on the import and export market. The unit value index
of imports decreased steadily throughout 2019; this trend continued to June 2020, after which imports
stabilised. The unit value index of exports increased until April 2020 and then remained relatively
constant for the remainder of 2020.
Figure 6.4.11: Monthly unit value index of imports and exports, January 2019 to December 2020
120
100
80
Unit Value Index
60
Import
Export
40
20
0
Aug-19
Aug-20
Dec-19
Dec-20
Feb-19
Mar-19
Jun-19
Feb-20
Mar-20
Jun-20
Jul-19
Jul-20
Apr-19
Apr-20
Jan-19
Oct-19
May-19
Jan-20
Oct-20
May-20
Sep-19
Sep-20
Nov-19
Nov-20
Source: Stats SA, 2020a
Chapter 6.4. Transport DRAFT 14/05/2021 17Table 6.4.8: Restrictions on international freight
Levels Restrictions
Only essential cargo (defined by government notices in terms of the Disaster Management Act)
5&4
allowed to enter and exit at land, sea- and airports. No crew changes allowed
Cargo allowed to enter and exit at land, sea- and airports; South African crew permitted to embark
3, 2 & 1
and disembark from cargo ships.
LOCAL FREIGHT
The average daily truck traffic (ADTT) – the number of heavy vehicles (trucks) counted on the main
national distribution routes – gives a good indication of local freight movements. Figure 6.4.12 shows
monthly ADTT on four national routes (the N1 north of Bloemfontein and close to the border with
Zimbabwe at Musina, the N2 at Storms River, and the N3 at the Tugela Toll Plaza). Truck traffic at
these locations decreased slightly in March 2020 and then fell to 40–60% of normal levels in April.
While not insignificant, this is not as severe as the decrease in private vehicle traffic at the same
locations. Truck traffic returned to normal levels by June, except along the N2, which carries
proportionally less freight. Although traffic along the N1 close to Musina returned to levels similar to
those of 2019, these still fell short of the traffic levels observed in January and February 2020.
Figure 6.4.12: Monthly ADTT on long-distance routes (% change year-on-year)
140
120
100
80 2554 N1 Bloemfontein
2180 N3 Tugela Plaza
60 2540 N1 Musina
2402 N2 Storms River
40
20
0
Jan Feb Mar Apr May Jun Jul Aug Sep Oct Nov Dec
Source: Based on data from SANRAL
Payload data highlights the subdued movement of local freight in the pandemic (Figure 6.4.13). While
payloads were below normal throughout 2020, April saw the largest fall (-39,7%). These reductions
relate to reduced movements of manufactured food, beverages and tobacco products, as well as
containers, basic metals and fabricated metal products (Stats SA, 2020a). September and November
2020 saw freight payloads approaching pre-pandemic levels (January to March 2020), while in
December 2020 freight payloads exceeded 2019 levels for the first time in the year.
Chapter 6.4. Transport DRAFT 14/05/2021 18Figure 6.4.13: Monthly freight payload (% change year-on-year)
Jan Feb Mar Apr May Jun Jul Aug Sep Oct Nov Dec
5
0
-5
-10
-15
-20
-25
-30
-35
-40
Note: Base=December 2016; Source: Stats SA, 2020a
ROAD SAFETY
Traffic accident numbers are directly influenced by the number of vehicle kilometres travelled and
alcohol intake, both of which were significantly lower during the lockdown. When vehicle volumes on
major roads fell dramatically after lockdown, relative to the same period in the previous year, so did
fatal accidents (Figure 6.4.14). Particularly striking was the massive reduction in fatal crashes during
the Easter period (Table 6.4.9). As restrictions were slowly eased, accident numbers started to rise
again. Figures from the eThekwini Transport Authority for April (2018: 5597; 2019: 6115; 2020: 997)
show an 85% decrease in the number of crashes. Under alert level 2, the number of crashes increased
but remained much lower than in the previous year (2148, against 6289 in May 2019). Worth noting
is that crash numbers in eThekwini fell further than did traffic flow levels. This disproportionate
decrease in crashes probably reflects the banning of alcohol sales.
Figure 6.4.14: Fatal crashes and traffic volume, 2019 and 2020
Note: Traffic volumes obtained mainly from toll plazas on national roads; most plazas are in rural areas.
Source: Based on data from the Road Traffic Management Corporation
Chapter 6.4. Transport DRAFT 14/05/2021 19Table 6.4.9: Easter Holiday road fatalities, per province, 2019 and 2020
Year Gauteng KwaZulu- Western Eastern Free Mpuma- North Limpopo Northern National
Natal Cape Cape State langa West Cape
2019 16 37 18 22 4 17 13 32 3 162
2020 3 6 3 5 0 7 3 1 0 28
% change -81 -84 -83 -77 -100 -59 -77 -97 -100 -83
Source: RTMC, 2020
Most of the 2020/21 festive season took place under alert level 3, when alcohol was still banned. The
Department of Transport reported a 10,3% year-on-year reduction in fatal crashes nationally, along
with a 7% reduction in fatalities in this period (Zwane, 2021). Based on the lessons learnt from the
banning of alcohol and its impact on road crashes, the department plans to amend the National Road
Traffic Act to reduce the blood alcohol level limit for drivers to zero and also to introduce severe
penalties for drunk driving (Moemi, 2021). It further wishes to extend penalties to every form of
intoxicated driving, including from the use of drugs.
THE CHANGING FACE OF TRANSPORT
As noted, the pandemic has significantly changed how people work and, hence, how they use
transport. Businesses are likely to allow greater flexibility and more working from home, which would
affect transport across modes and patterns in peak periods. However, the pandemic also underscored
disparities in the provision of transport. Most people do not have the option of working from home.
More emphasis is being placed on walking and cycling as modes of travel, recognising that social
distancing is a new argument in support of these options. However, where distances are too far for
walking and cycling, minibus taxis continue to fill the gap, and given the relative weakness of bus and
rail services, are likely to play an increasingly important role. In a pandemic, people who own cars
prefer the safety of their own vehicles. Thus, Covid-19 probably reversed any nascent shifts from
private to public transport.
LESSONS LEARNT
The following key lessons are worth noting:
• Travel demand is elastic to enforced regulations. South Africa can benefit from travel demand
management, where regulations are used to influence travel in order to manage peak volumes.
• Pandemics can have a severe impact on transport infrastructure, systems and operations.
Therefore, the transport sector needs robust business continuity plans.
• The resources required to implement lockdown regulations were not properly estimated. It was
assumed, for example, that operators would finance the implementation of the regulations;
however, the operators had structural cash flow constraints. The financial impact of the lockdown
has been especially severe on the minibus taxi industry, which carries the majority of travellers.
Chapter 6.4. Transport DRAFT 14/05/2021 20• Conflicting medical advice on the risk posed by public transport creates uncertainties about the
use of public transport services. Unambiguous and scientifically supported messaging is vital. Such
uncertainties could have severely affected services such as the Gautrain, which is used mainly by
people who have access to private vehicles.
• While walking remains a predominant mode of travel, with a lower risk of Covid-19 transmission,
there were few, if any, initiatives to improve conditions and infrastructure for walking and cycling.
RECOMMENDATIONS
• The various regulations published by CoGTA and the national Department of Transport assumed
the availability of technical capacity and financial resources to implement them. In reality, the
relevant entities and departments were ill resourced. The development of a business continuity
plan for the transport sector is therefore recommended. The Department of Transport should set
out broad guidelines in this regard and not leave it to individual operators. The plan must include
the financing of public transport for resilience and incorporate spatially represented social
vulnerability. This would, for example, inform the targeted provision of relief to essential workers.
A periodically updated register of essential workers is key, especially in vulnerable communities.
• A more equitable public transport subsidy policy should be adopted to also cater for minibus taxi
operations.
• Some employers had apparently been willing to contract dedicated public transport service
providers for the exclusive use of their employees in order to minimise transmission risks. Such an
arrangement should be proactively facilitated and supported in the regulations. Elsewhere in the
world, for example Hong Kong, underutilised taxi services were used to deliver goods.
• The National Treasury and the Department of Trade, Industry and Competition must work
together to formulate a responsive disaster management policy for supply chains that include the
automotive and construction sectors.
• More in-depth research on the risks of disease transmission on public transport is required.
Practices adopted by various stakeholders to minimise the transmission and impact of Covid-19
in the transport sector must also be documented. Such lessons may help improve the transport
sector adapt faster to other disease outbreaks and disasters, including from climate change, for
example.
Chapter 6.4. Transport DRAFT 14/05/2021 21You can also read