Compliance map and future requirements - 23/03/2021 Author(s): Marisa Meta, FIT Consulting Detailed Project23/03/2021 Author(s): Yannick Bousse ...
←
→
Page content transcription
If your browser does not render page correctly, please read the page content below
Compliance map and
future requirements

 23/03/2021
 Author(s): Marisa Meta, FIT Consulting

 Detailed Project23/03/2021
 Author(s): Yannick Bousse, UITP
D3.3 Compliance map and future requirements 2

SUMMARY SHEET

Deliverable No. 3.3

Project Acronym GECKO

 Governance principles and mEthods enabling deCision maKers to
Full Title
 manage and regulate the changing mObility systems

Grant Agreement No. 824273

Responsible Author(s) Marisa Meta, FIT Consulting

Responsible Co-Author(s) N.a.

Peer Review N.a.

Quality Assurance Committee
 Wolfgang Backhaus, RC
Review

Date 23/03/2021

Status Final

Dissemination level Public

 The Compliance Map is a tool for policy-makers measuring the level
 of compliance of different regulatory schemes in enabling the
 societal, environmental and economic impacts achievable through
 the implementation of newly emerging disruptive innovations
Abstract identified in WP1, while at the same time safeguarding adequate
 level of security, safety, data privacy, and social protection.
 The Compliance Map will be a practical synthesis of the similarities,
 differences, trade-offs and patterns across different regulatory
 schemes that share a common focus or goal

Version 1.0

Workpackage No. 3

Workpackage Title Impact assessment and prospects for regulatory schemes

Programme Horizon 2020

Coordinator UITP – The International Association of Public Transport

Website www.h2020-gecko.eu
D3.3 Compliance map and future requirements 3

Starting date December 2018

Number of months 33

This report is subject to a disclaimer and copyright. This report has been carried out under a contract awarded by the European
Commission, contract number: 824273. The content of this publication is the sole responsibility of the GECKO project.
D3.3 Compliance map and future requirements 4

PROJECT PARTNERS

Organisation Country Abbreviation

UNION INTERNATIONALE DES TRANSPORTS PUBLICS BE UITP

FIT CONSULTING SRL IT FIT

UNIVERSITY COLLEGE LONDON UK UCL

POLIS - PROMOTION OF OPERATIONAL LINKS WITH INTEGRATED BE POLIS
SERVICES, ASSOCIATION INTERNATIONALE
IRU PROJECTS ASBL BE IRU

RUPPRECHT CONSULT-FORSCHUNG & BERATUNG GMBH DE RC

CAPITAL HIGH TECH SARL FR CHT

ABO AKADEMI UNIVERSITY FI ÅA

CONFEDERATION OF ORGANISATIONS IN ROAD TRANSPORT BE CORTE
ENFORCEMENT
UNIVERSITA COMMERCIALE LUIGI BOCCONI IT UB
D3.3 Compliance map and future requirements 5

DOCUMENT HISTORY

 Version Date Organisation Main area of changes Comments

 Draft Table of Contents –
 0.1 04/11/2020 FIT
 First draft
 Sent to RC for
 0.2 12/11/2020 FIT Draft Table of Contents Quality Assurance
 review
 Quality assurance
 0.3 13/01/2021 RC Draft Table of Contents
 Review

 0.4 01/03/2021 FIT Draft Updated

 1.0 23/03/2021 UITP Final review and submission

LIST OF ACRONYMS

CAV – Connected and Automated Vehicles

KPI – Key Performance Indicators

MCA – Multi-Criteria Analysis

NMS – New Mobility Services

RC – Regulation Compliance

RR – Regulation Readiness

TNC – Transport Network Companies

NOTE To the reader:

In the previous deliverables case studies and mobility solutions have been used in an
interchangeable way. From now on, we will only use mobility solution to describe CAV,
drones for last mile delivery, Big data for transport and mobility, MaaS, Car-Sharing, Bike
Sharing, E-scooter sharing/ Micromobility, Ride-hailing and TNC, On-demand
ridesharing/Car-pooling.
D3.3 Compliance map and future requirements 6

The screenshots of the Compliance Map included within the present document have to be
used just by way of examples and do not necessarily represent the final version of the online
tool, which will be updated until the end of the project (i.e. after the release of this
deliverable) to include as many new regulations as possible that could come up to the
project’s end and that could consequently change the analysis of indicators, barriers and
potential scenarios underpinning the Compliance Map.
D3.3 Compliance map and future requirements 7

TABLE OF CONTENTS

 EXECUTIVE SUMMARY ........................................................................................................................................... 9
 INTRODUCTION 10
 1 FEATURES 12
 1.1 FUNCTIONALITIES OF THE COMPLIANCE MAP .............................................................................................. 14
 1.1.1 The Regulation Compliance – RC ........................................................................................................ 15
 1.1.2 The Regulatory Readiness – RR........................................................................................................... 17
 1.1.3 Entrance Barriers for different mobility services, business models and technologies.................... 18
 2 TECHNICAL ASPECTS ....................................................................................................................................... 19
 2.1 DESIGN AND DATA PREPARATION .................................................................................................................. 19
 2.2 DEVELOPMENT................................................................................................................................................ 20
 2.1.1 Representing the results of the MCA through a geo-referenced visualisation - RC ......................... 20
 2.1.2 Methodology for projecting MCA results on future market penetration scenarios - RR .................. 20
 2.1.3 Presentation of the barriers ................................................................................................................ 23
 3 LAYOUTS OF THE TOOL ................................................................................................................................... 25
 4 PROMOTION AND MAINTANENCE OF THE TOOL ............................................................................................ 29
 4.1 PROMOTION OF THE TOOL............................................................................................................................. 29
 4.2 UPDATING OF THE REGULATORY FRAMEWORK DASHBOARD AND COMPLIANCE MAP ............................... 29
 5 CONCLUSIONS 30
 Reference Documents ........................................................................................................................................ 37
 ANNEX I – Compliance Map: Guidelines for the user ......................................................................................... 38
 ANNEX 2 – Indexes calculation ........................................................................................................................... 48
D3.3 Compliance map and future requirements 8

 LIST OF FIGURES
Figure 1 WP3 Tasks and workflow .................................................................................................... 10
Figure 2 Example of Tableau's Individual Chart .............................................................................. 12
Figure 3 Example of Tableau's Dashboard....................................................................................... 13
Figure 4 Example of Tableau's Story ................................................................................................ 13
Figure 5 Compliance Map embedded in the GECKO website .......................................................... 14
Figure 6 Example of low and high values of RC ............................................................................... 16
Figure 7 Data model used in the Compliance Map .......................................................................... 19
Figure 8 Configuration of levels of penetration in which car using (personal or in sharing) prevails
............................................................................................................................................................ 21
Figure 9 Configuration of levels of penetration in which soft mobility prevails ............................ 22
Figure 10 Example of Barriers presented in the Compliance Map for MaaS .................................. 23
Figure 11 Example of contents presented to the end-user if he/she hovers the mouse over a barrier
............................................................................................................................................................ 24
Figure 12 First layout – RC and RR page - overall view .................................................................... 26
Figure 13 First layout – RC and RR page - Comments appearing by hovering the mouse over each
country or city ................................................................................................................................... 26
Figure 14 First layout -RC and RR page - Interactivity of the Future Scenario Map with different
assets of mobility solutions’ penetrations ....................................................................................... 26
Figure 15 First layout - barriers page - overall view ......................................................................... 27
Figure 16 First layout - barriers page - Comments appearing by hovering the mouse on each
barrier ................................................................................................................................................ 27
Figure 17 Second layout RR webpage - Overall view....................................................................... 28
Figure 18 Second Layout - Directing the user towards the Barriers webpage ............................... 28
Figure 19 Conceptual scheme used for the definition of RC ........................................................... 48
D3.3 Compliance map and future requirements 9

EXECUTIVE SUMMARY

The present document outlines the development of the Compliance Map reporting the work
carried out in Work Package 3, “Impact assessment and prospects for new regulatory schemes”.

Section 1 describes the key features of the tool, by illustrating the three main functionalities
developed in the Compliance Map. Then Section 2 goes into more detail illustrating the technical
aspects explored during the development of the tool in order to find the most suitable solution to
make the contents elaborated in the project easily accessible and user-friendly. Thereby the main
layouts conceived have been illustrated in Section 3 together with the indication of the chosen
ones. Finally, Section 4 has been dedicated to the description of the strategy to be adopted for
promoting and maintaining the tool. As main conclusions, a closing chapter has been envisaged
to depict both differences and similarities found among regulatory schemes to generate a holistic
view of the Compliance Map.

Following a summary table of the conclusions chapter, which describes some good practices of
regulatory frameworks from the Compliance Map (please refer to the 5 CONCLUSIONS chapter for
a more in-depth description).

 Mobility Solution Regulation Compliance (national or local)

 Connected and Automated Vehicles Singapore and Australia

 Drone last mile delivery Australia

 Big data for transport and mobility Singapore and the United Kingdom

 MaaS and MaaS platforms United Kingdom, Sweden and Finland

 Car-sharing Germany and Sydney

 Bike sharing Chicago and Toronto

 E-scooter sharing/ Micromobility Chicago and Lisbon

 Ride-hailing and TNC United Kingdom and Toronto

 On-demand ridesharing/Car-pooling France and the United States
 Table 1 Summary table of some good practices of regulatory frameworks from the Compliance Map

The document includes also three annexes: first of all, a list of reference documents is provided;
Annex I is about a guideline, which is foreseen to be embedded within the dedicated Compliance
Map page on the GECKO website, aiming at conducting the end-user through the features of the
tool; Annex II reports the calculations details concerning the two indexes developed within the
tool.
D3.3 Compliance map and future requirements 10

INTRODUCTION

GECKO (Governance principles and mEthods enabling deCision maKers to manage and regulate
the changing mObility systems) aims at supporting authorities with tools and recommendations
in order to create a new regulatory framework, suitable for the transition to a new mobility era.

This work has gathered the results coming from previous work packages WP1 and WP2, namely:

 • Review of new mobility solutions and business models (WP1);
 • Investigation of main political, social and economic variables (WP2);

Then, WP3 brought together WP1 and WP2 findings and assessed impacts and prospects for
regulatory frameworks; in particular:

 • Task 3.1, starting from the regulations collected in the GECKO Regulatory Framework
 Dashboard reported in D3.1, has identified Key Performance Indicators (KPIs) to assess the
 social, economic and safety impacts of regulatory schemes for the implementation of
 emerging and disruptive technologies in mobility;
 • Task 3.2 has established metrics to assess the effectiveness of regulatory frameworks in
 enabling mobility disruptive innovations (detected within WP1) and defined a method to
 conduct the Multi-Criteria Analysis (MCA), reported in D3.2, in order to obtain an overall
 assessment of each regulatory framework from different points of view (Infrastructural,
 Political, Data, User/consumer awareness and acceptance, Safety, Completeness of pilots
 and contracts requirements, Environmental, Cooperation and Other).

The goal of Task 3.3, is then to illustrate these results as shown in the figure below:

 Figure 1 WP3 Tasks and workflow
D3.3 Compliance map and future requirements 11

In order to achieve this objective, an important building block of the project is the design and the
development of regulatory supportive tools highlighting new approaches for the regulations of
disruptive mobility solutions.

Among these tools, the Compliance Map allows to visualise the impact assessment findings
generated by the Dashboard developed within the framework of T3.1 and T3.2 tasks, by also
illustrating in an easily accessible way the level of compliance of regulatory frameworks with
respect to current and future mobility market evolution and the main barriers to access to market
of different mobility services, business models and technologies so predicting scenarios of
possible evolution.

The Compliance Map can be considered as a practical synthesis of the similarities, differences,
trade-offs and patterns across different regulatory schemes sharing the common goal of enabling
the societal, environment and economic impacts thanks to the implementation of newly
emerging disruptive innovations, while at the same time safeguarding adequate level of security,
safety, data privacy, and social protection. More specifically, the map allows guided searches
using specific filtering criteria (by region, by mobility solution, by category, etc.). For the
development of the Compliance Map, GECKO makes use of a visual analytics platform able to offer
data in a more accessible and understandable way through a dynamic visualization and an
interactive panel.

Measuring the potential level of compliance will help policy makers early tackling regulations that
may hamper deployment of business models, services and technologies, provides prospects at
different level of adherence with specific regulatory framework conditions and anticipate policy
actions and governance.
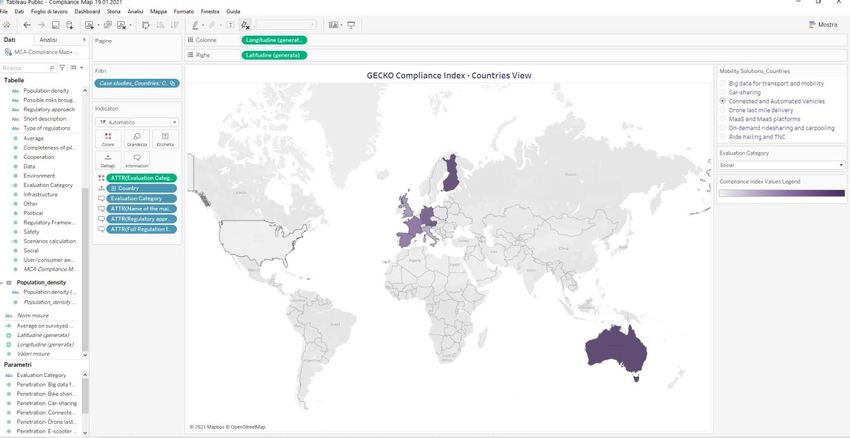
D3.3 Compliance map and future requirements 12

1 FEATURES

The Compliance Map has been developed using Tableau, which is a professional software
(available at https://www.tableau.com/) that provides interactive data visualisation features. The
software is free for public available data. By directly uploading an Excel file, it is possible to define
links and relations among data, make computations and represent information with many
different types of graphics. Data visualisations are organised in views, dashboards and stories.

More in details:

 • Tableau’s views consist of individual charts, in which data from multiple Excel sheets can
 be represented and related.

 Figure 2 Example of Tableau's Individual Chart

 • Dashboards are a way to present one or more views, often with filters, legends, and
 interactivity tying the views together. Dashboards can include sheets, text, images, and
 webpages.
D3.3 Compliance map and future requirements 13

 Figure 3 Example of Tableau's Dashboard

 • Stories are narrated walkthroughs of one or more sheets or dashboards, for example
 leading the end-user through different aspects of the research carried out.

 Figure 4 Example of Tableau's Story

This is the reason why, given its ease of use, Tableau has been chosen as the tool to host the
Compliance Map. To this end, a version of GECKO's Regulatory Framework Dashboard, adapted
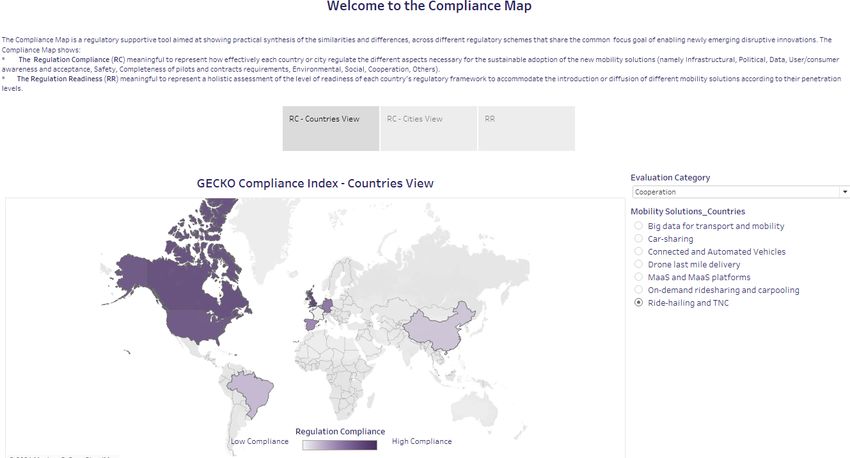
D3.3 Compliance map and future requirements 14

to Tableau's requirements, has been used as input database to provide stakeholders with a
visualisation of the MCA results.

Once realised the Compliance Map in Tableau, the resulting views, dashboards and stories were
embedded in the GECKO website (as shown in the next figure), in order to harmonise such
contents with all project outputs and to provide a unified dissemination channel.

 Figure 5 Compliance Map embedded in the GECKO website

 1.1 Functionalities of the Compliance Map

The following subsections illustrate the functionalities of the Compliance Map i.e. the set of
features that the tool is able to provide to the user. In particular, there have been developed two
indexes for envisioning the level of effectiveness existing regulatory frameworks have in
considering different dimensions of new mobility solutions adoption, and for appraising the level
of readiness each regulatory framework has at country level to comply with the establishment or
expansion of mobility solutions according to their penetration levels respectively. Moreover, by
applying a PESTLE1 analysis, the entrance barriers that may arise in mobility services uptake have
also been included.

 1
 Political, Economic, Social, Technological, Legal and Environmental factors.
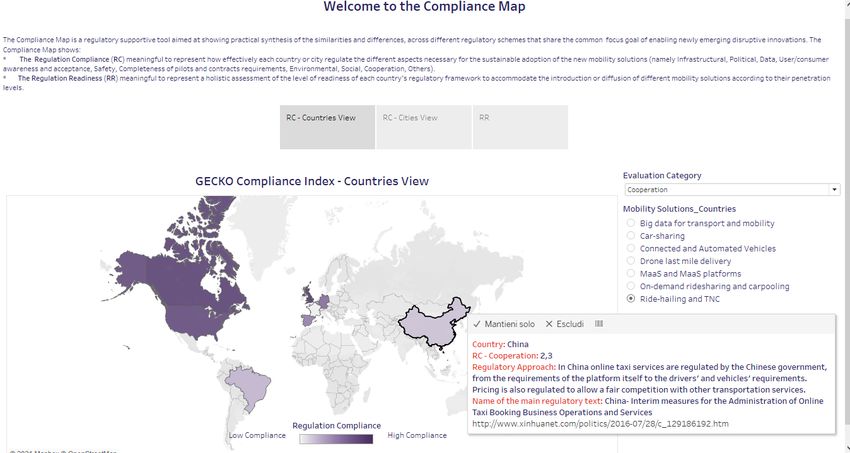
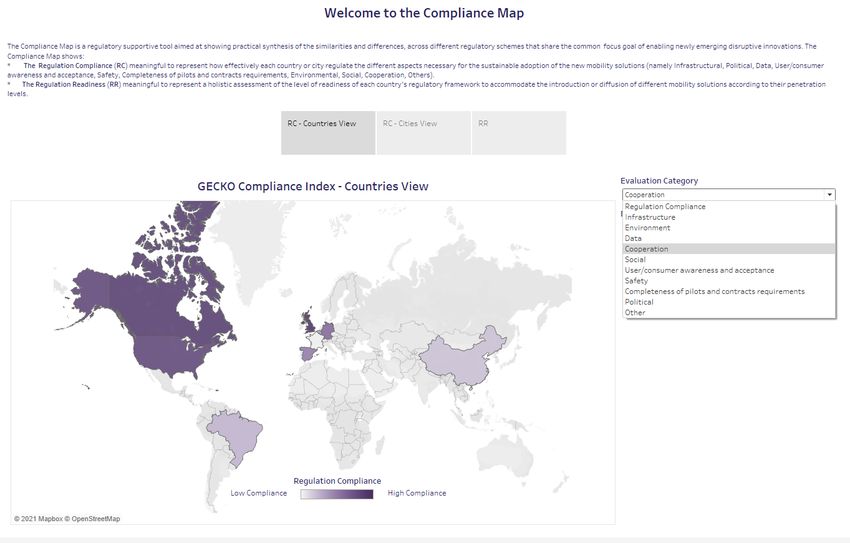
D3.3 Compliance map and future requirements 15

 1.1.1 The Regulation Compliance – RC

Definition

The GECKO Regulation Compliance (RC) is an index specifically designed for representing to what
extent the existing regulatory frameworks will enable the societal, environmental and economic
impacts achievable through the implementation of each mobility solution studied in GECKO,
while at the same time safeguarding adequate level of security, safety, data privacy, and social
protection.

More specifically, the RC is a composite index meaningful to represent how effectively each
country or city regulate the different aspects necessary for the sustainable adoption of the new
mobility solutions, namely:

 • Infrastructural
 • Political
 • Data
 • User/consumer awareness and acceptance
 • Safety
 • Completeness of pilots and contracts requirements
 • Environmental
 • Social
 • Cooperation
 • Other

On the Compliance Map the end user will be able to view the overall RC indicator or one of its
components listed above.

Please refer to the Annex for more information about how the index has been obtained.

Values

In general, a high value of either the overall RC indicator (or a single evaluation category score
composing it) means that the related regulatory framework is effective in enabling the mobility
solution (the former from a general point of view, the latter from a specific perspective) and vice
versa.

To give an example, if in the Compliance Map we select the mobility solution " E-scooter sharing/
Micromobility" and the evaluation category "Completeness of pilots and contract requirements"
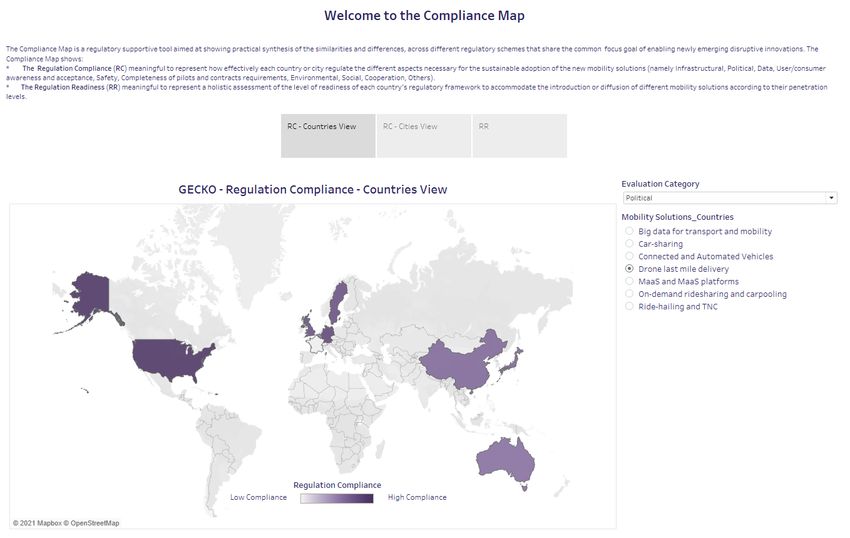
D3.3 Compliance map and future requirements 16

we see that Stockholm scores very low because the market is currently unregulated and no permit
from the City is needed to put a fleet of shared e-scooters on the streets.

On the other hand, if we look at Chicago, we see that the capital of Illinois obtains among the
highest scores compared to other cities because it has launched a multi-year programme of pilots
to evaluate how and under what conditions and requirements e-scooter companies can
contribute to the pursuit of the objectives of accessibility, safety, sustainability etc.

 Figure 6 Example of low and high values of RC

Jurisdiction level

The RC is presented by making reference to two jurisdictional levels: Countries level and Cities
level. For each of these views, mobility solutions relevant for that jurisdictional level are
presented.

For countries:

 - Big Data for transport and mobility
 - Car-Sharing
 - Connected and Automated Vehicles
 - Drones for Last Mile Delivery
 - MaaS and MaaS platforms
 - On-demand ridesharing and carpooling
 - Ride-hailing and TNC

For cities:
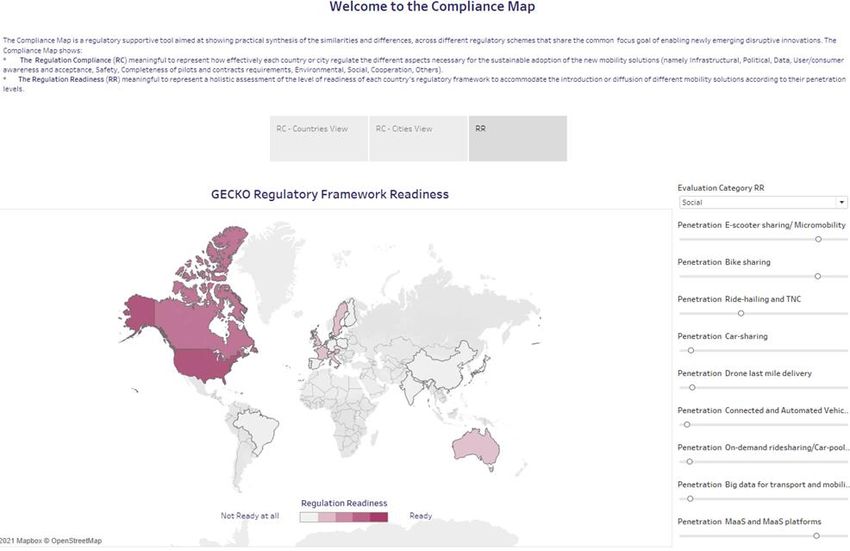
D3.3 Compliance map and future requirements 17

 - Bike sharing
 - Car-Sharing
 - E-scooter sharing/Micromobility
 - Ride-hailing and TNC

Role of the Stakeholder engagement process

In the process of developing the contents to be shown in the Compliance Map, a key role has been
played by the stakeholders engagement process. Referring to Deliverable 3.2 where the
methodology is presented in detail, this section briefly describes the type and contributions of
the GECKO stakeholders.

GECKO stakeholders have been engaged according to their particular interest or experience with
respect to each mobility solution to gain their qualified opinion on challenges, constraints and
expectations about not only existing regulatory frameworks but also the foundational principles
of future regulations and policy making processes.

In particular, the contributions to the contents of the Compliance Map can be summarised as
follows:

• Pre-workshop questionnaires – aimed at identifying the most relevant elements (KPIs) for
 each mobility solution and each evaluation category to be considered in the Multi-Criteria
 Analysis and assessment of the regulatory frameworks;
• Dedicated workshop sessions – aimed at identifying the biggest challenges and key focus for
 regulating each element (KPI) appropriate to each mobility solution;
• Online questionnaires – aimed at assessing some of the KPIs considered in the MCA and
 better understand the most effective strategies in regulating each mobility solution in
 different jurisdiction levels;
• Online interviews – aimed at assigning weights to be associated to each KPI belonging to each
 evaluation criteria.

 1.1.2 The Regulatory Readiness – RR

Definition

The Regulation Readiness (RR) is an index meaningful to represent a holistic assessment of the
level of readiness of each country's regulatory framework to accommodate the introduction or
diffusion of different mobility solutions according to their penetration levels.

Values

Through the use of different sliders available on the Compliance Map, the end-user will be able to
select every possible combination of mobility solutions penetration. As a result, the Compliance
Map will automatically update the values of RR obtained for that combination.
D3.3 Compliance map and future requirements 18

In general, a higher value of the RR means that the related regulatory framework is more ready to
accommodate the selected combination of mobility solutions penetration.

Jurisdiction level

The RR is referred to the country level. It combines all of the regulations (local, regional, national)
and relative analysis pertaining to each country.

 1.1.3 Entrance Barriers for different mobility services, business
 models and technologies

The entrance barriers that may occur in mobility services uptake has been studied using the
PESTLE analysis and reported in the Compliance Map in order to provide a qualitative but
structured methodology, representing all aspects influencing the adoption/deployment of the
mobility solutions studied in GECKO from diverse, mutually interdependent, viewpoints: Political,
Economic, Societal, Technological, Legal and Environmental. This analysis could in fact support
the policy maker in better understanding the main difficulties faced by these innovations,
supporting his/her decision on policies to be adopted to pave the way for a sustainable adoption
of a particular innovation.

In this framework, the Compliance Map allows the end-user either to display a Mobility Solution
at country level to analyse, for instance, more in depth the approach followed by different
countries in regulating the selected innovation or to select a Mobility Solution at city level in order
to discover the enacted regulation and to compare alternative solutions.
D3.3 Compliance map and future requirements 19

2 TECHNICAL ASPECTS

This chapter illustrates the steps carried out to:

 - identify the most suitable tool to develop the functionalities identified in the previous
 chapter in terms of type and quality of information offered to end-users;
 - Develop and analyse contents and functionalities of the Compliance Map;
 - Include the Compliance Map into the GECKO website.

 2.1 Design and data preparation

The Regulatory Framework Dashboard developed in T3.1 and reported in D3.2 collects all
regulations and combines them for providing a comprehensive view (the framework) per
city/country and per mobility solution. The Dashboard is an Excel file that served as input, duly
reorganised and simplified where needed, for the Tableau software, implementing the
Compliance Map. The final simplified data model feeding the Compliance Map is represented in
the following figure.

 Figure 7 Data model used in the Compliance Map
D3.3 Compliance map and future requirements 20

The data model describes a set of relationships that make possible all elaborations reported in
the Compliance Map, in particular:

 • The jurisdiction level defines where a regulation is in force (city, regions, country, more
 countries);
 • the selected GECKO Mobility Solutions have been mapped in each jurisdiction level where
 a related regulation has been enacted. Thus, a Mobility Solution may have many linked
 regulations (one or even more per city/country) and a regulation may apply to one or more
 than one Mobility Solution;
 • one or multiple regulations are grouped per jurisdictional level and build a regulatory
 framework;
 • Mobility Solutions penetrations, variable by the user per each Mobility Solution, affects
 the generation of different Scenarios.

Both tools, the Regulatory Framework Dashboard and the Compliance Map will be made
available in the project website to the end user: the first one functions as a database of the main
regulations influencing the adoption of the mobility solutions studied by GECKO; while the
second one, thanks to the MCA methodology, reports the holistic evaluation of the regulatory
frameworks according to the evaluation categories described.

 2.2 Development

 2.1.1 Representing the results of the MCA through a geo-referenced
 visualisation - RC

As introduced in the previous section, the Compliance Map shows in an intuitive mode of the
overall RC (per single evaluation category or cumulated) per mobility solution, per jurisdiction
level and RR per market penetration scenario: to access these different views, the end-user can
use specific commands and have visibility of results related to the chosen filters.

This location-based representation was developed thanks to the Tableau software that contains
a library of geographic place names such cities, countries, or regions, identified by their
geographical coordinates able to link the respective records (regulations, regulatory frameworks,
RC, RR) contained in the Regulatory Framework Dashboard.

 2.1.2 Methodology for projecting MCA results on future market
 penetration scenarios - RR

As will be shown in the following chapter, some commands shaped as sliders allow the end-user
to modify the penetration rates of each mobility solution: the map will visualize the different
D3.3 Compliance map and future requirements 21

regulatory frameworks each one with their resulting RR related to the scenario generated by the
combination of envisaged penetration of mobility solutions. As shown by the tool legend, darker
colours of a country or city mean a higher level of readiness.

The calculation behind this processing can be summarised as follows:

 • Input: the end-user modifies, using the sliders, the penetration level for each use case as
 he/she wishes, generating a future mobility scenario deriving by a specific composition of
 mobility solutions that may occur in the future.

 Figure 8 Configuration of levels of penetration in which car using (personal or in sharing) prevails
D3.3 Compliance map and future requirements 22

 Figure 9 Configuration of levels of penetration in which soft mobility prevails

 • Calculation: For each regulatory framework (applying in a specific jurisdiction level), the
 penetration share (in percentage) will be multiplied by the RC and each of its components
 obtained for each mobility solution. The values thus obtained are then added together to
 obtain an overall value of the entire regulatory framework in terms of RR and its
 components.
 • Output: The user will see the overall assessment for each regulatory framework in terms
 of RR or one of its components. In this processing, therefore, the reference to the
 individual mobility solution is no longer present.

Since the RR is calculated as the average of the values obtained from the various regulations
collected for each country, the reliability of the RR values also depends on whether regulations
for each of the mobility solutions have been collected and analysed for each country. In the two
figures shown above, for example, the RR value for the USA is always the highest. This is due to
the fact that, in the current state of development of the database of regulations feeding the
Compliance Map, regulations have been collected for almost all of the mobility solutions in the
USA.

However, as mentioned at the beginning of this document and as will be further specified in the
"Updating of the Regulatory Framework Dashboard and Compliance Map" chapter, the work of
collecting and analysing regulations will continue until the end of the project, thus providing
more reliable results.
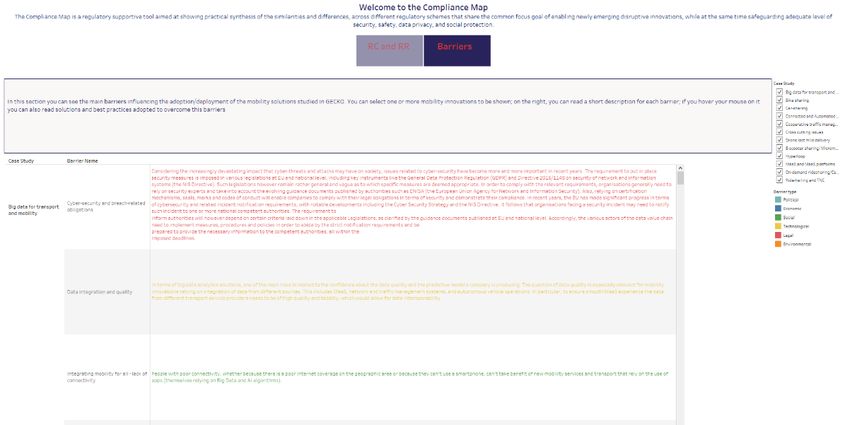
D3.3 Compliance map and future requirements 23

 2.1.3 Presentation of the barriers

The analysis of barriers was conducted by all GECKO partners tasked to identify and describe all
impeding factors affecting the mobility solutions analysed. Furthermore, wherever possible,
available solutions and best practices have been identified.

The end-user will be able to select one or more mobility solutions to visualize:

 • Name of the case study
 • Barrier name
 • Description of the barrier.

Each description of the barrier presents a brief text coloured according to the barrier type
(Political, Economic, Social, Technological, Legal, Environmental). Furthermore, by hovering the
mouse over the description text, a pop-up window will be displayed, illustrating examples of
solutions and best practices adopted to overcome that barrier.

The contents presented for this functionality rely on the knowledge gained by each partner
through the project and on the various inputs collected from the GECKO stakeholders
(workshops, questionnaires, interviews etc)

Following an example of the barriers for MaaS:

 Figure 10 Example of Barriers presented in the Compliance Map for MaaS
D3.3 Compliance map and future requirements 24

Figure 11 Example of contents presented to the end-user if he/she hovers the mouse over a barrier
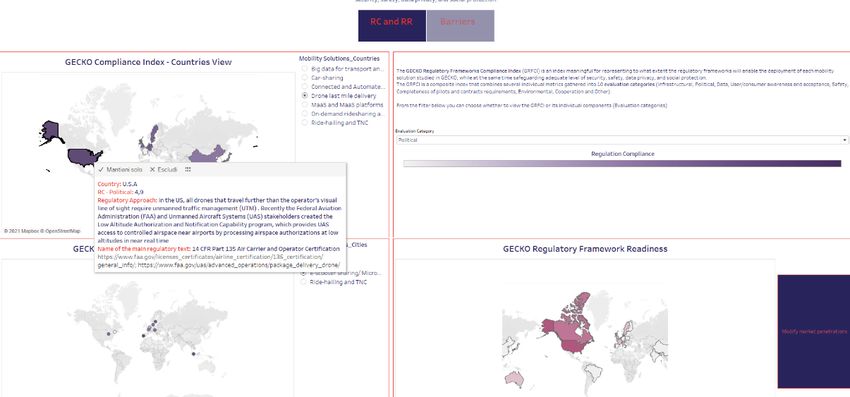
D3.3 Compliance map and future requirements 25

3 LAYOUTS OF THE TOOL

In the development phase of the tool, two alternative layouts have been created:

 - The first layout consists of two pages:
 o The first page shows:
 ▪ the Regulation Readiness (RR). The page reports:
 ▪ A short description of the index in the box at the top right and indications
 on how to act on the filters to show the different results. From the filter in
 this box the end-user can decide whether to display the RR index or only
 one of its components. See how the results update in the other 3 boxes
 displayed.
 ▪ 3 boxes showing 3 different views: by countries, by cities and future
 scenarios. In the countries and cities views the end user can select the
 mobility solution that is relevant for that view (so for example e-scooter is
 present at cities level and not at countries level).
 ▪ In the future scenarios box, the end-user can click on the blue button at the
 bottom right-hand corner and change the penetration levels of each
 mobility solution; the results then automatically update, showing the
 countries whose regulatory frameworks are more ready to accommodate a
 higher market penetration of each of the mobility solutions.
 ▪ Finally, by hovering the mouse over each country or city, the end user can
 read the name of the country or city, the related value of the RR or its
 individual component, a brief description of the regulatory approach
 adopted and, finally, the name and link to the main regulatory reference
 text.
 o The second page shows the main barriers influencing the adoption/deployment of
 the mobility solutions studied in GECKO. The end-user can select one or more
 mobility innovations to be shown; on the right, the end user can read a short
 description of each barrier; if the end-user hovers the mouse over it he/she can also
 read solutions and best practices adopted to overcome this barriers, if available.
 The barriers description is coloured according to the type of barrier. For example,
 as shown in the legend, legal barriers are marked in red.
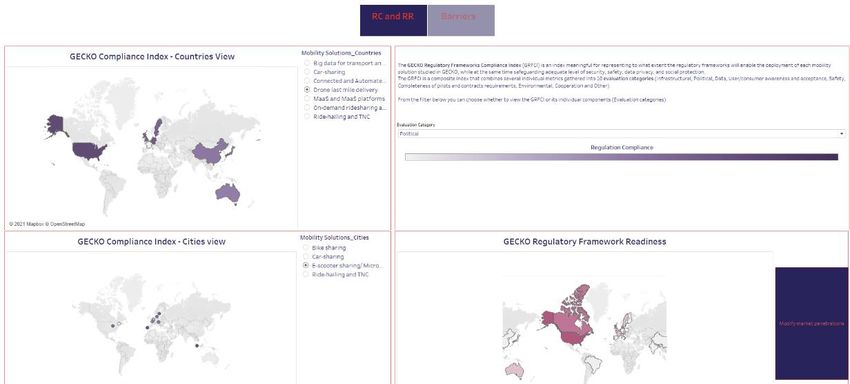
D3.3 Compliance map and future requirements 26

 Figure 12 First layout – RC and RR page - overall view

 Figure 13 First layout – RC and RR page - Comments appearing by hovering the mouse over each country or city

Figure 14 First layout -RC and RR page - Interactivity of the Future Scenario Map with different assets of mobility solutions’
 penetrations
D3.3 Compliance map and future requirements 27

 Figure 15 First layout - barriers page - overall view

 Figure 16 First layout - barriers page - Comments appearing by hovering the mouse on each barrier

The second layout shows the same contents using different views representing wider pages
with RR.
D3.3 Compliance map and future requirements 28

 Figure 17 Second layout RR webpage - Overall view

 o Barriers shown as separate content, so it would be shown in the GECKO website
 through a dedicated link.

 Figure 18 Second Layout - Directing the user towards the Barriers webpage

The two alternative layouts were presented to the GECKO partners. The second layout was chosen
as the final one.
D3.3 Compliance map and future requirements 29

4 PROMOTION AND MAINTANENCE OF THE TOOL

 4.1 Promotion of the tool

In collaboration with WP5 and WP6, the Compliance Map has been and will be further promoted
among GECKO stakeholders and other possible external users (in particular policy makers).

More specifically, in collaboration with WP6, the promotion has been launched through an article
included in the GECKO newsletter released on 12 November 2020.

Furthermore, in cooperation with WP5, the Compliance Map will be presented to the participants
of the third (online) workshop to be held in April 2021.

The work to promote the Compliance Map will then continue further, mainly in cooperation with
WP6, through:

 • the newsletter announcing the final version of the tool which will be embedded in the
 GECKO website;
 • national, European and international events;
 • the final conference of the project.

 4.2 Updating of the Regulatory Framework Dashboard and
 Compliance Map

In order to provide the end users with the most comprehensive holistic view of the regulatory
frameworks related to the mobility categories studied by GECKO, the work of updating the
Regulatory Framework Dashboard and the Compliance Map will continue until the end of the
project lifetime, integrating new directives, policies and regulations.

At the time of writing the present deliverable this task is in progress: starting from the most
relevant and up-to-date documents, papers and articles of international scope2 related to each
mobility solution studied by GECKO, partners involved in WP3 have been asked to continue the
work of searching for regulations in order to achieve, for the Compliance Map, a greater
geographical, thematic and temporal coverage.

Furthermore, the possible adoption of the tool by one of the Consortium partners will allow a
continuous update beyond the project lifetime.

 2
 See Annex II
D3.3 Compliance map and future requirements 30

5 CONCLUSIONS

For each mobility solution, this chapter provides a description of the similarities and differences
found between regulatory schemes to generate a holistic view of the Compliance Map.

As the reader was reminded in the previous chapters, the results presented in this document must
be considered as provisional, since the work of enriching the database feeding the compliance
map and analysing the regulations will continue until the end of the project.

Connected and Automated Vehicles

Regulations governing testing and adoption of CAVs are mainly issued at national level. In terms
of RC, the highest values are obtained by Singapore and Australia. Looking at the individual
components in particular, Singapore scores highest in the following components: Infrastructure,
Cooperation, Completeness of pilots and contracts requirements, thus laying a solid political and
technical foundation for a wide deployment of autonomous mobility. Indeed, in Singapore the
government is deeply committed in making the city-state a pioneer for AV. It opened the Centre
of Excellence for Testing and Research of Autonomous Vehicles at Nanyang Technological
University (CETRAN) in November 2017; currently Singapore is exploring the application of self-
driving technology to public transport to bring in new forms of shared mobility, but also to
address the constraints the city faces from land and manpower perspectives. Moreover, while in
other states testing is limited to small areas, since October 2019 autonomous vehicles have been
tested on all public roads in western Singapore.3 On the other hand, Australia scores highest
values in components such as Environment, Social, Safety but also Data, defining the conditions
for a sustainable uptake and deployment of autonomous mobility. For example, in order to
ensure safety of on-road testing, NTC (National Transport Commission) recommends “Pre-trial
testing of the vehicle at a test facility such as a closed track. This could provide additional assurance
that the automated vehicle technology can be safely deployed on public road”. For on-road testing,
it recommends a human safety driver in the test vehicle unless a specific exemption of permit is
granted for the test. In addition, it recommends that the trialling organization “must develop a
safety management plan outlining all key relevant safety risks for the trial and how they will be
mitigated or eliminated”. Trialling organizations are asked to follow existing crash reporting
requirements and to report any serious incidents to the relevant road transport agency. In this
framework “vulnerable road users” should “be considered carefully as part of the safety
management of all trials taking place on public roads”. It is also stated that “Trialling
organizations will need to consider how their trial may impact existing infrastructure and how they
plan to address this”.
In the next developments of the database feeding the Compliance Map, regulatory frameworks
from Israel, United Arab Emirates, Japan, The Netherlands and Sweden (indicative list) will be

 3
 https://www.channelnewsasia.com/news/singapore/autonomous-vehicles-western-singapore-testbed-12029878
D3.3 Compliance map and future requirements 31

added and analysed. In this way, GECKO project aims at achieving a greater geographical
coverage and include countries having a relevant state of art of CAV testing.

Drone last mile delivery

Regulations ruling trials and adoption of drones for last mile delivery are mainly issued at national
level. In terms of RC, the highest values are obtained by Australia, where drones can now be used
to deliver 'just-in-time' supplies to customers who live within a 10 km radius from a base station.
Items available for delivery could include food and drinks, medications or even small items of
hardware or recreational supplies4. Looking at the individual components in particular, Australia
scores the highest in almost all of them. The Civil Aviation Safety Authority (CASA) has given
approval to Wing Aviation Pty Ltd (Wing) to operate delivery drone operations in Gungahlin,
Australian Capital Territory (ACT) and Logan, Queensland. Wing was required to submit a safety
case which included information about the reliability of their drones. Following assessment of the
safety case, CASA permitted Wing to operate in closer proximity to a person than regulations
normally permit. Wing's delivery system is automated – however a licensed drone pilot is always
at the helm. CASA also defined time windows in which drones can provide the service; in any case
additional operational restrictions may be imposed by the Department of Infrastructure,
Transport, Cities and Regional Development.
In the next developments of the database feeding the Compliance Map, regulatory frameworks
from Tanzania, Rwanda, Iceland, Canada, Dubai, Finland (indicative list) will be added and
analysed. In this way, GECKO project aims at achieving a greater geographical coverage
(particularly in Africa, where drones are used extensively to deliver medical supplies) and
including countries having a relevant state of art of drones for last mile delivery testing.

Big data for transport and mobility

The general approach of sharing, standardisation and protection of data is mainly issued at
national (or higher) level, while cities define specific requirements through contract
requirements. Indeed, over the past few years, recent regulations regarding Big Data have been
adopted to get the regulatory framework required for the deployment of new disruptive mobility
services at the national or supranational level, mostly in terms of: personal data protection
(GDPR), data-sharing for public services, and standards for data. There are currently few
regulatory frameworks analysed for this use case, so the conclusions reported here may be
subject to significant change. In terms of RC, the highest values are obtained by Singapore and
the United Kingdom. Looking at the individual components, Singapore scores the highest in
Infrastructure, Cooperation and Political. Indeed, the Land Transport Authority (LTA) has
published a wide variety of land transport-related datasets (static and dynamic / real-time) on
DataMall5 for enterprises, third-party developers, researchers, and other members of the public
to promote collaboration and co-creation of innovative and inclusive transport solutions.
Furthermore, the government is strongly committed in becoming a highly developed country

 4
 https://www.casa.gov.au/drones/industry-initiatives/drone-delivery-systems
 5
 https://datamall.lta.gov.sg/content/datamall/en.html
D3.3 Compliance map and future requirements 32

through its Smart Nation initiative, leveraging on several national projects, like National Digital
Identity, E-Payments, Smart Nation Sensor Platform, Smart Urban Mobility and Moments Of Life 6.
On the other hand, the United Kingdom scores the highest in Environment, User/consumer
awareness and acceptance and Safety. In September 2017, the Government published a study
entitled “Scoping study into deriving transport benefits from big data and the internet of things
in smart cities”7 which identified 6 key areas to be addressed: 1. Raising awareness, buy-in and
coordination, 2. Standards, 3. Connecting datasets, 4. Closing data gaps, 5. Privacy, security and
commercial sensitivities, 6. Skills and capability. In early 2020 then, the Government has launched
an open big data project, particularly focused on public transport and called “Bus Open Data
Service” aimed at providing passengers with real-time bus location and fares data (by 2021). In
this regard, the Department for Transport published the “Bus open data implementation guide”
to help operators meet the statutory requirements through the provision of the Bus Open Data
Service (BODS). It’s a new digital service which provides access to third-party data consumers to
a distributed model of bus open data, where the data are, largely, held by the operators who run
the services.8
In the next developments of the database feeding the Compliance Map, regulatory frameworks
from Finland, The Netherlands, Belgium, Estonia, China and USA (indicative list) will be added
and analysed. In this way, GECKO project aims at achieving a greater geographical coverage and
include countries having a relevant state of art of use of Big Data for Transport.

MaaS and MaaS platforms

Regulations aimed at adopting and deploying MaaS and MaaS platforms are mainly issued at
national and regional level. This mobility solution does not have one particularly most effective
regulatory framework compared to others analysed, with the United Kingdom, Sweden and
Finland achieving very similar scores. Cross-government and private sector collaboration is one
of the strengths of the UK regulatory framework: MaaS Global began piloting Whim in the West
Midlands in August 2017. The provision of a MaaS solution was a key part of the West Midlands
Combined Authority transport strategy and delivery plan for 2026. West Midlands Combined
Authority and MaaS Global agreed commercial contracts with several transport operators. These
include National Express West Midlands (bus and tram services); Enterprise (car hire); and Gett
(taxi service); the Swedish regulatory framework better addresses social policy aspects: tests
have been made with the travel service UbiGo in order to facilitate sustainable travel in larger
cities and manage everyday life in a simple way without private cars. The test period in
Gothenburg showed good results and now Ubigo is being tested in Stockholm. The Swedish
Government has initiated the project KOMPIS, which aims to promote the emergence of MaaS in
Sweden. Finally, Finland clearly regulates the data aspect and the evident identification of the

 6
 20180710_D1.2_Big+Data+Policies_LeMO.pdf (squarespace.com)
7
 https://www.gov.uk/government/publications/transport-benefits-from-big-data-and-the-internet-of-things-in-smart-
 cities
 8
 https://www.gov.uk/government/publications/bus-open-data-implementation-guide/bus-open-data-
 implementation-
guide#:~:text=The%20Bus%20Open%20Data%20Service%20(%20BODS%20)%20regulations%20will%20require%20the
 ,was%20launched%20in%20November%202020
D3.3 Compliance map and future requirements 33

role that Public Transport has to play within the MaaS environment; indeed in 2018, The Act on
Transport Services in Finland brought together legislation on transport markets. The aim of the
legislative reform was to provide the users with better transport services and to increase freedom
of choice in the transport market. Part of this act ensures that regardless of the mode of transport,
a provider of passenger mobility services shall ensure that essential, up-to-date data on its
services is freely available from an information system (open interface). The data should be
provided in a standard, easy to edit, and computer readable format. At minimum, this essential
data shall include information on routes, stops, timetables, prices, availability, accessibility as
well as access to the sales interface of their ticket and payment systems - at least for single tickets.
In the next developments of the database feeding the Compliance Map, regulatory frameworks
from Spain, Belgium, Canada, USA, Japan (indicative list) will be added and analysed. In this way,
GECKO project aims at achieving a greater geographical coverage and include countries having a
relevant state of art of MaaS adoption.

Car-sharing

Regulations aimed at maximising benefits from car-sharing are presented at both national and
local level. As regards the national level, in terms of RC, the highest values are obtained by
Germany, which scores the highest in almost all of the components and obtained very high scores
for Infrastructure and Environment compared to other countries. In April 2017, Germany adopted
a ‘Car-Sharing Law’ regulating allocation of parking spaces specifically for car sharing
nationwide. Public parking spaces are allocated to fixed location-based services individually,
whereas parking is shared for free-floating services. Additionally, the region of Lower Saxony in
Germany introduced a law that regulates the special use of public roads within the road
construction load of the communities for the purpose of car sharing with the aim of reducing the
need for parking space and reduce environmentally harmful effects of motorised private
transport. Competent authorities are thus allowed to determine suitable areas for station-based
car sharing vehicles based on e.g. the need for integration with public transport. Car sharing
providers are selected for station-based operations and must meet certain criteria including
environmental and accessibility criteria.
As regards the local level, in terms of RC, the highest values are obtained by Sydney, which scores
the highest in almost all of the components, distinguishing from other countries in particular in
Environment, Data, Cooperation and Social. Sydney defined the Car Sharing Policy with the main
objective to increase use of car sharing, and to ensure that the City’s car sharing program is well-
governed and transparent. Specific objectives include: using on-street parking spaces more
efficiently: by replacing the parking demand created by underused private vehicles, reducing
vehicle traffic and greenhouse emissions: by reducing vehicle kilometres travelled, and shifting
travel to more fuel efficient vehicles; supporting the local economy: by decreasing the need of
businesses and individuals to own a private vehicle and car space; increasing social inclusion: by
enabling access to a variety of vehicles to households who could not otherwise afford them; and
improving health: as people walk and cycle more.
In the next developments of the database feeding the Compliance Map, regulatory frameworks
from Italy, Canada, and others (indicative list) will be added and analysed. In this way, GECKO
project aims at achieving a greater geographical coverage and include countries having a relevant
state of art of Car-sharing adoption.
D3.3 Compliance map and future requirements 34

Bike sharing

Regulations aimed at maximising benefits from bike-sharing are presented at local level. In terms
of RC, the highest values are obtained by Chicago and Toronto. Looking at the individual
components, Toronto scores highest in the components Data, Cooperation, Social and Safety. In
Toronto the Toronto Parking Authority (“TPA”) is the owner of a self-serve bicycle rental system,
managed by Shift Transit Inc. In June 2020 Bike Share Toronto and Canadian Automobile
Association South Central Ontario (CAA SCO) have signed a multi-year partnership agreement
that will make CAA SCO an Official Partner of Bike Share Toronto. The agreement includes CAA
SCO’s commitment to continue its official sponsorship of Free Ride Wednesdays and provides CAA
members and CAA On the Move members with special offers on bike share membership and rides
through its CAA Rewards Program. On the other hand, Chicago scores highest in Environment,
User/consumer awareness and acceptance and Completeness of pilots and contracts
requirements; Chicago City has identified requirements for the operators in order to participate
to the 6-months pilot programme (2018). The pilot is designed to explore the operational impacts
of dockless bikes and gauge demand for the service in areas not served by the City’s popular Divvy
bikeshare program.

E-scooter sharing/ Micromobility

Regulations aimed at maximising benefits from E-scooter sharing are presented at local level. In
terms of RC, the highest values are obtained by Chicago and Lisbon. Looking at the individual
components, as for bike sharing, the capital of Illinois obtained among the highest scores in
Infrastructure, Data, Safety and Completeness of contract requirements; indeed the city has
launched a multi-year programme of pilots to evaluate how and under which conditions and
requirements e-scooter companies can contribute to the pursuit of the objectives of accessibility,
safety, sustainability etc. The City will use the 2020 pilot to better understand how shared e-
scooter operations function in Chicago, to have conversations with and receive feedback from
residents, and to help determine if the service should be permitted to operate in Chicago in the
future. The City of Chicago granted permission to three shared e-scooter companies to operate in
the 2020 e-scooter pilot: Bird, Lime and Spin. The 2020 pilot ran four months from mid-August to
mid-December. Each company was allowed to deploy up to 3,333 scooters throughout the City of
Chicago for a total of 10,000 scooters citywide. For the 2020 pilot, the City drafted updated rules
and minimum requirements based on the results of last year’s pilot and feedback from residents
and community organizations. In order to select participating e-scooter companies, the City
developed questions and objective criteria designed to help determine which companies are
most able to meet the City’s goals and which companies are qualified for running a service that
goes above and beyond minimum requirements. As regards Lisbon, the capital of Portugal scores
the highest in Environment, Cooperation, Social, User/consumer awareness and acceptance,
Political; following negotiations, the first eScooter operation was launched by LIME in October
2018, followed by further eight in the following 6 months. During negotiations, the city made clear
to the operators that, for equity reasons, the service should cover the whole of the city, which in
theory means that those areas less served by public transport should have more mobility options
available. The long-term goal of the city is to provide a complete set of mobility services, with
public transport as the backbone and NMS complementing it, to encourage people to give up
D3.3 Compliance map and future requirements 35

their private car. Political support from the City of Lisbon to enable these types of services to take
off has been instrumental, with the direct involvement of the Mayor and Deputy Mayor in charge
of transport. The city has adopted a management style, a tolerant approach to innovation and a
proactive line in terms of finding solutions to boost the operations and tackle the adverse effects
of these services.

Ride-hailing and TNC

Regulations aimed at maximising benefits from ride-hailing are presented at both national and
local level. As regards the national level, in terms of RC, the highest values are obtained by the
United Kingdom, which scores the highest in almost all of the components and obtaining very
high score for Environment compared to other countries; in UK ride-hailing companies must meet
national regulation on Private-Hire Vehicles but cities have the discretion to define licensing
standards. Transport for London conducts continuous checks on criminal background and
driving history on ride-hailing drivers. Additionally, every three years drivers have to submit
medical clearances; while other conditions for issuing licences include the need to pass vehicle
inspections and commercial insurance coverage. Furthermore, in April 2019 London expanded
application of the daily charge to include ride-hailing vehicles which are also subject of payment
of an additional £12.50 charge per day to enter into the Ultra Low Emission Zone if they don’t
meet the required engines standards. This is not required for traditional taxi services and for this
reason ride-hailing drivers are challenging this distinction in litigation. In this framework, it
resulted that the social component, which includes the aspect of competition with existing
services, has been better addressed by the Canadian regulatory framework; indeed, as regards
the local level, in terms of RC the highest values are obtained by Toronto, which legalized ride
hailing services since 2016; the legislation defines rules in terms of trip data requirement,
minimum passenger fare, accessibility and consumer protective measures. The city imposed
some price controls for ride-hailing services: in order to both protect the traditional taxi city
services and to ensure adequate income for ride-hailing drivers, ride-hailing services cannot
charge less than $3.25 per trip (approximately the equivalent of the base taxi fare). In addition,
the city allowed traditional taxis to use booking apps to charge below or above the metered rate,
enabling them to compete with ride-hailing service providers on price flexibility9.
In the next developments of the database feeding the Compliance Map, regulatory frameworks
from India, Australia, USA, Russia (indicative list) will be added and analysed. In this way, GECKO
project aims at achieving a greater geographical coverage and include countries having a relevant
state of art of Ride-hailing and TNC adoption.

On-demand ridesharing/Car-pooling

Regulations aimed at maximising benefits from on-demand ridesharing/Car-pooling are
presented at local level. In terms of RC, the highest values are obtained by France and the United
States. Looking at the individual components, France scores the highest in Environment, Data,

 9
 E-Hail Regulation in Global Cities (nyu.edu)
You can also read