A Gamification-Based Approach on Indoor Wayfinding Research - MDPI
←
→
Page content transcription
If your browser does not render page correctly, please read the page content below
International Journal of
           Geo-Information

Article
A Gamification-Based Approach on Indoor
Wayfinding Research
Dries De Leeuw * , Philippe De Maeyer                          and Laure De Cock
 Department of Geography, Ghent University, 9000 Ghent, Belgium; Philippe.DeMaeyer@UGent.be (P.D.M.);
 laudcock.decock@ugent.be (L.D.C.)
 * Correspondence: dries.deleeuw@UGent.be

 Received: 30 May 2020; Accepted: 26 June 2020; Published: 30 June 2020

 Abstract: Indoor environments can be very complex. Due to the challenges in these environments
 in combination with the absence of mobile wayfinding aids, a great need exists for innovative research
 on indoor wayfinding. In this explorative study, a game was developed in Unity to investigate
 whether the concept of gamification could be used in studies on indoor wayfinding so as to provide
 useful information regarding the link between wayfinding performance, personal characteristics,
 and building layout. Results show a significant difference between gamers and non-gamers
 as the complexity of the player movement has an important impact on the navigation velocity
 in the game. However, further analysis reveals that the architectural layout also has an impact
 on the navigation velocity and that wrong turns in the game are influenced by the landmarks at
 the decision points: navigating at deeper decision points in convex spaces is slower and landmarks
 of the categories pictograms and infrastructural were more effective in this particular building.
 Therefore, this explorative study, which provides an approach for the use of gamification in indoor
 wayfinding research, has shown that serious games could be successfully used as a medium for data
 acquisition related to indoor wayfinding in a virtual environment.

 Keywords: gamification; indoor wayfinding; landmarks; space syntax; unity

1. Introduction
     Buildings are typically characterized by a much smaller scale level and a higher degree of detail
compared to outdoor environments. Additionally, the field of vision is much more limited, and indoor
environments can vary a lot more in size and shape. As a result, building complexity can possibly
lead to a loss of orientation, and indoor wayfinding is more complex compared to wayfinding in large
outdoor areas. Due to the challenges in these indoor environments, in combination with the absence of
mobile wayfinding aids, there is a great need for innovative research on indoor wayfinding. Therefore,
the concept of big data has recently become very important due to both the amount of available
data and the speed in which these could be collected. Big data create opportunities and challenges
for a data analysis with the aim of acquiring useful information for various purposes. One of these
purposes is wayfinding research, in particular in the indoor wayfinding domain. In this domain, a new
possibility for data acquisition has recently emerged, called gamification. This technique includes a
relatively new concept that is defined as the use of game design elements in non-game contexts [1].
Several studies have tried to gain a better insight in cognitive route planning and communication for
indoor wayfinding. The use of gamification for indoor wayfinding, however, is still in its initial phase,
requiring more research on its opportunities in scientific studies.
     Therefore, this explorative study used a gamified approach to collect data on the user’s wayfinding
capabilities. The game was developed from scratch, and this study covers all facets of gamification
research from the game design to data analysis. This way, both the possibilities and weaknesses

ISPRS Int. J. Geo-Inf. 2020, 9, 423; doi:10.3390/ijgi9070423                       www.mdpi.com/journal/ijgi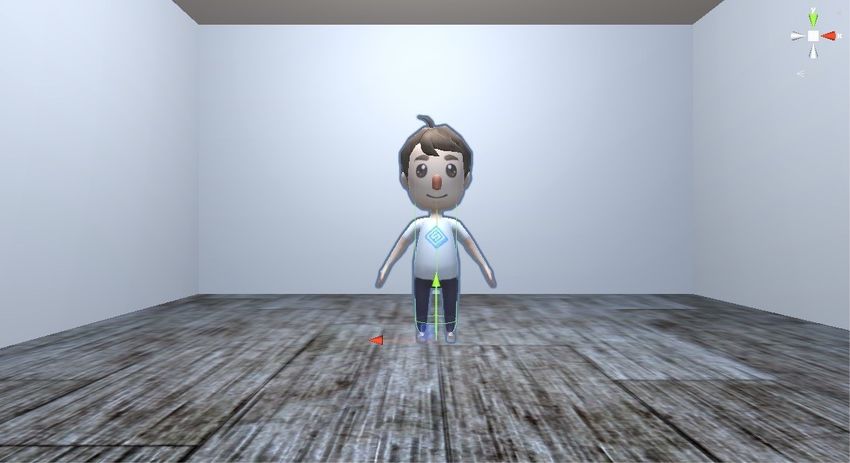
ISPRS Int. J. Geo-Inf. 2020, 9, 423                                                                      2 of 29

of this technique are explored, and the results could help future researchers who are considering
gamification for data acquisition.

1.1. Indoor Environments and Spatial Cognition
       Regarding research on wayfinding, the term legibility is often used in the literature. It is mainly
used in studies on indoor wayfinding and, according to Weisman [2], defined as how easily individuals
find their way in an indoor environment. In the study by Weisman [2], three different factors are
named that determine the legibility. These factors are differentiation of appearance, visual access,
and layout complexity, which are all closely related to the concept of gamification since they could be
easily adjusted in the virtual environment of a game.
       As for differentiation of appearance, landmarks can be seen as the key to the process of planning
movement in a goal-oriented and efficient way, often called wayfinding. In the study by Passini [3],
wayfinding is also described as a dynamic process, involving complex human behavior and various
cognitive skills. Planning and executing a route indoors might prove challenging. It involves a
decision-making process whereby possible routes and/or route segments are appraised and selected
in order to reach a certain destination [4]. To illustrate this process, Downs and Stea [5] described
a four-step framework consisting of orientation, route selection, route control, and recognition of
destination. Firstly, orientation means locating oneself with respect to nearby orientation points
(i.e., landmarks) and the chosen destination. Secondly, the most optimal route is selected to reach a
destination as effortlessly and efficiently as possible [4]. Thirdly, route control is the constant verification
that an individual is following the selected route by linking the environmental representation with reality
by the presence of corresponding features in the environment (e.g., landmarks). Fourthly, a person
must be aware that he/she has reached the chosen destination in order to conclude this wayfinding
process [4,5]. Important to note is that landmarks are the key to this process of comprehending
the spatial structure of a building, constructing a mental map, and recognizing locations and orientation.
They structure the human cognitive map of the environment and are used to reason about spatial
information in a simplified way. Therefore, they are irrefutably important during indoor wayfinding [6].
       As for visual access and layout complexity, the study by Viaene [6] emphasizes that a
building imposes specific wayfinding challenges and that the process of planning movement in a
goal-oriented and efficient way is often troublesome in an indoor environment. In order to better
understand wayfinding behavior in such environments, a method called space syntax could be used.
It covers three elementary aspects of wayfinding: access graphs, axial maps, and isovist (or visibility)
fields [7]. In general, space syntax provides formal descriptions through quantitative methods and it
indicates the spatial intelligibility of a space, also described as the property of the space, that allows an
observer to understand it in such a way as to be able to find his or her way [8]. So as to meet the specific
needs, different methods of space syntax have been introduced. The ones mostly used include the inter
connectivity density (ICD), visibility graph analysis (VGA), and isovists [9]. The latter has been used
in different studies, for example, the research by Wiener and Franz [10] correlating environmental
characteristics with wayfinders’ spatial preferences.
       Furthermore, personal characteristics could influence wayfinding behavior and have an effect
on the manner in which people experience space [11]. In different studies, the effects of gender, age,
and familiarity with the building have been applied to investigate the differences between user groups.
For example, the study by De Cock et al. [12] includes personal factors and relates decision point
characteristics to the perceived complexity of indoor wayfinding.
       Where most algorithms in indoor wayfinding systems are limited to the currently known shortest
path algorithms, recent studies tried to gain a better insight into the cognitive route planning by means
of online surveys or real-life experiments [13,14]. However, they make use of traditional research
mediums that have a number of disadvantages. In the real-life experiments, the number of participants
is limited, while in the online surveys, the participants are not really immersed in the environment.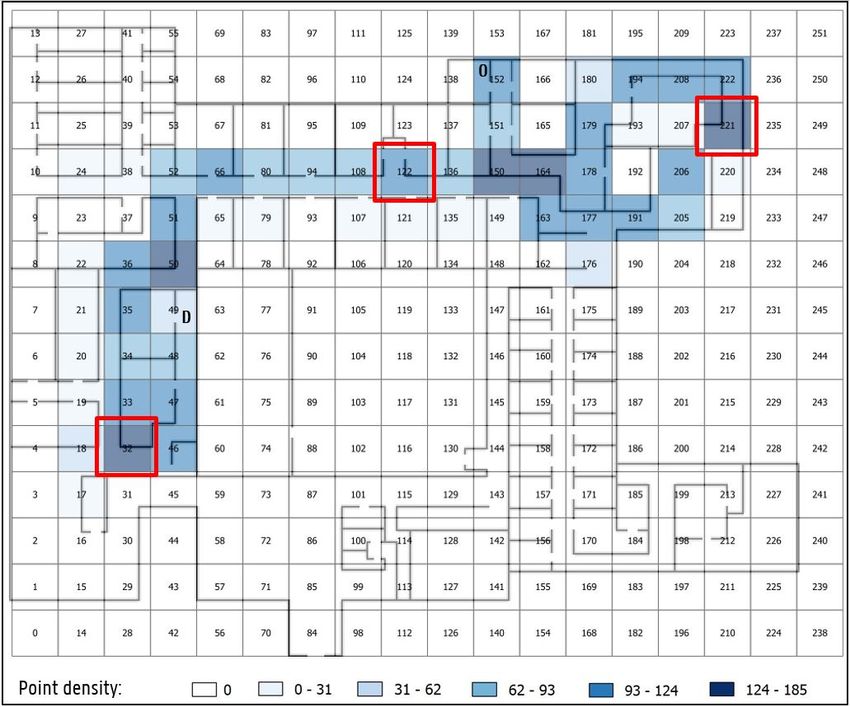
ISPRS Int. J. Geo-Inf. 2020, 9, 423                                                                    3 of 29

The game aspect could solve both problems, as it attracts more participants and those participants are
more involved in the task at hand.

1.2. Conceptualizing Gamification
      Although there is no universal definition of gamification, the definition of Deterding et al. [1]
is widely accepted and refers to gamification as the use of game design elements in non-game
contexts. Zichermann and Cunningham [15] suggest gamification is to establish brand, engage users,
and influence their behavior by using game mechanics in areas other than traditional gaming contexts.
It is important to note that alternative terms have also been used for gamification, such as serious
games [16]. Deterding et al. [1] separate gamification from serious games and describe them as the design
of full-fledged games for non-entertainment purposes. Kapp [16], however, considers the use of
serious games as a form of gamification that he defines as a careful and considered application of
game thinking to solve problems and encourage learning using all the elements of games that are
appropriate. This shows that the boundary between a serious game and gamification can often be
small and is somewhat empirical and subjective: is Foursquare a game or a gamified application?
Whether someone “plays” or “uses” Foursquare is a matter of perception, so there is a lack of an
unambiguous definition for the concept of gamification. The end result of gamification may or may not
be a fully-fledged game and players may use it in different ways [17]. Moreover, gamification is more
about motivating people to take actions [1], perhaps in a structured way, and follow specific rules to
achieve variable outcomes.
      In this study, the use of a serious game in scientific research was considered as a form of gamification
and thus a specific subset of the concept. A serious game was created to facilitate data acquisition
for scientific research in the indoor wayfinding domain. While some participants may experience
the serious game as fun and a form of entertainment, others may see it purely as participation in a
scientific study based on the principle of a gamified application.

1.3. Relevant Work
     Although the concept is relatively new in scientific research, the practice of gamification
has probably been used for as long as games have existed. Before 2002, gamification was barely known,
but recently it has been recognized as a powerful tool for data acquisition and a training application
in several research domains. During the past decade, applications such as Foursquare went viral,
with millions of downloads, and gamification became a popular technique so as to support the user
engagement in game-based applications. Recently, it has also become a more popular subject for
academic inquiry, which is reflected in the growing amount of research during the past ten years [18].
     The user data of gamified mobile applications provide a large data source and offer a number of
opportunities for scientific studies. Researchers identified, for example, that the creation of competition
combined with a reward system (e.g., receiving coins in the mobile Swarm game) is a promising
method to motivate and retain volunteers [19]. In addition, regarding data acquisition for scientific
research, gamification applications utilize such a reward system, which is commonly related to the use
of badges as rewards [20].
     The healthcare domain furthermore investigates the manner in which serious games could be
used for the rehabilitation of spatial wayfinding after brain damage. The work represented in [21],
for example, focuses on virtual sessions including various wayfinding exercises in the form of a serious
game combined with psychological support offered by a domain specialist. Another interesting work
in the healthcare domain is the so called Sea Hero Quest mobile game, a multi-platform adventure game
designed specifically to help advance the understanding of loss in spatial navigation, and therefore
understand one of the first symptoms of dementia [22].
     As for scientific research within geography, the use of gamification and serious games provides
interesting opportunities for research on movement behavior and wayfinding. Existing studies already
applied volunteered geographical information (VGI) of a gamified platform, in particular Foursquare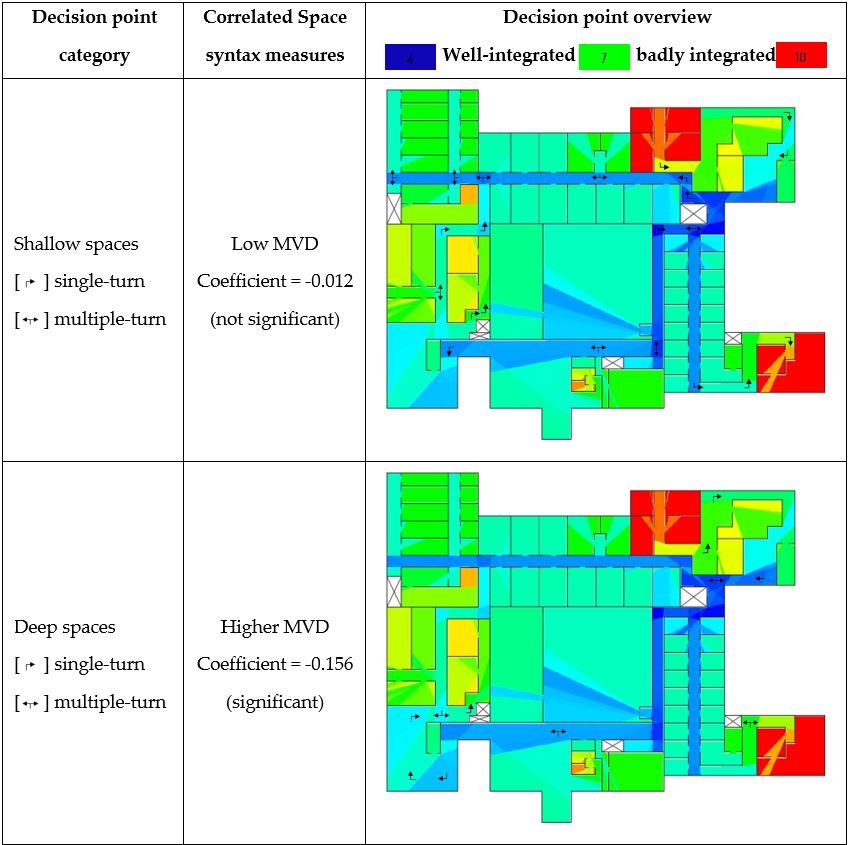
ISPRS Int. J. Geo-Inf. 2020, 9, 423                                                                4 of 29

data, to conduct research on mobility and travel behavior [23]. Furthermore, the study by McKenzie [24]
learns that the Foursquare game-based data could be utilized to identify the frequently visited and,
in other words, popular locations in a specific area. Unlike our serious game, the use of outdoor
environments is one of the main themes in literature regarding gamified applications and research
on wayfinding behavior. The work represented in [25,26], for example, investigates how so called
mobile geogames can support users to enhance their map comprehension, orientation, and wayfinding
skills in urban areas. By developing the Ori-Gami app, the authors mainly focus on spatial literacy,
also known as the skill of learning about and improving interaction with one’s surroundings as a key
competency to be acquired in geography education [26]. The work represented in [27–30] are examples
of additional mobile geogames with purposes including data acquisition, leisure, and education related
to the geography subject.
      Regarding indoor environments, related work often focuses on building design for human-aware
environments by creating a gamified process of crowd simulation, path traces, and heatmaps
of evacuation dynamics [31,32]. These works are examples of analysis tools to assist architects
and designers in generating and analyzing human-aware design options. By providing a means to
implement the design process as gamified levels with built-in architectural constraints, a planner,
environment designer, or architect can convert a design problem into a playable game to provide a fun
and interactive collaborative platform for architectural building design.

1.4. Research Goal
      While related work on wayfinding mainly makes use of gamification for research in large outdoor
areas [25,26,33], this study focused on the more challenging indoor environment. Therefore, the goal of
this research was to develop a serious indoor navigation game in the Unity 3D software development
kit. In the first step, the wayfinding data was collected from several participants who played the game.
Next, this study investigated whether an analysis of the acquired data could result in useful information
regarding the link between wayfinding performance, personal characteristics, and building layout
in an indoor environment. By doing so, this study might provide new insights for further research
and the use of serious games in terms of scientific research on indoor wayfinding.
      This paper is organized as follows. In the next section, the game development and the data
processing are discussed. Section 3 presents the results, followed by a discussion and the conclusions
in Sections 4 and 5, respectively.

2. Materials and Methods

2.1. Unity Game Development

2.1.1. Game Concept
     In order to play the game, called “Indoor Navigation Simulator”, participants needed to create
an account by following a registration process. The next step was logging into the game, where
the goal of the game was explained first and a tutorial could be played so as to get a better feeling of
the control system. Participants, namely students and staff of the Geography Department, had to play
three different levels. The order in which the participants needed to play was randomized, each level
covered a different part of the building, and all levels had the same difficulty. Each level started
by showing the participants an instruction video, in which they saw an avatar navigating through
the indoor environment and following a planned route from the origin to the destination. Participants
could only watch this video once, and before watching, they were given a hint to look at recognizable
environmental features. The ultimate goal of the game was to walk the same route as in the instruction
video, as fast as possible, so as to obtain a high score in the ranking.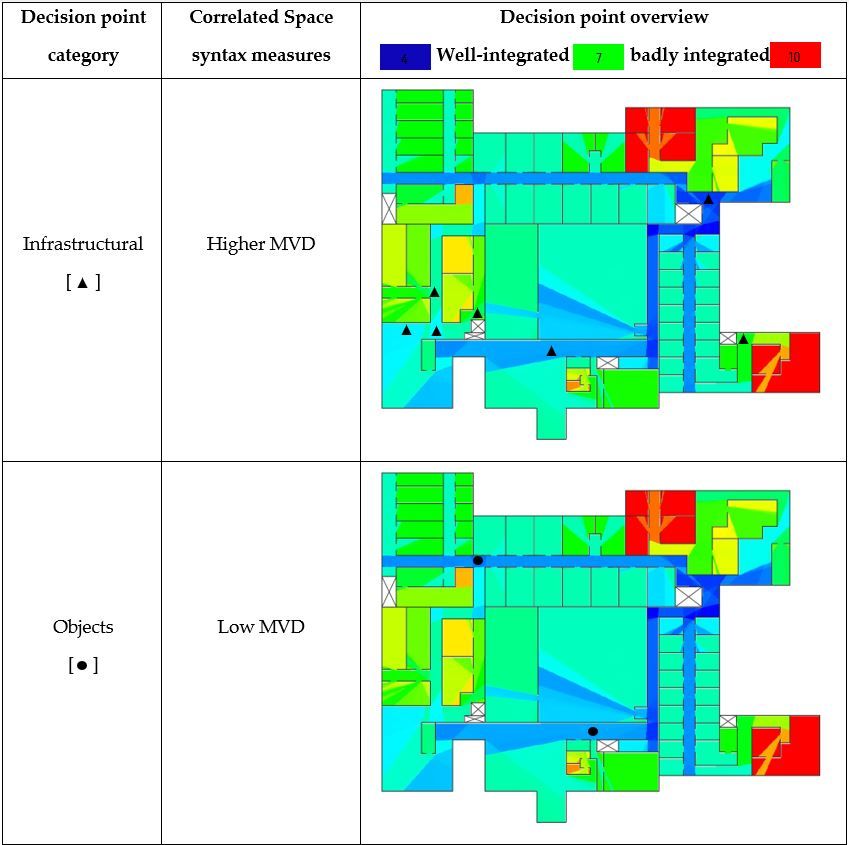
ISPRS Int. J. Geo-Inf. 2020, 9, 423                                                                                    5 of 29

2.1.2. Registration and Questionnaire
      The first step in the game development was the design of a registration scene in which personal
information of the participants could be acquired by use of a basic questionnaire. In this scene,
the participants choose a user name and are asked for their age and study discipline. Additionally,
the participants are asked two questions: Do you often have trouble with indoor wayfinding and do you
often play videogames? Every participant received a unique ID, which was important for the storage
of the data whilst playing the game. Important to note is that if the participants played multiple
times,
  ISPRSthe
        Int. data   were
             J. Geo‐Inf.     always
                         2020, 9, x FORrelated   to their unique ID. The participants were not able to play without
                                         PEER REVIEW                                                                   5 of 29
completing the registration and log-in. To ensure this, the play button could only be clicked when
  completing
the participants  thehad
                       registration
                            completed   and   log‐in.
                                          their  gameTolog-in.
                                                          ensureFurthermore,
                                                                 this, the playthe
                                                                                 button
                                                                                    inputcould  only bewas
                                                                                           verification   clicked   when the
                                                                                                              implemented
  participants     had    completed      their  game   log‐in. Furthermore,   the  input  verification
in the registration scene, obligating the participants to answer all the questions before being able    was   implemented
toin the registration scene, obligating the participants to answer all the questions before being able to
   register.
  register.
2.1.3. Virtual Environment
  2.1.3. Virtual Environment
      The second step in the game development was designing a virtual environment. This environment
        The second
was established             step in the
                      in Autodesk             game development
                                          AutoCAD       and consistedwas of adesigning
                                                                              single floora with
                                                                                             virtual   environment.
                                                                                                    a reception,         This
                                                                                                                    cafeteria,
  environment       was    established     in  Autodesk    AutoCAD    and  consisted   of a single
and a varying amount of rooms based on an existing hospital floor. The dimensions were designed     floor with   a reception,
incafeteria,
   such a way  andthat
                     a varying      amount
                            a normally         of rooms
                                            scaled   avatarbased on easily
                                                             could  an existing   hospital
                                                                            pass and         floor. through
                                                                                        navigate     The dimensions     were
                                                                                                               the building
  designed      in such     a way    that  a  normally   scaled  avatar  could   easily pass   and
within an acceptable time. Figure 1 represents the designed floorplan of the indoor environment,     navigate   through   the
  building     within      an  acceptable      time.  Figure
including the used dimensions in meters on a scale of 1:300.   1 represents    the  designed    floorplan    of  the  indoor
  environment, including the used dimensions in meters on a scale of 1:300.

                                      Figure 1. Floor plan of the indoor environment.
                                       Figure 1. Floor plan of the indoor environment.

       In order to create a realistic environment, different game objects were added in the Unity 3D
  environment. The doors and stairs were implemented in the game and the floor was given a material
  with a wooden texture. Various artificial lights were set up and the stairs had a metallic texture.
  Furthermore, the roof was attached, including various domes, to give the participants a realistic
  indoor feeling while wayfinding. Important to note is that the link with reality was still very small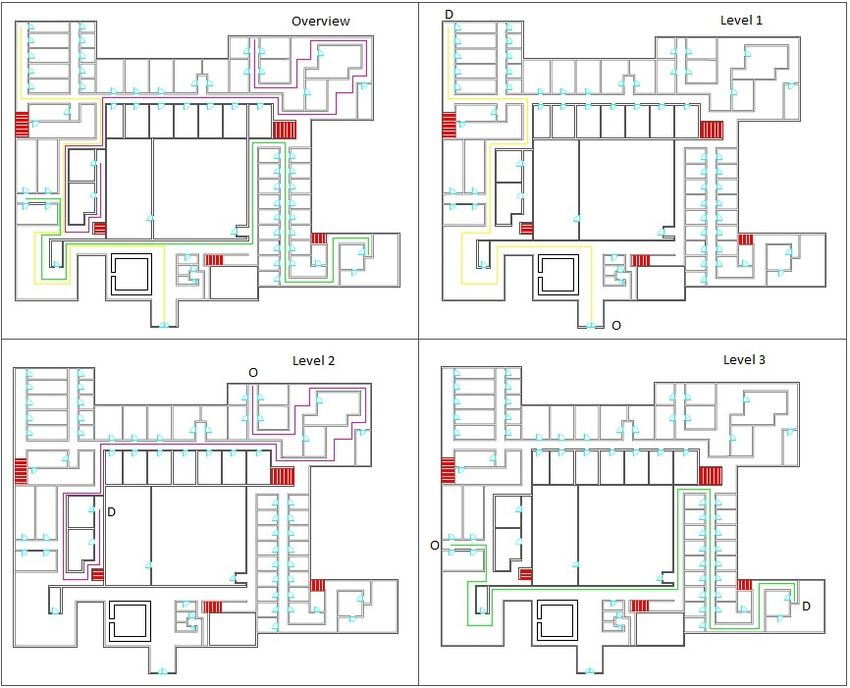
ISPRS Int. J. Geo-Inf. 2020, 9, 423 6 of 29
In order to create a realistic environment, different game objects were added in the Unity 3D
environment. The doors and stairs were implemented in the game and the floor was given a material
with a wooden texture. Various artificial lights were set up and the stairs had a metallic texture.
Furthermore, the roof was attached, including various domes, to give the participants a realistic
indoor feeling while wayfinding. Important to note is that the link with reality was still very small
and the used model was only a simplified version of the building. Therefore, information about
participants being familiar with the building was not taken into account, nor were participants informed
about the origin of the environment.
ISPRS Int. J. Geo‐Inf. 2020, 9, x FOR PEER REVIEW 6 of 29
2.1.4. Avatar Implementation and Player Movement
2.1.4. Avatar Implementation and Player Movement
The third step was the implementation of an avatar and his movement so as to give the participants
The third to
the opportunity step was thethrough
navigate implementation of an For
the building. avatar
thisand his an
study, movement
animationso figure
as to give
was the
used
participants the opportunity to navigate through the building. For this study, an
as the avatar, imported from the Unity asset store. The avatar was given realistic characteristics animation figure
was
such as used as the avatar,
the influence imported
of gravity fromofthe
as a result Unity asset
a so-called store. The
rigidbody. avatar
To make was
sure thegiven
avatarrealistic
was not
pulled through the surface or could not walk through the walls, a mesh collider was applied tothe
characteristics such as the influence of gravity as a result of a so‐called rigidbody. To make sure both
theavatar
avatarwasandnotthepulled through the surface or could not walk through the walls, a mesh collider was
3D-model of the building. By doing so, one of the game boundaries was created
applied to both the avatar and the 3D‐model of the building. By doing so, one of the game boundaries
that made movement through walls impossible. Furthermore, the scripting interface of the rigidbody
was created that made movement through walls impossible. Furthermore, the scripting interface of
was applied to add forces to the avatar and to control it in a physically realistic way. The forward
the rigidbody was applied to add forces to the avatar and to control it in a physically realistic way.
and backward forces, linked to the input of the forward and backward arrow key, respectively,
The forward and backward forces, linked to the input of the forward and backward arrow key,
were scripted and appended to the avatar. These forces were combined with the rotation of the avatar,
respectively, were scripted and appended to the avatar. These forces were combined with the rotation
linked
of theto avatar,
the input of the
linked to left
the or right
input ofarrow keys,
the left and employed
or right arrow keys,toandimplement
employed thetoplayer movement
implement the
in the game. Figure 2 illustrates the used avatar and includes information on the
player movement in the game. Figure 2 illustrates the used avatar and includes information on orientation of the
the x-
andorientation
y-axes of the local
of the x‐ coordinate
and y‐axesreference system
of the local used inreference
coordinate the Unity. The acquisition
system used in theand storage
Unity. The of
data is further explained in the next section.
acquisition and storage of data is further explained in the next section.
Figure
Figure 2. 2.Avatar
Avatarimplementation
implementationand
andorientation
orientation of the
the local
localcoordinate
coordinatereference
referencesystem.
system.
2.1.5. Level
2.1.5. Development
Level Development
In In
thethe
fourth
fourthstep,
step,based
basedon
onthe
thefloor
floorplan
plan of
of the building(Figure
the building (Figure1),
1),three
threedifferent
different routes
routes were
were
developed
developed that completely
that completelycover
coverthe
thebuilding.
building. Some parts of
Some parts of the
theroutes
routesoverlapped,
overlapped,sosoplayers
players could
could
approach
approach certain
certaindecision
decisionpoints
pointsfrom
fromdifferent
different directions, dependingon
directions, depending onthe
thelevel.
level.Each
Each route
route had
had
approximately the same length and, therefore, featured a similar level of difficulty. During
approximately the same length and, therefore, featured similar level of difficulty. During each level, each level,
thethe position
position of of
thethe player’s
player’s avatar
avatar waswas extracted,and
extracted, andthe
theparticipants
participantswere
weretracked
trackedbybystoring
storingtheir
their x-,
x‐, y‐, and z‐coordinates together with a timestamp in a PgAdmin database. To be able to link this
data to the routes and decision points (DP) in the building, invisible triggers were put after each
decision point. These triggers were set as box colliders that enabled the “OnTriggerEnter” function.
A script was created that automatically increased the DP integer by one if a collision between the
avatar and a trigger occurred. Starting from zero, the decision point value kept increasing until the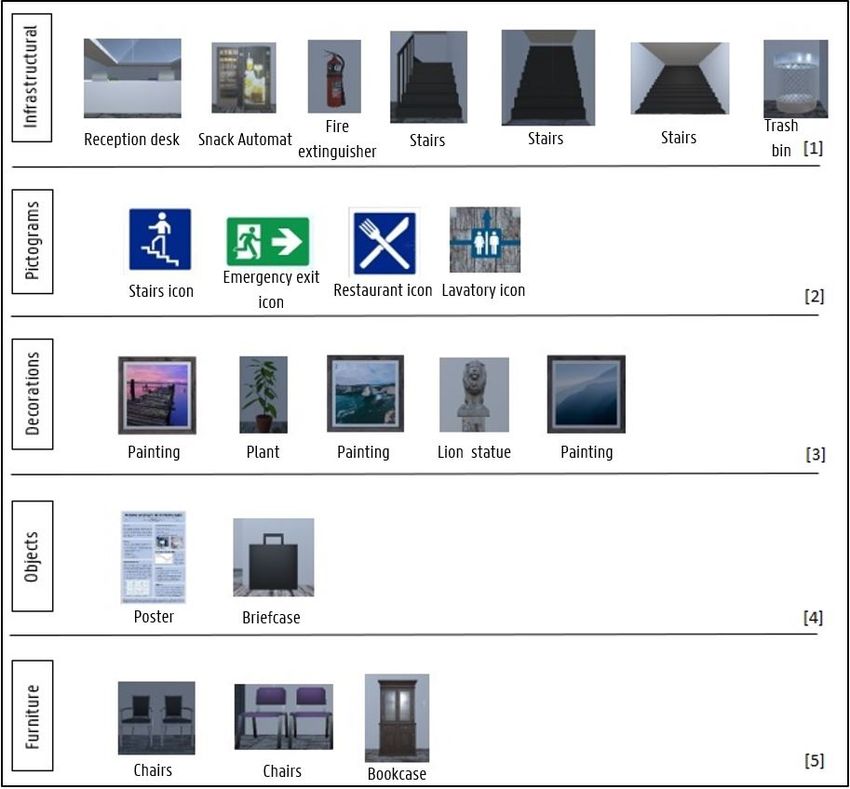
ISPRS Int. J. Geo-Inf. 2020, 9, 423 7 of 29
y-, and z-coordinates together with a timestamp in a PgAdmin database. To be able to link this data
to the routes and decision points (DP) in the building, invisible triggers were put after each decision
point. These triggers were set as box colliders that enabled the “OnTriggerEnter” function. A script
was created that automatically increased the DP integer by one if a collision between the avatar and a
trigger occurred. Starting from zero, the decision point value kept increasing until the last trigger in a
level was reached. The latter was called the end trigger, which automatically reset the decision point
ISPRS Int. J. Geo‐Inf. 2020, 9, x FOR PEER REVIEW 7 of 29
integer to zero, stored information into the database, and started the next scene in the game.
Furthermore, so as to investigate the wayfinding performance, the levels were developed to
Furthermore, so as to investigate the wayfinding performance, the levels were developed to
automatically detect the wrong turns and to acquire information about when and where these were
automatically detect the wrong turns and to acquire information about when and where these were
made by a participant. Since it suffices to know when and where a participant made a wrong turn,
made by a participant. Since it suffices to know when and where a participant made a wrong turn,
the
thegame
gameautomatically
automaticallyasked askedthe
theparticipants
participants to
to turn
turn around
around when
when they
they were
were mistaken. Figure33
mistaken. Figure
illustrates the three indoor routes used for the different game
illustrates the three indoor routes used for the different game levels. levels.
Figure3.3.Illustration
Figure Illustrationof
ofthe
theindoor
indoor route
route design
design from
from origin
origin (O)
(O) to
to destination
destination (D)
(D) for
for all
all three
three levels.
levels.
2.1.6.
2.1.6.Landmarks
Landmarks
AsAsdiscussed
discussedduring
duringthe theintroduction,
introduction, aa movement
movement in a goal-oriented and efficient
goal‐oriented and efficient way
way isisoften
often
troublesome
troublesomeininan anindoor
indoorenvironment.
environment. In In order
order to
to overcome
overcome these difficulties, the the participants
participantsneedneed
various
variouscognitive
cognitiveskills and
skills andthethe
ability to memorize
ability to memorize different instructions
different overover
instructions time.time.
One One
of these skills
of these
isskills
the recognition of remarkable
is the recognition environmental
of remarkable features
environmental or landmarks.
features In this
or landmarks. Incase
this study, thesethese
case study, were
various game objects
were various game in the building
objects in the that structured
building the humanthe
that structured cognitive
humanmap of the environment
cognitive map of the
and were usedand
environment for were
the orientation
used for theand formation
orientation andofformation
the mental of map. Therefore,
the mental in the fifthinstep,
map. Therefore, the
21fifth
different landmarks were used on 32 decision points, and 18 decision points
step, 21 different landmarks were used on 32 decision points, and 18 decision points had no had no landmarks.
landmarks.
Table Table 1 demonstrates
1 demonstrates an overview of anthe
overview
differentoflandmarks,
the different landmarks,
related related
to the level andtodecision
the levelpoints
and
decision points at which they occurred in the game. Appendix A additionally provides an overview
of all decision points in the three different levels and represents those by means of their unique ID as
a combination of the DP integer and the level in which they occurred (Unique ID in Table 1).
Table 1. Landmark overview.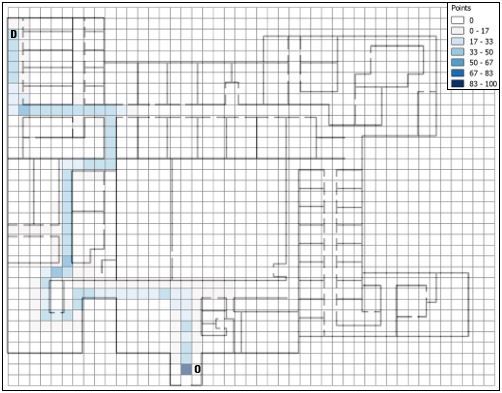
ISPRS Int. J. Geo-Inf. 2020, 9, 423 8 of 29
at which they occurred in the game. Appendix A additionally provides an overview of all decision
points in the three different levels and represents those by means of their unique ID as a combination
of the DP integer and the level in which they occurred (Unique ID in Table 1).
Table 1. Landmark overview.
Number ID Landmark DP Level Unique ID
1 1 Reception Desk 0 1 1
2 2 Painting 1 1 1 11
3 3 Plant 3 1 31
4 4 Chairs 4 1 41
5 5 Snack Automat 5 1 51
6 6 Stairs 6 1 61
7 7 Fire Extinguisher 7 1 71
8 8 Poster 10 1 101
9 9 Stairs Icon 12 1 121
10 10 Waiting Chairs 1 2 12
11 3 Plant 3 2 32
12 11 Emergency Exit Icon 4 2 42
13 12 Painting 2 5 2 52
14 13 Stairs 6 2 62
15 14 Lavatory Icon 9 2 92
16 8 Poster 10 2 102
17 7 Fire Extinguisher 13 2 132
18 9 Stairs Icon 14 2 142
19 6 Stairs 15 2 152
21 7 Fire Extinguisher 0 3 3
22 9 Stairs Icon 1 3 13
23 5 Snack Automat 2 3 23
24 4 Chairs 3 3 33
25 3 Plant 4 3 43
26 2 Painting 1 6 3 63
27 16 Briefcase 7 3 73
28 17 Bookcase 8 3 83
29 18 Restaurant Icon 9 3 93
30 19 Lion Statue 11 3 113
31 20 Painting 3 13 3 133
32 21 Stairs 14 3 143
2.1.7. Ranking and Game Competition
The competition was embedded during the sixth step by means of a ranking so as to create
a social game component. The ranking was based on a top ten of the best total timing results of
the participants and aimed to create a competition between various individuals striving for the best time.
Since the competition and the creation of a social component is one of the main game characteristics,
it was of high importance to implement this final attachment. The ranking was built by use of
Structured Query Language (SQL) and moreover a query, selecting the ten records with the smallest
total timestamp. The names and best total timing outcomes of ten distinct participants were shown
and could be accessed before and/or after playing the game. This way, participants tended to be more
stimulated to aim for a better time and might play multiple times, intending to reach a higher score.
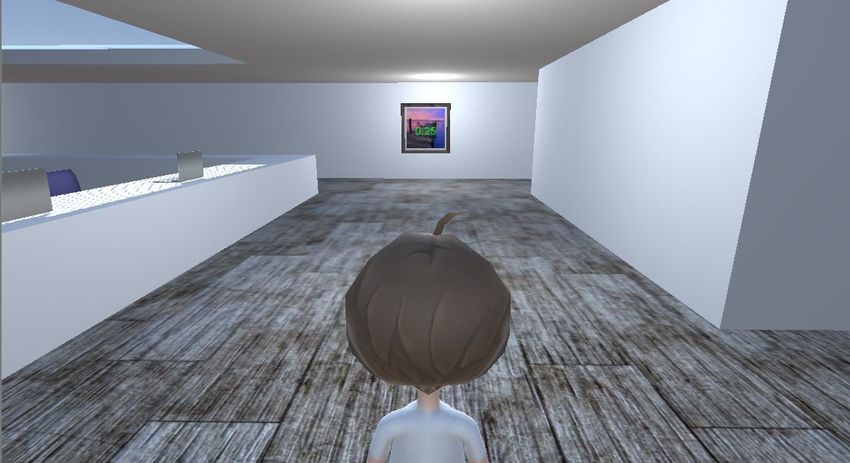
Figure 4 gives an overview of the developed “indoor navigation simulator” game and represents a
participant finding his way in one of the levels aiming to achieve a high score.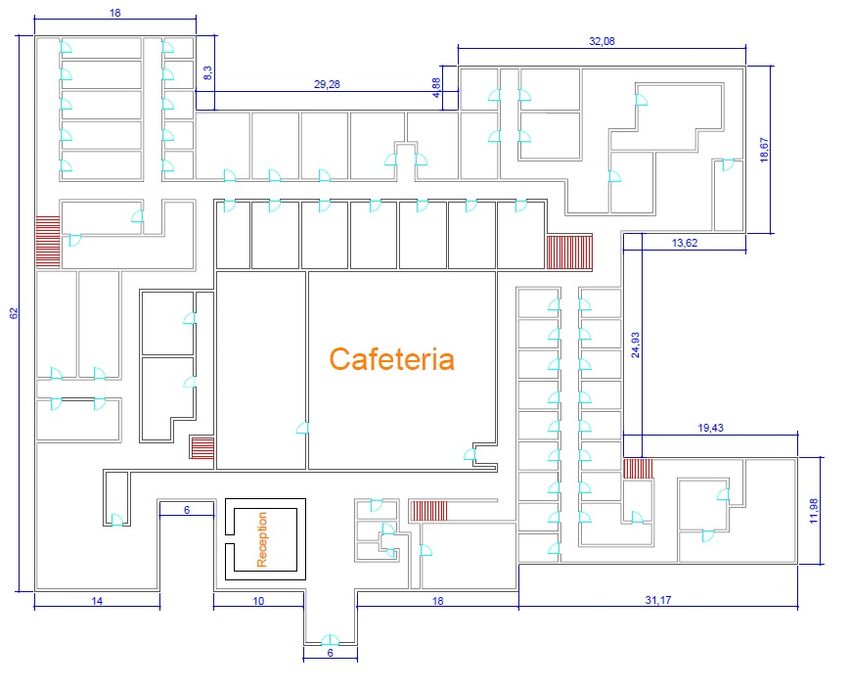
ISPRS Int. J. Geo-Inf. 2020, 9, 423 9 of 29
ISPRS Int. J. Geo‐Inf. 2020, 9, x FOR PEER REVIEW 9 of 29
Figure4.4.Indoor
Figure Indoor navigation
navigation simulator
simulatorgame
gameexample.
example.
2.2.2.2.
Game Testing
Game and
Testing andDistribution
Distribution
Throughout
Throughout thethe lengthy
lengthy process
process of game
of game production,
production, the game
the game construction
construction was tested
was tested by
by internal
internal
team team members,
members, which was which wasthe
called called the alpha
alpha testingtesting
phase. phase.
When When thethe latter
latter satisfiedthe
satisfied theneeds
needs of
theofalpha
the alpha testing,
testing, a next
a next testing
testing phase,
phase, namelythe
namely thebeta
betatesting
testing phase,
phase, waswasconducted
conductedbyby means
meansof of
a pilot test on eight participants [34]. During the test, no bugs occurred
a pilot test on eight participants [34]. During the test, no bugs occurred in the game and the datain the game and the data were
successfully
were successfully acquired.
acquired. Afterwards,
Afterwards, the the
participants
participantsof the pilot
of the testtest
pilot were wereasked
askedforforpotential
potential
improvements to the game, which mostly resulted in comments on
improvements to the game, which mostly resulted in comments on the player movement difficulty by the player movement difficulty
by non‐gamers.
non-gamers. Therefore,
Therefore, a tutoriala was
tutorial wasincreated
created in which participants
which participants could practice could
theirpractice
movements theirin a
movements in a simplified indoor environment, aiming to give the participants a first experience
simplified indoor environment, aiming to give the participants a first experience with the movement
with the movement mechanism of the game.
mechanism of the game.
Finally, the game was built with target platform windows in a x86‐64 architecture. The screen
Finally, the game was built with target platform windows in a x86-64 architecture. The screen
width and height of ,respectively, 1440 and 900 pixels were chosen, and the quality level was set to
width and height of, respectively, 1440 and 900 pixels were chosen, and the quality level was set to
ultra‐high. The Unity 3D software development kit automatically built the game, resulting in an
ultra-high. The Unity 3D software development kit automatically built the game, resulting in an
executive file and its corresponding data files. The “Inno Setup Compiler” software was used to
executive file and its
create an installer corresponding
based on all game filesdataandfiles.
the The “Inno Setup
corresponding Compiler”
executive software
file. The was used
final product was to
create an installerset‐up
the installation basedfor on the
all game
game, files
named andthe the“Indoor
corresponding
Navigation executive
Simulator file.Setup
The (x86)”.
final product
This
was the installation set-up for the game, named the “Indoor Navigation
executive file and the installation manual were sent to all students and staff of the Geography Simulator Setup (x86)”.
This executive file and the installation manual were sent to all students
department at Ghent University. During data‐acquisition, the game was played by 52 different and staff of the Geography
department
participants,at Ghent
resulting University.
in more During
than 20,000 data-acquisition,
collected point the locations
game wasrelated playedtobythe 52 indoor
different
participants,
environment. resulting
Various inwrong
more than
turns20,000 collected point
were registered, and 11 locations related
participants to thethe
played indoor
gameenvironment.
more than
Various wrong turns
once, creating were registered,
the opportunity and 11
for research onparticipants
a learning effect.played the game more than once, creating
the opportunity for research on a learning effect.
2.3. Data Processing
2.3. Data Processing
In this section, the measures for data cleaning are explained first in the pre‐processing
subsection, as wellthe
In this section, as measures
the calculation
for data of the navigation
cleaning velocitiesfirst
are explained before performing
in the statistical
pre-processing tests.
subsection,
as Finally,
well as thethecalculation
data analysis of thephase is described
navigation velocitieswithbefore a performing
focus on the user and
statistical tests.decision point
Finally, the data
characteristics’
analysis investigation,
phase is described withthe effectiveness
a focus on the user of the
andlandmarks
decision point on indoor wayfinding,
characteristics’ and the
investigation,
thecorrelation between
effectiveness of thethe wayfinding
landmarks on performance
indoor wayfinding,and building
and the layout.
correlation between the wayfinding
performance and building layout.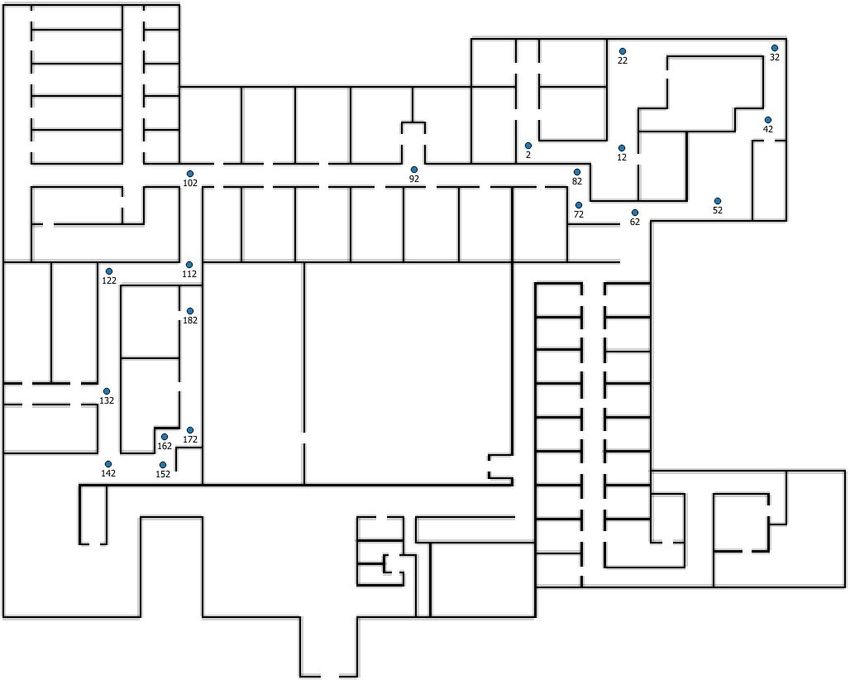
ISPRS Int. J. Geo-Inf. 2020, 9, 423                                                                   10 of 29

2.3.1. Pre-Processing
     In general, approximately 20 percent of the data could not be used due to an unforeseen server
failure as a result of VPN connection errors or too many simultaneous server requests. After data
cleaning, 41 individual datasets could be applied for the user characteristics’ analysis and decision
point characteristics’ analysis, 11 datasets might be useful for a learning effect analysis.
     The navigation velocity is utilized in statistical analysis since it gives the opportunity to compare
different decision points with each other. This value is calculated by means of time and Euclidean
distance between the tracked point locations. As for the research on user characteristics, the traveling
distance and time regarding the 3 levels were calculated for each participant so as to obtain their overall
navigation velocity as the average of the three different levels.

2.3.2. Statistical Analysis
      In the statistical analysis, the influence of the user and decision point characteristics on
the wayfinding behavior was investigated. Additionally, the effectiveness of the landmarks
and architecture on wayfinding performance was studied, followed by research on a learning effect by
playing the game. Five different steps were executed based on various measures such as the navigation
velocity and wrong turns of the participants. It is important to notice that the calculated navigation
velocities were not normally distributed and thus non-parametric tests were used in this study.
      In the first step of the analysis, the influence of the personal characteristics on the total navigation
velocity and amount of wrong turns was looked into. If the Kruskal–Wallis test indicated a difference
between various groups of participants, pairwise, one-sided Mann–Whitney U-tests with Bonferroni
correction were used to determine between which groups the differences lay. In order to investigate
the difference between the proportions of wrong turns in the groups, a two-proportion z-test was used.
The groups were formed by the answers to the questions, namely, whether the participants often get
lost or not and whether or not they often play games. Additionally, the learning effect was investigated
by means of participants’ data who played the game multiple times. The total navigation velocities,
aggregated for all three levels and the amounts of wrong turns, were compared for different tries by
use of a graphical representation. Moreover, two-sided Mann–Whitney U-tests were executed so as to
investigate the significance of such effects and to conclude whether they are present in this study.
      In a second step, the influence of the decision point characteristics was tested by determining
whether there were any significant differences between the velocities of the participants at different
decision points or landmark categories. All decision points were classified in two ways: according to
the decision point topology and according to the required wayfinding action. First of all, based on
the decision point topology, a distinction was made between a single-turn (i.e., a turn with only one
wayfinding option), a multiple-turn (i.e., a turn with more than one wayfinding option), and finally
the start and end of each level. A Kruskal–Wallis and pairwise one-sided Mann–Whitney U-test
were used so as to examine the significant differences between the groups. Second of all, based on
the required wayfinding action, a distinction was made between going straight forward, turning to
the left, and turning to the right. As for this categorization, both the wrong turns and the differences
between the navigation velocities were analyzed with, respectively, a Chi-square goodness-of-fit test
and a Kruskal–Wallis test accompanied with pairwise one-sided Mann–Whitney U-tests.
      In a third step, the landmarks were divided into different groups in order to explore the landmarks’
effectiveness on the indoor wayfinding performance. Following the study by Viaene [6], six different
categories of landmarks were employed: infrastructural, pictograms, decorations, objects, furniture,
and no landmark at all. The differences between the velocities and wrong turns in the landmark
categories were analyzed using the same tests as in the previous step. Figure 5 illustrates
the categorization of the landmarks by means of the corresponding images.
ISPRS Int. J. Geo-Inf. 2020, 9, 423 11 of 29
ISPRS Int. J. Geo‐Inf. 2020, 9, x FOR PEER REVIEW 11 of 29
Figure5.5.Landmark
Figure Landmark categorization.
categorization.
In aInfourth step,step,
a fourth the correlation between
the correlation the mean
between the visual
mean depth
visual (MVD)
depth measures and the navigation
(MVD) measures and the
velocities
navigation at different
velocitiesdecision points
at different waspoints
decision analyzed. The MVD
was analyzed. TheisMVD
a global VGA measure
is a global that is
VGA measure
that is calculated
calculated as the meanas the meannumber
global global number of visual
of visual turns to turns
reachto reach one specific
one specific pointpoint
fromfrom
everyevery
other
other point in
point in the building. It was calculated with the isovist.org software as values between 4 (shallow4 or
the building. It was calculated with the isovist.org software as values between
(shallow or well‐integrated)
well-integrated) and 10 (deep or and 10 (deep
badly or badly
integrated) integrated)
[35]. Since the[35]. Since the
calculated calculated
navigation navigation
velocities were
notvelocities
normallywere not normally
distributed, distributed,
the Spearman thecorrelation
rank Spearman rank correlation
coefficient coefficient
was used was
for this used forAtthis
analysis. first,
analysis. At first, the Spearman rank correlation between the computed navigation
the Spearman rank correlation between the computed navigation velocity and the MVD measure velocity and the
wasMVD measure for
determined wasalldetermined for all decision
decision points. Next, the points.
same Next, the executed
test was same test onwasthe
executed onpoints
decision the
decision points located in the deep spaces on the one hand and in shallow spaces on the other hand
located in the deep spaces on the one hand and in shallow spaces on the other hand to investigate
to investigate the difference in navigation velocity between these two groups. It is quite important to
the difference in navigation velocity between these two groups. It is quite important to note that,
note that, for this case study, deep spaces were mainly located in convex spaces and shallow spaces
for this case study, deep spaces were mainly located in convex spaces and shallow spaces were mainly
were mainly located in the narrow hallways. Figure 6 summarizes the statistical analysis and gives
located in the narrow hallways. Figure 6 summarizes the statistical analysis and gives an overview of
an overview of the used measures and conducted tests in each step.
the used measures and conducted tests in each step.ISPRS Int. J. Geo-Inf. 2020, 9, 423 12 of 29
ISPRS Int. J. Geo‐Inf. 2020, 9, x FOR PEER REVIEW 12 of 29
Figure6.6.Flowchart
Figure Flowchart of the statisticalanalysis.
the statistical analysis.
3. Results
3. Results
3.1. 3.1.
UserUser
Characteristics
Characteristics
Table 2 gives
Table an overview
2 gives an overviewof theofuser
the characteristics, including
user characteristics, data on
including theon
data agethe
category, education
age category,
level,education
answerslevel,
to theanswers
generaltoquestions during
the general the registration,
questions and the wrong
during the registration, turns
and the during
wrong turnswayfinding
during
wayfinding
in the in the
first try. The first try. The
participants participants
provided theirprovided their ownofestimation
own estimation wayfinding of wayfinding
capabilitiescapabilities
by answering
by answering but
the questionnaire the were
questionnaire
also dividedbut into
were also divided
groups based onintotheirgroups based
effective on their (at
presentation effective
least one
presentation (at least one wrong
wrong turn), which was not always the same. turn), which was not always the same.
Table 2. User characteristics.
Age Category Education Level At least One Wrong Turn
18–20 27% Higher 98% Yes 83%
21–25 56% Primary 2% No 17%
26–30 10%
30+ 7%
General questions
Do you often have trouble with indoor wayfinding? Do you often play video games?
Yes 24% 32%
No 76% 68%ISPRS Int. J. Geo-Inf. 2020, 9, 423 13 of 29
The resulting p values of the Kruskal–Wallis tests on the differences between the user groups can
be found in Table 3. Based on these tests, the difference between two types of groups was insignificant:
groups based on the first question (i.e., Do you often have trouble with indoor wayfinding?) and groups
of mistaken and non-mistaken participants (i.e., at least one wrong turn) in their first try. The first finding
means that there were no significant differences in the navigation velocities of the participants based
on their wayfinding capabilities’ estimation. The second result suggests that although participants
made a wrong turn, their navigation velocities did not differ significantly from the participants that
did not make a wrong turn
Table 3. Significance of differences between the groups of participants based on their navigation
velocities over the the different levels.
Groups of Participants p Values
One-tailed significance values resulting from a Kruskal–Wallis test
Question (1) Do you often have trouble with indoor wayfinding? 0.832
At least one wrong turn 0.332
Question (2) Do you often play video games? 0.000 *
One-tailed significance value resulting from a Mann–Whitney U-test (with Bonferroni correction)
Question (2) Yes > No 0.000 *
* Significant at the 95% confidence level.
Furthermore, the difference between the groups based on the second question (i.e., Do you often
play video games?) was proven significant and, therefore, a pairwise one-tailed Mann–Whitney U
test was executed in order to determine which group was characterized by a significantly higher
navigation velocity. As could be expected, the participants who often play games had a significantly
higher navigation velocity in the three different levels. Despite the creation of a tutorial after the beta
testing and the feedback on the difficulty of player movements, a significant difference could still be
found between the gamers and the non-gamers group.
Additionally, a two-proportions z-test was executed to investigate a statistically significant
difference between the number of wrong turns in the groups based on the questions during registration.
The results show there was no significant difference in the proportion of wrong turns between
the groups (Table 4).
Table 4. Significance of differences between the groups of participants based on the proportion of
wrong turns over the amount of participants in the group.
Groups of Participants p Values
* Two-proportions z-test
Question (1) Do you often have trouble with indoor wayfinding? 0.465
Question (2) Do you often play video games? 0.804
* Significant at the 95% confidence level.
As for the learning effect in the game, 11 participants played multiple times, but only 3 of them
more than twice. Therefore, only the differences between the first and second try were investigated.
Figure 7 illustrates the total navigation velocity of the participants in tries 1 and 2, aggregated for
all three game levels. In most cases, the differences between both tries were only minimal, with
the exception of the players with ID 13, 23, 24, and 42. It is important to note that only 5 out of
11 participants reported to have experience in playing games.As for the learning effect in the game, 11 participants played multiple times, but only 3 of them
more than twice. Therefore, only the differences between the first and second try were investigated.
Figure 7 illustrates the total navigation velocity of the participants in tries 1 and 2, aggregated for all
three game levels. In most cases, the differences between both tries were only minimal, with the
exception
ISPRS of the
Int. J. Geo-Inf. players
2020, 9, 423 with ID 13, 23, 24, and 42. It is important to note that only 5 out of1411
of 29
participants reported to have experience in playing games.
Total navigation velocity in try 1 and 2
2.5
Total navigation velocity [m/s]
2
1.5
1
0.5
0
10 12 13 14 15 16 23 24 25 41 42
Player ID
Try 1 Try 2
Figure7.7.Total
Figure Totalnavigation
navigation velocity tries 11 and
velocity in tries and22for
forall
allthree
threelevels.
levels.
The results
The results indicate
indicatea atrend
trendtowards
towardsaa slightly
slightly higher totalnavigation
higher total navigationvelocity
velocityinin the
the second
second trytry
andandthus
thusa better
a betterwayfinding
wayfindingininthe thebuilding,
building, but according
accordingto tothe
thetwo‐tailed
two-tailedMann–Whitney
Mann–Whitney U-test,
U‐test,
thisthis trend
trend is is
notnot significant(p(p== 0.670).
statisticallysignificant
statistically 0.670).
Finally,
Finally, Table5 5gives
Table givesan an overview
overview of of the
thenumber
numberofofwrong
wrong turns made
turns by the
made by participants in
the participants
in their
their first
firstand
andsecond
secondtries. In most
tries. cases,
In most the numbers
cases, of wrong
the numbers turns turns
of wrong were not very
were notdifferent. This
very different.
observation
This observation is supported
is supported by the
by statistical analysis
the statistical with with
analysis the two‐tailed Mann–Whitney
the two-tailed Mann–WhitneyU‐test (p =
U-test
0.972).
(p = 0.972).
Table 5. Number of wrong turns made by participants in tries 1 and 2.
Player ID Try 1 Try 2
10 2 0
12 0 0
13 3 0
14 0 2
15 1 0
16 0 2
23 0 3
24 0 1
25 1 2
41 0 0
42 1 0
3.2. Decision Point Characteristics
The results of the statistical analysis can be found in Table 6. The Kruskal–Wallis test shows
that there is a significant difference in the velocities of the participants in different categories of
decision points based on the topology on one hand and the required wayfinding action on the other
hand. Therefore, pairwise one-tailed Mann–Whitney U-tests were executed so as to determine which
categories were characterized by significant higher navigation velocities.ISPRS Int. J. Geo-Inf. 2020, 9, 423 15 of 29
Table 6. Significance of differences between the categories of decision points based on the navigation
velocity of the participants at each decision point.
Groups of Decision Points p Values
One-tailed significance values resulting from a Kruskal–Wallis test
Categorization based on the topology 0.000 *
Categorization based on the required wayfinding action 0.000 *
One-tailed significance values resulting from a Mann–Whitney U-test (with Bonferroni correction)
Topology-based
Single-turn > Multiple-turn 0.999
Single-turn > Start/end 0.000 *
Multiple-turn > Single-turn 0.000 *
Multiple-turn > Start/end 0.000 *
Start/end > Single-turn 0.999
Start/end > Multiple-turn 0.999
Wayfinding action-based
Straightforward > Turn right 0.000 *
Straightforward > Turn left 0.000 *
Turn right > Turn left 0.999
Turn right > Straight forward 0.999
Turn left > Turn right 0.999
Turn left > Straight forward 0.999
* Significant at the 95% confidence level.
The results show that the participants had the highest navigation velocity at multiple-turns,
followed by single-turns and they moved the slowest at the start or end of a route. An additional
analysis on the start/end category reveals that the low navigation velocity was mostly caused by
the start decision points and not the end decision points (p = 0.000). Furthermore, Table 6 shows that
the navigation velocity was significantly higher at the decision points in which the participants were
asked to go straight forward, compared with the decision points for which the wayfinding instructions
required the participant to turn left or right.
Finally, Table 7 illustrates the results of the statistical analysis on the amount of wrong turns
in the decision point categories according to the required wayfinding action. As for the topology-based
decision points’ categorization, the amount of wrong turns was not taken into account since no wrong
turns could be made at single turns. The Chi-square goodness-of-fit test was used to determine whether
the sample, being the observed amount of wrong turns in each decision point category, was consistent
with a hypothesized distribution. Since not every category had the same number of decision points,
the expected distribution was not evenly distributed. It was calculated as the product of the total
number of wrong turns and the proportion of multiple-turns of a specific landmark category compared
with the total number of multiple-turns.
Table 7. Chi-square goodness-of-fit test between the observed and the expected amounts of wrong
turns in the decision point groups categorized on the required wayfinding action.
Group Observed Expected
Straightforward 13 29.7
Turn left 38 19.8
Turn right 15 16.5
Chi-square 0.000 *
* Significant at the 95% confidence level.ISPRS Int. J. Geo-Inf. 2020, 9, 423 16 of 29
The null hypothesis assumes that the observed amount of wrong turns follows the expected
distribution, proportional with the number of decision points in each category. The alternative
hypothesis on the other hand assumes that the amount of wrong turns is distributed significantly
differently. The results show that the null hypothesis could be rejected in this analysis (p = 0.000).
As a result, one could argue that significantly less wrong straight forward actions and substantially
more wrong left-turn actions were made than would be expected, while the number of wrong right-turn
actions was quite similar to the expected number.
3.3. Landmark Effectiveness
Regarding the investigation of the effectiveness of landmarks on the indoor wayfinding
performance, the significant results of the statistical analysis on navigation velocity are shown
in Table 8. The p values of the executed Kruskal–Wallis tests show that there was a significant
difference in the participants’ navigation velocity at the decision points with landmarks from
the different categories: infrastructural, pictograms, decorations, objects, furniture, no landmark
at all. Therefore, pairwise one-tailed Mann–Whitney U-tests were executed to determine which
categories were characterized by significantly higher navigation velocities. It is important to note
that all landmarks were characterized with the same level of difficulty and they could all be easily
identified during wayfinding. Furthermore, the decision points at the start of a level were not taken
into account in this analysis. The previous test showed that it took a while for participants to start
moving at the beginning of a route, thus, including the starting points could bias the test results with
the navigation velocity as a measure.
Table 8. Significant differences between the landmark categories based on the navigation velocity of
the participants at each decision point.
Groups of Landmarks p Values
One-tailed significance value resulting from a Kruskal–Wallis test
Categorization 0.000 *
One-tailed significance values resulting from a Mann–Whitney U-test (with Bonferroni correction)
No landmark > Furniture 0.008 *
Infrastructural > Furniture 0.018 *
Objects > No landmark 0.000 *
Objects > Infrastructural 0.000 *
Objects > Pictograms 0.000 *
Objects > Decorations 0.000 *
Objects > Furniture 0.000 *
* Significant at the 95% confidence level.
The results show that, compared to the decision points containing landmarks from the categories
no landmark, infrastructural, pictograms, decorations, and furniture, the navigation velocity at
the decision points containing landmarks from the objects category was significantly higher according
to the Mann–Whitney U-tests. Furthermore, compared to the decision points containing landmarks
from the furniture category, the navigation velocity at the decision points containing landmarks from
the categories no landmark and infrastructural also were significantly higher.
Table 9 represents the results of the statistical analysis on the amount of wrong turns at the decision
points in the landmark-based categories. The Chi-square goodness-of-fit test was used, analogous to
the analysis of the required wayfinding actions. It is important to note that the no landmark category
was characterized by no wrong turns. The Chi-square goodness-of-fit test requires that all observed
or expected frequencies in each category should be 5 at least. As a result, the no landmark category
was not considered in this test, and the proportions were adjusted to the total amount of decision
points, excluding the ones in the no landmark category.ISPRS Int. J. Geo-Inf. 2020, 9, 423 17 of 29
Table 9. Chi-square goodness-of-fit test between the observed and expected amounts of wrong turns
in the landmark type-based categories.
Group Observed Expected
Infrastructural 20 27.79
Pictograms 11 17.36
Decorations 11 6.95
Objects 13 10.42
Furniture 11 3.47
Chi-square 0.000 *
* Significant at the 95% confidence level.
The analysis shows that the null hypothesis could be rejected (p = 0.000). As a result, one could
argue that the distribution of wrong turns in the landmark type-based categories of decision points
was significantly different than the expected distribution of wrong turns. More wrong turns were
made than expected at the decision points with a landmark from the categories decorations, objects,
and furniture. The landmarks from the categories pictograms and infrastructural were characterized
by less wrong turns than expected.
3.4. Building Layout and Architecture
In order to determine the link between the theoretical complexity of the floorplan, quantified
by the mean visual depth measure and navigation velocity, the correlation between these two values
was analyzed. The general spearman rank correlation coefficient and the coefficient for the decision
points in deep and shallow spaces can be found in Table 10. It is important to note that the decision
points at the start of the levels, characterized by a significantly lower navigation velocity, were not
taken into account since they could bias the results, as mentioned in Section 3.2.
Table 10. Spearman rank correlation coefficient of the mean visual depth (MVD) and navigation velocity.
Groups Correlation Coefficient
Spearman rank correlation
General coefficient −0.063 *
Deep spaces −0.156 *
Shallow spaces −0.012
* Significant at the 99% confidence level.
For all decision points in the building, a significant Spearman rank correlation with a coefficient of
−0.063 could be found. In general, these results shows that Y (the navigation velocity) tends to decrease
when X (the mean visual depth measure) increases. However, when a distinction is made between
the deep and shallow spaces, this trend is no longer significant for the shallow spaces, but it increases
for the deep spaces. Figure 8 illustrates the location of these decision points including information on
the correlated space syntax measurements.You can also read