Indoor climate and mould in New Zealand homes
←
→
Page content transcription
If your browser does not render page correctly, please read the page content below

Study Report   SR452 [2021]

               Indoor climate and mould in
               New Zealand homes

               Manfred Plagmann, Vicki White and Peter McDowall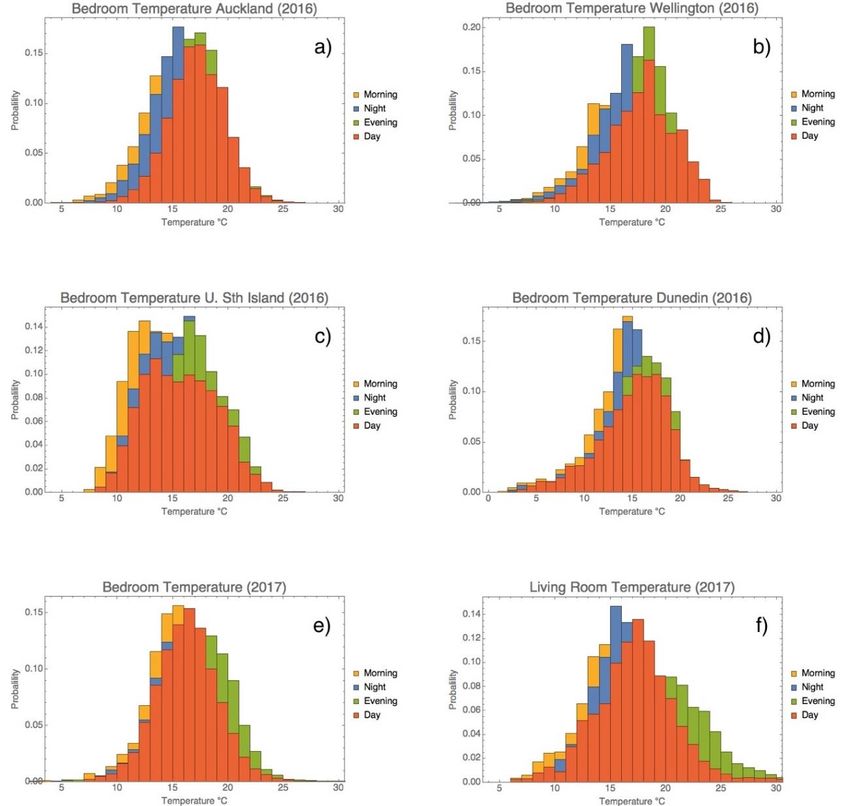
1222 Moonshine Rd, RD1, Porirua 5381   © BRANZ 2021
Private Bag 50 908, Porirua 5240       ISSN: 1179-6197
New Zealand
branz.nz
Study Report SR452 Indoor climate and mould in New Zealand homes

Acknowledgements
We would like to thank:

•   the participants from Kōkiri Marae and Cheryl Davies from the Tū Kotahi Māori
    Asthma Trust and her team for their strong support of this research
•   participants of the House Condition Survey who participated in this more detailed
    study of their behaviour and living conditions
•   Adrienne Burnie from Biodet Services for analysing our samples and providing
    commentary on the findings
•   Julian Crane and Caroline Shorter from the University of Otago for their help and
    discussions during the early phase of the project.

This work was funded by the Building Research Levy. The support is greatly
appreciated.

                                                i
Study Report SR452 Indoor climate and mould in New Zealand homes
Indoor climate and mould in New
Zealand homes
BRANZ Study Report SR452
Authors
Manfred Plagmann, Vicki White and Peter McDowall
Reference
Plagmann, M., White, V. & McDowall, P. (2021). Indoor climate and mould in New
Zealand homes. BRANZ Study Report SR452. Judgeford, New Zealand: BRANZ Ltd.
Abstract
This study looked at 88 homes across New Zealand and measured temperature and
relative humidity during the winter months at locations in Auckland, Wellington, the
upper South Island and Dunedin in 2016 and again in Wellington in 2017. The median
temperature inside bedrooms was 16.4°C, and relative humidity levels were above
65% for 46% percent of the time. The bedrooms where found to be below 18°C for
84% of the night and morning time period (23:00–09:00).
We also determined the mould index at each home, indicating that many homes show
mould growth in bedrooms and/or bathrooms. These results indicate a lack of heating
and/or ventilation in these dwellings causing mould growth with its potential adverse
health effects. Air and dust samples were also taken to determine the fungal spore
count in the air and the presence of mycotoxins in the dust. Very high spore counts
were observed in several homes, which were subsequently remeasured to confirm the
findings.
Keywords
Indoor temperature, humidity, mould, comfort, heating habits, ventilation habits
iiStudy Report SR452 Indoor climate and mould in New Zealand homes
Contents
EXECUTIVE SUMMARY.................................................................................... 1
1. INTRODUCTION ..................................................................................... 2
2. METHODS ............................................................................................... 3
Temperature and humidity sensors .........................................................3
Fungal spores .......................................................................................4
Questionnaires and interviews ................................................................4
3. DATA ANALYSIS ..................................................................................... 6
4. RESULTS................................................................................................. 7
Temperatures .......................................................................................7
Relative humidity ................................................................................ 10
Fungal spores and metabolites ............................................................. 12
Fungal spore counts compared to reference case ................................... 14
Extreme spore counts .......................................................................... 19
4.5.1 Case study 1: Cold and damp .................................................... 19
4.5.2 Case study 2: Warm and dry ..................................................... 21
Fungal metabolites .............................................................................. 22
Observed mould .................................................................................. 24
5. OCCUPANT BEHAVIOUR ....................................................................... 25
Heating living areas – comfort and heating habits .................................. 25
Whole-house heating ........................................................................... 26
How warm is ‘warm enough’? ............................................................... 27
Heating bedrooms ............................................................................... 28
Ventilation practices in the bathroom .................................................... 30
Ventilation practices in the kitchen ........................................................ 32
5.6.1 Ventilation habits around the house ........................................... 33
Damp and mould................................................................................. 34
Occupant health .................................................................................. 36
6. DISCUSSION ........................................................................................ 37
7. CONCLUSION ....................................................................................... 39
REFERENCES ................................................................................................ 40
APPENDIX A: RESULTS FROM FUNGAL SPORE AIR SAMPLES ...................... 42
iiiStudy Report SR452 Indoor climate and mould in New Zealand homes
Figures
Figure 1. Bedroom temperature distribution (5, 25, 50, 75 and 90 percentile) in
Auckland, Wellington, upper South Island and Dunedin from the winter 2016
study. .........................................................................................................7
Figure 2. Bedroom temperature distributions (5, 25, 50, 75 and 90 percentile) in
Wellington from the 2017 study. ...................................................................7
Figure 3. Temperature histograms for the four time periods. .....................................9
Figure 4. Relative humidity over the whole day in the bedrooms of the 2016 survey –
median relative humidity was 64%. ............................................................. 10
Figure 5. Relative humidity over the whole day of the 2017 survey in bedrooms in
Wellington – median relative humidity was 64%. .......................................... 10
Figure 6. Night-time relative humidity for the bedrooms of the 2017 survey (orange)
and adjusted relative humidity (blue) that would have resulted if the bedrooms
were heated to a minimum of 18°C. ............................................................ 11
Figure 7. Average airborne fungal counts based on New Zealand houses without
moisture problems. .................................................................................... 14
Figure 8. Fungal count ratios against the reference counts found in the living room
(blue), bathroom (brown) and bedroom (orange) of house AK4.1. ................. 15
Figure 9. Fungal count ratios against the reference counts measured in the main
bedroom of house AK4.1. ........................................................................... 15
Figure 10. Fungal count ratios against the reference counts found in the living room
(blue), bathroom (brown) and bedroom (orange) of house AK1.1. ................. 16
Figure 11. Fungal count ratios against the reference counts measured in the main
bedroom of house AK1.1. ........................................................................... 16
Figure 12. Temperature (blue) and relative humidity (orange) in the main bedroom of
house AK1.1. ............................................................................................. 16
Figure 13. Fungal count ratios against the reference counts found in the living room
(blue), bathroom (brown) and bedroom (orange) of house DN1.5. ................. 17
Figure 14. Fungal count ratios against the reference counts measured in the main
bedroom of house DN1.5. ........................................................................... 17
Figure 15. Fungal count ratios against the reference counts found in the living room
(blue), bathroom (brown) and bedroom (orange) of house DN1.2. ................. 18
Figure 16. Fungal count ratios against the reference counts measured in the main
bedroom of house DN1.2. ........................................................................... 18
Figure 17. Temperature (blue) and relative humidity (orange) in the main bedroom of
house DN1.2. ............................................................................................ 18
Figure 18. Fungal count ratios of a bedroom in WN3.1 against the reference counts.
Penicillium/Aspergillus type exceeds the reference by a factor of over 800 and
the spore clusters are also very high. ........................................................... 19
Figure 19. Temperature (blue) and very high relative humidity (orange) in the main
bedroom. .................................................................................................. 19
Figure 20. Mould on bathroom ceiling in house WN3.1. ........................................... 20
Figure 21. Fungal count ratios of a bedroom in WN3.3 against the reference counts. . 21
Figure 22. Temperature (blue) and relative humidity (orange) in the main bedroom. . 22
Figure 23. Average, minimum and maximum mould index recorded in the main
bedroom of each property in the 2017 study. ............................................... 24
ivStudy Report SR452 Indoor climate and mould in New Zealand homes
Figure 24. Frequency of main living area being colder than the householder would have
liked last winter. ........................................................................................ 25
Figure 25. Average hourly temperature in the main living area where occupants slept
(DN1.5, 2017). .......................................................................................... 27
Figure 26. Average hourly temperature and relative humidity in the living area and
bedroom (CH1.2, 2017). ............................................................................. 28
Figure 27. Ventilation practices whilst taking a bath/shower. ................................... 30
Figure 28. Ventilation practices after taking a bath/shower. ..................................... 30
Figure 29. Ventilation practices whilst cooking hot meals. ........................................ 32
Figure 30. Average hourly temperature and relative humidity over all days in all the
bedrooms of three study households (2017)................................................. 33
Figure 31. Householders’ assessment of mould and damp in their home. .................. 35
Figure 32. Problems experienced by householders in their home. ............................. 35
Tables
Table 1. Summary of study samples. .......................................................................3
Table 2. Mean temperatures in bedrooms and outdoors by location and time period. ...8
Table 3. Temperature readings for all bedrooms from the 2016 study showing the
percentage of time a bedroom was below that temperature and how many
bedrooms recorded below that temperature. ..................................................8
Table 4. Mean temperatures for the 2017 Wellington study by room and time period. ..8
Table 5. Temperature readings for all bedrooms from the 2017 study showing the
proportion of time a bedroom was below that temperature and percentage of
bedrooms recorded below that temperature. ..................................................9
Table 6. Relative humidity readings for all bedrooms from the 2016 study showing the
proportion of time a bedroom was above the relative humidity and percentage
of bedrooms recorded above that relative humidity. ...................................... 11
Table 7. Relative humidity readings for all bedrooms from the 2017 study showing the
proportion of time a bedroom was above the relative humidity and the
percentage of bedrooms recorded above that relative humidity. ..................... 11
Table 8. Summary of the results of the airborne spore sampling conducted in the main
bedroom. .................................................................................................. 13
Table 9. Mycotoxins identified in at least one of the samples. .................................. 23
Table 10. Results from mould assessments in the main bedroom from the 2017 study.
24
Table 11. Ventilation of the bathroom during and after taking a bath/shower. ........... 31
Table 12. Results from the fungal spore air samples................................................ 42
vStudy Report SR452 Indoor climate and mould in New Zealand homes
Executive summary
Temperature and relative humidity are important factors influencing comfort and
health of building occupants. Cold temperatures and excessive moisture give rise to
mould growth, presenting a health risk and causing building material deterioration. In
this study, we looked at 88 homes across New Zealand and measured temperature and
relative humidity during the winter months at locations in Auckland, Wellington, the
upper South Island and Dunedin in 2016 and again in Wellington in 2017. The median
temperature inside bedrooms was 16.4°C, and relative humidity levels were above
65% for 46% percent of the time. The bedrooms were found to be below 18°C for
84% of the night and morning time period (23:00–09:00).
We also determined the mould index at each home (as described by Shorter et al.,
2018), indicating that many homes show mould growth in bedrooms and/or
bathrooms. These results indicate a lack of heating and/or ventilation in these
dwellings causing mould growth with its potential adverse health effects. Air and dust
samples were also taken to determine the fungal spore count in the air and the
presence of mycotoxins in the dust. Very high spore counts were observed in several
homes, which were subsequently remeasured to confirm the findings. The dust
samples enabled us to try a new technique to show the presence of mycotoxins in the
house from past and present fungal metabolism.
The homes selected for the 2016 study where a subset of the 2015 BRANZ House
Condition Survey and were located in Auckland (30 homes), Wellington (19 homes),
upper South Island (6 homes) and Dunedin (9 homes), with a total of 151 bedrooms.
For the 2017 study, the homes where recruited from the Wellington region (25 homes,
58 bedrooms).
All households participating in the 2016 study were sent a short questionnaire about
their ventilation practices and comfort in the home. A total of 64 questionnaires were
returned. The results showed that, for two-thirds of respondents (66%) their bedroom
was colder than they would have liked for at least some of the time in winter. This
compares to 42% reporting the main living area being colder than they would have
liked at some time in winter. For 11% of households surveyed, the bedrooms were
‘often’ or ‘always’ colder than they would have liked over winter.
The 2017 study extended this questionnaire to a more in-depth semi-structured face-
to-face interview. This was completed with all participants in their home at the end of
the monitoring period. The interview explored heating and ventilation habits and
problems experienced in the home over winter. Responses showed there was a high
tendency to ventilate by opening windows and to heat the living area at some time in
winter, most commonly in the evening. There was far less tendency to directly heat
bedrooms, relying instead on heat flow from the living area and/or methods to
maintain comfort, such as using extra blankets and hot water bottles. Interviewees’
perceptions of comfort, damp and mould in the home were wide ranging, starting from
those who felt their home was ‘freezing’ to those who considered it ‘a warm home’ and
those reporting no problems of damp or mould. There were some extreme cases of
visible mould in bedrooms and signs of damp/leaks to the extent that, in one case, the
bedroom was uninhabitable.
1Study Report SR452 Indoor climate and mould in New Zealand homes
1. Introduction
Temperature and relative humidity are important factors influencing comfort and
health of building occupants. Cold temperatures and excessive moisture give rise to
mould growth, presenting a potential respiratory health risk and causing building
material deterioration.
This report presents findings from two studies that monitored the temperature and
relative humidity in a sample of homes throughout New Zealand in winter of 2016 and
2017. The homes in 2016 study are a subset of the House Condition Survey 2015. The
additional data available for these homes was not analysed as part of this project. The
second study (2017) extended measurements to include fungal spores. In some
houses, dust samples were also collected to evaluate the potential for this method to
analyse the presence of fungal and bacterial mycotoxins. The results of this part of the
study are presented but not discussed in detail as the focus was on testing the
technique and whether qualitative and quantitative analysis of the mycotoxins is
possible. In a later study, we will use this technique to investigate lung function in the
presence of mycotoxins.
Both studies explored occupant-reported ventilation behaviour and perceptions of
problems in the home.
2Study Report SR452 Indoor climate and mould in New Zealand homes
2. Methods
Temperature and humidity sensors
For the 2016 study, temperature and relative humidity sensors were installed in
bedrooms and bathrooms. These locations were chosen as the focus of the study was
moisture condensation and mould. Visible mould is most commonly observed in
bathrooms, being a high moisture area of the home (White & Jones, 2017), while
mould in bedrooms can present particularly high risk to occupant health due to
exposure time (Shorter et al., 2018).
For the 2017 study, temperature and relative humidity sensors were installed in every
room of the home, apart from utility rooms. This was done to provide additional
information and the ability to report on the indoor climate conditions of bedrooms,
bathrooms and living rooms separately.
Table 1 provides a summary of the two studies.
Table 1. Summary of study samples.
Study year 2016 2017
Location Auckland, Wellington, upper Wellington region
South Island, Dunedin
Sample size (number of 64 251
houses)
Total number of sensors 309 132
Areas of the home Bedrooms Bedrooms
measured for Bathrooms Bathrooms
temperature and relative Living areas
humidity
Kitchens
(all rooms except utility)
Additional measurements - Fungal spores, dust samples
Occupant-reported Self-completion questionnaire In-depth semi-structured
behaviour face-to-face interview
(n=242)
The sensors were placed on the inside face of the doors at 1.9 m above the floor to
keep them out of reach and sight as much as possible. This height will, however, over-
represent the room temperature during heating periods (from heaters and solar gain)
due to temperature stratification. Depending on the type of heating source (radiative
or convective), the temperature at the sensor height can be about 0.25–0.5°C warmer
than at 1.5 m height (Pollard, 2001). This slight overestimation during heating periods
is not of concern here as we are focusing on unheated conditions and cold
temperatures where such an effect is not observed.
The sensors used in both studies were SHT15 by Sensirion, with a typical temperature
and relative humidity accuracy of ±0.3°C and ±2.0%, respectively. The sensors were
calibrated using a traceable instrument (Vaisala MTI41) just before being installed in
1
One household joined the study too late for temperature and humidity monitoring but took
part in the interview and fungal spore sampling.
2
One participant declined to take part in the interview.
3Study Report SR452 Indoor climate and mould in New Zealand homes
the homes. After 6 months in the field, the sensors were collected and their reading
again compared with the calibration instrument. The typical deviation in temperature
we found was about 0.3°C with a maximum of 0.4°C. The relative humidity was found
to be within the instrument’s uncertainty of ±2%.
A total of 309 temperature and relative humidity sensors were installed during the
2016 study and 132 sensors for the 2017 study. As the sensors were connected to the
internet, any malfunction could be readily discovered and the sensor replaced. Whilst
none of the sensors malfunctioned, some were lost due to system failure, and two
homes had to be switched off. In a few areas, the lack of good cell network coverage
was a challenge, as the sensors have limited capacity to store data when offline.
Outside temperature and relative humidity were obtained from Metservice and not
measured with sensors.
Fungal spores
The fungal spore samples were taken with an aerosol sampling pump (Buck BioSlide
B1020), which pumped 15 litres of air per minute past an polymeric adhesive (GEL)
covered slide for 10 minutes, giving a trace of bioaerosols (mould, pollen, bacteria
etc.). The sampling pump was mounted on a tripod placed in the bedroom and
outdoors at a height of 1.2 m. The sampling took place at the time of the home visit,
which was usually late morning to early afternoon. The indoor sampling was done with
closed windows and before any vacuuming was done. The outdoor air was sampled a
few metres away from the building. Conditions were always dry, with no need to
sample during rainy days. The sampling slides were analysed by professional fungal
analysis lab Biodet in New Zealand using phase contrast microscopy at 1,000 times
magnification. The whole trace was analysed following ASTM D7391-09 Standard test
method for categorization and quantification of airborne fungal structures in an inertial
impaction sample by optical microscopy. The viable spore sampling was done using a
MAS-100 Eco sampler with agar Petri dishes inside. The sampling was placed similarly
to the slide sampling but the sampling time was only 1 minute so as not to overwhelm
the Petri dish with spores.
The dust samples were taken by vacuuming a 1 m2 area of floor for 2 minutes in the
main bedroom (see Shorter, 2013). The vacuuming was done in a way to sample a
representative ratio of the different floor coverings in the room. The sampling area was
usually located between the bed and the window, if possible. A household vacuum
cleaner was used equipped with a pre-weighed nylon collection sock (25 μm pore size)
and a 0.63 mm mesh pre-filter (to separate any coarse material such as fibres or hair
from the dust) fitted over the tube end of the upholstery nozzle attachment. The
extension tube of the cleaner was then fitted on to the nozzle in the normal way,
making a tight seal with the filter. After the dust was collected, the pre-filter was
removed and the fine filter was placed into a sample jar (100 ml) and weighed. The
samples were collected in a small dust bag mounted just behind the vacuum nozzle.
The dust samples were then weighed and frozen at -40°C until they were shipped for
analysis to the Institute for Analytical Chemistry in Vienna, Austria.
Questionnaires and interviews
The 2016 houses that are part of this study were recruited from the pool of houses
that were part of the representative 2015 House Condition Survey. The 2017 homes
were selected from members of Kōkiri Marae.
4Study Report SR452 Indoor climate and mould in New Zealand homes
The 2016 study included a short self-completion questionnaire that asked participants
about their ventilation habits (use of extractor fans and opening windows) and their
perception of warmth in the main living area and bedrooms over winter. Further
questions asked about any problems in the home, including with damp and mould. The
questionnaire was sent to all participants at the end of the study period. A total of 64
questionnaires were returned.
The 2017 study extended this questionnaire to a more in-depth semi-structured face-
to-face interview. This was completed with all participants in their home at the end of
the monitoring period (November 2017). The interviews typically lasted around 20
minutes and were audio-recorded and transcribed. The interviews explored
householder ventilation and heating habits, comfort and problems experienced in the
home over winter.
5Study Report SR452 Indoor climate and mould in New Zealand homes
3. Data analysis
With the sensors reporting data in real time into the BRANZ database, data consistency
and quality was routinely checked during the study period. The data was divided into
four time intervals – morning (07:00–09:00), day (09:00–17:00), evening (17:00–
23:00) and night (23:00–07:00). For each category, a probability histogram was
produced showing the likelihood of experiencing a certain temperature in bedrooms
and (2017 study only) living rooms. Distributions of temperature and relative humidity
for each bedroom were also analysed in a box and whisker plot. Note that the box and
whisker plots indicate the quantiles 0.1, 0.25, 0.5, 0.75 and 0.9. We do not show the
minima and maxima as we are more interested in the distribution of the temperature
and relative humidity than short-term extremes.
6Study Report SR452 Indoor climate and mould in New Zealand homes
4. Results
Temperatures
The indoor temperatures recorded in bedrooms during the winter months of 2016 (1
June 2016 to 31 August 2016) ranged from:
• 7.5–25.3°C for Auckland
• 9.5–24.5°C for Wellington
• 8.5–23.0°C for the upper South Island
• 5.1–21.7°C for Dunedin.
For the winter 2017 Wellington study a bedroom temperature range of 5.3–27.6°C was
recorded and a living room temperature range of 6.8–31°C.
Figure 1 shows the temperature distribution in bedrooms of all participating homes of
the 2016 study. The red line in the graph represents 18°C, which is the minimum
indoor temperature recommended by the World Health Organization (WHO).
Similar results are shown for the Wellington 2017 study in Figure 2. Both figures show
that the temperature of a number of bedrooms fell below the 18°C mark (red line) for
a large portion of time.
Figure 1. Bedroom temperature distribution (5, 25, 50, 75 and 90 percentile) in
Auckland, Wellington, upper South Island and Dunedin from the winter 2016 study.
Figure 2. Bedroom temperature distributions (5, 25, 50, 75 and 90 percentile) in
Wellington from the 2017 study.
Mean temperatures in bedrooms in Auckland, Wellington, upper South Island, and
Dunedin measured during the winter of 2016 and for the Wellington region again in
2017 are listed in Table 2 and Table 4, respectively. As expected, during the night and
morning hours as the outdoor temperature reaches its minimum, so do the bedroom
temperatures, with an average of 15.1°C and 15.6°C.
7Study Report SR452 Indoor climate and mould in New Zealand homes
Table 4 provides evidence of occupants in the Wellington 2017 study heating their
home sometime in the evenings, with heating then being switched off, resulting in
bedrooms cooling to an average temperature of 15.6°C by the morning.
Table 3 and Table 5 show the percentage of time and the percentage of bedrooms that
reached less than a certain temperature threshold. For example, for the 2016 study, all
of the bedrooms experienced a temperature of less than 18°C for up to 76% of the
time.
During the 2017 study in Wellington (Table 5), 95% of the bedrooms reached a
temperature of less than 18°C for up to 70% of the time.
Table 2. Mean temperatures in bedrooms and outdoors by location and time period.
Location Overall Morning Day Evening Night Number
07:00– 09:00– 17:00– 23:00– of rooms
09:00 17:00 23:00 07:00
Auckland 16.3°C 15.1°C 17.2°C 17.4°C 15.4°C 48
Auckland (outdoors) 12.1°C 10.9°C 13.8°C 12.0°C 10.9°C NA
Wellington (2016) 15.4°C 14.2°C 16.1°C 16.7°C 14.9°C 25
Wellington (outdoors) 9.6°C 8.7°C 11.3°C 9.3°C 8.5°C NA
Wellington (2017) 16.6°C 15.6°C 16.6°C 17.5°C 16.3°C 58
Wellington (outdoors) 9.5°C 8.1°C 11.3°C 9.4°C 8.3°C NA
Upper South Island 15.2°C 13.5°C 15.7°C 16.8°C 14.8°C 13
Upper South Island 7.5°C 5.6°C 10.4°C 7.2°C 5.5°C NA
(outdoors)
Dunedin 14.5°C 13.2°C 15.2°C 15.6°C 14.2°C 18
Dunedin (outdoors) 10.4°C 9.6°C 11.7°C 10.2°C 9.5°C NA
Average bedroom 16.0°C 15.1°C 17.0°C 17.3°C 15.6°C 162
Table 3. Temperature readings for all bedrooms from the 2016 study showing the
percentage of time a bedroom was below that temperature and how many
bedrooms recorded below that temperature.
Readings Proportion of time Percentage of bedrooms
Less than 10°C 3% 54%
Less than 12°C 10% 86%
Less than 14°C 25% 96%
Less than 16°C 50% 99%
Less than 18°C 76% 100%
Less than 21°C 96% 100%
Table 4. Mean temperatures for the 2017 Wellington study by room and time period.
Location Overall Morning Day Evening Night Number
07:00– 09:00– 17:00– 23:00– of rooms
09:00 17:00 23:00 07:00
Wellington living room 17.3°C 15.5°C 17.0°C 19.1°C 16.6°C 25
Wellington bedroom 16.6°C 15.6°C 16.6°C 17.5°C 16.3°C 58
Average 17.0°C 15.6°C 16.8°C 18.3°C 15.6°C 162
8Study Report SR452 Indoor climate and mould in New Zealand homes
Table 5. Temperature readings for all bedrooms from the 2017 study showing the
proportion of time a bedroom was below that temperature and percentage of
bedrooms recorded below that temperature.
Readings Proportion of time Percentage of bedrooms
Less than 10°C 2% 29%
Less than 12°C 6% 60%
Less than 14°C 19% 89%
Less than 16°C 44% 93%
Less than 18°C 70% 95%
Less than 21°C 94% 100%
Figure 3 shows the temperature histograms for the four time periods for the 2016
study (panels a to d) and for the 2017 study (panels e and f).
Figure 3. Temperature histograms for the four time periods.
The 2016 data shows that, for Auckland, little heating was provided to the bedrooms
during the evening as the likelihood of experiencing temperature above 18°C in the
bedrooms rises very little if at all above the daytime likelihood for those temperatures.
9Study Report SR452 Indoor climate and mould in New Zealand homes
Bedroom temperature data from the 2016 study in Wellington, the upper South Island
and Dunedin provide evidence of some heat input, with evening temperature
distributions being above the daytime data.
The 2017 data (Figure 3e) shows evidence that some bedroom heating occurred, even
more so in this sample of Wellington homes compared to the 2016 data.
Figure 3f shows that, while some bedrooms were heated, the living rooms were the
most likely place to be heated, with an average temperature of 19.1°C (Table 4).
Relative humidity
The median relative humidity recorded in bedrooms for the 2016 and 2017 studies was
64%. This was over the full day. During the night time, when the bedrooms were
typically occupied, this gave basically the same median relative humidity of 65%. This
means that, for 50% of the time, the bedrooms had a moisture load high enough to
warrant ventilation or heating to reduce the elevated moisture level. The moisture level
is too high and should not exceed 65% relative humidity to stay well clear of levels
that will promote mould growth. Figure 4 and Figure 5 show that the moisture level
was above the 65% relative humidity line most of the time for many bedrooms.
Figure 4. Relative humidity over the whole day in the bedrooms of the 2016 survey
– median relative humidity was 64%.
Figure 5. Relative humidity over the whole day of the 2017 survey in bedrooms in
Wellington – median relative humidity was 64%.
Figure 6 compares the relative humidity of the 2017 study houses with an adjusted
relative humidity that would have resulted if the bedrooms were heated to a minimum
WHO-recommended temperature of 18°C. For some bedrooms, this heating to 18°C
would result in a reduction in relative humidity. For others however, ventilation would
be required to remove excess moisture.
Bedrooms 3 to 6 in Error! Reference source not found. show a strong reduction in
relative humidity under the adjusted heated to 18°C scenario. This suggests that the
10Study Report SR452 Indoor climate and mould in New Zealand homes
lack of heating in these houses may be the only or most significant cause of the excess
moisture.
Figure 6. Night-time relative humidity for the bedrooms of the 2017 survey (orange)
and adjusted relative humidity (blue) that would have resulted if the bedrooms
were heated to a minimum of 18°C.
Other bedrooms were already at a temperature close to 18°C, and no significant
change in relative humidity would be observable under the heated to 18°C scenario.
Some bedrooms were at an adequate temperature but showed a high relative
humidity. To reduce the relative humidity in these rooms, reducing or eliminating
moisture at the source and/or improved ventilation would be required.
Table 6 shows the percentage of time and the percentage of bedrooms that reached
more than a certain relative humidity in the 2016 study. For example, this shows that
94% of bedrooms experienced a relative humidity of more than 65% for 54% of the
time. During the 2017 study in Wellington (Table 7), 95% of the bedrooms exceeded a
relative humidity of 65% for 46% of the time.
Table 6. Relative humidity readings for all bedrooms from the 2016 study showing
the proportion of time a bedroom was above the relative humidity and percentage
of bedrooms recorded above that relative humidity.
Readings Proportion of time Percentage of bedrooms
More than 90% 1% 11%
More than 80% 4% 58%
More than 75% 11% 71%
More than 70% 23% 86%
More than 65% 54% 94%
More than 60% 71% 96%
Table 7. Relative humidity readings for all bedrooms from the 2017 study showing
the proportion of time a bedroom was above the relative humidity and the
percentage of bedrooms recorded above that relative humidity.
Readings Proportion of time Percentage of bedrooms
More than 90% 2% 16%
More than 80% 6% 45%
More than 75% 13% 62%
More than 70% 28% 83%
More than 65% 46% 95%
More than 60% 66% 95%
11Study Report SR452 Indoor climate and mould in New Zealand homes
Fungal spores and metabolites
Table 8 summarises the results of the air sampling for fungal spores. An air sample
was obtained from various rooms, using an airflow of 15 litres per minute for 10
minutes. The detection limit is 7 spores per m3, so a 0 indicates there were fewer than
7 spores per m3 of air. The full results are shown in Appendix A.
Stachybotrys spores were detected in one sample from a bedroom. This spore type is
indicative of a prolonged leak or major wetting event and is toxigenic. There was no
evidence of a visible leak but this wetting event could have been a while ago or may
have been due to hidden water damage.
Chaetomium spores were detected in a low level in the living room in one house
(CH1.3) and bathroom in another two properties (AK1.1 and DN1.2). Like
Stachybotrys, the presence of this fungus is also indicative of a prolonged leak or
major wetting event. Chaetomium is also considered to be toxigenic and is undesirable
in indoor air.
Penicillium/Aspergillus spore levels were excessive in bedrooms of six houses (DN1.5,
AK1.1, WN2.1, AK3.4, AK2.2 and WN3.1) and in the living room of one property
(DN1.5). Spores were elevated (when compared with Biodet’s database guidelines) in
the bedroom of two houses, bathroom of two houses and living room of one property.
In addition, two houses had slightly raised spore levels (bedroom in AK4.1 and the
bathroom in CH1.3). These fungi grow indoors in response to a raised relative
humidity. This could be due to moisture ingress issues or to an accumulation of
condensation in an area lacking good ventilation resulting in localised superficial fungal
growth.
The Cladosporium level was excessive in a bedroom of three different houses (AK1.1,
WN2.1 and WN3.1). The level was elevated in a further three properties (living room of
DN1.5 and bedroom of CH2.3 and AK1.3). Like Penicillium/Aspergillus, these spore
types will grow indoors where there is a raised relative humidity, and the spores may
be allergenic to sensitive people.
The presence of high levels of bacterial clusters found in one bathroom and one living
room is unusual. In the case of the bathroom, it is more likely to be indicative of
condensation and a lack of good ventilation. In the case of the living room, this would
be more likely be due to increased moisture resulting in bacterial growth.
According to the experts at Biodet, the presence of high levels of bacterial clusters can
be a classic symptom of water-damaged carpet. Although the types of bacteria cannot
be determined from the type of sampling performed here, there is a high probability of
gram-negative bacteria being present. These bacteria may cause respiratory symptoms
involving allergic type reactions. Gram-negative bacteria are so small they may be
capable of deep penetration into the lung upon aerosolisation. They possess endotoxin,
which can be a respiratory irritant. The endotoxin is part of the gram-negative cell wall.
Although the bacteria may be rendered non-viable (dead), the endotoxin remains,
even through extremely high temperatures. Symptoms typically involve elevated
temperatures, followed by malaise and respiratory distress. Occasionally, skin reactions
may occur (Hess-Kosa, 2010).
12Study Report SR452 Indoor climate and mould in New Zealand homes
Table 8. Summary of the results of the airborne spore sampling conducted in the main bedroom.
House Penicillium/Aspergillus Cladosporium Bacterial clusters Other spore
Stachybotrys Chaetomium
ID Excessive Elevated Excessive Elevated (high levels) types
AK4.3 Bedroom 1
DN1.5 Bedroom 1 Bathroom Living room Living room** Living room
Living room Bedroom 1
AK1.1 Bathroom* Bedroom 1 Bathroom Bedroom 1 Bedroom 1 Bedroom 1
Living room Bathroom*** Living room
Living room
WN2.1 Bedroom 3 Bedroom 3 Bedroom 3 Bedroom 3
AK3.4 Bedroom Bedroom Bedroom
AK2.2 Bedroom 2 Bedroom 2
WN3.1 Bedroom 3 Bedroom 3 Bedroom 3
CH2.3 Bedroom 1 Bedroom 1 Bedroom 1
AK1.3 Bedroom Bedroom Bedroom Bedroom
AK4.1 Bedroom* Bedroom
CH1.3 Living room* Bathroom* Living room
Bathroom
DN1.2 Bathroom*
* Observed level only slightly raised – unlikely to result in health issues.
** Likely to be due to increased moisture resulting in bacterial growth.
*** Likely to be indicative of condensation and a lack of good ventilation.
13Study Report SR452 Indoor climate and mould in New Zealand homes
Other spore types were found elevated in several houses (eight in total), notably so in
the bedrooms of home AK4.1 and the living room and bathroom of home CH1.3, in
which Wallemia was observed to be a proportion of these counts. This fungus is a
xerophile but has also been associated with damp building materials. Wallemia is also
regarded as allergenic and may cause infections.
Extraneous particulate levels such as fibres and skin cells were mainly moderate to
high in most of the areas, which is not unusual in a domestic environment, particularly
bedrooms. It may be an indication that there is little ventilation or air movement in
these areas.
The fungal count results found were presented to the homeowners/occupants, and
remedies and mitigation strategies were discussed to help avoid excessive outbreaks in
the future.
Fungal spore counts compared to reference case
Fungal spore counts measured in different rooms of the study houses were compared
with a reference scenario. The reference counts (Figure 7) were obtained from the
Biodet database and show the typical fungal spore count in a non-air conditioned
house without moisture problems.
Figure 7. Average airborne fungal counts based on New Zealand houses without
moisture problems.
The figures below show the ratio of measured fungal spore counts in study houses to
these reference counts. Results are shown for living rooms, bathrooms and bedrooms
(Figure 8, Figure 10, Figure 13 and Figure 15) and bedrooms only (Figure 9, Figure 11,
Figure 14 and Figure 16).
The data described here provides evidence of different scenarios of fungal spore
exposure and conditions in study houses. These scenarios include:
• elevated and concentrated levels in specific rooms of the home – the room type is
important as it affects the level of exposure and risk to occupants
• elevated levels throughout the home (i.e. not contained to specific rooms)
• temperature and humidity that could either foster mould growth or help prevent it.
14Study Report SR452 Indoor climate and mould in New Zealand homes
Houses AK4.1 and AK1.1 had high ratio counts compared to the reference counts. In
these properties, the spore counts in the bedroom were further elevated when
compared to the living area and bathroom.
Bedrooms are considered a high exposure environment, where occupants are likely to
spend most of their time when at home. High spore counts in these areas therefore
may pose greater risk to occupant health than if found in and contained to other areas
of the home.
House AK4.1
Figure 8 and Figure 9 show fungal count ratios to reference counts for house AK4.1,
showing particularly elevated levels in the bedroom.
Figure 8. Fungal count ratios against the reference counts found in the living room
(blue), bathroom (brown) and bedroom (orange) of house AK4.1.
Figure 9. Fungal count ratios against the reference counts measured in the main
bedroom of house AK4.1.
House AK1.1
Figure 10 and Figure 11 show fungal count ratios to reference counts for house AK1.1,
highlighting particularly elevated levels in the main bedroom. The bottom graph in
Figure 12 shows temperature and humidity in the same bedroom.
15Study Report SR452 Indoor climate and mould in New Zealand homes
Figure 10. Fungal count ratios against the reference counts found in the living room
(blue), bathroom (brown) and bedroom (orange) of house AK1.1.
Figure 11. Fungal count ratios against the reference counts measured in the main
bedroom of house AK1.1.
Figure 12 shows the temperature and relative humidity in the main bedroom for house
AK1.1. While the average temperature is only slightly below recommended levels
during the night/early hours of the morning (falling to an average of 17°C), the relative
humidity is consistently quite high at 60–70% throughout the whole day. These
conditions could foster the mould growth observed in this room. In contrast, the living
room average relative humidity was only 52%, which relates to the considerable less
mould found in this room.
Figure 12. Temperature (blue) and relative humidity (orange) in the main bedroom
of house AK1.1.
16Study Report SR452 Indoor climate and mould in New Zealand homes
House DN1.5
House DN1.5 had elevated spore counts compared to the reference house, but these
were not concentrated in the bedroom, unlike houses AK4.1 and AK1.1. Rather, the
ratio of the counts in the bedroom and living area were similar and around 200 times
that of the reference counts. This presents another high-risk/high-exposure
environment for occupants. The high counts in the living area were most likely caused
by a strong moisture event, such as a leak.
Figure 13 and Figure 14 show fungal count ratios to reference counts for house DN1.5,
showing elevated levels in both the bedroom and living area. The high counts in the
living room indicate that there is or has been a water leak or prolonged moisture issue.
Figure 13. Fungal count ratios against the reference counts found in the living room
(blue), bathroom (brown) and bedroom (orange) of house DN1.5.
Figure 14. Fungal count ratios against the reference counts measured in the main
bedroom of house DN1.5.
House DN1.2
House DN1.2 also showed similar ratios of spore counts in the bedroom and living
area, but readings were below 10 (i.e. far less elevated than the other houses shown)
compared to the reference counts (with the exception of other spore types, which is
20). The average indoor climate of this house was warm (24°C) and very dry (with an
average relative humidity of 34%) – very different from conditions in the property with
the elevated spore levels.
17Study Report SR452 Indoor climate and mould in New Zealand homes
Figure 15 and Figure 16 show fungal count ratios to reference counts for house DN1.2
and temperature and humidity in the bedroom. Ratio counts were lower compared to
study houses shown above, and the conditions were warm and dry (Figure 17).
Figure 15. Fungal count ratios against the reference counts found in the living room
(blue), bathroom (brown) and bedroom (orange) of house DN1.2.
Figure 16. Fungal count ratios against the reference counts measured in the main
bedroom of house DN1.2.
Figure 17. Temperature (blue) and relative humidity (orange) in the main bedroom
of house DN1.2.
18Study Report SR452 Indoor climate and mould in New Zealand homes
Extreme spore counts
The two case study examples described below represent the highest and lowest spore
count in the sample of 25 homes from the 2017 study.
4.5.1 Case study 1: Cold and damp
Figure 18 shows the spore count ratios for the main bedroom in property WN3.1.
Error! Reference source not found. shows the average daily climate in that room.
The temperature fell to 13°C at night and the relative humidity reached over 80%,
with an average consistently over 70%. These conditions increase the risk of mould
growth, which aligns with the measured spore counts in this room.
Figure 18. Fungal count ratios of a bedroom in WN3.1 against the reference counts.
Penicillium/Aspergillus type exceeds the reference by a factor of over 800 and the
spore clusters are also very high.
Figure 19. Temperature (blue) and very high relative humidity (orange) in the main
bedroom.
The occupant’s account (through the householder interview) of living conditions in this
property also aligns with the results shown above. The property is a 4-bedroom,
single-storey stand-alone 1950s weatherboard house. The occupants (three adults and
two children) rented from a private landlord and had lived there for about 2 years. This
19Study Report SR452 Indoor climate and mould in New Zealand homes
was the only study participant to respond negatively when asked if they liked living in
their home. This was partly due to space (smaller and more cramped than their
previous home), but also due to the poor state of repair, significant moisture problems,
feeling cold, and difficulty getting their landlord to undertake repairs.
“This is a real cold place in the winter. I think it’s cold because of water. When
it comes, it sits … on the ground [around the house]. I think that could be it.
Because that garage is always wet.” [WN3.1]
“We had really heavy rain. Got up in the morning and the roof was falling
down, and the batts showed through. So they came and just put some tin on
the roof, but they didn’t do anything about the batts. I would have thought
they would have changed them. It was really sagging.” [WN3.1]
“We have that [woodburner] going. We’ve got a heater down the passage. For
a small house, we shouldn’t. But it’s so cold in that end bedroom. And we don’t
use this bedroom in winter. I normally sleep with my mokopuna.” [WN3.1]
The occupant talked of:
• “an indoor pool” in the attached garage due to a major leak
• obvious signs of damp and moisture accumulation around the exterior of the
property (which backs on to a hill)
• a leak in the roof, which resulted in part of the ceiling falling in and insulation
sagging
• draughts around windows and exterior doors
• difficulty maintaining a warm home, despite heating (often for many hours a day)
with a wood burner and an electric heater
• being unable to sleep in one bedroom in winter due to extreme cold
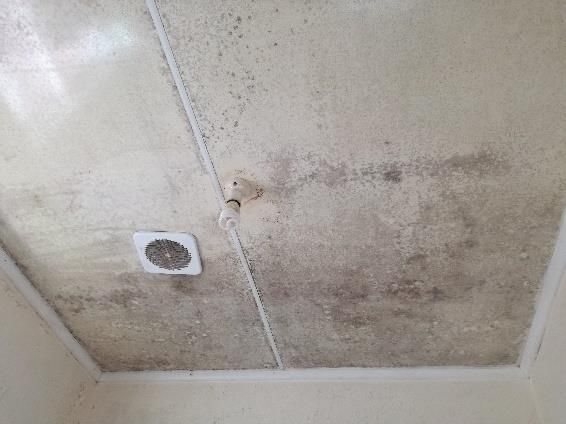
• smell of damp in two bedrooms and visible mould on window frames
• a bathroom “covered in mould” despite attempts to clean it.
Figure 20. Mould on bathroom ceiling in house WN3.1.
This property had no mechanical extract in the kitchen (which was open plan with the
living space). Occupants would not open windows around the house in winter (even
when cooking) due to it being “too cold”. The only rooms with windows open over
winter were the bathroom and laundry. The house did have a whole-house ventilation
system, and the occupant reported using this and noticing some difference
(improvement) in condensation levels when it was on (for example, when cooking).
However, they seemed unsure of how to use it to best effect.
20Study Report SR452 Indoor climate and mould in New Zealand homes
The problems of damp and mould and poor indoor environmental quality observed in
this dwelling seem to stem from a combination of house location/siting (backing on to
dense bush-clad hill, lacking natural light and poor drainage), poor maintenance and
thermal performance (leaks and inadequate insulation) and occupant behaviour (not
feeling able to open windows due to cold).
4.5.2 Case study 2: Warm and dry
The conditions in house WN3.3 were quite different from those described above. The
spore count ratios for the main bedroom in this property were very small and close to
the reference spore count (Figure 21). The indoor climate in this bedroom, shown in
Figure 22, shows that, while the night-time temperature fell slightly below the
recommended 18°C, the average relative humidity remained below 60%. These
conditions help reduce the risk of mould growth in this room.
The householder interview provided further evidence to support the results from the
spore samples. The property is a 1960s semi-detached 2-bedroom, 2-storey house,
owner-occupied with two adult occupants. The property was well maintained, and
occupants reported insulation in the roof space and subfloor and a ground vapour
barrier (although this was not assessed by the researcher so is based on the
occupants’ account only).
The living area is heated with a heat pump, and there is a whole-house ventilation
system, both of which the occupants found very efficient and effective in providing a
comfortable, healthy living environment. Whilst they did not have mechanical extract
ventilation in the kitchen or bathroom, they reported always opening windows when
cooking and would “rarely shut’ the bathroom window, but would keep the door closed
(preventing moisture and cold air escaping to the rest of the house).
“It was really cosy, with the heat pump … It’s very efficient. And because the
place is insulated and everything, it really minimises the amount of heat you
have to use.” [WN3.3]
Based on the above, low spore counts and healthy temperature and humidity levels
observed in this property may be a combination of a number of factors including a
good, well-insulated and well-maintained thermal envelope, efficient and effective use
of heating and ventilation systems and positive occupant behaviour in opening
windows enough to remove moisture without cooling the home to excess.
Figure 21. Fungal count ratios of a bedroom in WN3.3 against the reference counts.
21Study Report SR452 Indoor climate and mould in New Zealand homes
Figure 22. Temperature (blue) and relative humidity (orange) in the main bedroom.
Fungal metabolites
The metabolites of bacteria and fungi were measured to assess the sensitivity of the
method in identifying mycotoxins and therefore the presence of certain fungi in the
home. If successful, this methodology would provide a fast, reliable and cost-effective
way to identify the presence of toxic fungi associated with respiratory health problems.
This project was not designed to answer these questions but to be a pilot and to
establish whether and which metabolites can be identified. A new research project is
under way trying to establish whether there is a link between the presence of certain
metabolites and health outcomes.
The metabolites of fungi and bacteria were measured in the main bedroom by taking a
dust sample from the carpet. This sample was taken by vacuuming 1 m2 of carpet for 2
minutes and collecting the dust into a ‘sock’. This sample was then placed into a
sample container and stored at -40°C until all samples were ready to be sent off to the
analysis lab in Austria. Table 9 shows the full range of metabolites detected across
these samples.
The specificity of the Stachybotrys Satratoxin-G results obtained need to be verified as
only peak intensities were available. This needs to be established with more systematic
research, which is now under way. Stachybotrys was identified in the airborne spore
samples in one home just reaching the detection limit of 7 spores (Table 8).
Satratoxin-G was found in three samples (houses WN2.10, AK1.3 and AK4.1).
Unfortunately, a sample was not available from AK4.3, which showed the Stachybotrys
in the airborne sample, as the participant declined to take part in this aspect of the
study.
22Study Report SR452 Indoor climate and mould in New Zealand homes
Table 9. Mycotoxins identified in at least one of the samples.
Category Metabolites
Sterigmatocystin and biosynthetic precursors Sterigmatocystin Methoxysterigmatocystin Versicolorin C Nidurufin Viridicatol Averantin Averufin Norsolorinic acid
Penicillium metabolites Amoxycillin Penicillin G Andrastin A Chanoclavin Citreohybridinol Agroclavine Festuclavine Flavoglaucin Oxaline Quinolactacin A
Aspegillus metabolites 3-Nitropropionic acid Fumigaclavine Integracin A Integracin B Aspulvinone E Orsellinic acid
Alternaria metabolites Alternariol Alternariolmethylether
Fusarium metabolites Antibiotic Y Aurofusarin Bassianolide Beauvericin Enniatin A Enniatin A1 Enniatin B Enniatin B1 LL-Z 1272e
Stachybotrys? Satratoxin G
Bacterial metabolites Chloramphenicol Nonactin Monactin
Plant toxins Linamarin Lotaustralin Xanthotoxin
lichen Usnic acid
Anthraquinone derivatives - unspecific Chrysophanol Citreorosein Emodin Endocrocin Fallacinol Iso-Rhodoptilometrin Norlichexanthone Physcion Skyrin
Dipeptides - unspecific Brevianamid F cyclo(L-Pro-L-Tyr) cyclo(L-Pro-L-Val)
Others - unspecific N-Benzoyl-Phenylalanine Asperglaucide Asperphenamate Neoechinulin A
23Study Report SR452 Indoor climate and mould in New Zealand homes
Observed mould
In addition to the air and dust sampling, the level of visible mould was assessed in the
main bedroom by the researcher at the time of the interview at the end of the
monitoring period. This assessment was applied to the walls, ceiling, floor, windows
and curtains individually and used an indicator scale from 0 to 3, described as none,
small, moderate or large/extensive (see Shorter et al., 2018 for more details).
The results showed windows were the most common place for mould to be observed,
with 14 out of the 23 homes assessed as having visible mould. Windows were also the
site where the most severe cases of mould were observed (Table 10).3
Table 10. Results from mould assessments in the main bedroom from the 2017
study.
Count of houses with visible mould in the main bedroom
Mould scale Walls Ceiling Floor Windows Curtains
None 20 18 22 9 11
Small 1 4 0 5 6
Moderate 1 0 1 6 3
Large or extensive 1 1 0 3 3
Figure 23 shows the average, minimum and maximum mould index score for each
property assessed. The average was derived from taking the mean of all the mould
index ratings for each of five individual surfaces assessed. For example, a property
with a mould score of 1 for walls, 1 for ceilings, 0 for floors, 2 for windows and 2 for
curtains would equate to an average mould index score of 1.2. The minimum and
maximum show that, within one room, the prevalence of visible mould could range
from none to extensive, depending on the surface. Only six houses had no visible signs
of mould anywhere in the main bedroom.
3
2
Mould index
average
min
1 max
0
Figure 23. Average, minimum and maximum mould index recorded in the main
bedroom of each property in the 2017 study.
3
Mould levels were not assessed in two homes as the interview was conducted off site.
24You can also read