Erasmus+ Programme Statistical factsheets on the achievements of the Erasmus Mundus Joint Master Degrees (2014-2020)

Page created by Sam Stephens
 
CONTINUE READING
Erasmus+ Programme Statistical factsheets on the achievements of the Erasmus Mundus Joint Master Degrees (2014-2020)
Erasmus+ Programme
     Statistical factsheets on the
achievements of the Erasmus Mundus
 Joint Master Degrees (2014-2020)

              European Education
              and Culture
              Executive Agency
Erasmus+ Programme Statistical factsheets on the achievements of the Erasmus Mundus Joint Master Degrees (2014-2020)
More information on the European Union is available on the Internet (http://europa.eu).

Luxembourg : Publications Office of the European Union, 2021

PRINT     ISBN : 978-92-9484-621-1		doi:10.2797/557081		EC-03-21-188-EN-C
PDF       ISBN : 978-92-9484-622-8		 doi:10.2797/639462		 EC-03-21-188-EN-N

© Education, Audiovisual and Culture Executive Agency, 2021

The Commission’s reuse policy is implemented by Commission Decision 2011/833/EU of 12 December
2011 on the reuse of Commission documents (OJ L 330, 14.12.2011, p. 39 – https://eur-lex.europa.eu/eli/
dec/2011/833/oj).

Unless otherwise noted, the reuse of this document is authorised under the Creative Commons Attribution
4.0 International (CC BY 4.0) licence (https://creativecommons.org/licenses/by/4.0/). This means that reuse is
allowed, provided appropriate credit is given and any changes are indicated.

For any use or reproduction of elements that are not owned by the EU, permission may need to be sought
directly from the respective rightholders. The EU does not own the copyright in relation to any images which
do not carry the copyright indicator © European Union.

CREDITS
Cover image : © European Union, 2021 (CC BY-NC-ND 4.0) — image source: iStockphoto.com
Erasmus+ Programme Statistical factsheets on the achievements of the Erasmus Mundus Joint Master Degrees (2014-2020)
Erasmus+ Programme
     Statistical factsheets on the
achievements of the Erasmus Mundus
 Joint Master Degrees (2014-2020)

    As part of the Erasmus+ programme (2014-2020), Erasmus Mundus supports the
    implementation of prestigious, integrated, international Master programmes, jointly
    delivered by international consortia of HEIs. It provides financial support to institutions
    and scholarships to the best candidates worldwide.
Erasmus+ Programme Statistical factsheets on the achievements of the Erasmus Mundus Joint Master Degrees (2014-2020)
TABLE OF CONTENTS

Factsheet 1 : Participation of the Programme Countries Higher         3-6
Education Institutions (HEIs) : Institutional Excellence and
Inclusiveness

Factsheet 2 : Statistical Analysis of Scholarship Holder Mobility    7 - 11
flows - Partner Country Students to Programme Countries

Factsheet 3 : Statistical Analysis of Scholarship Holder Mobility   12 - 17
flows - Programme Country Students to Programme Countries

Factsheet 4 : Statistical Analysis of Scholarship Holder Mobility   18 - 20
flows to Partner Countries

Factsheet 5 : Statistical Analysis of the Main Project Features     21 - 29

Factsheet 6 : Overview of the participating Higher Education        30 - 45
Institutions

                                                                              2
Erasmus+ Programme
                                               Erasmus Mundus Joint
                                               Master Degrees 2014-2020
                                                                          © European Union, 2021 (CC BY-NC-ND 4.0) — image source: iStockphoto.com

                                                                                                          Factsheet 1
        Participation of the Programme Countries Higher Education
       Institutions (HEIs) : Institutional Excellence and Inclusiveness

  This document is part of a series of fact sheets about the achievements of the 250 EMJMDs selected
  under Erasmus+ 2014-2020 :
  Factsheet 1 : Participation of the Programme Countries HEIs (excellence and inclusiveness)
  Factsheet 2 : Partner Country scholarship holders mobility
  Factsheet 3 : Programme Country scholarship holders mobility
  Factsheet 4 : Scholarship holders’ mobility to Partner Countries
  Factsheet 5 : Statistical analysis of the main project features
  Factsheet 6 : Overview of the participating Higher Education Institutions

Since 2014, under the Erasmus+ programme, 369 HEIs from the Programme Countries have participated
as coordinator or as full partner in at least one Erasmus Mundus Joint Master Degree (EMJMD) (see
annex 1).
Taking as a reference both the 2020 Academic Ranking of World Universities (Shanghai Ranking) and
the 2020 Times Higher Education World University Ranking (THE), more than 50% of the 150 top-
ranked European universities are involved in EMJMDs. This confirms the dimension of excellence of
this programme. As an example, 60% of the top-10 European universities and approximately three
quarters of the 50 top-ranked European universities participate in at least one EMJMD project (see
table 1 and annex 2). Compared to a similar analysis carried out in 2018, the situation remains stable.
While the EMJMDs attract the European leading universities, the programme has also a scope of
inclusiveness since it attracts less renowned HEIs. More than 65% of the participating Programme
Country universities are ranked beyond the 500 top universities worldwide (see table 2). Erasmus
Mundus looks more inclusive than in 2018 when 57% of the universities were ranked beyond 500.

                                                European Education
                                                and Culture
                                                Executive Agency                                                                            3
The majority of the leading universities in Europe participate in the
   Erasmus Mundus Joint Master Degrees.
Table 1 : Percentage of leading institutions participating in at least one EMJMD per ranking
category

       Ranking
                                     0-10           11-50            51-75           76-150          151-250           0-150             0-250
    categories for
                                                      *                **              ***             ****             *****            ******
       Europe1
   Shanghai Ranking
                                     60%2             84%              76%              68%             54%              72%              64%
        2020
                                    (6/10)          (32/38)          (16/21)          (48/72)        (57/106) (101/141) (158/247)
   THE Ranking 2020                  60%             77%              62%              49%             55%      59%       57%
                                    (6/10)          (30/39)          (16/26)          (38/78)        (57/104) (90/153) (147/257)
Source : EACEA
Because of ex-aequo cases, the cut-off points vary according to the rankings :
*          Shanghai : 11-48 / THE 11-49		             **        Shanghai : 49-69 / THE 50-75            ***        Shanghai : 70-141 / THE 76-153
****       Shanghai : 142-247 / THE 154-257           *****     Shanghai : 0-141 / THE 0-153            ******     Shanghai : 0-247 /THE 0-257
1 Ranking order at European level (250 best Programme Country institutions according to international rankings)
2 60% of the 10 best universities in Europe were involved in EMJMD according to the Shanghai ranking

   The Erasmus Mundus Joint Master Degrees target a large variety of
   European HEIs.
Table 2 : Breakdown of the European HEIs participating in at least one EMJMD according to their
ranking at worldwide level

       Ranking
                                     0-100             101-200            201-300             301-500             Above 500              Total
     categories3
   Shanghai Ranking
                                       6%4                  8%                 7%                 12%                 66%                100%
        2020
                                        23                  30                 27                  46                 243                 369
   THE Ranking 2020                     5%                  9%                 6%                 12%                 67%                100%
                                        20                  35                 22                  45                 247                 369
Source : EACEA
3 Ranking order at worldwide level according to the two international rankings.
4 according to the Shanghai ranking, 6% of the European universities participating in Erasmus Mundus Joint Degrees are among the 100 first universities
worldwide

                                                                                                                                                          4
ANNEX 1
Number of HEIs involved in EMJMDs 2014-2020, by Programme Country

                   0                           10                  20    30         40        50   60        70

        Austria                                 10
       Belgium                                      11
       Bulgaria            2
        Croatia        1
        Cyprus                 3
        Czechia                        6
      Denmark                              7
        Estonia                3
        Finland                                 9
         France                                                                                         62
      Germany                                                                            44
        Greece                                  10
       Hungary                                  9
        Iceland 0
        Ireland                            8
           Italy                                                                   37
         Latvia        1
   Liechtenstein 0
      Lithuania            2
   Luxembourg 0
         Malta         1
    Netherlands                                          14
North Macedonia 0
        Norway                         6
        Poland                                                16
       Portugal                                                17
       Romania                     5
         Serbia        1
       Slovakia                3
       Slovenia            2
          Spain                                                               35
       Sweden                                       11
         Turkey                        6
            UK                                                          27

                                                                                                                  5
ANNEX 2
50 Top-Ranked European HEIs

Rank     SHANGHAI RANKING (2020)                      Country                  Rank      THE RANKING (2020)                          Country
         HEI                                                                             HEI
1        University of Cambridge                         UK                    1         University of Oxford		                         UK
2        University of Oxford		                          UK                    2         University of Cambridge                        UK
3        Paris-Saclay University                       France                  3         Imperial College London                        UK
4        University College London                       UK                    4         London School of Economics                     UK
5        Imperial College London                         UK                    5         University of Edinburgh                        UK
6        University of Copenhagen                     Denmark                  6         LMU Munich		                                Germany
7        PSL University		                              France                  7         King’s College London                          UK
7        The University of Manchester                    UK                    8         Karolinska Institute                         Sweden
8        Sorbonne University		                         France                  9         Technical University of Munich              Germany
9        The University of Edinburgh                     UK                    10        Heidelberg University                       Germany
10       Karolinska Institute		                        Sweden                  11        KU Leuven		                                 Belgium
11       King's College London                           UK                    12        University of Manchester                       UK
12       University of Munich		                       Germany                  13        Wageningen University & Research           Netherlands
13       Utrecht University		                        Netherlands               14        University of Amsterdam                    Netherlands
14       Technical University of Munich               Germany                  15        Delft University of Technology             Netherlands
15       Heidelberg University                        Germany                  15        Leiden University                          Netherlands
16       University of Oslo                            Norway                  16        Erasmus University Rotterdam               Netherlands
17       University of Bristol                           UK                    17        University of Groningen                    Netherlands
18       University of Paris                           France                  18        Utrecht University                         Netherlands
19       Ghent University		                           Belgium                  19        Charité - Universitätsmedizin Berlin        Germany
20       Aarhus University                            Denmark                  19        Sorbonne University		                        France
20       Stockholm University                          Sweden                  20        University of Tübingen                      Germany
20       University of Groningen                     Netherlands               21        École Polytechnique		                        France
21       University of Helsinki                        Finland                 22        University of Helsinki                       Finland
22       Uppsala University		                          Sweden                  23        Lund University		                            Sweden
23       Erasmus University Rotterdam                Netherlands               24        University of Glasgow                          UK
23       Leiden University                           Netherlands               25        RWTH Aachen University                      Germany
24       University of Bonn                           Germany                  26        University of Copenhagen                    Denmark
25       KU Leuven		                                  Belgium                  27        Uppsala University		                         Sweden
26       Université Grenoble Alpes                     France                  28        University of Bonn                          Germany
27       Aix Marseille University                      France                  29        University of Birmingham                       UK
27       Goethe University Frankfurt                  Germany                  30        Aarhus University                           Denmark
27       Norwegian University of Science and           Norway                  31        University of Sheffield                        UK
         Technology - NTNU                                                     32        University of Southampton                      UK
27       Radboud University Nijmegen                 Netherlands               33        Ghent University		                          Belgium
27       Technical University of Denmark              Denmark                  34        University of Göttingen                     Germany
27       The University of Sheffield                     UK                    35        Maastricht University                      Netherlands
27       Université libre de Bruxelles - ULB          Belgium                  36        Radboud University Nijmegen                Netherlands
27       University of Amsterdam                     Netherlands               37        University of York                             UK
27       University of Birmingham                        UK                    37        University of Paris                          France
27       University of Freiburg                       Germany                  38        University of Oslo                           Norway
27       University of Goettingen                     Germany                  39        Durham University		                            UK
27       University of Gothenburg                      Sweden                  40        University of Vienna		                       Austria
27       University of Leeds		                           UK                    41        Vrije Universiteit Amsterdam               Netherlands
27       University of Liverpool                         UK                    42        Lancaster University		                         UK
27       University of Nottingham                        UK                    43        Ulm University                              Germany
27       University of Southampton                       UK                    44        Pompeu Fabra University                       Spain
27       University of Strasbourg                      France                  45        University of Exeter		                         UK
27       University of Warwick                           UK                    46        University of Sussex		                         UK
27       Vrije Universiteit Amsterdam                Netherlands

1 The ranking order at European level - 48 Programme Country institutions according to the Shanghai list, and the 49 Programme Country institutions
   according to the THE list. In bold, the Programme Country HEIs that are involved in at least one EMJMD project.

                                                                                                                                                       6
Erasmus+ Programme
                                                                          Erasmus Mundus Joint
                                                                          Master Degrees 2014-2020
                                                                                                                     © European Union, 2021 (CC BY-NC-ND 4.0) — image source: iStockphoto.com

                                                                                                                                                     Factsheet 2
                  Statistical Analysis of Scholarship Holder Mobility flows
                    Partner Country Students to Programme Countries
                                   (extract August 2020)

    This document is part of a series of fact sheets about the achievements of the 250 EMJMDs selected
    under Erasmus+ 2014-2020 :
    Factsheet 1 : Participation of the Programme Countries HEIs (excellence and inclusiveness)
    Factsheet 2 : Partner Country scholarship holders mobility
    Factsheet 3 : Programme Country scholarship holders mobility
    Factsheet 4 : Scholarship holders’ mobility to Partner Countries
    Factsheet 5 : Statistical analysis of the main project features
    Factsheet 6 : Overview of the participating Higher Education Institutions

   BACKGROUND
During the programming period 2014-2020, the European Commission selected 250 Erasmus Mundus
Joint Master Degrees (EMJMDs). Each project implements three or four student intakes and the
scholarship holders study in at least two different Programme Countries. This overview looks at two
types of statistics: the actual number of individual Partner Country students concerned (n=6,418),
and their mobility flows (i.e. the number of mobility periods carried out so far by these students)
(n=13,248).
Partner Country1 students represent more than 80% (n=6,418) of all the scholarship holders funded
so far (n=7,718), with the remaining 20% being composed of Programme Country students, who are
the subject of a separate analysis (Factsheet 3). Most of the EMJMD projects selected in the 2014-
2020 programming phase are still going to select students until 2024. Therefore, the figures below
include roughly 60% of the total expected number of Partner Country scholarship holders (12,900) to
be completed for the period 2014-2020.

1 P
   rogramme Countries : for the reference period are considered all 27 EU Member States and Iceland, Liechtenstein, North Macedonia, Norway, Serbia (since 2019), Turkey,
  United Kingdom. Partner Countries are all other countries in the world that are not Programme Countries.

                                                                           European Education
                                                                           and Culture
                                                                           Executive Agency                                                                                            7
MAIN RESULTS

•  The Partner Country scholarships holders are gender balanced, with a small majority of women
    Some 53% of all students are female, 47% are male and the majority of them were born between 1992 and
    1996.
•  Overall, students study equally in the fields of humanities, life sciences and exact sciences
    While one third of the students study social sciences and humanities and another third life sciences (including
    environmental and geo sciences), slightly fewer than a third study exact sciences, including 23% in information
    science & engineering, and 6% in chemistry (Figure 1). There is, however, some diversity among the regions.
    For instance, while in West Asia, North America and European Partner Countries2 & Russia more than 40%
   study Social Sciences & Humanities, the proportion is markedly lower in Other Asian countries3 (24%) and
   Association of Southeast Asian Nations - ASEAN (25%) respectively.

Figure 1 : Study Areas of Partner Country students by region of origin
                                Social Sciences and Humanities (SOC)                          Life Sciences (LIF)                                           Chemistry (CHE)

                                Economic Sciences (ECO)                                       Information Science and Engineering (ENG)

                                Environmental and Geosciences (ENV)                           Mathematics (MAT) and Physics (PHY)

                                                 All regions                    33%                 3%          22%                9%              23%            3% 6%
                                                  West Asia                          46%                            5%     12%         7%             22%          2%5%
                                                    East Asia                 33%                   5%          22%               7%           20%            5% 9%
Association of Southeast Asian Nations (ASEAN)                            25%              4%               29%                   10%             20%          2% 9%
                                  Other Asian Countries                   24%            3%            24%                10%                  31%                3% 5%
                                                     Oceania                     37%                   3%             26%               5%           22%          1% 6%
                                                       Africa                 33%                  4%               24%              11%             20%          2% 6%
                                              North America                         43%                         7%               28%                  10%        8% 2%
                         Latin America and Caribbean                             36%                   3%            23%              8%              23%          2% 4%
            European Partner Countries and Russia                                    44%                       4%        13%       8%             22%            4% 6%

•  Ten countries worldwide represent almost half of all Partner Country scholarship holders
   The EMJMD scholarship holders come from 127 Partner Countries across five continents. The most represented
   region of origin is Latin America and the Caribbean (Figure 2), and the most popular individual nationalities
   are Brazilian, Mexican, Indian and Pakistani (Figure 3). Both trends reflect the top-up budgets allocated to
   geographical areas, the country priorities4 and the population of the countries concerned.

Figure 2 : Origin of the partner Country scholarship                                     Figure 3 : Origin of the scholarship holders per Partner
holders per region (n=6,418)                                                             Country (n=6,418)
                                  Oceania                                                                                          Brazil
                                    1%
                                                                                                                                 7%          Mexico
        Other Asian
         Countries                                        Latin America
                                                                                                                                        6%
                                                                                                                                                    India
                                                               and                                                                           6%
                         22%
                                              26%           Caribbean
                                                                                                                                                5%     Pakistan
   East Asia      4%                                                                        Rest of
                                                                                                               56%                              4%      Bangladesh
                                                                                           the world
                   8%                                5%                                                                                       4%
    West Asia                                               North America                                                                         Colombia
                                                                                                                                             3%
                                                 8%                                                                                        3% United States
                        10%                             European Partner
                                    16%                                                                                                  3% Russian Federation
                                                       Countries and Russia                                                            3% Philippines
               ASEAN
                                                                                                                                         Ethiopia
                                     Africa

2 A lbania, Belarus, Bosnia and Herzegovina, Kosovo* (this designation is without prejudice to positions on status, and is in line with UNSCR 1244 and the ICJ Opinion on the
   Kosovo Declaration of Independence), Moldova, Montenegro, Switzerland, Ukraine.
3 Afghanistan, Bangladesh, Bhutan, India, Kazakhstan, Kyrgyzstan, Mongolia, Nepal, Pakistan, Sri Lanka, Tajikistan, Turkmenistan, Uzbekistan.
4 In particular low and middle-income countries and least developed countries. For reference, please see the Erasmus+ Programme Guide for the respective calls.                 8
•  Four Programme Countries (France, Spain, United Kingdom and Germany) host almost half of all
   mobility flows
   France (17%) is by far the most visited country, followed by Spain (12%), United Kingdom (10%), Germany
   (9%), Italy (8%), Belgium (7%) and Portugal (6%) (Figure 4). So far, Croatia, Cyprus, Iceland, Latvia,
   Liechtenstein, Lithuania, Luxembourg and North Macedonia, did not yet host any student. Moreover, Higher
   Education Institutions (HEIs) from Iceland, Liechtenstein, Luxembourg and North Macedonia are not involved
   in any EMJMD as full partner to date.

Figure 4 : Number of hosted mobility flows per Programme Country (n=13,248)
       2500
                2192

       2000
                    1561

       1500             1305
                            1196
                                 1030 987
       1000                                 859

                                                  501
          500                                           381 362 361 359
                                                                        325 318 286
                                                                                    266 244 219
                                                                                                208
                                                                                                          106 95
                                                                                                                 50 14 10         8   5
            0
                 FR ES UK DE IT BE PT NL SE NO CZ AT PL HU DK EE FI EL IE MT SI TR RO SK BG RS

       Highlyconcentrated
•  Highly    concentrated worldwide
                                 worldwide  mobility  flows flows
                                               mobility
    TheThemost
            most popular
                   popular mobility
                             mobilityflows    come
                                         flows  come fromfrom
                                                            La n Latin
                                                                   America    & Caribbean
                                                                           America          and “Other
                                                                                      & Caribbean     andAsian  countries”
                                                                                                             “Other  Asianincountries”
    in direc on totoFrance
        direction      Franceor orSpain,  andand
                                     Spain,   fromfromAfricaAfrica
                                                               to France,   or “Other
                                                                      to France,        Asian countries”
                                                                                    or “Other              to UK. The
                                                                                                Asian countries”    to top
                                                                                                                       UK. 7The top 7
       Programme     Countries  hos   ng students  from  the   top  4 regions  (see red square  in Table
    Programme Countries hosting students from the top 4 regions (see red square in Table 1) represent    1) represent 50%  of    50%
       all mobility flows.  This result is perhaps  due  to  linguis   c or historical  es with the Programme    Countries.
    of all mobility flows. This result is perhaps due to linguistic or historical ties with the Programme Countries.       At
    Atcountry
        countrylevel, thethe
                  level,   most
                             mostsignificant  flowsflows
                                     significant   are (Table    2): 2) :
                                                          are (Table
    - Brazil to France, Spain and Portugal
    - Mexico to France and Spain
    - India and Pakistan to France

Table 1 : Main mobility flows worldwide by home region to the host Programme Country (n=13,248)

                                                                  Origin of scholarship holders
                                                                                  European
                Latin
                            Other                                                 Partner
   Host         America                                                North
                            Asian       ASEAN            Africa                   Countries   West Asia     East Asia   Oceania       Total
  country       and                                                    America
                            countries                                             and
                Caribbean
                                                                                  Russia
   FR              568          450          210             399          117         164          154         112          18         2192
   ES              481          302          133             230          115         123          109          52          16         1561
   DE              304          251          122             181           68         108           80          72          10         1196
   UK              295          339          114             178           87         121          120          37          14         1305
   BE              274          188          117             161           53          83           57          46          8          987
   PT              265          139           72             178           51          50           63          36          5          859
   IT              247          182           86             189           66         115           92          39          14         1030
   NL              118          101           45              67           41          50           45          23          11         501
   SE              110           74           61              45           31          21           17          17          5          381
   NO               82           65           35              75           21          27           30          22          5          362
   HU               81           65           17              54           22          34           30          12          3          318
   AT               72           71           30              45           33          49           28          27          4          359
  Other            450          485          250             292          169         226          195         108          22         2197
  Total           3347         2712         1292            2094          874        1171         1020         603         135        13248

                                                                                                                                              9
Other               450          485           250            292            169            226             195            108             22       2197
Total              3347         2712          1292           2094            874           1171            1020            603            135      13248

Table 2 : Mobility flows of the top 10 mobility countries (n=13,248)

                                                                 Origin of scholarship holders
    Host                                                   United
                   Brazil        Mexico      India                       Pakistan Bangladesh Colombia             Russia       Philippines China
   country                                                 States
     FR                  159        138           136           79           107            83             72             64         62         69
      ES                 103        111            71           96            74            59             73             49         36         29
      UK                  86         69            63           66            78            65             38             44         38         24
      DE                  82         71            76           48            49            42             51             41         38         51
        IT                76         45            53           50            39            35             36             40         20         23
      BE                  74         61            67           33            44            31             43             27         44         31
      PT                 102         48            35           40            34            30             38             22         24         25
      NL                  25         34            31           30            20            23             21             20         11         14
      SE                  24         25            21           23            14            21             22             10         16         12
      NO                  31         19            19           19            19            14             5              9          6          14

•  Different profiles of hosting Programme Countries
    While the number of students from Partner Countries obviously largely depends on the top-up budget available
    for the regions concerned and the size of the population, the number of mobility flows hosted by the different
    Programme Countries depends upon other parameters, and not only on the number of HEIs involved in the
    projects.

Figure 5 : Instances of HEIs participation as full partners (2014-2020) per Programme Country (n=1,136)

 180 179
             154
 160
 140
 120
                   107
 100                     96

   80
                              66 66 65
   60                                     50 49 48
   40                                                  29 26 25 24
                                                                   22 20 19 18 18
   20                                                                                             9    7    7 7       4    4   2 2    2    1 1
    0
         FR ES IT DE PT UK BE NL SE PL FI NO AT HU CZ DK EL EE IE SI MT RO TR CY SK BG HR LT LV RS

Note : the same institutions appear several times in different projects and these instances are counted separately.

                                                                                                                                                      10
Most HEIs participating in the programme come from France, followed by Spain, Italy, Germany and Portugal
(Figure 5). As previously mentioned, so far, HEIs from Iceland, Liechtenstein, Luxembourg and North Macedonia
are not yet involved as full partners in any EMJMD.
Figure 6 and Figure 6-zoom show the correlation between the mobility flows and the number of participating
HEIs per Programme Country. For example, Spain hosts 12% of the mobility flows whereas it represents 14% of
the HEIs involved (instances of participation).
In summary, three categories of Programme Countries can be identified:
1. H ighly attractive countries in relation to their institutional participation, such as Belgium and the United
    Kingdom.
2. B alanced participation in the sense that the mobility flows reflect the institutional participation of the
    Programme Countries: France, Netherlands, Portugal, Germany, etc.
3. U nderrepresented countries in relation to their institutional participation, such as Spain, Italy, Poland,
    Sweden and Finland.
                                                                                                                     18%

Figure 6 : Correlation between hosting
                                 16%   student mobility and institutional participation in Programme
                                                                                           FR        Countries
                                                          18%
                                                                                                                     14%                                                                                                              FR
                                                                                  Number of student mobility flows

                                                          16%
                                                                                                                     12%                                                                                                                   ES
                                                          14%
                       Number of student mobility flows

                                                                                                                     10%                                                               UK
                                                          12%                                                                                                                                            DE             ES
                                                                                                                            8%                                                                                IT
                                                          10%                                                                                                    UK                BE
                                                                                                                                                                                    PTDE
                                                                                                                            6%
                                                                 8%                                                                                                                         IT
                                                                                                                                                                BE
                                                                                                                            4%                                   PT      NL
                                                                 6%
                                                                                                   CZ NO
                                                                                                     AT                                                                  SE
                                                                                                    HU                                                                   PL
                                                                            2%                 EEDK FI
                                                                 4%                             IEEL
                                                                                                   NL
                                                                                          MT
                                                                                           SI
                                                                                     NO   TR      SE
                                                                            0% CZ    AT
                                                                                      RSSK
                                                                                       BG RO      PL
                                                                 2%               DKHU
                                                                               EE0%
                                                                                IEEL FI       2%          4%                                                                      6%             8%       10%           12%         14%               16%   18%
                                                                          MT
                                                                           SI                                                                                                Institutional Participation of HEIs in EMJMDs
                                                                 0%     SKTR
                                                                       BG
                                                                       RS RO
                                                                    0%        2%           4%          6%                                                                    8%         10%            12%         14%          16%             18%
                                                                                                                                                          Institutional Participation of HEIs in EMJMDs

Figure 6-zoom : Correlation between hosting student mobility and institutional participation in Programme
Countries
                                                                                                                                      3,0%

                                                                           3,0%                                                       2,5%
                                                                                                                                                                                   EE
                                                                                                                                                                                                                   FI
                                                                                                              Instances of Mobility

                                                                           2,5%                                                       2,0%
                                                                                                                                                                                          EL
                                                                                                                                                                                        IE
                                                                                                                                                                EE
                                                                                                                                                                                                  FI
                                                   Instances of Mobility

                                                                           2,0%                                                       1,5%
                                                                                                                                                                        EL
                                                                                                                                                                      IE
                                                                           1,5%                                                       1,0%                 MT
                                                                                                                                                                SI

                                                                           1,0%                                                                            TR
                                                                                                                                      0,5% MT
                                                                                                                                                 SI
                                                                                                                                               RSBGSK      RO
                                                                                                                                             TR
                                                                           0,5%                         0,0%
                                                                                                   RSBGSK    RO
                                                                                                            0,0%                                        0,5%          1,0%         1,5%           2,0%        2,5%           3,0%
                                                                           0,0%                                                                         Institutional Participation of HEIs in EMJMDs
                                                                               0,0%                                                    0,5%        1,0%         1,5%          2,0%          2,5%         3,0%
                                                                                                                                       Institutional Participation of HEIs in EMJMDs

                                                                                                                                                                                                                                                                  11
Erasmus+ Programme
                                                                        Erasmus Mundus Joint
                                                                        Master Degrees 2014-2020
                                                                                                                 © European Union, 2021 (CC BY-NC-ND 4.0) — image source: iStockphoto.com

                                                                                                                                                 Factsheet 3
                 Statistical Analysis of Scholarship Holder Mobility flows
                  Programme Country Students to Programme Countries
                                  (extract August 2020)

    This document is part of a series of fact sheets about the achievements of the 250 EMJMDs selected
    under Erasmus+ 2014-2020 :
    Factsheet 1 : Participation of the Programme Countries HEIs (excellence and inclusiveness)
    Factsheet 2 : Partner Country scholarship holders mobility
    Factsheet 3 : Programme Country scholarship holders mobility
    Factsheet 4 : Scholarship holders’ mobility to Partner Countries
    Factsheet 5 : Statistical analysis of the main project features
    Factsheet 6 : Overview of the participating Higher Education Institutions

   BACKGROUND
During the programming period 2014-2020, the European Commission selected 250 Erasmus Mundus
Joint Master Degrees (EMJMDs). Each project implements three or four student intakes and the
scholarship holders study in at least two different Programme Countries1. This overview looks at two
types of statistics: the actual number of individual Programme Country scholarship holders concerned
(n=1,3002); and their study periods (i.e. the number of study periods carried out so far by these
scholarship holders) (n=3,346). Among these 3,346 study periods, 2,825 (84%) of them correspond to
a mobility flow to a Programme Country different from the country of residence.
Programme Country scholarship holders represent 18% (n=1,300) of all the scholarship holders
funded so far (n=7,718), with the remaining 82% being the Partner Country scholarship holders who
are the subject of a separate analysis (Factsheet 2). Most of the EMJMD projects selected in the 2014-
2020 programming phase are still going to select scholarship holders until 2024. The figures below
represent therefore roughly 50% of the total expected number of Partner Country scholarship holders
(2,473) to be completed for the period 2014-2020.
1 Programme
              Countries : for the reference period are considered all 27 EU Member States and Iceland, Liechtenstein, North Macedonia, Norway, Serbia (since 2019),
   Turkey, United Kingdom. Partner Countries are all other countries in the world that are not Programme Countries.
2 This number includes 191 Partner Country students resident in a Programme Country. The number of Programme Country nationals amounts to 1109.
                                                                         European Education
                                                                         and Culture
                                                                         Executive Agency                                                                                        12
MAIN RESULTS

•  The Pogramme Country scholarships holders are gender balanced, with a small majority of women
    Some 55% of all scholarship holders are female, 45% are male and the majority of them were born between
    1992 and 1997.
•  Overall, most Programme Country scholarship holders study in the field of humanities
   While 40% of the scholarship holders study Humanities (Social Sciences and Humanities, and Economic
   Sciences) the rest is equally divided (30% each) between Life Sciences (Environmental and Geosciences, Life
   Sciences) and Exact Sciences (Information Science and Engineering, Chemistry, Mathematics and Physics)
   (Figure 1).

Figure 1 : Study areas of Programme Country scholarship holders

                                               Mathematics Chemistry
                                                (MAT) and      (CHE)
                                               Physics (PHY)
                                                                 7%                                Social Sciences
                                                             4%
                                                                                                   and Humanities
                                 Information
                                                                                                        (SOC)
                                 Science and                                            36%
                                 Engineering          19%
                                     (ENG)

                                                           10%
                                    Life Sciences                                       4%
                                         (LIF)                           20%                  Economic
                                                                                            Sciences (ECO)
                                                                  Environmental and
                                                                  Geosciences (ENV)

•  Over half of all Programme Country scholarship holders originate from five Programme Countries
   The EMJMD scholarship holders come from 31 Programme Countries out of 34. The most popular countries
   of origin are Spain (16%), Germany (12%), Italy (10%), United Kingdom (7%) and France (7%) (Figure 2). No
   scholarship holders came yet from Malta (which is, however, involved in five projects as full partner), Iceland
   and Liechtenstein3.

Figure 2 : Origin of the Programme Country scholarship holders per nationality4
               180 173
                   160
                   140       129
                   120           112
                   100
                                       83 77
                     80
                                               60 58 55
                     60
                                                          44 38
                     40                                           31 27 27
                                                                           23 23 19 17 16
                     20                                                                   15 12
                                                                                                11 11 9 9 7 7
                                                                                                              5 4 3 2 2
                       0
                                        Cr onia
                                          Fra om
                                Un rma in
                                     d K It ny
                                         ing aly

                                          Tu nce
                                         Gr key
                                  Ne Po ece
                                        er nd

                                       Ro rtug s
                                          m al
                                           n a
                                 No B rela ry
                                   rth el nd
                                          ced m

                                          Se tia
                                      Lit stonia
                                         hu ia
                                          La nia
                                         Au tvia
                                           lg a
                                        Cz aria
                                        Sw chia
                                        Fin den
                                                 d
                                                 a
                                          nm ia
                                  Lu C ark
                                        mb rus
                                        No ourg
                                                ay
                                       Po land

                                       Slo lan
                                       Hu ani

                                       Bu stri

                                       Slovaki
                                      Ge Spa

                                        E rb

                                      De en
                                         I ga
                                       Ma giu

                                            rw
                                      th la

                                            oa
                                              d

                                             a

                                     xe yp
                                              r
                                             e

                                            e
                                            e

                                            v
                                  ite

                              of
                         blic
                       pu
                     Re

3 These Programme Countries, together with Luxembourg and North Macedonia, are also not represented in any EMJMD project.
4 Programme Country students with a Partner Country nationality are not displayed in this figure.                            13
•  Five Programme Countries (Spain, Germany, Italy, United Kingdom and France) host more than half
             of all study periods
             France (15%) is the most visited country, followed by Spain (12%), Italy (9%), Germany (8%), United Kingdom
             (8%), Belgium (7%) and Portugal (6%) (Figure 3). Whereas they are at least involved in one EMJMD as full
             partner, Croatian, Cypriot, Latvian, Lithuanian, Romanian and Slovak HEIs did not yet host any scholarship
             holder. On the other hand, higher education institutions (HEIs) from Iceland, Liechtenstein, Luxembourg and
             North Macedonia are not involved in any EMJMDs as full partner to date and therefore also did not host any
             scholarship holder.
n the other hand, higher educa�on ins�tu�ons (HEIs) from Iceland, Liechtenstein,
 Macedonia
       Figureare  not involved
              3 : Number       in any
                         of hosted    EMJMDs
                                   study periods as
                                                 perfull partnersCountry
                                                     Programme    to date(n=3,346)*
                                                                          and therefore
holarship holder. 500   486

                                    395
e 3: Number of hosted
                  400 study periods per Programme Country (n=3,346)*

                                          301
                          300                                    283 280
                                                                           230
                                                                                 212
                          200
                                                                                       140 135
                                                                                                 119
                                                                                                       102 99 94
  280                     100                                                                                       75 75 74 70
                                                                                                                                       55 44
        230 212                                                                                                                              38
                                                                                                                                                   23 10
                                                                                                                                                           4   2
                         0
                    140 135
                                      Sp e
                                           ain
                           Un Ger aly
                                    ing y

                                  P ium
                                   erl l
                                    Au ds
                                   Sw tria
                                   Es en
                                   Fin ia
                                     Po d
                                  Hu land
                                   No ry
                                   Cz ay
                                   G hia

                                                                                                                               De land

                                                                                                                                   Ma k
                                                                                                                               Slo lta

                                                                                                                                  Tu ia
                                                                                                                                  Se y
                                                                                                                                Bu bia
                                                                                                                                       ria
                                  Be om

                                                                                                                                 Ire ce
                            119 102
                                 th ga

                                                                                                                                      ar
                                d K an

                                                                                                                                     rke
                                          nc

                                        lan
                                           n

                                                                                                                                       n
                                           a
                                       an

                                       rw
                                       ed

                                                                                                                            ree

                                                                                                                                   lga
                                    99
                                          t

                                       to

                                                                                                                                    ve

                                                                                                                                     r
                                       ec
                                        d

                             Ne ortu

                                                                                                                                  nm
                                                                           94
                                      ng
                                        s
                                     Fra

                             ite m

                                      lg
                                        I

                                                                                  75     75      74      70   55     44   38      23     10    4
                                                                                                                                     2 of residence have the same
         * These figures include nationals studying in their country of residence. Figures excluding nationals studying in their country
            patterns.

         Figure 4 shows the correlation between the percentage of scholarship holders per nationality and the share of
         hosted study periods per country. For example, France hosts almost 15% of the study periods whereas less than
         7% of all scholarship holders are French.
         In summary, three categories of Programme Countries can be identified :
nationals studying in their country of residence. Figures excluding nationals studying in their countr y of
          1. “ Net scholarship holders exporting” countries, such as Spain and Germany, who send more nationals than
 patterns.
           they host study periods.
orrela�on    between distribution
        2. Balanced    the          : United Kingdom and Netherlands.
olarship3. “holders   per holdersFigure
             Net scholarship                  4: Correla�on
                                        importing”  countries,between    percentage
                                                               such as France and Portugal, who host more study periods
           than  they
share of hosted study send nationals. of scholarship  holders   per na�onality  and
r example, France hosts                the share of hosted study periods per
dy periods  whereas    less 5                         country holders per nationality and the share of hosted study
       Figure 4 : Correlation between percentage of scholarship
       periods per country
ip holders are French.             17%

                                                                 15%
 tegories of Programme                                                                           FR
fied:                                                             13%
                                          Hosted Study Periods

  countries, such as Spain                                                                                                              ES
nals than they host study                                        11%

                                                                  9%                                          IT
om and Netherlands.                                                                                UK                DE
ng” countries, such as                                            7%
 study periods than they                                                        PT
                                                                  5%
                                                                                  NE
                                                                  3%
                                                                       3%         5%       7%          9%     11%     13%      15%       17%
dy periods are highly                             Student Nationality
e Programme Countries
 e Countries     hostabove
        5 Only countries more
                           3% are displayed.
                                                                                                                                                                    14
 eriods (Table 1). The most popular mobility flows come from Spain, Germany, Italy
•  The location of study periods are highly concentrated within the Programme Countries
   The top 10 Programme Countries host more than 75% of all study periods (Table 1). The most popular
   mobility flows come from Spain, Germany, Italy and the United Kingdom in direction to France, Spain, Italy and
   Germany. Patterns are very similar when excluding scholarship holders studying in their country of residence.
   In that respect, for some countries, the number of nationals studying in their country of residence is among
   the highest number of hosted study periods, as in the case of French students studying in French (Table 1). In
   these cases, it is noteworthy that according to the programme rules, scholarship holders do not receive the
   scholarship when they study in their home country.
                       Table 1: Loca�on of the study periods of scholarship holders origina�ng from the top 10 Programme
Table 1 : LocationCountries
                    of the(n=3,346)
                            study periods of scholarship holders originating from the top 10 Programme Countries
(n=3,346)                                           Origin of scholarship holders
                      Host                                                                                                                                                                                                                                                                                                           Total
                                     ES                    DE                           IT                          UK                       FR                      RS                                PL                         EL                     NL                       PT                     Other
                     country
                       FR             90                    44                          46                          32                       66                       34                               28                         14                     11                       16                       105                        486
                       ES            105                    26                          43                          39                       27                       29                               12                         19                       8                      14                       73                         395
                       IT             46                    31                          68                            8                      33                       24                               12                         11                     11                       11                       46                         301
                      DE              17                    74                          23                          24                       12                       23                               13                         13                     21                         5                      58                         283
                      UK              37                    30                          26                          45                       11                       21                               14                         19                       3                      10                       64                         280
                      BE              29                    18                          14                          18                       25                       13                                 7                        14                     15                         8                      69                         230
                       PT             35                    22                          35                          10                       12                       15                                 6                        9                        5                      23                       40                         212
                       NL                 9                 26                          14                          11                         5                      10                                 2                        2                      25                         4                      32                         140
                       AT                 5                 20                          12                          11                         6                          2                            11                         4                      13                         4                      47                         135
                       SE             17                    13                          7                             8                      11                       12                                 2                        4                        3                        1                      41                         119
                       EE                 1                   9                         4                           20                         3                      18                                 3                        3                        4                        4                      33                         102
                       FI             14                      6                         12                          11                         6                          8                              5                        1                        4                        2                      30                         99
                       PL             14                    13                          7                             2                      11                           7                            15                         1                        3                        2                      19                         94
                      HU                  4                   4                         2                             8                        7                          8                              2                        1                                                 4                      35                         75
                      NO              14                    13                          8                             7                        4                          7                              2                        1                        3                                               16                         75
                       CZ                 5                 15                          4                             8                        5                          3                              1                        2                        3                        3                      25                         74
                       EL                 8                   3                         6                           18                         1                          1                                                       12                                                5                      16                         70
                       IE                 2                   7                         3                             6                        4                          3                              1                        3                        1                        3                      22                         55
                      DK                  4                   9                         3                             1                        1                          3                              2                        2                        2                        1                      16                         44
                      MT                  4                   2                         4                           10                         2                          3                              3                        7                        1                                                2                         38
                       SI                 2                                             8                             2                                                   4                              2                                                                          2                       3                         23
                       TR                                     3                                                       2                        1                                                                                                                                                            4                         10
                      RS                                                                2                             1                                                   1                                                                                                                                 0                          4
                      BG                                                                                              1                                                                                                                                                                                     1                          2
                     Total           462                   388                      351                            303                       253                     249                              143                     142                       136                      122                        797                      3346

                       Different profiles of hos�ng Programme Countries
•  Different profiles   of hosting
                 The number                Programme
                              of par�cipa�ng                  Countries
                                              scholarship holders  from Programme Countries depends largely upon the size
                 of the popula�on  and  the number  of HEIs
    The number of participating scholarship holders from    involved  in the projects.
                                                                             Programme An overview of the la�er
                                                                                              Countries         is presented
                                                                                                             depends         in
                                                                                                                          largely upon the size
                 Figure 5.
    of the population and the number of HEIs involved in the projects. An overview of the latter is presented in
    Figure 5.                 Figure 5: Instances of HEIs par�cipa�on as full partners (2014-2020) per Programme
                                                                                                                                                                 Country
Figure 5 : Instances of HEIs participation as full partners (2014-2020) per Programme Country (n=1,136)
                  200 176                 155
                        150                       108 95
                        100                                         67 66 66
                                                                                                    51 49 47
    180 179                 50                                                                                                     30 27 25 24 22 20 18 18 18
                                                                                                                                                              8                                                                               7        7        7        4         4          2         2         2          1        1
                            0
              154
                                                                    United…

    160
                                 France

                                                                                                                                                      Austria

                                                                                                                                                                                                                                                                                                                                     Serbia
                                                                                                                                                                                           Denmark

                                                                                                                                                                                                               Greece
                                          Spain
                                                  Italy

                                                                                                   Netherlands
                                                          Germany

                                                                                                                                   Finland

                                                                                                                                                                Hungary

                                                                                                                                                                                                                                                               Turkey
                                                                              Belgium

                                                                                                                                                                                                                        Ireland

                                                                                                                                                                                                                                                     Romania
                                                                                                                 Sweden
                                                                                                                          Poland

                                                                                                                                             Norway

                                                                                                                                                                          Czech Republic
                                                                                        Portugal

                                                                                                                                                                                                     Estonia

                                                                                                                                                                                                                                  Slovenia
                                                                                                                                                                                                                                             Malta

                                                                                                                                                                                                                                                                        Cyprus

                                                                                                                                                                                                                                                                                            Bulgaria

                                                                                                                                                                                                                                                                                                                            Latvia
                                                                                                                                                                                                                                                                                 Slovakia

                                                                                                                                                                                                                                                                                                                Lithuania
                                                                                                                                                                                                                                                                                                       Croa�a

    140
    120                Note: the same institutions appear several times in different projects and these instances are counted
                    107separately.
    100                  96
                                                                                                                                                                 4
      80
                                 66 66 65
      60                                                            50 49 48
      40                                                                                                     29 26 25 24
                                                                                                                         22 20 19 18 18
      20                                                                                                                                                                                                                                 9           7           7 7                        4           4             2 2                     2   1 1
       0
           FR ES IT DE PT UK BE NL SE PL FI NO AT HU CZ DK EL EE IE SI MT RO TR CY SK BG HR LT LV RS
Note : the same institutions appear several times in different projects and these instances are counted separately.
                                                                                                                                                                                                                                                                                                                                                        15
EIs par�cipa�ng in the programme come from France, Spain, Germany and the United Kingdom. As
usly men�oned,
          Most so    far,participating
                  HEIs    HEIs from Iceland, Liechtenstein,
                                         in the programme   Luxembourg and France,
                                                               come from   North Macedonia  are not
                                                                                   Spain, Italy  and Germany. As previously mentioned,
olved as full partners in any EMJMD.
          so far, HEIs from Iceland, Liechtenstein, Luxembourg and North Macedonia are not yet involved as full partners
                  in 18%
                      any EMJMD.
                                  16%              Most HEIs par�cipa�ng in the programme come from France, Spain, Germany and the United Kingdom. As
                                                   previously men�oned, so far, HEIs from Iceland, Liechtenstein, Luxembourg and North Macedonia are not
                  Figure
                    14%
                         6:                    Correlation   between
                                                   yet involved           hosted
                                                                as full partners     study
                                                                                 in any     periods andFRinstitutional participation in Programme
                                                                                        EMJMD.                                                                                                   Countries
                                                                                                  18%

                                  12%                                                                                                ES
                                                                                                  16%
           Hosted Study Periods

                                  10%                                                                                                                                                  FR
                                                                                                  14%
                                                                                                                                IT
                                                                          UK                                               DE
                                  8%                                                              12%                                                                             ES
                                                                           Hosted Study Periods

                                                                         BE
                                  6%                                      PT
                                                                                                  10%
                                                                                                                                                                             IT
                                                                  NL                                                                      UK                            DE
                                  4%                   AT                                         8%
                                                                  SE
                                                    EE FI         PL                                                                 BE
                                                        HU
                                                       CZNO                                       6%                                  PT
                                  2%            RO EL
                                                     IE
                                                MT DK
                                                 SI                                                         NL
                                                                                                     AT
                                              SKTR
                                             RS
                                             BG                                                   4%
                                  0%                                                                        SE
                                        0%        2%         4%        6%       8%         10%  EE    FI
                                                                                                      12% PL14%                                16%                      18%
                                                                                2%          RO    ELHU
                                                                                                   CZNO
                                                               Institutional Participation  of HEIs
                                                                                                 IE in EMJMDs
                                                                                            MT DK
                                                                                             SI
                                                                                         RS TR
 6 and Figure 6-zoom show                                   the correla�on 0%            BG
                                                                                          SK
                                                                                  8% 0%     10%2%     12%4%    6%
                                                                                                             14% 16% 18%
en the hosted study periods and the number
                                                                 Institutional Participation of HEIs in EMJMDs
�cipa�ng HEIs per Programme Country. For
 e, Spain hosts some 12%       of 6the
                           Figure   and study
                                         Figure  6-zoomhosted
                                                        show the   correla�on
  whereasFigure    6-zoom
            it represents   : Correlation
                          almost
                           between14%
                                    theof
                                            between
                                           the
                                        hosted
                                                                study      periods and institutional participation in Programme Countries
                                                study periods and the number
volved (instances of par�cipa�on).
                           of par�cipa�ng HEIs per5%Programme Country. For
                                                       example, Spain hosts some 12% of the study
mmary, three categoriesperiodsof Programme
                                    whereas it represents
                                                     4%     almost 14% of the
 es can be iden�fied:       HEIs involved (instances of par�cipa�on).                        5%
                                                                                                    Hosted Study Periods

1. Somewhat more a�rac�ve countries in
    rela�on      to        In summary,
                        their               three categories
                                  ins�tu�onal        3%           of Programme               FI
                                                                                            4%
                           Countries  can
    par�cipa�on, such as United Kingdom,  be iden�fied:
                                                                                                                                                 Hosted Study Periods

    Austria and Belgium.          1. Somewhat more   2%
                                                         a�rac�ve countriesELin
                                                                    RO                      3%
                                      rela�on      to     their        ins�tu�onal                                                   FI
2. Balanced par�cipa�on in the sense that
                                      par�cipa�on, such as United Kingdom,
    the hosted study periods reflect the                             MT
                                      Austria and Belgium.
                                                     1%                                     2%              RO            EL
    ins�tu�onal     par�cipa�on 2. of       the
                                      Balanced par�cipa�on in theSI sense that
    Programme        Countries:      Germany,
                                      the hosted study periods      TR reflect the
                                                                                                            MT
                                                     0%     RSBG
                                                               SK                           1%
    Netherlands, Portugal, etc.       ins�tu�onal     par�cipa�on
                                                        0%          1% of        the
                                                                                 2%           3%           4%SI          5%
3. Somewhat underrepresented countriesProgramme        Countries:         Germany,                          TR
                                                                 Institutional Participation0%
                                                                                             of HEIsRSin EMJMDs
    in rela�on to their ins�tu�onal   Netherlands, Portugal, etc.                                     BG
                                                                                                       SK
                                                                                                0%          1%           2%           3%          4%                                        5%
    par�cipa�on, such as France,         Spain, underrepresented countries
                                  3. Somewhat
                                                                                                         Institutional Participation of HEIs in EMJMDs
    Poland,Figure
            etc. 6 and Figure in           rela�on to their ins�tu�onal
                                       6-zoom     show the correlation between the hosted study periods and         the number of
                                   par�cipa�on, such as France, Spain,
           participating HEIs per Poland,
                                   Programme      Country. For  example,  Spain   hosts some
                                          etc.between the percentage of scholarship holders per 12% of the study periods whereas it
 7 and Figure 7-zoom show the correla�on
           represents  almost  14%    of the   HEIs involved (instances  of participation).
ality and ins�tu�onal par�cipa�on in Programme Countries. For example, while France represents
                                                       Figure 7 and Figure 7-zoom show the correla�on between the percentage of scholarship holders per
                  In summary, three   categories
                                na�onality           of Programme
                                           and ins�tu�onal par�cipa�on inCountries
                                                                          Programme can be identified
                                                                                    Countries.           : while France represents
                                                                                               For example,
                  1. Somewhat more attractive    5
                                                           countries in relation to their institutional participation, such as United
                      Kingdom, Austria and Belgium.
                                                                                5
                  2. B alanced participation in the sense that the hosted study periods reflect the institutional participation
                      of the Programme Countries: Germany, Netherlands, Portugal, etc.
                  3. S omewhat underrepresented countries in relation to their institutional participation, such as France,
                      Spain, Poland, etc.

                                                                                                                                                                                                             16
Figure 7 and Figure 7-zoom show the correlation between the percentage of scholarship holders per nationality
                       and institutional participation in Programme Countries. For example, while France represents 16% of the HEIs
                       involved (instances of participation), French students only represent 7% of all Programme country scholarship
                       holders.

     In summary, three categories of Programme Countries can be identified :
     1. Countries with a high student representation in relation to their institutional participation like
            Greece, Germany, Spain, Turkey and United Kingdom.
16% of2.theCHEIs involved with
             ountries      (instances of p
                                  a balancepastudent
                                              on), Frenchrepresentation
                                                          students only represent 7% of all Programme
                                                                              in relation    to their institutional participation: Italy,
country scholarship holders.
           Poland, Netherlands, etc.
     3. C
     18%    ountries with a low student representation in relation to their institutional participation like
           France, Belgium, Sweden, Portugal, etc.
                       16%
                                                                                            ES (instances of p
                                                                      16% of the HEIs involved                                                                                 pa on), French students only represent 7% of all Programme
                                                                      country scholarship holders.
                       Figure
                       14%    7 : Correlation between percentage of scholarship holders per nationality and institutional participation
                       in Programme Countries           18%
                       12%
                                                                         DE
  Student Natonality

                                                                                             16%
                       10%                                                                   IT                                                                                                                      ES

                                                                                             14%
                       8%
                                                            UK
                                                                                             12%                                                     FR
                                                                                                                                                                               DE
                       6%
                                                                        Student Natonality

                                TR   EL                                                      10%                                                                                    IT
                                                  PL
                       4%                         NL
                                                            PT                                8%
                                RO                                                                                                                         UK
                                    IE HU                                                                                                                                                                                          FR
                       2%       MT                      BE
                             CR
                             RS    EE
                             LI
                             LV                                                               6%
                              BG      CZATFI      SE                                                                        TR
                              SK
                             SL                                                                                                   EL
                       0%    CY SI DKNO
                             LU                                                                                                                PL
                          0%      2%         4%        6%        8%              10%4%                       12%                  14%           NL
                                                                                                                                              16%         PT
                                                                                                                                                               18%
                                                                                       RO
                                          Institutional Participation of HEIs in EMJMDsMT
                                                                                           IE HU
                                                                                                                                                          BE
                                                                             2%     CR
                                                                                    RS
                                                                                    LI    EE
                                                                                    LV
                                                                                     BG      CZATFI                                            SE
                                                                                     SK
                                                                                    SL
                                                                             0%     CY SI DKNO
                                                                                    LU
                                                                                 0%      2%         4%                                               6%              8%         10%            12%                 14%       16%         18%
In summary, three categories of Programme Countries can be iden           d:
      1. Countries with a high student representa on in rel Institutional    Participation of HEIs in EMJMDs
                                                                     on to their    in u onal p              p on like
         Greece,
      Figure      Germany,
                7-zoom       Spain, Turkey and
                          : Correlation         United Kingdom.
                                            between        percentage of scholarship holders per nationality and institutional
      2. Countries with
      participation    in aProgramme
                            balance student   representa on in
                                          Countries                      on to their in             onal p     pa on:
         Italy, Poland, Netherlands, etc. In summary, three categories of Programme Countries can be iden d:
      3. Countries with a low student 1. Countries        5%     with a high student representa on in rel on to their in u onal p           p on like
         representa on in rela on to their           Greece, Germany, Spain, Turkey and United Kingdom.
         in       onal p     pa on like France, 2. Countries
                                                          4%     with a balance student representa on in              on to their in onal p   pa on:
         Belgium, Sweden, Portugal, etc.             Italy, Poland, Netherlands, etc.
                                                                                                       Student Natonality

                                                                                             3. Countries with a low student                                                                                  5%
                                                                                                    3%
                                                                                                representa on RO
                                                                                                              in rela on to their
                                                                                                in     onal p    pa on IE
                                                                                                                       like HU
                                                                                                                            France,                                                                           4%
                                                                                                Belgium,
                                                                                                    2% Sweden,MTPortugal, etc.
                                                                                                                                                                                         Student Natonality

                                                                                                                                      CR
                                                                                                                                       RS                 EE                                                  3%
                                                                                                                                      LI                                                                                    RO
                                                                                                                            1%        LVBG                                AT                                                             IE        HU
                                                                                                                                                                 CZ                                                SE
                                                                                                                                         SK                                    FI                             2%            MT
                                                                                                                                      SL                        DK
                                                                                                                                      CY
                                                                                                                                      LU      SI                          NO           CR
                                                                                                                            0%                                                          RS                                              EE
                                                                                                                                                                                       LI
                                                                                                                                 0%          1%         2%          3%          4%
                                                                                                                                                                                 1%    LVBG
                                                                                                                                                                                          5%                                                        AT
                                                                                                                                                                                                                                              CZ                        SE
                                                                                                                                        Institutional Participation of HEIs in EMJMDs SL SK                                                                  FI
                                                                                                                                                                                       CY                                                     DK
                                                                                                                                                                                       LU     SI                                                        NO
                                                                                                                                                                                 0%
                                                                                                                                                                                    0%       1%                                          2%                  3%   4%         5%
                                                                                                                                                                                                                        Institutional Participation of HEIs in EMJMDs

                                                                                                                                                                                                                                                                                  17
                                                                                                   6
Erasmus+ Programme
                                                                          Erasmus Mundus Joint
                                                                          Master Degrees 2014-2020
                                                                                                                     © European Union, 2021 (CC BY-NC-ND 4.0) — image source: iStockphoto.com

                                                                                                                                                     Factsheet 4
                  Statistical Analysis of Scholarship Holder Mobility flows
                                    to Partner Countries
                                   (extract August 2020)

    This document is part of a series of fact sheets about the achievements of the 250 EMJMDs selected
    under Erasmus+ 2014-2020 :
    Factsheet 1 : Participation of the Programme Countries HEIs (excellence and inclusiveness)
    Factsheet 2 : Partner Country scholarship holders mobility
    Factsheet 3 : Programme Country scholarship holders mobility
    Factsheet 4 : Scholarship holders’ mobility to Partner Countries
    Factsheet 5 : Statistical analysis of the main project features
    Factsheet 6 : Overview of the participating Higher Education Institutions

   BACKGROUND
During the programming period 2014-2020, the European Commission selected 250 Erasmus
Mundus Joint Master Degrees (EMJMDs). Each project implements three or four student intakes and
the scholarship holders study in at least two different Programme Countries1. It is also possible for
scholarship holders to spend a limited time of their study period in a Partner Country in order to study,
carry out research or take part in an internship. Partner Country scholarship holders can receive the
scholarship when being in a Partner Country for a maximum of 3 months. It is however possible to
exceed this maximum without scholarship payment.
Until now, out of a total of 7,718 students who benefitted from an Erasmus Mundus scholarship, 263
students have made use of the possibility to study in a Partner Country representing all together 455
mobility flows. This represents 3.4% of the total number of scholarship holders and less than 3% of
the total number of mobility flows organised so far under the EMJMDs.
Partner Country and Programme Country scholarship holders studying in a Programme country are the
subject of a separate analysis (respectively Factsheets 2 and 3).
1 P
   rogramme Countries : for the reference period are considered all 27 EU Member States and Iceland, Liechtenstein, North Macedonia, Norway, Serbia (since 2019), Turkey,
  United Kingdom. Partner Countries are all other countries in the world that are not Programme Countries.
                                                                           European Education
                                                                           and Culture
                                                                           Executive Agency                                                                                          18
MAIN RESULTS

•  Almost 80% of all scholarship holders who spent a mobility period in a Partner Country originate
   from Partner Countries reflecting the composition of the overall population of the scholarship
   holders
    Indeed, overall, Partner Country students represent 82% of all the scholarship holders funded so far under
    Erasmus Mundus (n=7,718).

Figure 1 : Nationality of Programme Country and Part-                         Figure 2 : Mobility flows according to their duration in
ner Country scholarship holders who went in mobility                          months (n=455)
to a Partner Country (n=263)
                                                                                                     8-12
                                       Brazil                                                       months              1-2
                                      7%         Mexico                                                                months
                                           5%       Spain
                                                 4%                                                     10%
                                                                                                                18%
                                                      Pakistan
                                                  4%
   Others                                          4% Colombia
  Countries                                                                              6-7      24%
                   60%                             4% France
                                                                                        months
                                                   3%
                                                       Ukraine
                                                  3%
                                                 3% Germany                                                   48%
                                                3% India
                                                  Ecuador
                                                                                                                       3-5
                                                                                                                      months

•  Almost one quarter of all these scholarship holders come from five countries worldwide
    (Figure 1)
    The EMJMD scholarship holders that go for a mobility period to a Partner Country come from 72 different
    countries. Scholarship holders from Brazil (7%) and Mexico (5%) were the most represented out of the 263
    students.
•  The scholarships holders going to Partner Countries are gender balanced
    Some 52% of all scholarship holders are female (48% male) which is in line with the patterns of the overall
    scholarship holder population.
•  Half of the mobility flows to Partner Countries lasted between 3 and 5 months (Figure 2)
    Both Programme Country and Partner Country scholarship holders are eligible to study in a Partner Country
    different from their home country. The Partner Country scholarship holders, however, can receive the
    scholarship only for a maximum of 3 months when on mobility in a Partner Country. This explains why most
    mobility durations were 3 months long.

Figure 3 : Destination of Programme Country and Partner Country scholarship holders in mobility to a Partner
country (n=455)
              70 68
              60
              50      46
              40
                           31
              30
                                23 22 22 21 21
                                                 20 19 19 18
              20                                               16 15 14
                                                                          12 11 10 10
              10                                                                        8
                                                                                            6 4
                                                                                                3 2 2 2 2 2 1 1 1 1 1 1
               0
                                  Ca ates
                               MaJapaa
                       ssi lays n
                           an Me ia
                               Au eratioo
                                    str n
                                   Tu alia
                                  i L ia
                             Ho Egnka

                                     r g
                           So ocoo

                         le's fric l
                              Re Is a
                            Sw pub rael
                                    e f)
                                     n d
                               Viegandal
                                    t a
                                Th Nam
                                    ug d
                              Ar Ind y
                                  ge ia
                                      Ch a
                            Ky o ile
                             Se gyzs ia
                               Co hell n
                              Indlom s
                                         bia
                                   Jo sia
                    (Un Ka Kedan
                            dR h a
                                   ub n
                                          of)
                                Mo Kon t

                                    A i
                                 ng yp

                                          e
                  (Pe uth raz

                                         ua

                                 yc ta

                               ep sta
                                  d c

                                 Se rlan

                                 Urailan
                                          d

                                         in

                        ite zak ny
                                itz lic o
                               Sr nis

                                r rg
                                  U eg
                               Fe xi
                                      na

                                     ne

                                      lic
                                      nt
                                      a

                                       r
                                     B
                                      t
                                 dS

                                    e

                                   o
                                  G
         ite
       Un

                      op
                     Ru

                nia
              ina

                                                                                                                                         19
            nza
           Ch

          Ta
•  Most of the scholarship holders choose the USA when going to a Partner Country (Figure 3)
    Some 15% of all mobility flows to Partner Countries were hosted by the USA. This country is followed by
    Canada (10%) and Japan (7%).
•  The thematic fields of studies of scholarship holders going on a mobility to Partner Countries are
    identical to the thematic fields that scholarship holders study overall.
    While one third of the students study social sciences and humanities and one third life sciences (including
    environmental and geo sciences), slightly fewer than a third study the exact sciences, including 23% in
    information science & engineering, and 6% in chemistry.

Figure 4 : Main activities in mobilities to Partner Countries (n=455)

                                              Other

                                                    8%
                             Internship
                                                                            Study
                                           14%
                                                                35%

                                          20%
                           Research +
                            Lab Work                     23%

                                                               Thesis +
                                                             Dissertation

•  Most of the scholarship holders go to a Partner Country for the purpose of research, internships
    and thesis writing (Figure 4)
    When compared to the scholarship holders population as a whole, it becomes clear that the scholarship
    holders that go to Partner Countries mostly do so in order to carry out research and to do thesis work. These
    types of mobilities represent almost half of all scholarship holders’ mobilities in Partner Countries, compared
    to only 34% for the overall population of scholarship holders. Complementarily, in the overall population, 51%
    of the scholarship holder mobility flows have been identified as “Study”, compared to 35% for the mobility
    flows to Partner countries. The number of scholarship holders doing an internship when on mobility in a
    Partner Country (14%) is twice as high as the share of the overall population of scholarship holders doing an
    internship (7%).
  This is also reflected in the fact that for the overall population of scholarship holders only 10% of all mobilities
  take place at non-university institutions (e.g. enterprises, research institutes, NGOs, etc.) whereas for mobilities
  to Partner Countries it reaches 23%.

                                                                                                                         20
Erasmus+ Programme
                                                                          Erasmus Mundus Joint
                                                                          Master Degrees 2014-2020
                                                                                                                     © European Union, 2021 (CC BY-NC-ND 4.0) — image source: iStockphoto.com

                                                                                                                                                     Factsheet 5
                           Statistical Analysis of the Main Project Features

    This document is part of a series of fact sheets about the achievements of the 250 EMJMDs selected
    under Erasmus+ 2014-2020 :
    Factsheet 1 : Participation of the Programme Countries HEIs (excellence and inclusiveness)
    Factsheet 2 : Partner Country scholarship holders mobility
    Factsheet 3 : Programme Country scholarship holders mobility
    Factsheet 4 : Scholarship holders’ mobility to Partner Countries
    Factsheet 5 : Statistical analysis of the main project features
    Factsheet 6 : Overview of the participating Higher Education Institutions

   BACKGROUND
Between 2014 and 2020, the European Commission selected 250 Erasmus Mundus Joint Master
Degrees (EMJMDs). Each EMJMD implements three or four student intakes, and the scholarship holders
study in at least two different Programme Countries. Partner Countries can be included in the EMJMD
as either full partners or associated partners. This overview analyses the main characteristics of the
selected EMJMDs.
The number of selected EMJMDs (Figure 1) has increased since the first call in 2014, reflecting the
budget made available to support the projects. The lowest number of selected EMJMDs was in 2016
(27 selected EMJMDs), and the highest in 2019 (51 selected EMJMDs).
Similarly, the average budget size of the selected EMJMDs and the average number of scholarships
awarded per EMJMD has risen since the first call (Figure 2). The lowest average grant awarded per
EMJMD was in 2015 (1.591.000 €), and the highest in 2020 (3.845.000 €). The budget awarded
reflects mainly the number of scholarships allocated to the EMJMD projects, but also the type of
scholarships requested by the institutions1.

1 The scholarship amount varies according to different parameters, such as the nationality and country of residence of the student and the distance traveled.

                                                                           European Education
                                                                           and Culture
                                                                           Executive Agency                                                                                          21
Figure 1: Number of selected EMJMDs per call                                       Figure 2: Average maximum grant amount and
     Figure 1 : Number of selected EMJMDs per call for                                Figure 2number
                                                                                     average   : Averageof maximum    grantawarded
                                                                                                            scholarships     amount per
                                                                                                                                     and
  for proposals (n=250)
     proposals (n=250)                                                                average number of scholarships awarded per EMJMD
                                                                                     EMJMD   and year
                                                                                     and year
     60                                                                              4.0                                                                   90

                                                                                                                                                                Number of scholarships
     50                                                                              3.5                                                                   80

                                                                  Million on Euros
     40                                                                              3.0                                                                   70
     30                                                                              2.5                                                                   60
     20                                                                              2.0                                                                   50
     10                                                                              1.5                                                                   40

      0                                                                              1.0                                                                   30
           2014   2015   2016   2017   2018   2019   2020                                  2014     2015     2016     2017       2018     2019      2020
                                                                                                                       Year
                                                                                                    Average maximum grant awarded per project
                                                                                                    Average number of scholarships awarded per project

     As shown in Figure 3, the budget size of the EMJMDs varies to a large extent. Most EMJMDs (85%)
  As shown
     receivedin Figure 3, the budget
                 a maximum      grant size   of the EMJMDs
                                         of 2.000.000    € orvaries
                                                               more.to Most
                                                                       a largeofextent. Most EMJMDs
                                                                                  the EMJMDs               (85%) received
                                                                                                   who received      less than
  a maximum     grant of 2.000.000   €   or more.  Most of the  EMJMDs     who   received  less  than
     2.000.000 € were selected during the two first calls, in a context where no budget was allocated  2.000.000   € were for
  selected during
     targeted      the two
                 regions  in first
                             2014 calls,
                                    andinapplications
                                            a context where
                                                         withnosmaller
                                                                 budgetbudgets
                                                                          was allocated
                                                                                    were for  targeted
                                                                                          received     in regions in 2014
                                                                                                          2015. The     number
  andofapplica  ons  with  smaller  budgets    were  received in  2015.  The  number    of  awarded
         awarded scholarships also varies among the EMJMDs (Figure 4). The lowest number of foreseen    scholarships   also
  varies among thefor
     scholarships     EMJMDs    (Figureis4).
                         an EMJMD          9, The
                                              andlowest  numbernumber
                                                   the highest     of foreseen
                                                                           is 94.scholarships
                                                                                   Most EMJMDs  for an(88%)
                                                                                                        EMJMD    is 9,allocated
                                                                                                              were     and
  thebetween
      highest number
                40 andis9494.scholarships
                              Most EMJMDs (88%) were allocated between 40 and 94 scholarships.

     Figure 3:3 :Breakdown
   Figure           Breakdown ofofthe
                                    theselected
                                         selectedEMJMDs
                                                  EMJMDs                             FigureFigure  4: Breakdown
                                                                                            4 : Breakdown          of the selected
                                                                                                            of the selected EMJMDsEMJMDs
                                                                                                                                     according
   according to the maximum grant awardedEMJMD
     according   to the maximum   grant awarded per  per                             to theaccording
                                                                                            number of    scholarships  allocated per
                                                                                                       to the number of scholarships EMJMD
     (1000  Euros)
   EMJMD (1000 Euros)                                                                      allocated per EMJMD
                                 0-999                                                                                   1-19
                                                                                                                                     20-39
                                5%5%       1000-1999                                                                   4%
      4000-4999                                                                            80-99                            4%
                                       10% 10%                                                                                 8% 8%
                  23%
                    23%                                                                              26%
                                                                                                         26%

                                                                                                                                            40-59
                                                                                                                                      26% 26%
                                         28%
                                                   2000-2999
                                                 28%
                     34%
                                                                                                               36%
                  34%
          3000-3999                                                                                         36%
                                                                                                   60-79
      0-999   1000-1999    2000-2999     3000-3999    4000-4999                                   1-19     20-39       40-59        60-79       80-99

Main results

  This factsheet analyses the main characteris cs of the selected EMJMD projects in rela on to their study
  programmes, consor a arrangements, and openness to the world.

                                                            2

                                                                                                                                                                                         22
MAIN RESULTS
  This factsheet analyses the main characteristics of the selected EMJMD projects in relation to their study
  programmes, consortia arrangements, and openness to the world.

  FEATURES OF THE STUDY PROGRAMMES
  •  Almost all Master programmes are 120 ECTS programmes
      An overwhelming majority (95%) of the EMJMDs offer Master programmes of 120 ECTS, corresponding to two
      academic years. Only 3% of the EMJMDs offer 90 ECTS Master programmes, and 2% 60 ECTS programmes
      (Figure 5).

  Figure 5 : Breakdown of EMJMDs per number of ECTS

                                                   90 ECTS 60 ECTS
                                                         3% 2%

                                                              95%

                                                               120 ECTS

  •  An even distribution of thematic fields
      The thematic fields of the EMJMDs are quite evenly distributed between the three main thematic fields: 34%
      of the EMJMDs are within the fields of Humanities (Social Sciences and Humanities, Economic Sciences), 28%
      within the Life Sciences (Environmental and Geosciences, Life Sciences) and 37% within the Exact Sciences
      (Information Science and Engineering, Chemistry, Mathematics and Physics) (Figure 6). At a more detailed
      level, almost a third (30%) of the selected EMJMDs belong to the Social Sciences and Humanities, whereas
      Mathematics is a much less common study field (1%).

  Figure 6 : Breakdown of the selected EMJMDs per thematic field (n=250)

     Social Sciences and Humanities (SOC)                                                                 30%
Information Science and Engeneering (ENG)                                                       25%
     Environmental and Geosciences (ENV)                                             20%
                         Life Sciences (LIF)                        9%
                         Chemistry (CHE)                       7%
                            Physics (PHY)                4%
                  Economic Sciences (ECO)                4%
                       Mathematics (MAT)            1%
                                               0         5          10    15        20        25        30

                                                                                                                   23
•  Half of the EMJMDs offer joint degrees or degrees with a joint component2
    55% of the EMJMDs (type A + type B + type D) either offer joint degrees or degrees with a joint component
    (Figure 7). A joint degree is awarded by all partners in 21% of the EMJMDs (type A). The joint degree is
    awarded only by those institutions at which the students studied according to their specific study track in 11%
    of the EMJMDs (type B). In 23% of the EMJMDs, some partners award a joint degree, whereas others still issue
    a separate diploma (type D).
   More information on the type of degree is available in the 2020 EACEA study ‘Implementing joint degrees in
   the Erasmus mundus action of the Erasmus+ programme’.

Figure 7 : Type of degree awarded by the EMJMDs

                                                                                TYPE A - JOINT DEGREE
                TYPE D - COMBINATION
                                                     23%                 21%

                                                                                 11% TYPE B - JOINT DEGREE
                                                                                                  PER TRACK

                                                               44%

                                                  TYPE C - MULTIPLE DEGREE

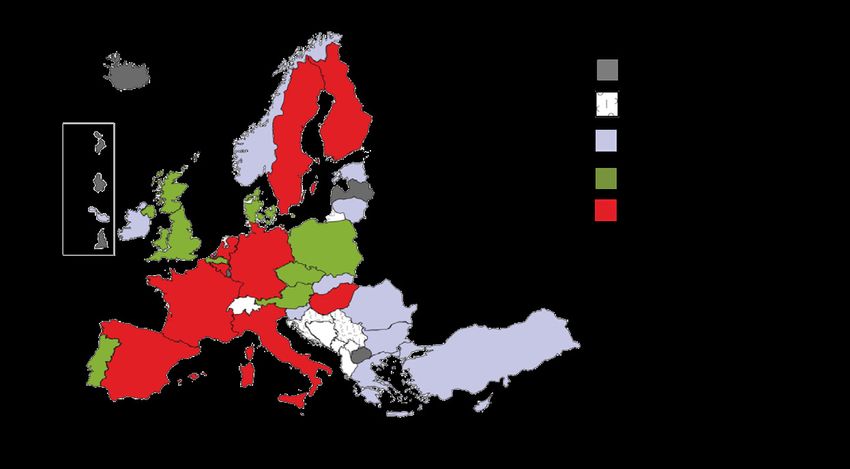
Whereas in average 33% of the EMJMDs award a Joint Degree, it should be noted that some countries/regions
are proportionally awarding more joint degrees than the others. In Figure 9, for each Programme Country, the
proportion of programmes offering a joint degree is compared with the average of 33%. Are highlighted in
green (higher proportion) and red (lower) those involved in more than 10 EMJMDs.
In the EMJMD programmes, the organisation of the mobility path is to a large extent left open to the choice
of the consortia, provided they respect the minimum mobility rules. The EMJMD study periods must take place
in at least two of the Programme Countries represented in the consortium, and students will have to acquire
the entirety of ECTS credits of the Master programme (60, 90 or 120). EMJMDs organise their mobility path
in different ways, varying from a predetermined “fixed” mobility track, in which all students move between the
same institutions at the same time, to a completely open study programme depending on the students’ needs
and the number of available places per institution. In almost two third of the EMJMDs (Figure 8), students can
choose their mobility track.

Figure 8 : Breakdown of the EMJMDs according to the type of mobility path

                                                                             Students have to visit
                                                                                 all partners
                                                                     36%

                                                          64%

                                        Students visit only
                                       some of the partners

2 Source : EACEA 2020 (based on a sample of EMJMD projects)
                                                                                                                      24
Figure 9 : EMJMDs awarding a “joint degree” or “joint degree per track” per country

                                                                                       No participation in EMJMDs
                                                                                       Not covered by the survey
                                                                                       answers
                                                                                       Involved in less than 10
  BE de                                                                                EMJMDs

  LU
                                                                                       More than 33% of projects
                                                                                       awarding a joint degree
  MT                                                                                   Less than 33% of projects
                                                                                       awarding a joint degree
  LI

•  More than half of the selected consortia between 2014-2020 were new Master progammes
    Out of the 250 EMJMDs that were selected between 2014 and 2020, 177 correspond to a unique partnership
    according to the information indicated by EMJMD applicants at application stage. Some partnerships have
    been funded two consecutive times under Erasmus+ 2014-2020 (e.g. under the 2014 and 2018 calls, or
    under the 2016 and 2020 calls). Moreover, as the Erasmus Mundus programme has been running since 2004,
    part of the selected EMJMDs obtained their first funding before the 2014-2020 funding period (Figure 10). In
    total, 94 entirely new Master programmes were funded between 2014 and 2020.

Figure 10 : Breakdown of the selected Master programmes (2014-2020) according to the date of their first
partnership funding (n=177)

                           Partnership since
                             2004-2008

                                               15%

                                                                        Partnership since
                                                           53%            2014-2020
                                       32%

                  Partnership since
                    2009-2013

                                                                                                                    25
You can also read