Coastal and Estuarine Water Quality State and Trends in Tāmaki Makaurau / Auckland 2010-2019. State of the Environment Reporting - R Ingley ...
←
→
Page content transcription
If your browser does not render page correctly, please read the page content below
Coastal and Estuarine Water Quality State and
Trends in Tāmaki Makaurau / Auckland 2010-2019.
State of the Environment Reporting
R Ingley
February 2021                Technical Report 2021/02
Coastal and estuarine water quality state and trends in
Tāmaki Makaurau / Auckland 2010-2019. State of the
environment reporting

February 2021                          Technical Report 2021/02

Rhian Ingley
Research and Evaluation Unit (RIMU)

Auckland Council
Technical Report 2021/02

ISSN 2230-4525 (Print)
ISSN 2230-4533 (Online)

ISBN 978-1-99-002286-9 (Print)
ISBN 978-1-99-002287-6 (PDF)

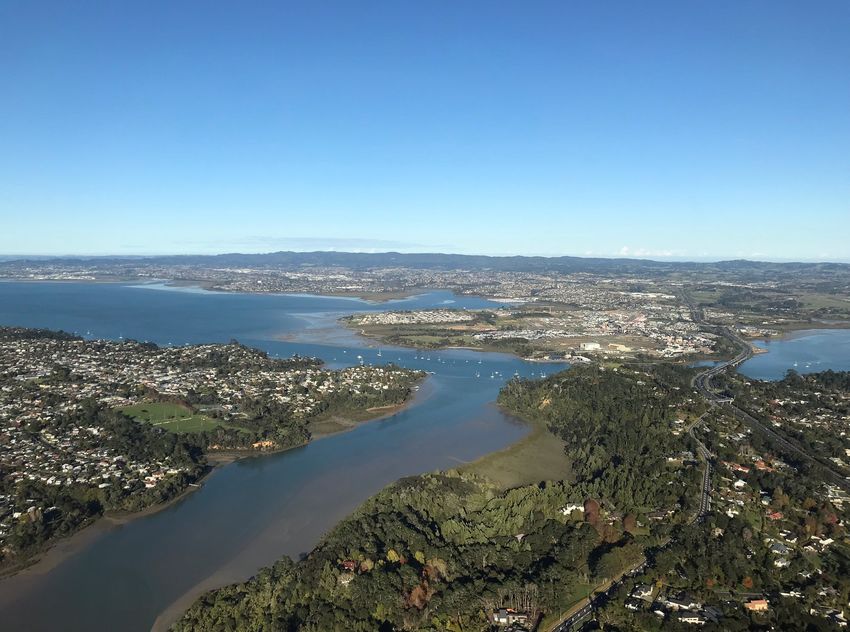
This report has been peer reviewed by the Peer Review Panel.

   Review completed on 5 February 2021
   Reviewed by two reviewers

   Approved for Auckland Council publication by:

   Name: Eva McLaren

   Position: Manager, Research and Evaluation (RIMU)

   Name: Jonathan Benge

   Position: Manager, Water Quality (RIMU)

   Date: 5 February 2021

Recommended citation
Ingley, R (2021). Coastal and estuarine water quality state and trends in Tāmaki Makaurau
/ Auckland 2010-2019. State of the environment reporting. Auckland Council technical
report, TR2021/02

Cover image credit
Facing south-west towards Hobsonville Point in the upper Waitematā Harbour, Auckland.
Photograph by Natalie Gilligan

© 2021 Auckland Council

Auckland Council disclaims any liability whatsoever in connection with any action taken in
reliance of this document for any error, deficiency, flaw or omission contained in it.

This document is licensed for re-use under the Creative Commons Attribution 4.0
International licence.
In summary, you are free to copy, distribute and adapt the material, as long as you
attribute it to the Auckland Council and abide by the other licence terms.
Executive summary

This report is one of a series of publications prepared in support of the State of the
environment report for the Auckland region. Coastal and estuarine water quality is monitored
monthly at 31 sites focusing on our three main harbours and two large estuaries. We
measure a range of physical and chemical variables or attributes focusing on nutrients and
water clarity. These water quality factors can be affected by land use activities, point and
diffuse source discharges, and natural seasonal and climatic variation.
Coastal and estuarine water quality is assessed in relation to regional water quality
guidelines, and how water quality has changed over the past 10 years in relation to the
current state, such as where water quality is good but degrading, poor but improving, or poor
and getting worse. The current state was assessed in relation to the regional water quality
index based on monthly median values over 2017 to 2019. Trends were assessed for the
10-year period from 2010 to 2019. Trend assessment includes two parts, the assessment
of the probability of the direction of the trend, and where there is a high probability of a trend
(very likely) we can also estimate the magnitude of that trend.
Half of the monitored sites were found to have good to fair water quality, generally following
a spatial gradient where open coastal sites generally have good water quality, while tidal
creek sites have poorer water quality.
Previous analysis of coastal and estuarine water quality published in 2018 found that water
quality was improving at most sites across the region between 2007 and 2016, driven by
improving nutrient concentrations. The analysis in this current report generally agreed with
these earlier findings. From 2010 to 2019, over 80 per cent of monitored sites were found to
have improving trends in total oxidised nitrogen and chlorophyll α (phytoplankton), and over
50 per cent of monitored sites had improving trends in dissolved reactive phosphorus and
water clarity (turbidity). More than 70 per cent of sites were found to have very likely
decreasing dissolved oxygen saturation. There were clear spatial differences across the
region with a high proportion of degrading trends within the Waitematā Harbour for
ammoniacal nitrogen, dissolved reactive phosphorus and turbidity.
In some instances, the rate of improvement was negligible, however where water quality is
found to be improving, we can assume that water quality is at least being maintained in the
current state. The greatest rates of improvement in nutrient concentrations were found at
sites with the poorest water quality in the northern Manukau Harbour. However,
concentrations remain high relative to regional reference guidelines and this is reflected in
more variable responses in chlorophyll α (phytoplankton), and dissolved oxygen. Reducing
sedimentation is a primary focus of the Kaipara Moana Remediation programme that has
recently received significant government investment. Water clarity (turbidity) was generally
found to be good and improving within the southern Kaipara Harbour.

Coastal and estuarine water quality state and trends in Tāmaki Makaurau / Auckland 2010-2019     i
Table of contents

1.0 Introduction.................................................................................................................. 1
   1.1          Purpose and objectives ...................................................................................... 2
   1.2          Supporting reports ............................................................................................. 3
2.0 Methods ...................................................................................................................... 3
   2.1          Programme design ............................................................................................. 4
   2.2          Coastal water quality state ................................................................................. 8
   2.3          Trend analysis.................................................................................................... 9
3.0 Results and Discussion ............................................................................................. 13
   3.1          Overview of water quality current state (2017-2019)........................................ 13
   3.2          Climate summary 2010 to 2019 ....................................................................... 15
   3.3          Regional summary of coastal water quality 10-year trends .............................. 16
   3.4          Water quality trends relative to current state .................................................... 20
4.0 Summary ................................................................................................................... 39
   4.1          Response to previous recommendations ......................................................... 40
   4.2          Knowledge gaps and future directions ............................................................. 41
5.0 Acknowledgements ................................................................................................... 43
6.0 References ................................................................................................................ 44
Appendix A             Summary of analytical methods................................................................ 48
Appendix B             Land Cover Aggregation........................................................................... 49
   Summary of changes in land cover ............................................................................... 50
Appendix C             Selected time series plots ......................................................................... 51

Coastal and estuarine water quality state and trends in Tāmaki Makaurau / Auckland 2010-2019                                       ii
List of figures

Figure 2-1: Summary of broad land cover classes (based on LCDB 5.0 see Appendix B)
within each watershed. ........................................................................................................ 5
Figure 2-2: Location of the 31 coastal and estuarine water quality monitoring sites. ........... 7
Figure 3-1: Summary of the 2017-2019 overall coastal water quality index score per site as
an assessment of current state. ......................................................................................... 14
Figure 3-2: Summary of the proportion of all sites within bands of frequency of
exceedances of regional coastal water quality index guidelines (2017-2019).................... 15
Figure 3-3: Regional summary of the proportion of sites within each trend category across
coastal water quality index parameter ............................................................................... 17
Figure 3-4: Summary maps of 10-year trends (2010-2019) in coastal water quality
parameters per site. ........................................................................................................... 18
Figure 3-5: Summary maps of 10-year trends (2010-2019) in coastal water quality physical
parameters per site. ........................................................................................................... 19
Figure 3-6: Magnitude of ‘very likely decreasing’ trends in salinity at each site ordered by
increasing median salinity within each area. Bars represent 90% confidence intervals.
Dashed lines represent the precision limit (measurement resolution) ................................ 21
Figure 3-7: Magnitude of ‘very likely increasing’ trends in temperature at each coastal site,
ordered by increasing median salinity within each area. .................................................... 23
Figure 3-8: Summary of 10-year trends (2010-2019) by exceedance of the upper (High
DO) or lower (Low DO) coastal water quality index guidelines (2017-2019). ‘None’
indicates that dissolved oxygen was within the guideline range. ....................................... 24
Figure 3-9: Magnitude of ‘very likely’ trends in dissolved oxygen at each site ordered by
areas and exceedance of the upper (High DO) or lower (Low DO) coastal water quality
index guidelines (2017-2019)............................................................................................. 25
Figure 3-10: Summary of 10-year trends (2010-2019) by the frequency of coastal water
quality index guideline exceedances for turbidity (2017-2019). ......................................... 27
Figure 3-11: Magnitude of ‘very likely’ trends in turbidity at each coastal site ordered by
area and frequency of coastal water quality index guideline exceedances (2017-2019). .. 29
Figure 3-12: Summary of 10-year trends (2010-2019) by the frequency of coastal water
quality index guideline exceedances for total oxidised nitrogen and ammoniacal nitrogen
(2017-2019). ...................................................................................................................... 31
Figure 3-13: Summary of trends in ammoniacal nitrogen over the 10-year period 2010 to
2019 and partitioned to prior to the 2017 service change. ................................................. 31
Figure 3-14: Magnitude of ‘very likely improving’ trends in total oxidised N at each site
ordered by area and frequency of coastal water quality index guideline exceedances
(2017-2019). ...................................................................................................................... 33
Figure 3-15: Magnitude of consistently ‘very likely degrading’ trends in ammoniacal
nitrogen across partitioned time periods ordered by area and frequency of coastal water
quality index guideline exceedances (2017-2019). ............................................................ 33
Figure 3-16: Summary of 10-year trends (2010-2019) by the frequency of coastal water
quality index guideline exceedances for dissolved reactive phosphorus (2017-2019). ...... 35
Figure 3-17: Magnitude of ‘very likely’ trends in dissolved reactive phosphorus at each site
ordered by area and frequency of coastal water quality index guideline exceedances
(2017-2019). ...................................................................................................................... 36

Coastal and estuarine water quality state and trends in Tāmaki Makaurau / Auckland 2010-2019                                        iii
Figure 3-18: Summary of 10-year trends (2010-2019) by the frequency of coastal water
quality index guideline exceedances for chlorophyll α (2017-2019). .................................. 37
Figure 3-19: Magnitude of ‘very likely’ trends in chlorophyll α at each site ordered by area
and frequency of coastal water quality index guideline exceedances (2017-2019). .......... 38

List of tables
Table 2-1: Current coastal and estuarine water quality sites grouped by location. .............. 6
Table 2-2: Water quality index guidelines for the Auckland region. ..................................... 8
Table 2-3: Water quality index categories and scoring ranges used by Auckland Council
(CCME, 2001) ...................................................................................................................... 9
Table 2-4: Trend confidence category levels used to determine the direction of trends. ... 10
Table 6-1: Analytical methods for water quality parameters assessed .............................. 48
Table 6-2: Summary of LCDB Land Cover Classes and Broad Aggregations ................... 49
Table 6-3: Summary of changes in urban land cover within each major watershed over the
10-year period.................................................................................................................... 50

Coastal and estuarine water quality state and trends in Tāmaki Makaurau / Auckland 2010-2019                                       iv
1.0        Introduction

The marine environment in the Auckland region encompasses two oceans, three major
harbours and numerous estuaries that collectively, include 75 per cent of the total
Auckland region. Within these are a wide variety of marine habitats which support a
diverse range of plants and animals, including seaweeds, invertebrates, mangroves,
seagrass, shellfish, marine mammals, fish, and sea birds.
The aesthetics, use and health of coastal waters are influenced by the quality of
surface water that runs from the land through streams, rivers, overland flow paths and
stormwater, and point source discharges directly to the coast, and activities in the
coastal environment. Land use both inside and outside of the Auckland region also
impacts coastal water quality, particularly in the Hauraki Gulf, and Kaipara Harbour.
Water quality is also influenced by natural seasonal and decadal variation as well as
climatic changes.
Auckland Council’s coastal and estuarine water quality monitoring programme focuses
on nutrient and water clarity parameters. Other contaminants associated with urban
land use and stormwater contamination, such as metals, are monitored in Auckland
Council’s river water quality, and estuarine sediment and ecology monitoring
programmes (see section 1.2) and are not assessed here. Microbiological
contamination of beaches and recreational water quality are monitored through the
Safeswim programme, www.safeswim.org.nz
This report provides technical information describing how coastal and estuarine water
quality has changed over the past 10 years (2010 to 2019) across Auckland. This forms
part of a series of technical reports collectively addressing river, groundwater, lake,
and coastal water quality, and ecological condition over the same time frames. This
information can be added to matauranga Māori knowledge to support Māori in their
role as kaitiaki to protect and enhance te mauri o te wai (the life supporting capacity of
water).
The current state of coastal and estuarine water quality (based on 2017 to 2019) is
described in the 2019 Coastal and Estuarine Water Quality Annual Data Report
(Ingley, 2020 TR2020/016) but is also summarised here to provide further context on
trend directions, i.e. where water quality is good but declining, or poor but improving.
This is part of the feedback loop necessary to assess whether Auckland Council’s
management strategies are effective in sustaining ecosystem functions, and to identify
opportunities for improved future sustainable use of our valued coastal environment.

Coastal and estuarine water quality state and trends in Tāmaki Makaurau / Auckland 2010-2019   1
1.1        Purpose and objectives

Auckland Council’s coastal and estuarine water quality monitoring programme
supports the following objectives:

    •    Meet council’s obligations under section 35 of the Resource Management Act
         1991 (as amended) to monitor and report on the state of the environment.
    •    Provide evidence of how the council is maintaining and enhancing the quality of
         the region’s coastal environment (Local Government Act 2002). Specifically,
         evidence for the Environment and Cultural Heritage component of the Auckland
         Plan 2050. A key direction for the region is to manage the effects of growth and
         development on our natural environment.
    •    Help inform the effectiveness of policy initiatives and strategies and operational
         delivery.
    •    Assist with the identification of large scale and/or cumulative impacts of
         contaminants associated with varying land uses and disturbance regimes and
         links to particular activities.
    •    Provide baseline, regionally specific data to underpin sustainable management
         through resource consenting and associated compliance monitoring for coastal
         and estuarine environments.
    •    Continuously increase the knowledge base for Aucklanders and promote
         awareness of regional coastal and estuarine water quality issues and their
         subsequent management.

Coastal and estuarine water quality state and trends in Tāmaki Makaurau / Auckland 2010-2019   2
1.2 Supporting reports
Previous reports can be obtained from Auckland Council’s Knowledge Auckland
website, www.knowledgeauckland.org.nz.
Supplementary data files of the trend analysis outputs presented in this report are also
available on Knowledge Auckland. For further enquiries and data supply, email
environmentaldata@aucklandcouncil.govt.nz
Microbiological contamination of beaches and recreational water quality are monitored
through the Safeswim programme, www.safeswim.org.nz.
This report is one of a series of publications prepared in support of the State of the
Environment report for Tāmaki Makaurau / Auckland. Reports on aspects of freshwater
and coastal water quality and ecology include:
• Auckland river water quality: annual reporting and National Policy Statement for
Freshwater Management current state assessment, 2019 – TR2021/11
• Coastal and estuarine water quality 2019 annual report – TR2020/016
• Groundwater quality state and trends in Tāmaki Makaurau / Auckland 2010-
2019. State of the environment reporting – TR2021/03
• Lake water quality state and trends in Tāmaki Makaurau / Auckland 2010-2019.
State of the environment reporting – TR2021/04
• Marine ecology state and trends in Tāmaki Makaurau / Auckland to 2019. State
of the environment reporting – TR2021/09
• Marine sediment contaminant state and trends in Tāmaki Makaurau / Auckland
2004-2019. State of the environment reporting – TR2021/10
• Rainfall, river flow, and groundwater level state and trends in Tāmaki Makaurau
/ Auckland 2010-2019. State of the environment reporting – TR2021/06
• River ecology state and trends in Tāmaki Makaurau / Auckland 2010-2019.
State of the environment reporting – TR2021/05
• River water quality state and trends in Tāmaki Makaurau / Auckland 2010-2019.
State of the environment reporting – TR2021/07
Coastal and estuarine water quality state and trends in Tāmaki Makaurau / Auckland 2010-2019 32.0 Methods 2.1 Programme design Auckland’s coastal water quality monitoring programme was primarily designed for detecting long-term changes in water quality across the region. The network aims to be regionally representative by including a range of exposure levels, contributing catchment land uses, and covers our three main harbours and large estuaries (see Table 2-1, Figure 2-1, and Figure 2-2). This enables Auckland Council to present a region-wide perspective on water quality and infer the likely water quality of other estuaries and coastal waters in the region that are not monitored. Auckland’s coastal and estuarine water quality monitoring programme currently includes 31 sites. The programme has evolved over time, with sites added or removed according to varying regional management priorities. Auckland Council’s Research and Evaluation Unit (RIMU) collects coastal and estuarine water quality samples monthly from surface waters. Sites in the inner Hauraki Gulf, Kaipara Harbour, Tāmaki Strait and Manukau Harbour are collected by helicopter, sites in the upper and central Waitematā Harbour are collected by boat and Tāmaki Estuary sites are collected from land. Natural temporal variation in water quality is avoided as much as possible by maintaining a consistent sampling time relative to the tidal cycle. Collection of water samples by helicopter enables sites spread over a broad area to be sampled within a narrow time window created by tidal constraints, making comparison between sites more robust. Samples are collected approximately 10 minutes to 2.5 hours after high tide for the Kaipara Harbour, Waitematā Harbour and Hauraki Gulf sites and 2.5 to 4 hours after high tide for the Manukau Harbour. Over the past 10 years, 90 per cent of samples were taken between 9:00 am and 2:00 pm. Maintaining a consistent sample time improves the power of long-term trend detection. Due to the logistical sequencing of monitoring sites, the Kaipara Harbour is consistently sampled earlier in the day, and the Manukau Harbour later in the day. The time at which a sample is collected may affect some parameters, such as temperature and dissolved oxygen. Physical parameters (such as temperature, salinity, dissolved oxygen) are measured in the field, and samples are taken for further laboratory analysis of nutrients, metals, sediments, and other chemical properties of water. Coastal and estuarine water quality state and trends in Tāmaki Makaurau / Auckland 2010-2019 4
Further details on data collection and management are provided in the annual data
reports (see Ingley, 2020). A summary of laboratory analytical methods for each
parameter is provided in Appendix A.

         Gulf Islands

           North East

           Mahurangi

      Hibiscus Coast

Waitematā Harbour

     Tāmaki Estuary

               Wairoa

  Manukau Harbour

    Kaipara Harbour

          West Coast

                        0%                   25%                      50%                75%                100%
                             Urban   Other    Rural    Horticulture    Exotic forest   Native   Wetland   Water

Figure 2-1: Summary of broad land cover classes (based on LCDB 5.0 see Appendix
B) within each watershed.

Coastal and estuarine water quality state and trends in Tāmaki Makaurau / Auckland 2010-2019                       5
Table 2-1: Current coastal and estuarine water quality sites grouped by location.
Year Exposure Dominant
Site Easting Northing initiated adjacent land
Level
Goat Island 1761787 5984944 1993 Open Coast Rural*
Ti Point 1760058 5978931 1991 Open Coast Rural*
East Coast
Mahurangi Heads 1754225 5960548 1993 Estuary Rural*
Dawsons Creek 1753782 5966175 1993 Estuary Rural
Orewa 1753660 5949837 1991 Open Coast Urban *
Browns Bay 1757497 5935771 1991 Open Coast Urban *
Shelly Beach 1723871 5952426 1991 Estuary Rural*
Kaipara River 1725504 5947101 2009 Estuary Rural
Kaipara Harbour
Makarau Estuary 1727396 5953730 2009 Estuary Rural
Kaipara Heads 1708534 5970421 2009 Estuary Rural*
Tauhoa Channel 1717821 5970063 2009 Estuary Rural*
Hoteo River 1726691 5967495 2009 Estuary Rural
Chelsea 1753721 5922776 1991 Estuary Urban*
Whau Creek 1748588 5920563 1991 Estuary Urban
Waitematā Harbour
Henderson Creek 1746715 5923855 1991 Estuary Urban
Hobsonville 1749453 5927353 1993 Estuary Urban
Paremoremo Creek 1745717 5930201 1993 Tidal Creek Lifestyle/Native
Rangitopuni Creek 1742734 5930626 1993 Tidal Creek Rural
Brighams Creek 1742829 5928227 1996 Tidal Creek Urban
Lucas Creek 1749892 5932176 1993 Tidal Creek Urban
Tāmaki 1769303 5916944 1992 Estuary Urban*
Estuary
Tāmaki
Panmure 1765553 5913693 1992 Estuary Urban
Tāmaki
Strait
Wairoa River 1786561 5910769 2009 Estuary Rural
Grahams Beach 1749431 5897517 1987 Estuary Urban/Rural*
Clarks Beach 1749746 5888100 1987 Estuary Rural
Manukau Harbour
Waiuku Town Basin 1752923 5879195 2012 Tidal Creek Rural
Shag Point 1748335 5908549 1987 Estuary Urban/Rural
Puketutu Point 1753938 5908791 1987 Estuary N/A
Weymouth 1764080 5897952 1987 Estuary Urban/Rural
Māngere Bridge 1758048 5910932 1987 Estuary Urban
Manukau Heads 1741520 5900335 2009 Estuary Urban/Rural*
* Open coast and main harbour body/harbour mouth sites are less subject to direct influences from adjacent land
use
Coastal and estuarine water quality state and trends in Tāmaki Makaurau / Auckland 2010-2019 6Figure 2-2: Location of the 31 coastal and estuarine water quality monitoring sites. (Area shaded in red shows the extent of urban area in 2019 (Hoffman, 2019) Coastal and estuarine water quality state and trends in Tāmaki Makaurau / Auckland 2010-2019 7
2.2         Coastal water quality state

Unlike river water quality, there are no widely agreed upon water quality thresholds or
guidelines for coastal and estuarine waters in New Zealand. The Australian and New
Zealand Environment and Conservation Council (ANZ) published guidelines in 2000
for fresh and marine water quality, however further work is needed to refine guidelines
for New Zealand estuarine and marine systems and the default values for south east
Australian estuaries were recommended as interim reference values (ANZECC 2000).
As such, the current state of water quality is based on the Auckland regional water
quality index (WQI) assessment of the monthly median values over 2017 to 2019
compared to Auckland regional reference values, ANZ guidelines, or guidelines
developed for tidal creek environments by Northland Regional Council (Griffiths, 2016)
(Table 2-2). The regional water quality index uses different guidelines for tidal creeks,
estuaries, and open coastal environments reflecting the natural variability in water
quality over the spatial gradient in freshwater inputs and degree of mixing and flushing.
The water quality index provides an overall score based on the frequency, and
magnitude of exceedances of regional water quality guidelines, and how many of the
different parameters were exceeded (Table 2-2 and Table 2-3). To enable comparison
of the current state of individual parameters to trends in those parameters this analysis
focuses on the frequency of exceedances. The frequency was grouped into five
categories: none, low (1-3 exceedances), moderate (4-6 exceedances), high (7-9
exceedances), and very high (10-12 exceedances). The maximum frequency being 12
months within the year, indicating values are elevated all the time. Further details on
methods for the assessment of water quality state are provided in the Coastal and
Estuarine Water Quality 2019 Annual Data Report (Ingley, 2020).
Table 2-2: Water quality index guidelines for the Auckland region.
    Parameter                                            Open Coast                 Estuary    Preliminary Tidal
                                                          Guideline                Guideline   Creek Guideline

    Dissolved oxygen (% saturation)                 90-110%1                 90-110%1          80-110% 3

    Turbidity (NTU) 1
Table 2-3: Water quality index categories and scoring ranges used by Auckland
Council (CCME, 2001).
WQI Score Meaning
Class range
Water quality is protected with a virtual absence of threat or impairment,
Excellent
95-100 conditions very close to natural or pristine levels. These index values can only
be obtained if all measurements are within guidelines all the time.
Water quality is protected with only a minor degree of threat or impairment;
80-94 conditions rarely depart from natural or desirable levels or water quality
Good
guidelines.
Water quality is usually protected but occasionally threatened or impaired;
65-79 conditions sometimes depart from natural or desirable levels or water quality
Fair
guidelines.
Marginal
Water quality is frequently threatened or impaired; conditions often depart from
45-64
natural or desirable levels or water quality guidelines.
Water quality is almost always threatened or impaired; conditions usually depart
Poo
0-44
from natural or desirable levels or water quality guidelines.
r
2.3 Trend analysis
As a first step, data was assessed for seasonality using the Kruskal-Wallis test which
determined the type of test used for subsequent trend analysis. Seasonal tests
compare observations within each month over time, while non seasonal tests compare
all observations over time. Data were also inspected for minimum data requirements,
and changes in detection limits over time prior to analysis (see sections 2.3.1 and
2.3.2).
Monotonic trends across sites were analysed by assessing the direction of a trend, i.e.
how likely is it that parameter is increasing or decreasing? The confidence in the trend
direction is calculated using the Kendall (or seasonal Mann-Kendall) test based on the
probability that the trend was decreasing. The calculated probability is interpreted
based on the categories used by the Intergovernmental Panel on Climate Change and
further aggregated to five categories for simplicity as per LAWA (Cawthron Institute
2019; Snelder and Fraser 2018) (see Table 2-4).
For most parameters, a decreasing trend is interpreted as an improvement in water
quality, and an increasing trend is a degradation in water quality. For physical
parameters such as temperature and salinity we have referred to the likelihood of the
direction of the trend as increasing or decreasing and have not assigned this as either
improving or degrading. A trend is classified as indeterminate when there is insufficient
evidence to determine if the data is trending in a particular direction.
Coastal and estuarine water quality state and trends in Tāmaki Makaurau / Auckland 2010-2019 9Table 2-4: Trend confidence category levels used to determine the direction of trends.
Trend categories Probability (%)
Very likely improving Very likely decreasing 90-100
Likely improving Likely decreasing 67-90
Indeterminate Indeterminate 33-67
Likely degrading Likely increasing 10-33
Very likely degrading Very likely increasing 0-10
Where water quality is found to be degrading further assessment is critical to
understand what actions may be necessary to improve water quality. This includes
assessment of the likelihood of the trend, the magnitude of the trend, the risk of
adverse ecological outcomes (in relation to the known current state), and consideration
of whether the current state is a reflection of naturally occurring processes.
An overarching assumption of the first step of the trend analysis is that there are always
differences between observations (McBride, 2019).
The magnitude of the trend is characterised by the slope of the trend line using the
Sen slope estimator (SSE) (or the seasonal version (SSSE)). The SSE is the median
of all possible inter-observation slopes. The 90 per cent confidence intervals of this
median estimate are also calculated.
While a trend may be very likely improving or degrading, the smaller the Sen slope, or
rate of change, the longer it would take to be reflected in assessments of the current
state assuming a linear rate of change. Trend magnitude is further considered in this
report relative to the limit of precision (i.e. the measurement resolution 1) following the
approach in Fraser and Snelder (2018). Trend magnitude can only be estimated with
confidence for ‘very likely’ trends.
Trend magnitudes were discussed in previous Auckland Council water quality trend
reports in terms of the relativised Sen slope or per cent change per annum relative to
the median concentration over 10 years. This per cent annual change approach is
useful for comparing between different parameters as it standardises the rate of
change to the same units. However, this approach can mask interpretation of trends if
there are large differences in median values of a parameter between sites. For
example, where sites have high concentrations of contaminants (poor water quality),
concentrations may be changing by a large amount but when divided by the median
1
Where the measurement resolution varied over time (such as due to changes in detection limits), the
most common value was used.
Coastal and estuarine water quality state and trends in Tāmaki Makaurau / Auckland 2010-2019 10value, the trend magnitude appears small. Conversely, where a site has a very low median concentration (such as at reference sites), a small magnitude of change would be amplified to a high percentage per annum. Analyses were undertaken using purpose-written script designed for undertaking the trend analysis as described in Larned et al. (2018) in the R statistical package (R Core Team, 2020). The script was obtained from Land Water People (LWP-Trends library Version 1901: LWPTrends_v1901.r.) and is readily available at https://landwaterpeople.co.nz/pdf-reports/. 2.3.1 Data requirements and time periods for analyses Monotonic trends were assessed for the 10-year period from January 2010 to December 2019. Several sites within the Kaipara Harbour were added to the programme in 2009 and therefore the ten-year period from 2010 to 2019 provides the best regional coverage over a standardised time frame. A minimum of 90 per cent of samples across all site per parameter per year (or season) combinations were required for analysis. For example, over a 10-year period of monthly monitoring, this is equivalent to at least 10 samples per year in at least nine of the 10 years. There were less than 90 per cent of samples available for the two sites at Tāmaki Estuary for chlorophyll α and ammoniacal nitrogen and the threshold was lowered to 80 per cent in these specific instances rather than omitting these sites from trend analysis. Interim trends were also calculated for the Waiuku Channel at Town Basin site where there was a minimum of 90 per cent of samples across the eight years available. Any sites or parameters that did not meet these data requirements were not analysed and therefore no trends were reported. The number and type of water quality parameters measured has varied since the programme’s inception as new technology has become more affordable, instrument sensitivity has improved, and the programme objectives modified. Some discrepancies have been observed in long-term trends particularly for ammoniacal nitrogen, where a step increase was observed coinciding with a change in laboratory service provider (July 2017), and total nitrogen, where a step increase was observed dating to September 2016 coinciding with laboratory analytical changes from automated, to flow injection analysis 2. 2 Note that ammoniacal N, total oxidised nitrogen, and nitrite analyses also changed from automated to flow injection analyses in August 2016 however no clear step changes were observed and these results are assumed to be comparable over time. Coastal and estuarine water quality state and trends in Tāmaki Makaurau / Auckland 2010-2019 11
2.3.2      Detection limits and censored values

Values that are less than the detection limit for a parameter are referred to as ‘left
censored’ values. For trend analysis, censored values are replaced with a value half
the detection limit. This ensures that any measured value that is equal to the detection
limit, is treated as being larger than a value that is less than the detection limit, i.e. a
measured concentration of 0.2 mg/L is larger than a value recorded as
3.0        Results and Discussion

3.1        Overview of water quality current state (2017-2019)

A summary of water quality state compared to the regional coastal water quality index
is outlined here. Refer to the Coastal and Estuarine Water Quality 2019 Annual Data
report (Ingley, 2020) for further details on current water quality state.
The regional water quality index is based on six key parameters, which also align with
the key parameters regulated under the National Policy Statement for Freshwater
Management 2020 (NPS-FM) (New Zealand Government, 2020). However, it is
important to note that the water quality index guidelines for total oxidised nitrogen and
ammoniacal nitrogen are based on potential nutrient enrichment relative to reference
conditions and are not in relation to toxicity effects unlike the NPS-FM nitrate and
ammonia attributes.
Half of the monitored sites were found to have good to fair water quality, generally
following a spatial gradient from greater to lesser freshwater influence (Figure 3-1).
Open coastal sites generally have good water quality, while tidal creek sites have
poorer water quality. Sites within the Manukau Harbour also tended to have poor water
quality.
To enable further analysis of individual parameters, the frequency attribute of the water
quality index scoring presented in the annual report (Ingley, 2020) has been extracted
and summarised here (Figure 3-2). A low frequency of guideline exceedances
suggests that the parameter was found to have monthly median concentrations higher
than regional reference values occasionally, such as a seasonal peak. A moderate
frequency of guideline exceedances suggests that parameter was found to have
monthly median concentrations higher than regional reference values for more than
one season (more than three months). High and very high frequencies of exceedances
reflect values that are elevated more than half of the time, to most or all the time.
Regionally, 19 per cent of monitored sites have elevated total oxidised nitrogen
concentrations (high to very high frequency above guidelines), and 16 per cent have
elevated dissolved reactive phosphorus concentrations (Figure 3-2). Nearly 50 per
cent of sites have elevated ammoniacal nitrogen concentrations, however a potential
step increase in ammoniacal nitrogen was previously noted as a potential analytical
factor influencing the assessment of current state (Ingley, 2019) and further analysis
of this is undertaken in section 3.4.5.
The majority of our monitored estuaries and harbours are shallow intertidally
dominated environments where phytoplankton biomass would not be expected to be

Coastal and estuarine water quality state and trends in Tāmaki Makaurau / Auckland 2010-2019   13
retained and accumulate to high concentrations (Plew et al. 2020), which is reflected
by only six per cent of sites with elevated levels of chlorophyll α relative to regional
guidelines. Dissolved oxygen is also an indicator of eutrophic stress in coastal
environments and over 20 per cent of sites were found to experience undesirable levels
of oxygen saturation at least occasionally (higher or lower than guidelines).
Elevated turbidity (poor water clarity), and high suspended sediment levels are
commonly observed when monitoring coincides with higher river flows in the upstream
catchments (Ingley, 2019, 2020). Monitoring is typically undertaken during base flow
conditions when sediment sources have not been rapidly mobilised. It is therefore
unsurprising that nearly 80 per cent of our monitored sites generally have low turbidity
levels or only occasionally exceed guideline values.

      100

            80

            60
WQI Score

            40

            20

             0
                          Browns Bay

                        Shelly Beach
                             Panmure

                        Wairoa River

                           Weymouth

                           Shag Point
                                Orewa
                              Ti Point
                          Goat Island

                         Lucas Creek
                  Paremoremo Creek

                              Chelsea

                               Tāmaki
                         Whau Creek

                    Makarau Estuary
                        Kaipara River

                 Waiuku Town Basin*
                     Māngere Bridge

                       Puketutu Point
                        Clarks Beach
                       Kaipara Heads
                      Dawsons Creek

                   Rangitopuni Creek
                     Brighams Creek

                          Hobsonville

                          Hoteo River

                     Tauhoa Channel

                     Grahams Beach
                     Manukau Heads
                    Mahurangi Heads

                    Henderson Creek

                  East Coast       Upper        Waitematā   Tāmaki Wai       Kaipara           Manukau
                                  Waitematā                        -roa

Figure 3-1: Summary of the 2017-2019 overall coastal water quality index score per
site as an assessment of current state.
Sites are ordered by increasing salinity within each area.
Coloured bands indicate the overall class from excellent (blue) to poor (red).

Coastal and estuarine water quality state and trends in Tāmaki Makaurau / Auckland 2010-2019             14
100%
75%
Summary (n=31)
Regional WQI
50%
25%
0%
Ammoniacal
TON DRP Turbidity Chlorophyll α DO%
N
None 26% 3% 45% 52% 39% 77%
Low 35% 19% 29% 26% 32%
Moderate 19% 29% 10% 16% 23%
High 13% 32% 3% 3% 3%
Very High 6% 16% 13% 3% 3%
High DO 13%
Low DO 10%
Figure 3-2: Summary of the proportion of all sites within bands of frequency of
exceedances of regional coastal water quality index guidelines (2017-2019).
‘None’ indicates no values above guidelines, through to very high which indicates values are above
guidelines most or all of the time. High and Low DO values refer to exceedances of the upper, or
lower, dissolved oxygen guidelines not the frequency those exceedances.
3.2 Climate summary 2010 to 2019
New Zealand’s climate varies significantly from year to year and over the long-term.
This is associated with decadal circulation and climate variations such as the
Interdecadal Pacific Oscillation (IPO) and El Niño Southern Oscillation (ENSO). These
cycles affect average sea surface temperature, prevailing winds, and rainfall patterns.
This drives differences in nutrient and sediment, concentrations through changes to
oceanic upwelling of nutrient rich waters, and soil erosion and nutrient leaching.
La Niña events typically bring warmer sea waters, and more rain to the north eastern
areas of the North Island, while El Niño events bring cooler waters and drier conditions
(Pearce et al. 2017). These cycles typically account for less than 25 per cent of the
variance in seasonal rainfall and temperature patterns at most sites in New Zealand
(NIWA, n.d.). Large oscillations between El Niño and La Niña cycles occurred within
the 10-year period assessed here, with La Niña conditions in 2010-2011, and El Niño
events in 2015-2016 and 2019. Separate analysis of mean annual rainfall across
Auckland demonstrated that annual rainfall was higher than the 75th percentile of the
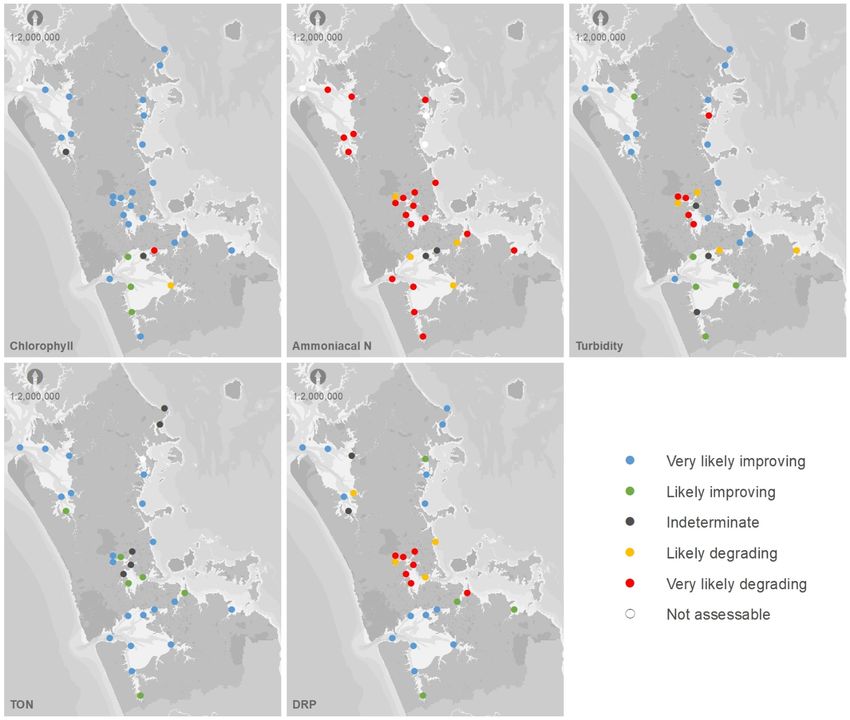
Coastal and estuarine water quality state and trends in Tāmaki Makaurau / Auckland 2010-2019 15last 20 years in 2011, and for three consecutive years in 2016 to 2018 (Johnson, 2021). Rainfall was lower than the 25th percentile in 2010, 2014, and 2019 (Johnson, 2021). Coastal and estuarine water quality monitoring is undertaken at monthly intervals and is not specifically designed to capture high rainfall and river flow events although these are occasionally intercepted (Ingley, 2020). 3.3 Regional summary of coastal water quality 10-year trends Trends in coastal water quality are firstly assessed from a regional perspective to decipher if trends are following similar patterns across all monitored sites in the Auckland region (Figure 3-3). Trend directions per site and per parameter are shown in maps in Figure 3-4. Further information on each parameter, is outlined in section 3.4 below. In the previous Auckland coastal water quality state and trends analysis, trend analysis was undertaken by pooling all data within harbours and major estuaries to provide a sub-regional assessment of water quality (Foley et al. 2018). The value of pooling data sets was questioned in relation to the river water quality analysis by Buckthought and Neale (2016) and it was recommended that aggregation of site-specific trends would provide a more robust approach. The approach taken here aggregates individual site trends to obtain a regional picture of the proportion of trends that were improving or degrading which enables assessment of overall water quality changes that may be difficult to identify from only examining individual site trends (Snelder and Fraser, 2018). The coastal water quality index, and concurrent river water quality reporting, focuses on soluble rather than total (soluble and particulate) forms of nutrients. Soluble forms are considered to be more ‘bioavailable’. There are different pathways that soluble and total forms follow from land to water and complex relationships and cycling between both forms. In most instances, trend directions at each monitored site were the same between soluble and total forms, however there were differences in the likelihood or probability of those trends. Notable differences in trends between soluble and total forms, and other paired parameters are discussed further in section 3.4. Over 60 per cent of monitored sites returned improving trends for turbidity. Over 80 per cent of monitored sites returned improving trends for total oxidised nitrogen, and chlorophyll α (phytoplankton) (Figure 3-3). Over 50 per cent of monitored sites returned improving trends for dissolved reactive phosphorus (Figure 3-3). However, lower detection limits obtained over time potentially induced improving trends for chlorophyll α, total oxidised nitrogen and dissolved reactive phosphorus, particularly where concentrations are currently low or there are a high proportion of values below the Coastal and estuarine water quality state and trends in Tāmaki Makaurau / Auckland 2010-2019 16
detection limit. Despite this analytical variability, where water quality trends are
improving, we can assume that water quality is at least being maintained in the current
state (McBride, 2019).
Over 70 per cent of monitored sites returned degrading trends for ammoniacal nitrogen
(Figure 3-3). A step increase in ammoniacal nitrogen was previously identified in
annual reporting (Ingley, 2019). This may induce degrading trends and further
assessment and partitioning of time periods for ammoniacal nitrogen is undertaken in
section 3.4.5. Over 70 per cent of monitored sites also had decreasing dissolved
oxygen saturation. In most instances, decreasing dissolved oxygen is indicative of
degrading water quality.
The greatest proportion of degrading trends in dissolved reactive phosphorus and
turbidity were associated with sites within the Waitematā Harbour (Figure 3-4).
                                     100%
        Percentage of sites (n=31)

                                     75%

                                     50%

                                     25%

                                      0%
                                                  Ammoniacal                               Chlorophyll
                                            TON                 DRP          Turbidity                   DO%
                                                      N                                         a
     NA                                      3%     16%          0%             0%             3%         0%
     Indeterminate                          16%      6%          6%            10%             6%        10%
     Very likely increasing                                                                              13%
     Likely increasing                                                                                    3%
     Likely decreasing                                                                                   23%
     Very likely decreasing                                                                              52%
     Very likely improving                  61%       0%        45%            45%             74%
     Likely improving                       19%       0%        13%            16%             10%
     Likely degrading                        0%      13%        13%            13%              3%
     Very likely degrading                   0%      65%        23%            16%              3%

Figure 3-3: Regional summary of the proportion of sites within each trend category
across coastal water quality index parameter.

Coastal and estuarine water quality state and trends in Tāmaki Makaurau / Auckland 2010-2019                   17
Figure 3-4: Summary maps of
10-year trends (2010-2019) in
coastal water quality
parameters per site.
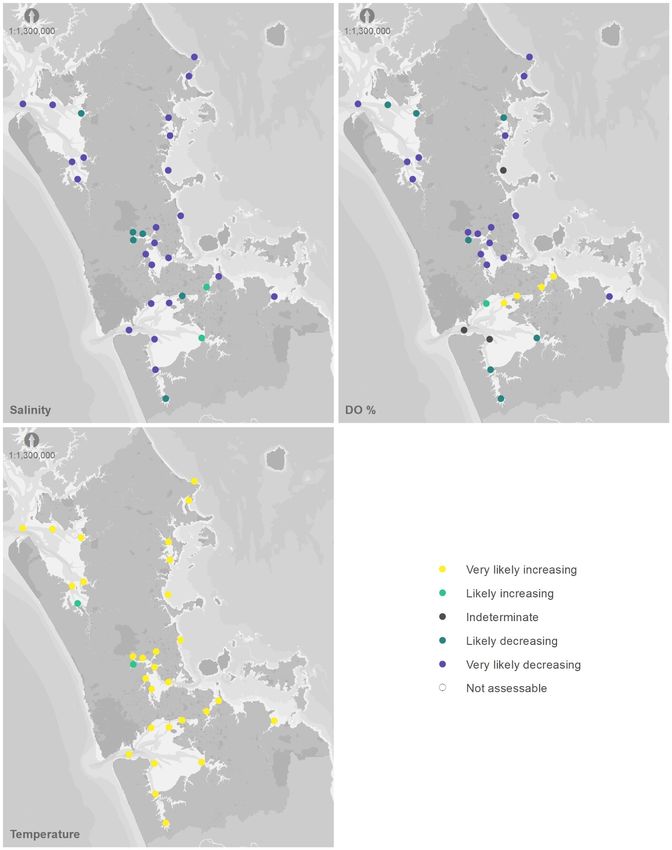
Coastal and estuarine water quality state and trends in Tāmaki Makaurau / Auckland 2010-2019 18Figure 3-5: Summary maps of 10-year trends (2010-2019) in coastal water quality physical parameters per site. Coastal and estuarine water quality state and trends in Tāmaki Makaurau / Auckland 2010-2019 19
3.4        Water quality trends relative to current state

3.4.1      Salinity

Salinity is a measure of the concentration of dissolved salts in the water column and
provides a proxy for the degree of freshwater input at a site. Spatial variation in median
salinity between sites varies by up to 10 ppt between the more saline open coastal
sites, and brackish upper tidal creek sites. Salinity is strongly seasonal at almost all
sites, where it is lower in winter due to greater rainfall and freshwater inputs,
particularly at upper tidal creek and estuarine sites. Tidal variation in salinity within
sites is controlled as far as possible by monitoring on the turn of the ebb tide.
Recent national-scale analysis of coastal and estuarine water quality found that the
influence of freshwater (using salinity as a proxy) explained the greatest variation in
water quality between coastal and estuarine water quality monitoring sites (Dudley et
al. 2020). Greater freshwater influence was associated with higher concentrations of
all forms of nitrogen and phosphorus (total and soluble), and higher turbidity, however;
chlorophyll α was not significantly associated with salinity (Dudley et al. 2020).
Regional assessments have also found that salinity explained a high proportion of
variation in overall water quality index scores between sites despite accounting for
large scale physical environmental differences in the use of separate guidelines for
tidal creek, estuarine, and open coastal environments (Ingley, 2020).
Over 90 per cent of monitored sites were found to have likely to very likely decreasing
trends in salinity, including the open coastal sites where salinity is generally well
buffered. This regional uniformity in trend direction suggests wider scale climatic
variation potentially associated with low rainfall in 2010, and higher rain fall particularly
across 2016 to 2018 (see section 3.2).

3.4.1.1 Magnitude of trends in salinity

The estimated rate of decrease in salinity across all sites averaged 0.1 ppt per annum
including the open coastal, and harbour mouth sites (1 ppt over 10 years) (Figure 3-6).
Annual median salinity typically varied by less than five ppt within each site over time
(except at tidal creek sites). This relatively small scale decrease in salinity over time
within sites is therefore not expected to be a significant driver of temporal trends in
water quality.
Tidal creek sites are typically more variable due to varying freshwater inflows where,
following heavy rain events, surface waters can be very fresh resulting in lower
probability (likely) trends in the Upper Waitematā Harbour with only Lucas Creek
assessed as ‘very likely decreasing’. However the high natural variability at this site

Coastal and estuarine water quality state and trends in Tāmaki Makaurau / Auckland 2010-2019   20
was still reflected in the very wide confidence intervals and poor estimate of the rate
of change at this site (Figure 3-6, Appendix C).
Annual median salinity at upper tidal creek sites varied by more than 10 ppt at
Brighams Creek and Rangitopuni Creek, and by more than seven ppt at Lucas Creek
and Paremoremo Creek. Salinity was highest in 2010, decreasing in 2011, increasing
in 2014 to 2015, decreasing again in 2016 to 2018, and increased in 2019. These
multiple trend directions in salinity broadly mirror patterns in regional annual average
rainfall (Johnson, 2021).
0.05
0.00
Annual Sen Slope (ppt)
-0.05
-0.10
-0.15
-0.20
-0.25
-0.30
-0.35
-0.40
Browns Bay
Shag Point
Shelly Beach
Orewa
Ti Point
Goat Island
Lucas Creek
Chelsea
Wairoa River
Tāmaki
Puketutu Point
Clarks Beach
Whau Creek
Makarau Estuary
Kaipara River
Kaipara Heads
Dawsons Creek
Hobsonville
Grahams Beach
Manukau Heads
Mahurangi Heads
Henderson Creek
Tauhoa Channel
East Coast Upper Waitematā Tām Wai Manukau Kaipara
Waitematā -aki -roa
Figure 3-6: Magnitude of ‘very likely decreasing’ trends in salinity at each site ordered
by increasing median salinity within each area. Bars represent 90% confidence intervals. Dashed
lines represent the precision limit (measurement resolution).
3.4.2 Temperature
Water temperature indirectly affects a range of other water quality parameters such as
dissolved oxygen, or the toxicity of ammonia. High water temperatures can also cause
direct stress to aquatic fauna, especially intertidal species. Sea-surface temperature
is strongly influenced by seasonal, and diurnal variability. Seasonally, temperatures
peak in January to February, and are coldest in July and August. Temperatures are
more variable in upper tidal creek and estuarine sites where they are influenced by
freshwater runoff and interaction with intertidal areas that are warmed during the low
tide window.
Coastal and estuarine water quality state and trends in Tāmaki Makaurau / Auckland 2010-2019 21Marine heatwave 4 conditions persisted around the region for the duration of 2018 and above average sea surface temperatures continued into the summer and autumn of 2019 within the Auckland region (NIWA, 2019). Consequently, it is unsurprising that all monitored water quality sites were found to have very likely increasing trends in temperature between 2010 to 2019, except for Brighams Creek and Kaipara River which were still likely increasing. Long term trends in sea surface temperature at Leigh Marine Laboratory Climate Station between 1967 to 2017 were found to not be significant, as any trends were masked by strong interannual variability (Pearce et al. 2017; Chiswell and Grant, 2018). A greater rate of warming has been projected for the west coast associated with changes to the East Australia Current within the Tasman Sea (Pearce et al. 2017). Marine heatwave events are expected to increase in frequency, and possibly duration under climate change predictions (Oliver et al. 2019). 3.4.2.1 Magnitude of trends in temperature The estimated rate of change was the lowest on the East Coast at approximately 0.05 to 0.06 oC per annum, and highest in the Manukau Harbour ranging from 0.11 (+0.05,- 0.04) oC per annum at the heads, to 0.18 (+0.11,-0.15) oC per annum in the upper reaches of the Waiuku Inlet (noting that Waiuku Town Basin covers a shorter time period) (Figure 3-7). However, the range of confidence intervals across all sites was wide varying by 0.03 to >0.1 oC which is suggestive of wide interannual variability in the rate of temperature change (Figure 3-7). The greatest estimates of increasing trends in temperature were across sites within the Manukau Harbour, at the mouth of the Kaipara Harbour, and Tāmaki Estuary where the lowest estimate of the rate of change (lower confidence interval) was 0.03 oC per annum (Waiuku Town Basin) but was typically over 0.05 oC per annum. A greater rate of warming within the Manukau and Kaipara harbours is consistent with projections of a faster rate of warming in the Tasman Sea. It is unclear why the Tāmaki Estuary may be warming at a faster rate than other monitored sites within the Hauraki Gulf or Waitematā Harbours. Sea surface temperature in the Auckland region is expected to increase by 2.5 oC by 2100 under the business-as-usual-climate scenario (NIWA, 2018). 4Marine heatwaves are defined as periods of five or more days with temperatures greater than the 90th percentile for the last 30 years of record. Coastal and estuarine water quality state and trends in Tāmaki Makaurau / Auckland 2010-2019 22
0.30

                         0.25
 Annual Sen Slope (oC)

                         0.20

                         0.15

                         0.10

                         0.05

                         0.00

                   -0.05
                                          Browns Bay

                                           Shag Point

                                        Shelly Beach
                                                Orewa
                                              Ti Point
                                          Goat Island

                                         Lucas Creek
                                  Paremoremo Creek

                                              Chelsea
                                             Panmure

                                        Wairoa River

                                           Weymouth
                                               Tāmaki

                                 Waiuku Town Basin*
                                     Māngere Bridge

                                       Puketutu Point
                                        Clarks Beach
                                         Whau Creek

                                    Makarau Estuary

                                       Kaipara Heads
                                      Dawsons Creek

                                   Rangitopuni Creek

                                          Hobsonville

                                     Grahams Beach
                                     Manukau Heads
                                          Hoteo River
                                    Mahurangi Heads

                                    Henderson Creek

                                     Tauhoa Channel
                                    East Coast    Upper      Waitematā   Tām Wai     Manukau    Kaipara
                                                 Waitematā               -aki -roa

Figure 3-7: Magnitude of ‘very likely increasing’ trends in temperature at each coastal
site, ordered by increasing median salinity within each area.
Bars represent 90% confidence intervals. Dashed lines represent the precision limit (measurement resolution).
* indicates a shorter time period of analysis.

3.4.3                           Dissolved oxygen

Dissolved oxygen is a fundamental aspect of the life-supporting capacity of water. Low
dissolved oxygen or hypoxia can have adverse effects on aquatic fauna from reduced
growth rates, to death in anoxic conditions. Dissolved oxygen varies seasonally and
over the course of the day (diurnally), the lowest levels of oxygen saturation typically
occur in the early morning before dawn, and maximum levels later in the afternoon.
As noted in section 2.1, monitoring is typically undertaken between 9:00 am and 2:00
pm which is more likely to be representative of daily maximum conditions, particularly
within the Manukau Harbour.
Over 70 per cent of monitored sites, including the more open coastal reference sites
at Goat Island and Ti Point were found to have likely to very likely decreasing dissolved
oxygen saturation. This is of potential concern for sites that already experience low
oxygen saturation, and potential hypoxic conditions in the surface waters (such as
Rangitopuni Creek) particularly as the discrete monitoring undertaken does not
capture daily dissolved oxygen minima, and effects may be underestimated.
Previously, regional patterns in dissolved oxygen were found to be increasing from
2007 to 2016 (Foley et al. 2018). Indications of a step increase in oxygen saturation in
2009 coinciding with a change in monitoring equipment potentially influenced the
earlier assessment.

Coastal and estuarine water quality state and trends in Tāmaki Makaurau / Auckland 2010-2019                    23
You can also read