Good health? Health and well-being in Brent - December 2014
←
→
Page content transcription
If your browser does not render page correctly, please read the page content below

Good health?
Health and well-being in Brent
December 2014

Brent JSNA
Joint Strategic Needs Assessment

www.brent.gov.uk

Brent
  JSNA
  Highlight
  Summary
  Report,
  December
  2014

NHS
  Brent
  CCG
  and
  LB
  Brent


Brent Joint Strategic Needs Assessment (JSNA), 2014
Highlight Summary Report
Introduction

Reducing the high levels of health inequality which exist throughout Brent and improving the
wellbeing and prosperity of those individuals and communities who experience high levels of
social exclusion and disadvantage requires a collaborative approach between the council
and its key partners. This refresh of Brent’s JSNA provides an analysis of the current and
future health needs of the local population. The overall aim of this refresh is to provide the
intelligence to inform action in order to improve outcomes for Brent’s communities and
residents.

The refreshed Brent JSNA 2014/15 has been divided up into four sections, which are as
follows:

       1.   Our people and place
       2.   The burden of ill health
       3.   Children and young people
       4.   Key health challenges in Brent

A series of information sheets have been produced to accompany this highlight report.
These contain more detailed information on particular themes and explore how a range of
underlying factors can influence the health and wellbeing of Brent’s communities and
residents and their associated health outcomes. The information sheets are as follows:

       1) People and place
       2) Children’s health
       3) Housing
       4) Diet, physical activity and obesity
       5) Economy
       6) Educational attainment
       7) Female Genital Mutilation (FGM)
       8) Green spaces
       9) Life expectancy and mortality
       10) Older people
       11) Smoking
       12) Substance misuse
       13) Sexual health
       14) Transportation
       15) Primary care
       16) Secondary care

As the population profile of Brent’s communities can change quite dramatically over time,
forecasting the future rates of certain long-term conditions is particularly challenging. To
ensure that the estimates of conditions including dementia and diabetes are accurate in such
a diverse setting as Brent, a strong understanding of our communities is required both now
and in the future.

A range of other supporting documents and data sources have been used to inform and
shape the content of this JSNA. These documents are listed at the end of this report and
provide an enhanced understanding of the different communities in Brent, the equality and
diversity characteristics of the residents who live there, and the varying needs around which
local service delivery is tailored.

                                                                                                1

Our people
and place

!"#$%&'()*&+,-./,-.%&(0112"3&4#56"%7&8#9#1:#"&;&
)+(&!"#$%&??@&2$A&B!&!"#$%&
&
1. OUR PEOPLE AND PLACE
Overview of LB Brent and its population characteristics
Brent is an outer London borough in north west London (figure 1). It has a population of
317,264 and is the most densely populated outer London borough, with a population density
of 74.1 persons/ha. The population is young, with 35.1% aged between 20 and 39. Brent is
ethnically diverse, with 65.0% of its population from black, Asian and minority ethnic (BAME)
backgrounds. Life expectancy for females born between 2010 and 2012 is 84.5 years, which
is higher than the male life expectancy of 79.9 years. Conversely, healthy life expectancy for
females born between 2009 and 2011 is 62.2 years, which is lower than the healthy life
expectancy of males, at 64.2 years.
&
&
Figure 1: Brent in London and Brent map.
© Crown copyright and database rights 2014 Ordnance Survey 100025260
!"#$%&'()**+",'-.'/#,'(%+%0(%01(
!"#$%&'()*+(,#&-"-.%$#*",&/01234 !"#$%&'
5".)(6"%+)&*,(&7"'".86&/01234 ""'$!"(
9:('$8(&6".)(&-'*;(&/(';(,#$8(&"?&-("-%(&%*:*,8&*,&)";*$%&'(,#(+&6".)*,8 %',"-
@()*+(,#)&?'"A&7%$;BC&9)*$,&$,+&A*,"'*#D&(#6,*;&8'".-)&/01234 &.,+-
E"'(*8,F7"',&'()*+(,#)&G*#6*,(&%";$%&-"-.%$#*",&/01224 ..,"-
H$*,&%$,8.$8(&*)&,"#&I,8%*)6&/01224 !#,%-
9%%&%*:(&7*'#6)&/01234 .$"#+
J.A7('&"?&+($#6)&/01234 "$&!!
K'"))&G((B%D&-$D&/012=4 ).!*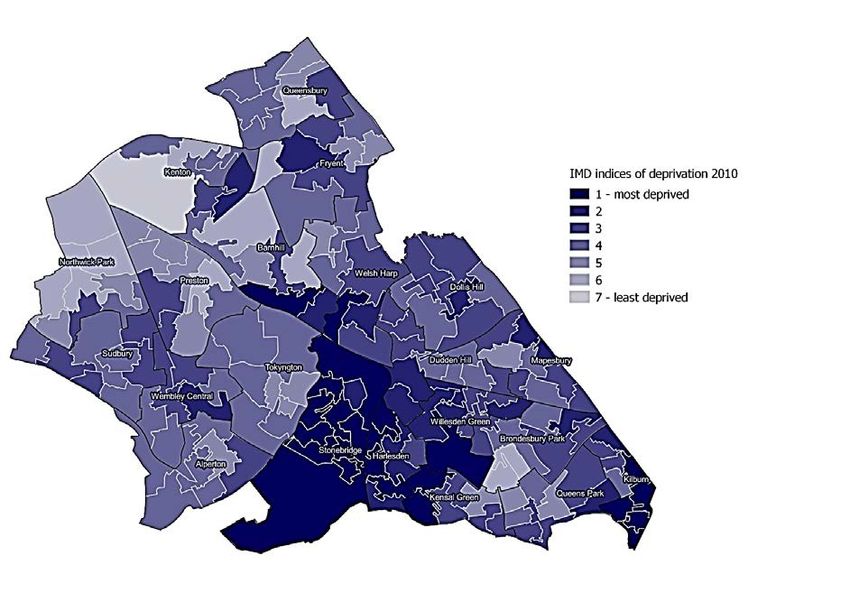
Brent
  JSNA
  Highlight
  Summary
  Report,
  December
  2014

NHS
  Brent
  CCG
  and
  LB
  Brent


Population

The total population of Brent is 317,264, with 35.1% of residents (111,483) aged between 20
and 39, giving the borough a young overall age structure, as illustrated in figure 2, which is
similar to the age profile for London.

                                                                                  Females


                                                                                  Males


       -4000   -3000      -2000       -1000         0        1000          2000      3000       4000


Figure 2: Brent’s population by age and gender, 2013.
Source: ONS (Office for National Statistics) mid-year estimates 2013

Percentage changes between 2001 and 2011 for some of the key age groups in Brent

                                                                              17%
       38%                   12%
                                                    8%

          0- 4 years           5-19 years           65+ years              75+ years

The CCG is responsible for its registered population of 353,372, the number of people
registered with a Brent CCG GP practice. A patient does not necessarily have to live in Brent
to be registered with a Brent GP.

                                                                                                              3

Brent
  JSNA
  Highlight
  Summary
  Report,
  December
  2014

NHS
  Brent
  CCG
  and
  LB
  Brent


Ethnicity

In Brent, the black, Asian and minority ethnic (BAME) groups make up 65.0% of the
population, compared to 41.8% in London. This has increased since 2011, where BAME
groups made up 63.7% of the population. About one third (36.0%) of the population are
Asian, 35.0% white and 21.1% black1 (figure 3).

                                                                                                                                                                                                               White                                Asian   Black   Other

                 2011

                2014

Figure 3: Population change in Brent 2011-2014
Source: 2011 Census, ONS mid-year estimates 2013

There is no information published at ward level about ethnicity after the 2011 Census. In
2011, at ward level:
                             •                            the largest white populations were in Mapesbury, Brondesbury Park, Queens Park
                                                          and Kilburn wards (figure 4.a)
                             •                            the Asian population is largest in Alperton, Wembley Central and Kenton (figure 4.b)
                             •                            Stonebridge, Harlesden and Kensal Green wards have the highest black population
                                                          (figure 4.c)


1
          GLA ethnicity trend-based borough projections 2012

                                                                                                                                                                                                                                                                            4

Brent
  JSNA
  Highlight
  Summary
  Report,
  December
  2014

NHS
  Brent
  CCG
  and
  LB
  Brent


Figure 4.a

Figure 4.b

                                                                           5

!"#$%&'()*&+,-./,-.%&(0112"3&4#56"%7&8#9#1:#"&;&
)+(&!"#$%&??@&2$A&B!&!"#$%&
&

Figure 4.c
Figure 4 (a-c): Ethnic groups by ward
Source: 2011 Census
&
The proportion of people belonging to the different ethnic groups in Brent varies with age.
Figure 5 illustrates that among younger people (particularly those aged 5-15) the white
population is lower and the black population is higher than for the borough as a whole.

    27% children
    under 5 are black                   black
                                        21%            white
    30%    people
                                                       36%                  23% people
                                  other9%                                   age 5-15 are white
    age 5-15 are black

                                            Asian
                                            34%

                                             Under 5
                                                5-15
                                                                                                  /

Figure 5: Ethnic groups by age
Source: 2011 Census

                                                                                                 H&
&
!"#$%&'()*&+,-./,-.%&(0112"3&4#56"%7&8#9#1:#"&;&
)+(&!"#$%&??@&2$A&B!&!"#$%&
&
Country of birth/

Figure 6 shows the diverse range of countries where Brent residents were born, identifying
the number of people born in a particular country.

Numbers of Brent people born in particular countries

Figure 6: Country of birth. Source: 2011 Census

Language

There are many different languages spoken in Brent. English is the main language for 62.8%
or the population (figure 7). Gujarati is the main language for 7.9% of the population and
Polish is the main language for 3.4% of the population.

                                                                                             I&
&
!"#$%&'()*&+,-./,-.%&(0112"3&4#56"%7&8#9#1:#"&;&
)+(&!"#$%&??@&2$A&B!&!"#$%&
&

                                                  Gujarati 7.9%

                         62.8%
     149
                                                    Polish 3.4%
                             speak
                                                    Arabic 2.7%
                            English
                         as their main           Portuguese 2.2%
    languages             language                  Tamil 2.1%

      spoken                                       Somali 2.0%
                                                 Romanian 1.9%
      in Brent                                      Urdu 1.5%
                                                    Farsi 1.1%              In 1 in 5
                                                                           households
                                                                            nobody
                                                    Other 12.4%          speaks English
                                                                          as their main
                                                                            language
                                                                   &&&                       &

Figure 7: Languages spoken in Brent
Source: 2011 Census
/
Religion

Most people in Brent have a religion, while 10.6% of the population said they did not.
Christianity is the most popular religion in Brent; 41.5% of the population are Christian,
18.6% Muslim and 17.8% Hindu.

Since the 2001 Census, Christianity has declined by around 7%, while Islam has increased
by around 9%, nearly doubling since 2001 and becoming the second most popular religion in
Brent (figure 8).
                  2001                                    2011

    Christianity 48%                                        41%

     Hinduism 17%                                           19%

           Islam 12%                                        18%

    No religion 10%                                         11%

      Judaism 3%                                            1%

     Buddhism 1%                                            1%
                                                                         &&&&&&&

Figure 8: Changes in religion in Brent since 2001
Source: 2001 Census, 2011 Census

                                                                                                 J&
&
Brent
JSNA
Highlight
Summary
Report,
December
2014
NHS
Brent
CCG
and
LB
Brent
Lifestyle
Eating well
The benefits of healthy eating, and in particular of eating 5 portions of fruit and vegetables a
day, are widely recognised and include a reduced risk of heart disease, stroke and cancer.
Public Health England estimates that only 37% of the Brent population were achieving 5 a
day during the period 2006-082.
Physical activity
Regular physical activity confers a range of benefits on health and wellbeing. Levels of
physical activity in Brent have been below the London and England averages since
2005/063. Over half the adult population in Brent (52.8%) take part in no moderate intensity
sport or physical activity for at least 30 minutes duration a week4. This compares to the
London average of 44.5% and the England average of 44.4%.
Access to indoor sports facilities
Brent offers three public sports centres: Willesden Sports Centre, Vale Farm Sports Centre
and Bridge Park Community Leisure Centre. Willesden and Vale Farm’s facilities include the
only two public swimming pools in the borough. In 2013/14 there were just over 1.4 million
visits5 to these three centres, a number which is increasing annually. There are a small
number of small private gym facilities in the borough and some schools make their sports
facilities available to the local community for hire.
Access to parks and open spaces
Brent has the lowest proportion of green space of all outer London boroughs. As cited by the
Marmot Review, green spaces and infrastructure improve both mental and physical health
and have been shown to reduce health inequalities. To help improve the mental and
physical health of residents, the council faces a key challenge in making what space it does
have as welcoming and accessible to all borough residents as possible. Between March
2012 and February 2013, only 8.8% of people in Brent aged 16 and over utilised outdoor
space for either exercise or health reasons. This is lower than both the London (10.5%) and
England (15.3%) averages6.
Brent’s 74 parks, ranging in size from Fryent County Park (115ha) to numerous small pocket
parks throughout the borough, are used for many different activities. Outdoor gyms were
installed in 6 parks in July 2013. These are free to use and have led to an increase in the
physical activity levels of many users. Free guided health walks are another popular activity,
with 119 people taking part in guided health walks in March 2014. Similarly, Park Run, a
free-to-attend 5km run held every Saturday morning in Gladstone Park, attracts around 100
weekly participants. Brent’s parks and open spaces provide access to various other sporting
facilities, including multi-use game areas, tennis courts, and football, rugby and cricket
pitches. Brent’s parks and open spaces also contain 23 allotment sites.
2
Health Survey for England, 2006-2008
3
Sport England, Active People’s Survey (2005/06 to 2012/13)
4
Sport England, Active People Survey, results from APS 7 (2012/13)
5
Figure derived from LB Brent Sports and Parks service
6
Natural England, 2012/13: Monitor of Engagement with the Natural Environment (MENE) survey.
Respondents to the survey were asked to indicate how many visits they had taken to the natural
environment in the last 7 days
9
Brent
  JSNA
  Highlight
  Summary
  Report,
  December
  2014

NHS
  Brent
  CCG
  and
  LB
  Brent


Wider determinants of health

As public health is influenced by many factors other than the healthcare received,
opportunities exist to integrate public health priorities into some of the key wider
determinants of health such as education, housing and transport. The model of health
determinants (figure 9) illustrates the key roles local government could have in these
particular areas.

Figure 9: Map of the wider determinants of health. Developed by Barton and Grant (2006)
(based on Dahlgren and Whitehead, 1991))

Housing tenure

The total number of dwellings in Brent has increased by 8,016 (or 8%) since 2001. Of the
110,286 households in Brent in 2011, just under half of these (48%) were houses or
bungalows (figure 10). Just over half (51%) were flats. Nearly 1% of Brent’s accommodation
was caravans or temporary structures. Other key points to note include:

       •   Social rented housing in Brent has increased from 23,881 in 2001 to 26,591 in 2011,
           a change of 11.4%; although as a proportion of the overall stock it has remained
           static. This trend is similar to London, where the total number of dwellings increased
           by 9.9% between 2001 and 2011;

       •   Owner occupation now accounts for 44% of the borough’s households. In 2001, this
           figure was 56%; private rentals make up 32% of the households (compared to 18% in
           2001);

       •   The mean household size went up from 2.6 in 2001 to 2.8 in 2011.

                                                                                               10
Brent
  JSNA
  Highlight
  Summary
  Report,
  December
  2014

NHS
  Brent
  CCG
  and
  LB
  Brent


                                                                                                                                                                                                       1%
                                                                                                                                                                  0%                                                                                2%               Caravan or Other Mobile or
                                                                                                                                                                                                                                                                     Temporary Structure
                                                                                                                                                                                                                                                         7%          Shared Dwelling

                                                                                          32%                                                                                                                                                                        Flat, Maisonette or Apartment (In
                                                                                                                                                                                                                                                                     Commercial Building)
                                                                                                                                                                                                                                                               17%
                                                                                                                                                                                                                                                                     Detached House or Bungalow

                                                                                                                                                                                                                                                                     Flat in part of a Converted or Shared
                                                                                                                                                                                                                                                                     House

                                                                                                                                                                                                                                                                     Terraced House/Bungalow
                                                                                                                                                                                                                                                              17%

                                                                                                                                                                                                                                                                     Semi-Detached House/Bungalow
                                                                                                                                                                 24%

                                                                                                                                                                                                                                                                     Flat in a Purpose-built Block of Flats
                                                                                                                                                                                                                                                                     or Tenement

Figure 10: The main types of accommodation in Brent, Source: ONS 2011 Census

Housing pressures in Brent

Since 2001, the population in Brent has expanded faster than predicted, causing a rise in the
demand for affordable housing. Coupled with an increased demand for larger family-sized
homes, there is a range of pressures to meet these needs.

Rising rents and house prices are some of the biggest challenges which residents in Brent
are faced with. Approximately 30% of employees living in the borough are paid less than the
London living wage. Finding affordable housing is therefore a particular challenge for many
families7. These pressures have led to Brent (18%) having the second highest rate of
overcrowding in London after Newham (25%). Overcrowded housing stock and a general
lack of space and land available for housing development presents a number of related
concerns. Rates of respiratory disease and tuberculosis tend to be higher in overcrowded
houses8. For children and young people, other issues include:

                                                           •                            Under achievement in school or college due to a lack of space to do homework;

                                                           •                            Anxiety, depression and stress9.

Levels of statutory homelessness in 2012/13 are worse in Brent than the England average10.
Factors such as our focus on regeneration, which prioritised households moving within large
demolition and rebuilding schemes, and loss of stock due to Right To Buy schemes, are
factors which have led to a large number of households residing in temporary


7
  New Policy Institute. London’s Poverty Profile 2013, webpage:
http://npi.org.uk/files/3313/8150/0123/Final_full_report.pdf
8
  Better Housing, briefing 20: Tackling the prevalence of tuberculosis amongst poorly housed minority
ethnic communities in London: www.better-housing.org.uk
9
  Shelter, 2005, Full house: how overcrowded housing affects families:
http://england.shelter.org.uk/__data/assets/pdf_file/0004/39532/Full_house_overcrowding_effects.pdf

10
   Public Health England, Brent Health Profile 2014

                                                                                                                                                                                                                                                                                                              11
Brent
  JSNA
  Highlight
  Summary
  Report,
  December
  2014

NHS
  Brent
  CCG
  and
  LB
  Brent


accommodation. Additionally, a large proportion of private rented sector properties in Brent
are seen as ‘non-decent’11.

Fuel-poor households and excess winter mortality

The government considers households to be in ‘fuel poverty’ if they have to spend more than
10% of their household income on fuel to keep their home in a satisfactory condition. Poor
quality housing stock (i.e. where houses lack energy efficiency measures or suitable
insulation) coupled with high levels of deprivation and poverty can contribute to increased
rates of excess winter mortalities (EWM).

The EWM index which the ONS uses to calculate the number of EWM against average non-
winter deaths shows that there were around 22% more deaths in December to March
2011/12 than in non-winter months in Brent, a difference which is similar to what was seen
nationally during that period. Nationally, the majority of these deaths were among individuals
aged 75 and over of both sexes, with females aged 85 and over having the greatest number
of EWM. Figure 11 shows the main causes of EWM by age in England and Wales in
2011/12. Respiratory disease accounts for the greatest proportion of EWM for all age
groups, followed by circulatory disease. In Brent, older people who live in the most deprived
parts of the borough and suffer from respiratory problems are likely to be most at risk of
EWM.

Approaches to reduce EWM include increasing the uptake of flu vaccinations among older
people. In 2012/13, 72.7% of eligible adults aged 65 and over in Brent received the flu
vaccine. The England average was 73.4% and London average was 71.2%. In Brent, 57.1%
of individuals aged between 6 months and 65 years old who were considered at risk of
contracting the flu received the flu vaccine in 2012/13. This compares to 51.3% in England
and 50.9% in London12.


11
   The Poverty Site’s definition of non-decent homes: 'Non-decent' homes are those which do not
meet the government's standard for 'decent homes' whereby housing should: be above a statutory
minimum standard (i.e. be fit for habitation); provide a reasonable degree of thermal comfort; be in a
reasonable state of repair; and provide reasonably modern facilities and services
http://www.poverty.org.uk/78/index.shtml#def
12
   Public Health England, Public Health Outcomes Framework

                                                                                                                                                                                                                                                    12
Brent
  JSNA
  Highlight
  Summary
  Report,
  December
  2014

NHS
  Brent
  CCG
  and
  LB
  Brent


                                     9000
                                                                                                                                               Circulatory diseases                                                                                         Respiratory diseases
                                     8000
                                                                                                                                               Dementia and Alzheimers                                                                                      Injury and poisoning
                                     7000

                                     6000
            No. of deaths

                                     5000

                                     4000

                                     3000

                                     2000

                                     1000

                                                                0
                                                                                                                                      0-64                                                                                                          65-74    75-84           85+   All ages
                                                                                                                                                                                                                                                            Age group

       Figure 11: Causes of EWM in England and Wales, 2011/12

Living in a cold, damp home increases the risk of poor mental and physical health and may
prolong the time taken for a person to recover from illness. Cold, damp houses encourage
mould growth, which increases the risk of respiratory infection. The percentage of
households estimated to be fuel-poor in 2012 in Brent (11.6%) was higher than both the
London (8.9%) and England (10.7%) averages13.

Welfare reforms

Recent national welfare reforms and changes to the benefit system have led to a range of
associated issues for Brent residents. Among the provisions of the Welfare Reform Act 2012
are changes to housing benefit regime. Key changes have included the introduction of the
under occupancy penalty. This reduces the amount of benefit paid to claimants who are
deemed as having excessive amounts of living space in the property which they are renting.

Employment and unemployment

ONS mid-year 2012 population estimates show that 69% of Brent’s population is of working
age (i.e. aged between 16 and 64). During the period October 2012 to September 2013,
11% of the working age population were unemployed14. This compares to the London
average of 8.7% and the national average of 7.7%.

High levels of unemployment in Brent coupled with people having less disposable income
means that the living standards of many families are compromised. Issues such as food
poverty are also becoming an increasing concern for some families in the borough.

The employment rate varies by 16.9% for different ethnicities. Figure 12 illustrates that
Indian people have the highest rate of employment (69.0%), and black people the lowest
(52.1%).


13
  Department for Energy and Climate Change: fuel poverty indicator, 2012 (low income, high cost)
14
  ONS Annual Population Survey: model-based estimates (% is a proportion of economically active
people)

                                                                                                                                                                                                                                                                                              13
Brent
  JSNA
  Highlight
  Summary
  Report,
  December
  2014

NHS
  Brent
  CCG
  and
  LB
  Brent


                                                             45.0
       Other ethnic group                                                           74.5
                                                                           60.4

                                                                                         Female
                                                                     56.8
                   Black                                      46.0                       Male
                                                                  52.1
                                                                                         All

                                                                       58.8
              Pakistani/
                                                                              67.5
             Bangladeshi
                                                                            63.3

                                                                     55.4
                   Indian                                                                80.6
                                                                                  69.0

                                                                 50.6
       Mixed ethnic group                                                    65.0
                                                                     55.1

Figure 12: Employment rate by ethnicity and sex. Source: Annual Population Survey, 2014

There are 34,600 working age people in Brent with a long-term illness or disability. Of these
16,800 (48.5%) are in employment. This is lower than both the London rate (59.8%) and the
England rate (63.2%).

The percentage of people with depression, learning difficulties, mental health issues or other
nervous disorders in employment is 23% also lower than both the London rate (32.2%) and
the England rate (36.4%), as illustrated in figure 13.

                                                                                                  14
Brent
  JSNA
  Highlight
  Summary
  Report,
  December
  2014

NHS
  Brent
  CCG
  and
  LB
  Brent


       70

       60

       50

       40
                                                                           Brent
       30
                                                                           London
       20                                                                  England

       10

        0
            In employment with health % with depression, learning
              conditions or illnesses  difficulties, mental health
               lasting more than 12       issues and nervous
                    months (%)           disorders - employed

Figure 13: Percentage of people in employment with long-term conditions.
Source: Annual Population Survey, 2014

Job Seekers Allowance (JSA) claimants

In May 2014, the Job Seekers Allowance (JSA) claimant rate in Brent was 3.3% (7,161
claimants) for people aged 16 to 64, which is higher than the London (2.7%) and Great
Britain average (2.6%). Although this rate has fallen since 2012 in Brent, there are significant
inequalities at ward level (figure 14).

                                                                                             15
Brent
  JSNA
  Highlight
  Summary
  Report,
  December
  2014

NHS
  Brent
  CCG
  and
  LB
  Brent


                            12

                            10
       % of JSA claimants

                             8
                                                  Brent (3.6%)            England and London(3%)

                             6

                            4

                             2

                             0

                                                                         Ward

Figure 14: Percentage of JSA claimants in January 2014 for 16-64-year-olds by Brent wards.
Source: ONS claimant count

Deprivation

Brent has areas of both relative affluence and deprivation; the latter is measured using the
following seven indicators:

                                 •   income
                                 •   employment
                                 •   health deprivation and disability
                                 •   education, skills and training
                                 •   barriers to housing and services
                                 •   crime
                                 •   living environment

Deprivation is measured in deciles, on a scale of one to ten, where one is the most deprived
and ten is the least. Measuring deprivation at lower super output area (LSOA - areas with
between 1000 and 3000 residents) shows a variation across Brent from deprivation deciles
one to seven (figure 15).

                                                                                                   16
Brent
  JSNA
  Highlight
  Summary
  Report,
  December
  2014

NHS
  Brent
  CCG
  and
  LB
  Brent


Figure 15: Indices of deprivation 2010. Source: IMD 2010 - data.gov.uk
Brent has high deprivation levels compared to neighbouring London boroughs with over a
quarter of its LSOAs in deprivation deciles one or two.

Air quality

Poor air quality is a significant public health problem, particularly in larger cities such as
London where high volumes of traffic and local industries or other pollutant sources
contribute to increased concentrations of atmospheric pollutants. It is estimated that the
burden of particulate air pollution in the UK in 2008 is equivalent to approximately 29,000
deaths. The presence of significant major routes running through the borough, notably the
North Circular, leads to increased exposure to nitrogen oxides and particulate matter. As
more people live in closer proximity to pollutant sources in the south of the borough, the
impact of poor air quality tends to be worse there. However, air pollution is not necessarily
restricted to certain parts of the borough and has an impact on every resident.

Long-term exposure to air pollution is known to exacerbate certain respiratory conditions
such as Chronic Obstructive Pulmonary Disease (COPD). In Brent, emergency hospital
admissions for COPD for the period 2006/07 to 2010/11 were mapped (figure 16). It was
found that COPD admissions tended to be highest around the southern and central fringes
of the borough. The extent to which air pollution in these localities has contributed to COPD
admissions is difficult to quantify. Pre-existing respiratory conditions and smoking are known
contributors which could cause COPD.

                                                                                                 17
!"#$%&'()*&+,-./,-.%&(0112"3&4#56"%7&8#9#1:#"&;&
)+(&!"#$%&??@&2$A&B!&!"#$%&
&

Figure 16: Emergency hospital admissions for COPD, standardised admissions ratio –
2006/07 to 2010/11. Source: Public Health England: produced from Hospital Episode
Statistics (HES)

Transportation and road traffic accidents

Car ownership in Brent is relatively low, with 40% of Brent’s households (or 2 in 5) having no
access to a private motor vehicle. Kilburn (4,802) has the greatest number of households
without access to a car or van, whereas Kenton (763) has the least. Overall, the total
number of cars or vans in the borough in 2011 remained unchanged compared to 2001, with
approximately 88,000 vehicles 15.

The rate of serious injury and deaths on Brent’s roads is currently 25.8 per 100,000 of the
population, which is lower than the England average rate of 40.5 per 100,000 of the
&&&&&&&&&&&&&&&&&&&&&&&&&&&&&&&&&&&&&&&&&&&&&&&&&&&&&&&&&&&&&
15
     ONS 2011 Census

                                                                                              =J&
&
Brent
JSNA
Highlight
Summary
Report,
December
2014
NHS
Brent
CCG
and
LB
Brent
population. Between 2010 and 2012, 81 people were killed or seriously injured on Brent’s
roads. Of these, 8 were children aged 0-1516.
The number of road casualties among children and young people in Brent aged under 16
varies by ethnic group. Figure 17 provides a breakdown of child road casualties by ethnicity
during the period 2009-13. The Afro-Caribbean (31%) group had the highest proportion of
road casualties during this period and the Oriental (1%) group had the lowest. During this
five-year period, there were 128 road casualties among Afro-Caribbean children and 4
casualties among the Oriental group.
In total, there were 411 child casualties between 2009 and 2013 among all ethnic groups
with males comprising 58% of these casualties and females, 42%.
35%
31%
30%
Percentage of child casualties
26%
25%
20%
17% 17%
15%
10%
4%
5%
3%
1%
0%
Afro-carribean Not known White skinned Asian Arab Dark skinned Oriental
European European
Ethnicity
Figure 17: Percentage of child casualties by ethnicity*, 2009-13. Source: LB Brent
Transportation Service. Data originally collated by the Metropolitan Police Service (MPS).
*Ethnic groupings included in figure 17 based on MPS definitions.
16
Public Health England, Brent Health Profile 2014
19
The burden
of ill health
Brent
  JSNA
  Highlight
  Summary
  Report,
  December
  2014

NHS
  Brent
  CCG
  and
  LB
  Brent


                             2. THE BURDEN OF ILL HEALTH

Health inequalities in Brent

Life expectancy at birth

Life expectancy for both men and women born in 2010-12 in Brent is higher than the
England average: 79.9 years for males and 84.5 years for females17. However, the overall
life expectancy at borough level masks a pronounced variation between the most and least
deprived parts of Brent. Life expectancy for children born between 2010 and 2012 is 5.3
years lower for men in the most deprived parts of Brent than the least deprived parts. For
females, the difference is less pronounced at 3.8 years. This is reflected in figure 18, which
illustrates the slope index of inequality and the life expectancy gap for males and females
living in Brent.

Figure 18: Slope Index of Inequality 2010-12. Source: Public Health England, Brent Health
Profile 2014

A number of different diseases account for this gap: for men, circulatory disease accounts
for 25% of the gap in life expectancy and cancer for 22%. For women, cancer was the
largest contributor at 31%, with respiratory disease accounting for 25% of the gap18 (figure
19).


17
                Public Health England, Public Health Outcomes Framework (PHOF) Overarching Indicators
18
                Public Health England, The Segment Tool for Brent (data for 2009-2011)


                                                                                                                                                                                                                                                    20
Brent
  JSNA
  Highlight
  Summary
  Report,
  December
  2014

NHS
  Brent
  CCG
  and
  LB
  Brent


       100%

       90%                                                                   Circulatory, 18%
                              Circulatory, 25%

       80%

       70%
                                                                               Cancer, 31%
                               Cancer, 22%
       60%

       50%
                             Respiratory, 15%
       40%                                                                   Respiratory, 25%
                              Digestive, 7%
       30%
                              External Causes,
                                    14%
       20%                                                                   Digestive, 13%

       10%                      Other, 13%                                 External Causes, 2%
                                                                              Other, 11%
!"#$%&'()*&+,-./,-.%&(0112"3&4#56"%7&8#9#1:#"&;&
)+(&!"#$%&??@&2$A&B!&!"#$%&
&
2008-2012,
Figure 20: Life expectancy at birth for males born in 2008 2012, Source: ONS, PHE (Local
Health Mapping Tool)&
;;&
&!"#$%&'()*&+,-./,-.%&(0112"3&4#56"%7&8#9#1:#"&;&
)+(&!"#$%&??@&2$A&B!&!"#$%&
&
Figure 21: Life expectancy at birth for females born in 2008-2012, Source: ONS, PHE (Local
Health Mapping Tool)
NB. Note that life expectancy data used in figures 18 to 21 relates to different time periods.
;C&
&Brent
JSNA
Highlight
Summary
Report,
December
2014
NHS
Brent
CCG
and
LB
Brent
Healthy life expectancy
As important, if not more so, as how long people can expect to live, is how long they can
expect to live in good health, which is termed healthy life expectancy. On average, healthy
life expectancy was 62 years compared to an overall life expectancy of 79.9 years for Brent
males born in 2010-12. Females born over the same period can expect 62 years in good
health compared to a total life expectancy of 84.5 years19.
How people in Brent describe their own health
In the 2011 Census, the vast majority of people in Brent (83%) described their health as
“very good” or “good” (figure 22), which offers a similar picture to England and Wales as a
whole (81%). Five per cent described their health as “very bad” or “bad”, with the remaining
12% saying it is “fair”.
At ward level, Kilburn had the highest number of residents who assessed their health as
“very good” (8,448 residents), while Kenton had the lowest number of residents (5,502
residents) in “very good” health. Harlesden had the highest number of residents with both
“good” health (5,815 residents) and those reporting “very bad” health (313 residents).
4%
1%
Very Good
Health
12% Good
Health
48% Fair Health
35% Bad Health
Very Bad
Health
Figure 22: Percentage of residents describing their general health in relation to five
categories (self-reported health) in Brent. Source: ONS 2011 Census
Across the borough, there were only 4 wards where 6% to 7% of residents reported that they
had “bad” or “very bad” health.
How people in Brent feel their health impacts on their day-to-day activities
In Brent, 7% of the total population (21,669 residents) reported in the 2011 Census that their
day-to-day activities were “limited a lot” (figure 23). This compares to the London average of
19
ONS, Healthy Life Expectancy at Birth: Clinical Commissioning Groups (2010-12). Note: the
proportion of life spent in 'good' health is a relative measure which divides HLE by LE, and can be
expressed as a percentage.
24
Brent
  JSNA
  Highlight
  Summary
  Report,
  December
  2014

NHS
  Brent
  CCG
  and
  LB
  Brent


6.7% and the England average of 8.3%. By way of contrast, 85.6% of the total population
feel that their day-to-day activities are “not limited at all”. This is similar to the London
average of 85.8% and is slightly better than the England average of 82.4%.

Nearly 8% of people in Brent feel that their day-to-day activities are “limited a little”. The
comparable London figure is 7.4% and for England, 9.3%. The levels of self-reported
disability vary throughout Brent. In the 2011 Census, Harlesden had the greatest number of
residents reporting they were not limited by health problems (14,574 residents in total) while
Kenton had the lowest number (10,218 residents).

                                 7.0%

                                         7.5%

                                                            Day-to-Day Activities
                                                            Limited a Lot
                                                            Day-to-Day Activities
                                                            Limited a Little
                                                            Day-to-Day Activities Not
                                                            Limited

                  85.6%

Figure 23: How people in Brent feel their health impacts on their day-to-day activities.
Source: ONS 2011 Census

Large parts of the borough reported that 7% to 8% of residents felt that their health “limited a
lot” their day-to-day activities, as illustrated in figure 24.

                                                                                                25
Brent
  JSNA
  Highlight
  Summary
  Report,
  December
  2014

NHS
  Brent
  CCG
  and
  LB
  Brent


Figure 24: Percentage of day-to-day activities limited by health “a lot” by ward. Source: ONS
2011 Census.

Mortality and morbidity in Brent

Premature mortality relates to those deaths which occur under the age of 75 years.

Between 2010 and 2012, the rate of overall premature deaths in Brent was 334 people per
100,000 of the population20. Presently, the main causes of premature death in Brent are:

                             1) Cancer
                             2) Cardiovascular disease
                             3) Respiratory disease

Cancer

The premature mortality rate for cancer in Brent is significantly better than that for England
and has fallen over the past 10 years (figure 25). It currently stands at 127 deaths per
100,000 people aged under 75 years, compared to the England figure of 146 per 100,000
aged under 75. This equates to 233 premature deaths in Brent between 2010 and 201221.
For males in Brent aged under 75, the mortality rate in 2010-12 due to cancer was 146 per
100,000 of the population. This was lower than the England rate of 164 per 100,000 of the
population.

For females in Brent, the premature mortality rate due to cancer in 2010-12 was 111 per
100,000 of the population, which was lower than the England rate of 131 per 100,000 of the
population22.


20
   Public Health England, Longer Lives, 2010-2012
21
   Public Health England, Brent Health Profile 2014
22
   Public Health England, PHOF: Healthcare and premature mortality indicators


                                                                                                                                                                                                                                                    26
Brent
  JSNA
  Highlight
  Summary
  Report,
  December
  2014

NHS
  Brent
  CCG
  and
  LB
  Brent


Figure 25: Source: Public Health England, Brent Health Profile 2014

Cardiovascular disease (CVD)

CVD includes coronary heart disease (CHD) and stroke. Age plays a key role in CVD
mortality rates and the prevalence of CVD increases significantly beyond 40 years old23.

Between 2009 and 2011, CVD accounted for 26% of deaths in Brent for people under 75
and 41% of deaths for people aged 75 and over. This is higher than the prevalence in
England for both under 75s (24%) and for those aged 75 and over (35%).

Premature mortality rates from CVD in Brent have steadily decreased by 60% over the last
20 years. Despite this, the rates of premature death from CVD in Brent remain worse than
the England average (figure 26). The premature mortality rate from CVD between 2010 and
2012 in Brent was 94 per 100,000 of the population. The England rate was 81 per 100,000
of the population.

For males in Brent aged under 75 the mortality rate in 2010/12 due to CVD was 130 per
100,000 of the population. This was higher than the England rate, which was 114 per
100,000 of the population. The mortality rate due to CVD among the female population in
Brent aged under 75 was 61 per 100,000 of the population. The England rate was lower at
50 per 100,000 of the population24.

The estimated prevalence of diagnosed CHD varies between practices in Brent. The
percentage of people on GPs’ lists with a recorded diagnosis of CHD was 3.5% in Brent
compared to 4.7% in England25. Given the higher death rates in Brent, this suggests
possible under-diagnosis.


23
   Public Health England, Cardiovascular Disease Health Profile for Brent, 2013
24
   Public Health England, PHOF: Healthcare and premature mortality
25
   Public Health England, National General Practice Profiles for NHS Brent CCG, 2011

                                                                                                                                                                                                                                                    27
Brent
  JSNA
  Highlight
  Summary
  Report,
  December
  2014

NHS
  Brent
  CCG
  and
  LB
  Brent


Figure 26: Source: Public Health England, Brent Health Profile 2014

Respiratory disease

Respiratory diseases (which include COPD and asthma) account for approximately 15%26 of
all deaths in Brent and are the third major killer following circulatory disease and cancer.
COPD alone accounts for around a quarter of deaths due to respiratory disease in Brent.
COPD includes two lung diseases: chronic bronchitis and emphysema. Although certain
factors such as the presence of air pollution are known to exacerbate COPD, smoking is
recognised as the primary cause.

The premature mortality rate from respiratory disease in Brent in 2010-12 was 28.1 per
100,000 of the population. This represents 149 deaths. The England rate was slightly higher
at 33.5 deaths per 100,000 of the population27.

For males in Brent, the rate of premature mortality due to respiratory disease in 2010-12 was
37 per 100,000 of the population, which was lower than the England rate of 40 per 100,000
of the population. For females in Brent, the rate of premature mortality due to respiratory
disease in 2010-12 was 20 per 100,000 of the population, which was lower than the England
rate of 28 per 100,000 of the population28.

Other key causes of premature death

Other key causes of premature death in Brent include liver disease and suicide.

The rate of premature deaths due to liver disease in Brent between 2010 and 2012 was 17.3
per 100,000 of the population, which is below the England rate of 18 per 100,000 of the
population.


26
   National End of Life Care Intelligence Network (NEoLCIN) profiles: Percentage of all respiratory
deaths in 2008-2010 in Brent
27
   Public Health England, PHOF: Healthcare and premature mortality
28
   Public Health England, PHOF: Healthcare and premature mortality


                                                                                                                                                                                                                                                    28
Brent
  JSNA
  Highlight
  Summary
  Report,
  December
  2014

NHS
  Brent
  CCG
  and
  LB
  Brent


Between 2010 and 2012, there were 19 suicides in Brent, a rate of 6.8 per 100,000 of the
population. This is lower than the England average rate of 8.5 deaths per 100,000 of the
population.

Health and provision of care

Provision of (unpaid) care

The 2011 Census identified that there were 5.8 million carers in England and Wales.
Since 2001 nearly 1,600 additional people are providing care of between 20 and 49 hours a
week and 1,312 are providing care of 50 or more hours a week in Brent (figure 27).

Key points to note include:

                  •       Nearly 9% of Brent’s residents provide some form of unpaid care;

                  •       Around 26,600 residents of Brent provide one hour of care or more on a weekly basis
                          according to the 2011 Census.

                         18000

                         16000

                         14000

                         12000                                                                 2001
       Count of People

                                                                                               2011
                         10000

                         8000

                         6000

                         4000

                         2000

                            0
                                 Provides 1 to 19 hours Provides 20 to 49 hours   Provides 50 or more
                                      care a week             care a week          hours care a week
                                                  Unpaid care provided per week

Figure 27: Number of residents (all ages) who provide unpaid care in Brent, 2001 versus
2011. Source: ONS
  2001 and 2011 censuses


Figure 28 shows the number of people providing unpaid care in Brent by different age
groups. It is apparent that the age group 25 to 49 old had the highest number of people
providing unpaid care (12,413) while those aged 0 to 24 had the lowest number (3,227) in
2011. As conditions such as mental illness and dementia are forecast to increase in Brent,
the demand for more carers will increase.

                                                                                                          29
Brent
  JSNA
  Highlight
  Summary
  Report,
  December
  2014

NHS
  Brent
  CCG
  and
  LB
  Brent


                14,000
                                                       12,413
                12,000

                10,000

                 8,000                                                        7,146
       Count

                 6,000
                                                                                              3,785
                 4,000       3,227

                 2,000

                     0
                          Age 0 to 24               Age 25 to 49           Age 50 to 64   Age 65 and over

                                                      Age group
Figure 28: Total unpaid care provided by age groups in Brent. Source: ONS 2011 Census

The 2011 Census provides information on the provision of unpaid care by ethnic group
(figure 29). It shows that the majority of ethnic groups provide a similar amount of care to the
Brent average (9%). Some ethnic groups, including Asian/Asian British (10%), provide
slightly more care than average while other groups, notably mixed/multiple (6%), provide
slightly less.

                12

                10       Brent average, 8.6%

                 8
        %


                 6

                 4

                 2

                 0

                                                      Ethnicity

Figure 29: Provision of unpaid care in Brent by ethnic group (all ages). Source: 2011
Census, ONS

A high proportion of adult carers in Brent experienced social isolation. In 2012/13, only 24%
of adult carers reported that they had as much social contact as they would like. This is a

                                                                                                        30
Brent
  JSNA
  Highlight
  Summary
  Report,
  December
  2014

NHS
  Brent
  CCG
  and
  LB
  Brent


significant issue in Brent, as 41% of adult carers in England and 37% of adult carers in
London reported that they did experience as much social contact as they would like29.

The Care Act

The Care Act, which is due to take effect in April 2015, presents a range of implications for
adult social care in local authorities in England.

Some of the new areas of responsibility which will apply to local authorities in April 2015 and
beyond include:

                                     •                            Carers’ rights to support, on an equivalent basis, to the people they care for;

                                    •                             Responsibilities around transition, provider failure, supporting people who move
                                                                  between local authority areas and safeguarding.

For LB Brent, the introduction of the Care Act means that opportunities will exist to further
integrate health and social care support functions in alignment with other key partners.

Poor mental health amongst adults

Prevalence of depression and anxiety

The Annual Population Survey undertaken by ONS provides estimates of subjective levels of
wellbeing. The percentage of people in Brent reporting low levels of happiness was 11%.
This is higher than the England average of 8% and the same as the London average30.

In 2010/11, 16,000 Brent adults were on a GP register for depression. Take-up of talking
therapies is lower in Brent in terms of the numbers of referrals who enter treatment: 53% in
Brent compared to 60% in England.

Levels of self-reported daily anxiety amongst Brent residents are comparable to the England
average. Estimates show that 19.5% of Brent residents surveyed consider themselves to
have high levels of daily anxiety compared to the England average of 21% and the London
average of 22.4%31.

Prevalence of severe and enduring mental illness

Supporting service users with other key requirements such as housing and employment
needs are important in ensuring the effective treatment and recovery resulting from serious
mental illness.

The prevalence of severe and enduring mental illness in Brent affects 1.1% of the
population, which is above both the London and England averages. Figure 30 shows the
prevalence of severe and enduring mental illness (such as schizophrenia, bipolar disorder or
other psychoses) across London for the period 2011/12.


29
     Personal Social Services Survey of Adult Carers in England (HSCIC), 2012/13
30
     London Health Observatory and Working for Wellness (2011), London Adult Mental Health
Scorecard for Brent
31
     Annual Population Survey (ONS), 2012/13. Self-reported wellbeing measure: % of respondents
aged 16 and over scoring 6-10 to the question “Overall, how anxious did you feel yesterday?”


                                                                                                                                                                                                                                                    31
Brent
  JSNA
  Highlight
  Summary
  Report,
  December
  2014

NHS
  Brent
  CCG
  and
  LB
  Brent


                                         1.4
                                                                           Brent, 1.1%
       Prevalence of mental illness, %

                                         1.2   London average:
                                                    1.0%
                                         1.0
                                               England average:
                                                    0.8%
                                         0.8

                                         0.6

                                         0.4

                                         0.2

                                         0.0

       Figure 30: Mental illness prevalence (severe and enduring) among adults by London
       boroughs, 2011-2012. Source: NHS Information Centre

Between 2011/12 and 2012/13, there was a 19% increase in the numbers of users of mental
illness services in Brent. GPs and specialist services report on-going pressures on services.

Mental illness and incapacity benefit claimants

In May 2012, 44% of claims in Brent for Incapacity Benefit (IB) and Severe Disability
Allowance (SDA) were due to a mental disorder, accounting for 2,950 of 6,710 claimants and
forming the largest single category (figure 31). In England, mental disorder accounted for
43% of claims and in London, 47%.

                                                                                           32
Brent
  JSNA
  Highlight
  Summary
  Report,
  December
  2014

NHS
  Brent
  CCG
  and
  LB
  Brent


                                                                                                                                                                                                                                                                          Diseases of the Nervous
                                                                                                                                                                                                                                                    4%                    System
                                                                                                                                                                                                                                                         4%
                                                                                                                                                                                                                                                               6%
                                                                                                                                                                                                                                                                          Injury or Poisoning

                                                                                                                                                                                                                                                                          Diseases of the Respiratory
                                                                  44%                                                                                                                                                                                                     or Circulatory System
                                                                                                                                                                                                                                                                    16%

                                                                                                                                                                                                                                                                          Musculoskeletal Diseases

                                                                                                                                                                                                                                                                          Other

                                                                                                                                                                                                                                                         25%
                                                                                                                                                                                                                                                                          Mental Disorders

Figure 31: Medical reasons for claiming SDA/IB in Brent (data for May 2012). Source:
Department for Work and Pensions (data for May 2012)


Future levels of mental illness

A steady increase, amounting to about 2%, in the number of people aged 18 to 64 with a
common mental illness, principally depression and anxiety, is predicted in Brent from 2012 to
202032 (figure 32). This trend is not statistically different from the overall predictions for
England (3%). In London, however, the prediction is for a more pronounced increase of
10%.


32
                Projecting Adult Needs and Service Information System (PANSI)


                                                                                                                                                                                                                                                                                                     33
You can also read