Disparities in the risk and outcomes of - COVID-19
←
→
Page content transcription
If your browser does not render page correctly, please read the page content below
Disparities in the risk and outcomes of
COVID-19
Disparities in the risk and outcomes from COVID-19

About Public Health England
Public Health England exists to protect and improve the nation’s health and wellbeing
and reduce health inequalities. We do this through world-leading science, research,
knowledge and intelligence, advocacy, partnerships and the delivery of specialist
public health services. We are an executive agency of the Department of Health and
Social Care, and a distinct delivery organisation with operational autonomy. We
provide government, local government, the NHS, Parliament, industry and the public
with evidence-based professional, scientific and delivery expertise and support.

Public Health England
Wellington House
133-155 Waterloo Road
London SE1 8UG
Tel: 020 7654 8000
www.gov.uk/phe
Twitter: @PHE_uk
Facebook: www.facebook.com/PublicHealthEngland

Prepared by: Epi cell, Surveillance cell and Health Intelligence team
For queries relating to this document, please contact: coviddisparitiesreview@phe.gov.uk

© Crown copyright 2020
You may re-use this information (excluding logos) free of charge in any format or
medium, under the terms of the Open Government Licence v3.0. To view this licence,
visit OGL. Where we have identified any third party copyright information you will need
to obtain permission from the copyright holders concerned.

Published June 2020
PHE publications                                     PHE supports the UN
gateway number: GW-1311                              Sustainable Development Goals

                                                     2
Disparities in the risk and outcomes from COVID-19

Contents

Executive summary                                        4
Acknowledgements                                         9
1. Age and sex                                           10
2. Geography                                             20
3. Deprivation                                           32
4. Ethnicity                                             39
5. Occupation                                            50
6. Inclusion health groups                               54
7. Deaths in care homes                                  57
8. Comorbidities                                         60
9. Limitations                                           66
10. Data sources and methodologies                       69
11. References                                           76
Appendices                                               81

                                                     3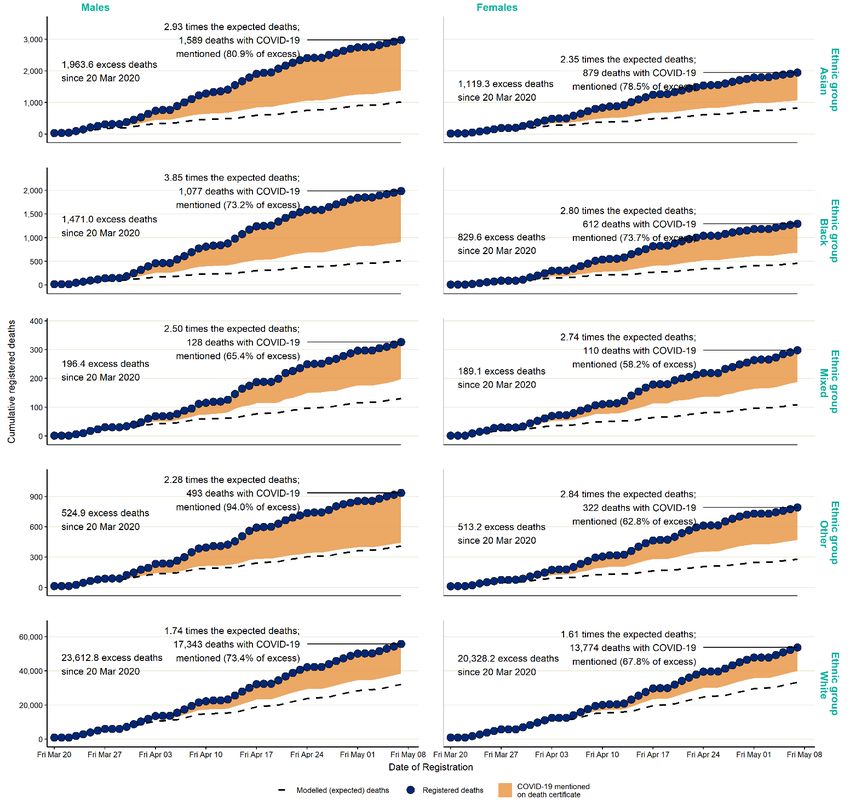
Disparities in the risk and outcomes from COVID-19

Executive summary
This is a descriptive review of data on disparities in the risk and outcomes from COVID-
19. This review presents findings based on surveillance data available to PHE at the
time of its publication, including through linkage to broader health data sets. It confirms
that the impact of COVID-19 has replicated existing health inequalities and, in some
cases, has increased them. These results improve our understanding of the pandemic
and will help in formulating the future public health response to it.

The largest disparity found was by age. Among people already diagnosed with COVID-
19, people who were 80 or older were seventy times more likely to die than those under
40. Risk of dying among those diagnosed with COVID-19 was also higher in males than
females; higher in those living in the more deprived areas than those living in the least
deprived; and higher in those in Black, Asian and Minority Ethnic (BAME) groups than in
White ethnic groups. These inequalities largely replicate existing inequalities in mortality
rates in previous years, except for BAME groups, as mortality was previously higher in
White ethnic groups. These analyses take into account age, sex, deprivation, region
and ethnicity, but they do not take into account the existence of comorbidities, which are
strongly associated with the risk of death from COVID-19 and are likely to explain some
of the differences.

When compared to previous years, we also found a particularly high increase in all
cause deaths among those born outside the UK and Ireland; those in a range of caring
occupations including social care and nursing auxiliaries and assistants; those who
drive passengers in road vehicles for a living including taxi and minicab drivers and
chauffeurs; those working as security guards and related occupations; and those in care
homes. These analyses do not take into account the existence of comorbidities, which
are strongly associated with the risk of death from COVID-19 and could explain some of
these differences.

When this data was analysed, the majority of testing had been offered to those in
hospital with a medical need. Confirmed cases therefore represent the population of
people with severe disease, rather than all of those who get infected. This is important
because disparities between diagnoses rates may reflect differences in the risk of
getting the infection, in presenting to hospital with a medical need and in the likelihood
of being tested.

Some analyses outlined in this review are provisional and will continue to be improved.
Further work is planned to obtain, link and analyse data that will complement these
analyses.

                                                     4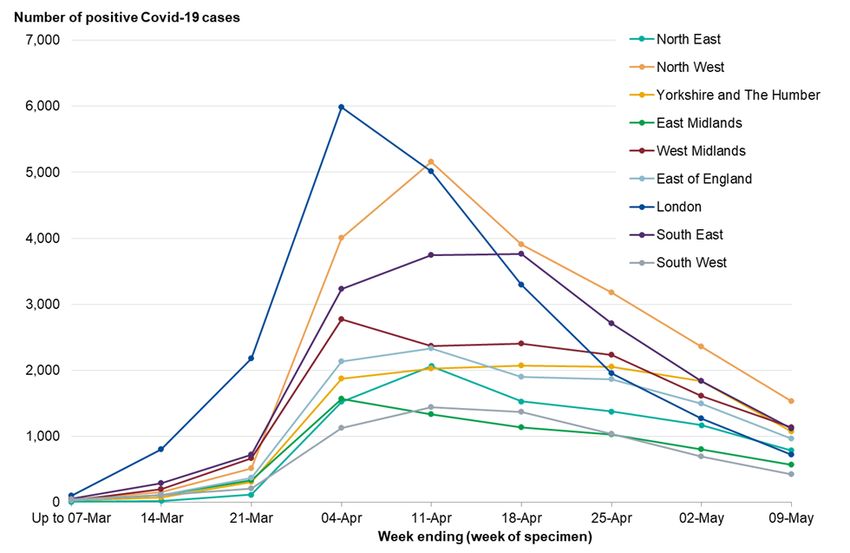
Disparities in the risk and outcomes from COVID-19

The results of this review need to be widely discussed and considered by all those
involved in and concerned with the national and local response to COVID-19. However,
it is already clear that relevant guidance, certain aspects of recording and reporting of
data, and key policies should be adapted to recognise and wherever possible mitigate
or reduce the impact of COVID-19 on the population groups that are shown in this
review to be more affected by the infection and its adverse outcomes.

As the numbers of new COVID-19 cases decrease, monitoring the infection among
those most at risk will become increasingly important. It seems likely that it will be
difficult to control the spread of COVID-19 unless these inequalities can be addressed.

Age and sex

COVID-19 diagnosis rates increased with age for both males and females. When
compared to all cause mortality in previous years, deaths from COVID-19 have a
slightly older age distribution, particularly for males.

Working age males diagnosed with COVID-19 were twice as likely to die as females.
Among people with a positive test, when compared with those under 40, those who
were 80 or older were seventy times more likely to die. These are the largest disparities
found in this analysis and are consistent with what has been previously reported in the
UK.

These disparities exist after taking ethnicity, deprivation and region into account, but
they do not account for the effect of comorbidities or occupation, which may explain
some of the differences.

Geography

The regional pattern in diagnoses rates and death rates in confirmed cases among
males were similar. London had the highest rates followed by the North West, the North
East and the West Midlands. The South West had the lowest. For females the North
East and the North West had higher diagnosis rates than London, while London had the
highest death rate.

Local authorities with the highest diagnoses and death rates are mostly urban. Death
rates in London from COVID-19 were more than three times higher than in the region
with the lowest rates, the South West. This level of inequality between regions is much
greater than the inequalities in all cause mortality rates in previous years.

                                                     5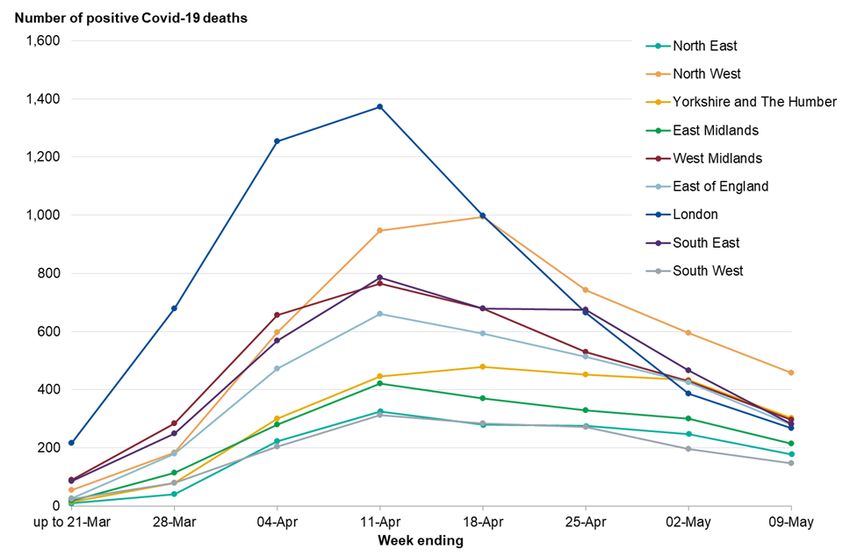
Disparities in the risk and outcomes from COVID-19

Deprivation

People who live in deprived areas have higher diagnosis rates and death rates than
those living in less deprived areas. The mortality rates from COVID-19 in the most
deprived areas were more than double the least deprived areas, for both males and
females. This is greater than the inequality seen in mortality rates in previous years,
indicating greater inequality in death rates from COVID-19.

High diagnosis rates may be due to geographic proximity to infections or a high
proportion of workers in occupations that are more likely to be exposed. Poor outcomes
from COVID-19 infection in deprived areas remain after adjusting for age, sex, region
and ethnicity, but the role of comorbidities requires further investigation.

Ethnicity

People from Black ethnic groups were most likely to be diagnosed. Death rates from
COVID-19 were highest among people of Black and Asian ethnic groups. This is the
opposite of what is seen in previous years, when the mortality rates were lower in Asian
and Black ethnic groups than White ethnic groups. Therefore, the disparity in COVID-19
mortality between ethnic groups is the opposite of that seen in previous years.

An analysis of survival among confirmed COVID-19 cases and using more detailed
ethnic groups, shows that after accounting for the effect of sex, age, deprivation and
region, people of Bangladeshi ethnicity had around twice the risk of death than people
of White British ethnicity. People of Chinese, Indian, Pakistani, Other Asian, Caribbean
and Other Black ethnicity had between 10% and 50% higher risk of death when
compared to White British.

These analyses did not account for the effect of occupation, comorbidities or obesity.
These are important factors because they are associated with the risk of acquiring
COVID-19, the risk of dying, or both. Other evidence has shown that when
comorbidities are included, the difference in risk of death among hospitalised patients is
greatly reduced.

Occupation

A total of 10,841 COVID-19 cases were identified in nurses, midwives and nursing
associates registered with the Nursing and Midwifery Council. Among those who are
registered, this represents 4% of Asian ethnic groups, 3.1% of Other ethnic groups,
1.7% of White ethnic groups and 1.5% of both Black and Mixed ethnic groups. This
analysis did not look at the possible reasons behind these differences, which may be
driven by factors like geography or nature of individuals’ roles.

                                                     6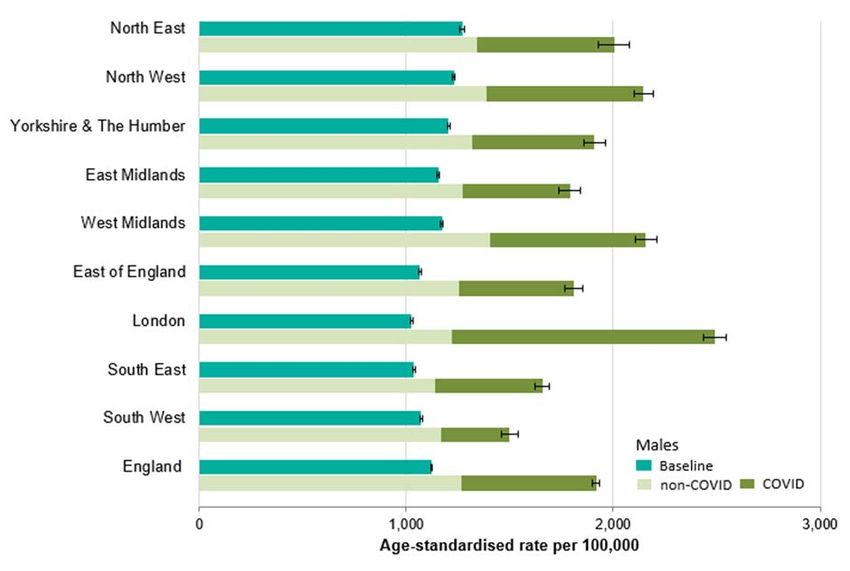
Disparities in the risk and outcomes from COVID-19

ONS reported that men working as security guards, taxi drivers and chauffeurs, bus and
coach drivers, chefs, sales and retail assistants, lower skilled workers in construction
and processing plants, and men and women working in social care had significantly
high rates of death from COVID-19. Our analysis expands on this and shows that
nursing auxiliaries and assistants have seen an increase in all cause deaths since 2014
to 2018. For many occupations, however, the number of deaths is too small to draw
meaningful conclusions and further analysis will be required.

Inclusion health groups

When compared to previous years, there has been a larger increase in deaths among
people born outside the UK and Ireland. The biggest relative increase was for people
born in Central and Western Africa, the Caribbean, South East Asia, the Middle East
and South and Eastern Africa. This may be one of the drivers behind the differences in
mortality rates seen between ethnic groups.

There were 54 men and 13 women diagnosed with COVID-19 with no fixed abode,
likely to be rough sleepers. We estimate that this represents 2% and 1.5% of the known
population of women and men who experienced rough sleeping in 2019. Data is of poor
quality, but this suggests a much higher diagnoses rate when compared to the general
population.

People in care homes

Data from the Office for National Statistics (ONS) shows that deaths in care homes
accounted for 27% of deaths from COVID-19 up to 8 May 2020. The number of deaths
in care homes peaked later than those in hospital, in week ending 24 April.

Our analyses show that there have been 2.3 times the number of deaths in care homes
than expected between 20 March and 7 May when compared to previous years, which
equates to around 20,457 excess deaths. The number of COVID-19 deaths over this
period is equivalent to 46.4% of the excess suggesting that there are many excess
deaths from other causes or an under-reporting of deaths from COVID-19.

Comorbidities

Among deaths with COVID-19 mentioned on the death certificate, a higher percentage
mentioned diabetes, hypertensive diseases, chronic kidney disease, chronic obstructive
pulmonary disease and dementia than all cause death certificates.

Diabetes was mentioned on 21% of death certificates where COVID-19 was also
mentioned. This finding is consistent with other studies that have reported a higher risk
of death from COVID-19 among patients with diabetes. This proportion was higher in all

                                                     7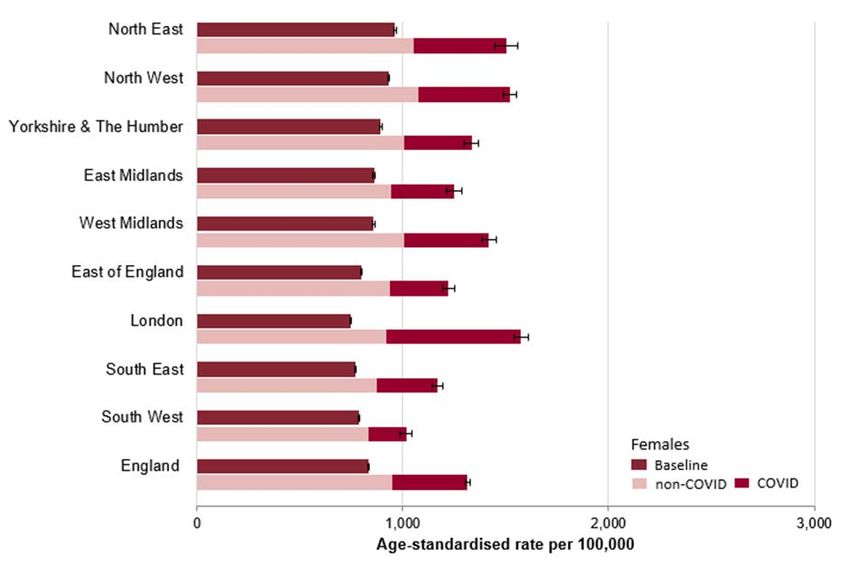
Disparities in the risk and outcomes from COVID-19

BAME groups when compared to White ethnic groups and was 43% in the Asian group
and 45% in the Black group. The same disparities were seen for hypertensive disease.

Several studies, although measuring the different outcomes from COVID-19, report an
increased risk of adverse outcomes in obese or morbidly obese people.

                                                     8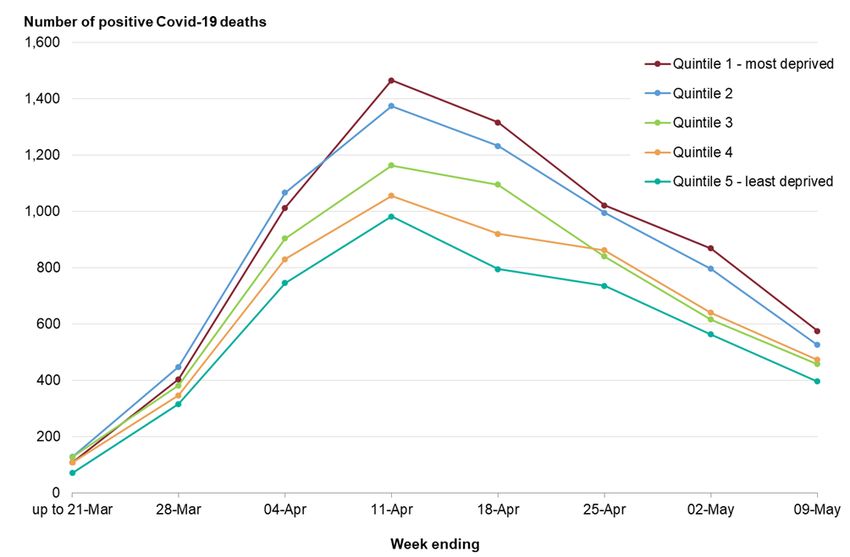
Disparities in the risk and outcomes from COVID-19

Acknowledgements
All the analyses in this document were done by scientists working in the Epi cell,
Surveillance cell and Health Intelligence team at Public Health England. A draft of this
document was reviewed by the individuals and teams below, to whom we are extremely
grateful:

•   John Pullinger
•   Professor Andrew Hayward
•   Professor Keith Neal
•   The Race Disparity Unit (Cabinet Office)
•   PHE topic experts

                                                     9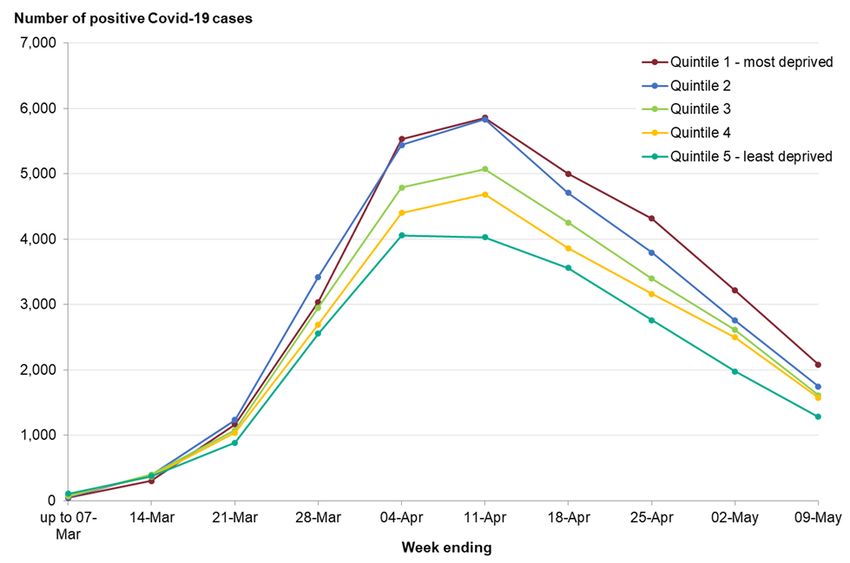
Disparities in the risk and outcomes from COVID-19

1. Age and sex
1.1 Main messages

Diagnosis rates are higher among females under 60, and higher among males over 60.
Despite making up 46% of diagnosed cases, men make up almost 60% of deaths from
COVID-19 and 70% of admissions to intensive care units.

The rate of diagnosed cases increases with age, but the age profile is markedly different
among those in critical care. The largest number of patients in critical care come from
age groups between 50 and 70 for both males and females and only small numbers
aged over 80.

When compared to all cause mortality in previous years, deaths from COVID-19 have a
slightly older age distribution, particularly for males. Between the ages of 40 to 79, the
age specific death rates from COVID-19 among males were around double the rates in
females compared with 1.5 times for all cause mortality in previous years.

A survival analysis looked at people with a positive test, and those 80 or older, when
compared with those under 40, were seventy times more likely to die. These are the
largest disparities found in this analysis. Working age males diagnosed with COVID-19
were twice as likely to die as females.

The majority of excess deaths (75%) occurred in those aged 75 and over. COVID-19
deaths were equivalent to 80% of the excess in every age group, except the oldest age
group where this proportion is lower. There have been fewer deaths than expected in
children under 15 years of age.

These findings are consistent with what has been previously reported by ONS (1) and
ICNARC (2).

1.2 Background

Male sex and increasing age are known factors associated with COVID-19-related
mortality. This was apparent from early on in the pandemic among patients in Wuhan,
China (3) and evidence has since accumulated from multiple other countries (4).

Data from the Intensive Care National Audit and Research Centre (ICNARC) has
consistently reported that COVID-19 admissions to critical care are mostly among men,
making up 71.0% of admissions reported as of 21 May (2). Similarly, ONS reported
COVID-19 age-standardised mortality rate for males (781.9 deaths per 100,000) is

                                                     10
Disparities in the risk and outcomes from COVID-19
significantly higher than that for females (439.0 deaths per 100,000) (1). This difference
in risk is also observed in the hospitalised population; data from 16,649 COVID-19
positive patients in 166 UK hospitals between February and April 2020 showed that
even after controlling for age, comorbidities and obesity, female sex was associated
with a reduced risk of death (HR=0.80 (95%CI 0.72-0.89)) compared to male sex (5).
COVID-19-related mortality rates reported by ONS also increase across age groups.
For males the increase is significant from 35 to 39 years and above, and for females
from 40 to 44 years and above (1). This increase in mortality by age is also observed
among hospitalised patients; data from the same study of 16,649 COVID-19 positive
patients showed that, even after adjusting for comorbidities, sex and obesity, the risk of
dying among those over 80 was almost 14 times higher than those under 50 years old
(5).
It is not yet fully clear what drives the differences in outcomes between males and
females. Some could be driven by different risks of acquiring the infection – for example
due to behavioural and occupational factors – and by differences in how women and
men develop symptoms, access care and are diagnosed, or by biological and immune
differences that put men at greater risk.
1.3 Cases
This section presents laboratory confirmed cases under Pillar 1 testing. The majority of
testing under this pillar has been offered to those in hospital with a medical need as well
as NHS key workers, rather than the general population. Confirmed cases therefore
represent the population of people with severe disease, rather than all of those who get
infected.
As of 13 May, there had been 63,661 cases in males (46.4%) and 73,529 cases in
females (53.6%). Figure 1.1 shows the distribution of these cases by age groups and
sex.
11Disparities in the risk and outcomes from COVID-19
Figure 1.1. Age sex pyramid of laboratory confirmed COVID-19 cases as of 13 May
2020, England. Source: Public Health England Second Generation Surveillance
System.
The age standardised diagnosis rates per 100,000 population were similar in males
(256.0) and females (252.0). Among people under 60, diagnosis rates were higher in
females than males, and among people aged 60 years and older, diagnosis rates were
higher in males (Figure 1.2).
PHE has reported previously that among those who were tested, males were more
likely to have a positive test (6). This may suggest that females were tested more often
and possibly with milder disease. This could be a reflection of the higher number of
females working in occupations that expose them to the infection and could explain
higher diagnoses rates in working age females. Higher diagnosis rates among males
over 60 may reflect worse clinical outcomes in this group.
12Disparities in the risk and outcomes from COVID-19
Figure 1.2. Diagnosis rates by sex and age as of 13 May 2020, England. Source: Public
Health England Second Generation Surveillance System.
1.4 Hospitalisations
As of 19 of May, 42 trusts had reported lower level of care patients (defined as
admission to any hospital ward, excluding intensive care units (ICU) or high
dependency units (HDU)), and 94 trusts contributed ICU/HDU (critical care) patient data
to the COVID-19 Hospitalisation in England Surveillance System (CHESS). Reporting
varies by trusts and the majority of trusts in London do not consistently report to CHESS
which will impact on the representativeness of the hospitalised cases. The data
presented in this section have not been adjusted for this, which means findings must be
interpreted with caution.
Figure 1.3 shows the age and sex distribution of COVID-19 confirmed cases in ‘lower
level of care’ and in critical care. Males make up 54.4% of patients in lower level of care
and 70.4% of patients in critical care.
For both sexes, the patient population is younger in critical care. Cases aged over 70
make up 65.5% and 67.6% of the patients in lower level of care among males and
females, respectively; in critical care, those over 70 make up only 22.0% and 17.9% of
the male and female patients, respectively. The overrepresentation of younger patients
in critical care does not necessarily reflect increased severity in this group of patients
alone but may also reflect critical care admission criteria.
13Disparities in the risk and outcomes from COVID-19
Figure 1.3. Age sex pyramids of admissions for laboratory confirmed COVID-19 to
acute trusts, for lower level of care and critical care, as of 19 May 2020, England.
Source: Public Health England COVID-19 Hospitalisations in England surveillance
system (CHESS).
1.5 Deaths in confirmed cases
As of 13 May, there had been 17,598 deaths in confirmed cases among males (59.3%)
and 12,075 in females (40.7%). 56.3% of deaths were among people 80 years and
older. Figure 1.4 shows the distribution of deaths by age groups and sex.
Figure 1.4. Age sex pyramid of laboratory confirmed COVID-19 deaths as of 13 May
2020, England. Source: Public Health England COVID-19 Specific Mortality
Surveillance System.
14Disparities in the risk and outcomes from COVID-19
Overall, the mortality rates among confirmed cases per 100,000 population among
males were 1.3 to 2.1 higher than among females for all age groups (Figure 1.5).
Overall the age standardised mortality rate in males (74.0 per 100,000) was twice that
of females (38.0 per 100,000).
Figure 1.5. Crude mortality rates of laboratory confirmed COVID-19 deaths per 100,000
population by age group and sex, as of 13 May 2020, England. Source: Public Health
England COVID-19 Specific Mortality Surveillance System.
An analysis of survival among people with confirmed COVID-19 by sex, age group,
ethnicity, deprivation and region, shows that, compared with people under 40, the
probability of death was about three times higher among those aged 40 to 49, nine
times higher among those aged 50 to 59, twenty-seven times higher among those aged
60 to 69, fifty times higher among those aged 70 to 79 and seventy times higher among
those aged 80 and over. These are the largest disparities by far found in this analysis
(Appendix A, table A1).
This analysis also showed that working age males diagnosed with COVID-19 were
twice as likely to die than females (Appendix A, table A2). For older adults (65 and over)
the disparity remains significant but is much lower, with males in this age group having
approximately 50% higher risk of death when compared to females (Appendix A, table
A3).
1.6 Comparison with inequalities in previous years
This section uses deaths reported by the Office for National Statistics (ONS) to compare
inequalities in death rates from COVID-19 between 21 March and 8 May 2020 with
15Disparities in the risk and outcomes from COVID-19
inequalities in all cause death rates for previous years (the ‘baseline all cause’ figure).
COVID-19 deaths in this section include all those where COVID-19 was mentioned on
the death certificate. These can include cases where the doctor thought it likely that the
person had COVID-19, even when there was no positive test result. The deaths
reported by ONS will include deaths that are not included in the ‘deaths in confirmed
cases’ because they did not have a positive test result confirmed by a PHE or NHS
laboratory, and may not include all ‘deaths in confirmed cases’.
There were 35,425 deaths registered between 21 March and 8 May 2020 that
mentioned COVID-19 on the death certificate. This is equivalent to 31% of all deaths
over this period.
Males accounted for 57% of deaths from COVID-19 and females 43%, while the
baseline all cause figures were 51% and 49%. This indicates that males make up a
larger percentage of COVID-19 deaths than all causes.
Among males, 54% of COVID-19 deaths were in those aged 80+ compared with 67% of
deaths among females. This compares with 48% and 64% for the baseline all cause
deaths respectively. 8% of deaths from COVID-19 among males were in those under 60
years of age compared with 6% of females. This compares with 14% and 9% for
baseline all cause deaths respectively.
Figures 1.6A and 1.6B show age specific mortality rates for all causes of death and for
deaths mentioning COVID-19 between 21 March 2020 and 8 May 2020. They also
show the baseline all cause rate using the average annual all cause mortality rates for
2014 to 2018.
Between the ages of 40 to 79, the age specific death rates among males were around
double the rates in females, compared with 1.5 times for baseline all causes (Figure
1.6A and 1.6B).
Age specific death rates from COVID-19 increase with age and were highest in those
aged 80+ where they were 4.0 times higher than in those aged 70 to 79 in males and
5.1 times higher in females. This ratio is slightly higher than the baseline all cause data
for 2014 to 2018 (3.7 and 4.8 in males and females respectively) (Figure 1.6A and
1.6B). Deaths from COVID-19 have a slightly older age distribution than baseline all
cause deaths, particularly for males.
The age and sex distribution of ONS deaths from COVID-19 and deaths in confirmed
cases were also broadly similar, but ONS deaths had a slightly higher proportion in
older ages.
16Disparities in the risk and outcomes from COVID-19
Figure 1.6A and 1.6B. Age specific death rates for all cause deaths and deaths
mentioning COVID-19, compared with baseline, by sex, 21 March to 8 May 2020,
England. Source: Public Health England analysis of ONS death registration data
17Disparities in the risk and outcomes from COVID-19
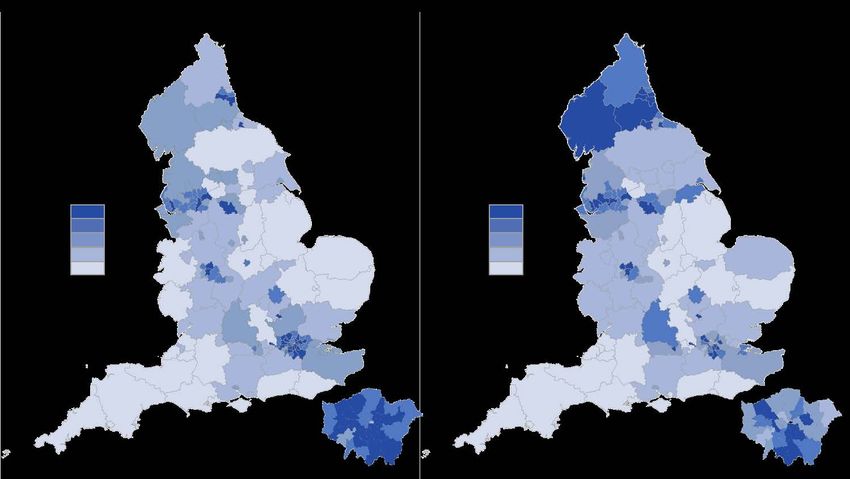
1.7 Excess mortality
PHE has developed a model to estimate all cause excess mortality in the population.
Figure 1.7 shows the number of excess deaths by age and sex in the period 20 March
to 7 May against the number of deaths that would be expected for corresponding dates
in 2015 to 2019. It also illustrates how many deaths have COVID-19 mentioned on the
death certificate.
The model suggests there have been 46,056 excess deaths between 20 March 2020
and 7 May 2020, 24,731 in males and 21,324 in females. This is similar to the number
of excess deaths reported by ONS for England and Wales up until 8 May 2020 (7). ONS
compared deaths in 2020 with the simple average for the years 2015 to 2019. However,
this will not adjust for ageing of the population or the effect of Easter or bank holidays
on the number of deaths registered. The PHE model does adjust for this. More details
are provided in the data sources and methodologies section.
The majority of excess deaths have occurred in those aged 75 and over, with 20,841
(45%) in those aged 85+ and 13,921 (30%) in those aged 75 to 84.
There have been fewer deaths than expected in children under 15 years of age.
Accidents are a leading cause of death in children and these may have reduced over
this period, following social distancing measures, or there could be a delay in the
registration of these deaths. Among those age groups where there were excess deaths,
the number of deaths with COVID-19 mentioned on the death certificate is equivalent to
more than 80% of all excess deaths in each age group, except those aged 85+ where
this proportion is lower.
18Disparities in the risk and outcomes from COVID-19
Figure 1.7. Cumulative all cause deaths by date of registration by age and sex, 20
March to 7 May 2020, England. Source: Public Health England excess mortality model
based on ONS death registration data.
19Disparities in the risk and outcomes from COVID-19
2. Geography
2.1 Main messages
At 13 May 2020, the regional pattern in diagnoses rates and death rates in confirmed
cases among males were similar. London had the highest rates followed by the North
West, the North East and the West Midlands. The South West had the lowest.
For females the North East and the North West had higher diagnosis rates than London
while London had the highest death rate in confirmed cases.
Diagnosis rates by local authority were highly clustered. Authorities, which are mostly
urban, in London, the North West, the West Midlands and the North East had the
highest rates. A similar geographic pattern is seen for death rates.
The peak in the number of diagnosed cases happened first in London, the East
Midlands and the West Midlands in week ending 4 April. Diagnosed cases peaked latest
in South East and Yorkshire and Humber in week ending 18 April. The number of
deaths in confirmed cases peaked in week ending 11 April in all regions except North
West and Yorkshire and Humber, where it peaked in week ending 18 April.
Death rates in London from COVID-19 were more than three times higher than in the
region with the lowest rates, the South West. This level of inequality between regions is
much greater than the inequality between all cause mortality rates in previous years.
The excess mortality model suggests there have been 9,035 excess deaths in London
between 20 March and 7 May, compared with 2,900 in the South West.
2.2 Background
The burden of disease and mortality from COVID-19 is not evenly spread in the
population. The UK coronavirus dashboard (8) presents data on the number of cases
and deaths in people who have tested positive for SARS-CoV-2 and shows
considerable variation in the number of cases by region across the UK. As at 21 May
2020, the number of cases was highest in London and lowest in the South West. The
PHE weekly COVID-19 surveillance report as at 13 May 2020 shows the North East and
North West regions to have the highest diagnosis rates per 100,000 population,
however, London had the highest crude mortality rate in confirmed cases (6).
20Disparities in the risk and outcomes from COVID-19
ONS analysis shows that between 1 March and 17 April 2020, local authorities in
London had the highest mortality rates from COVID-19 in England when the age
structure of the population was taken into account (9).
Findings from other studies have demonstrated that people living in urban areas versus
rural areas have increased odds of testing positive for COVID-19 (10). At the local
authority level in England, population density, deprivation and other factors associated
with urban areas such as an ethnically diverse population may also be associated with
higher mortality from COVID-19 (11).
2.3 Cases
This section presents laboratory confirmed cases under Pillar 1 testing. The majority of
testing under this pillar has been offered to those in hospital with a medical need as well
as NHS key workers, rather than the general population. Confirmed cases therefore
represent the population of people with severe disease, rather than all of those who get
infected.
Data reported to PHE up to 13 May 2020 shows that London had the highest number of
diagnosed cases (26,024) and the South West the lowest (7,155) and that there was
considerable variation among local authorities in England (Table 2a in the data pack).
The highest weekly number of diagnosed cases was reported in week ending 4 April in
the East Midlands, London and West Midlands; in week ending 11 April in the East of
England, North East, North West and South West; and in week ending 18 April in the
South East and Yorkshire and Humber (Figure 2.1).
21Disparities in the risk and outcomes from COVID-19
Figure 2.1. Number of positive cases by week by region, as of 9 May 2020, England.
Source: Public Health England Second Generation Surveillance System. Note: The last
week of data was removed as it was an incomplete week.
The age standardised diagnosis rates (which are adjusted for the population size of the
areas and to account for the difference in their age structure) were highest in London
(423.9 per 100,000 population) followed by the North West (307.7) and the North East
(294.7) for males. For females the rate was highest in the North East (405.0) followed
by the North West (335.3) and London (318.5) (Figure 2.2). The South West region had
the lowest standardised diagnosis rate for both males and females.
In the North East, North West, Yorkshire and the Humber, and the South East the
female diagnosis rates were higher than males, whereas in the East Midlands, East of
England and London the opposite was true. In England as a whole the rates were
broadly similar for males and females.
22Disparities in the risk and outcomes from COVID-19
Figure 2.2. Age standardised diagnosis rates by region and sex, as of 13 May 2020,
England. Source: Public Health England Second Generation Surveillance System.
Maps 2.1A and 2.1B show age standardised diagnosis rates by upper-tier local authority
in England. Among males there is a 12-fold difference in the rates between local
authorities and an eight-fold difference in the rates among females. Variation in
diagnosis rates will be partly influenced by variation in testing practices between areas.
The maps show diagnosis rates are highly clustered. Authorities which are mostly urban
areas, in London, the North West, the West Midlands and the North East had the
highest rates. For males, the ten local authorities with the highest diagnosis rates are in
London. For females, Cumbria has the sixth highest rate which is a predominately rural
area in the North West. These data are also presented in the data pack in Table 2a.
23Disparities in the risk and outcomes from COVID-19
Map 2.1A and 2.1B. Age standardised diagnosis rates by local authority and sex, as of 13 May 2020, England. Source:
Public Health England Second Generation Surveillance System.
24Disparities in the risk and outcomes from COVID-19
2.4 Hospitalisations
This section presents data reported to the COVID-19 Hospitalisations in England
surveillance system (CHESS). Reporting varies by trusts and the majority of trusts in
London do not consistently report to CHESS which will impact on the
representativeness of the hospitalised cases. Therefore, rather than providing number
of hospitalised patients, daily rates are reported in this section and are analysed using
the reporting trusts’ catchment area population (rather than regional population
denominator) to account for this issue.
Figure 2.3 shows the three day moving average rate of hospital admissions to all levels
of care (critical and lower level of care) for laboratory confirmed COVID-19 between 15
March and 19 May 2020 by NHS region. The highest rate of hospital admissions
occurred between 3 and 9 of April for all regions.
Figure 2.3. 3-day moving average rate of hospital admission to all levels of care for
laboratory confirmed COVID-19, by NHS region, as of 19 May 2020, England. Source:
Public Health England COVID-19 Hospitalisations in England surveillance system
(CHESS).
25Disparities in the risk and outcomes from COVID-19
2.5 Deaths in confirmed cases
The trend in the number of deaths in confirmed cases by week in each region shows
that London had the highest number of deaths every week up until week ending 18 April
after which the North West had the highest number of deaths. The highest weekly
number of deaths in confirmed cases was reported in week ending 11 April in all regions
except the North West and Yorkshire and Humber, where it was reported in week
ending 18 April (Figure 2.4).
Figure 2.4. Number of deaths in laboratory confirmed COVID-19 cases by region and
week, as of 9 May 2020, England. Source: Public Health England COVID-19 Specific
Mortality Surveillance System. Note: The last week of data was removed as it was an
incomplete week.
Up to 13 May 2020, the age standardised death rate among confirmed cases, per
100,000 population, was highest in London for both males (140.3) and females (66.8)
(Figure 2.5) and were also high in the North East, North West and West Midlands. The
South West had the lowest standardised death rate among confirmed cases for both
males and females. In all regions the death rate in males was higher than females.
Among males, the regional pattern in diagnoses rates and death rates in confirmed
cases were similar. However, for females the North East and the North West had the
highest diagnosis rates while London had the highest death rate in confirmed cases.
This may be explained by different testing strategies and capacity at different times of
the pandemic.
26Disparities in the risk and outcomes from COVID-19
Figure 2.5. Age standardised death rates in laboratory confirmed COVID-19 cases, per
100,000 population, by region and sex, as of 13 May 2020, England. Source: Public
Health England COVID-19 Specific Mortality Surveillance System.
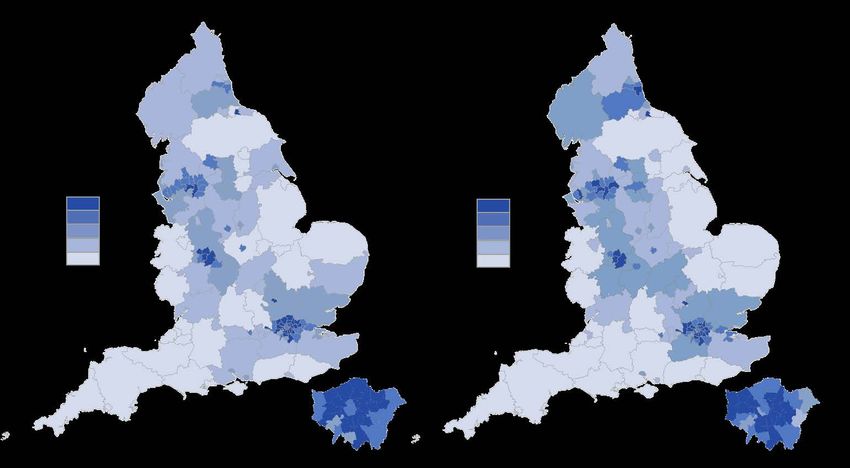
Maps 2.2A and 2.2B show age standardised death rates among confirmed cases, per
100,000 population, by upper-tier local authority in England. The maps show that death
rates were highly clustered. Authorities, which are largely urban areas, in London, the
North West, the West Midlands and the North East had the highest death rates. For
males, the eight authorities with the highest death rates among confirmed cases are in
London. (Table 2b in the data pack).
An analysis of survival among people with confirmed COVID-19 by sex, age group,
ethnicity, deprivation and region, showed that among people of working age (aged 20 to
64) those living outside of London had a slightly lower risk of death, except for East
Midlands and the East of England where the risk was similar. In older ages (65 and
over) people living in the North East had a slightly lower risk of death while those in the
East of England a higher risk of death compared with London. (Appendix A, tables A2
and A3). However, the magnitude of these inequalities was not as great as that seen for
population based death rates for confirmed cases.
27Disparities in the risk and outcomes from COVID-19
Map 2.2A and 2.2B. Age standardised death rates in laboratory confirmed COVID-19 cases, per 100,000 population, by local
authority and sex, as of 13 May 2020, England. Source: Public Health England COVID-19 Specific Mortality Surveillance System.
28Disparities in the risk and outcomes from COVID-19
2.6 Comparison with inequalities in previous years
This section uses deaths reported by the Office for National Statistics (ONS) to compare
inequalities in death rates from COVID-19 between 21 March and 8 May 2020 with
inequalities in all cause death rates for previous years (the ‘baseline all cause’ figure).
Figures 2.6A and 2.6B show age standardised mortality rates for all causes of death
and for deaths mentioning COVID-19 by region between 21 March 2020 and 8 May
2020. They also show the baseline all cause rate using the average annual all cause
mortality rates for 2014 to 2018. The same information is presented by local authority in
Table 2c in the data pack.
29Disparities in the risk and outcomes from COVID-19
Figure 2.6A and 2.6B. Age standardised mortality rates for all cause deaths and deaths
mentioning COVID-19, 21 March to 8 May 2020, compared with baseline mortality rates
(2014 to 2018), by region and sex, England. Source: PHE analysis of ONS death
registration data
The age standardised death rates from COVID-19 were highest in London for both
males and females but were lowest in the South West (Figure 2.6A and 2.6B). This is
consistent with the pattern seen for deaths in confirmed cases. The ratio of these rates
for males was 3.8 and for females 3.5, indicating that mortality in London from COVID-
19 was more than three times higher than the South West.
The baseline all cause mortality rates were highest in the North East and were 1.2 times
higher in males and 1.3 times higher in females than London, the region with the lowest
rates. Therefore, regional inequalities in COVID-19 mortality are greater than those
seen previously for all cause mortality and the geographic gradient is different. London
had the highest COVID-19 mortality rates, but the lowest baseline all cause mortality
rates.
2.7 Excess mortality
PHE has developed a model to estimate all cause excess mortality in the population.
Table 2.1 shows results from the excess mortality model and includes the number of
excess deaths by sex and region in the period 20 March to 7 May against the number of
30Disparities in the risk and outcomes from COVID-19
deaths that would be expected for corresponding dates in 2015 to 2019. It also
highlights how many deaths have COVID-19 mentioned on the death certificate.
Overall the model suggests deaths in London have been 2.3 times higher than expected
in this period, compared with 1.4 times higher in the South West.
Table 2.1. Cumulative all cause deaths by date of registration and region, 20 March to 7
May 2020 England. Source: Public Health England excess mortality model based on
ONS death registration data
Ratio COVID- COVID-19
Observed Expected Excess
observed/ 19 deaths as
deaths deaths deaths
expected deaths % excess
North East 6196 3932 1.6 2264 1906 84.2%
North West 17133 10050 1.7 7083 5460 77.1%
Yorkshire and The
Humber 11346 7321 1.5 4025 3086 76.7%
East Midlands 9659 6394 1.5 3265 2531 77.5%
West Midlands 13548 7731 1.8 5817 4293 73.8%
East of England 13170 8133 1.6 5037 3513 69.7%
London 16073 7038 2.3 9035 7383 81.7%
South East 18205 11575 1.6 6630 5079 76.6%
South West 10939 8039 1.4 2900 2188 75.4%
Total 116269 70213 1.7 46056 35439 76.9%
31Disparities in the risk and outcomes from COVID-19
3. Deprivation
3.1 Main messages
The trend in the number of diagnosed cases by deprivation quintile shows that cases in
the least deprived group peaked earlier and lower than other groups and at 13 May, the
cumulative number of cases and diagnosis rate was highest in the most deprived
quintile.
The mortality rates from COVID-19 in the most deprived areas were more than double
the least deprived areas, for both males and females. This is greater than the ratio for
all cause mortality between 2014 to 2018 indicating greater inequality in death rates
from COVID-19 than all causes.
Survival among confirmed cases, after adjusting for sex, age group, ethnicity and region
was lower in the most deprived areas, particularly among those of working age where
the risk of death was almost double the least deprived areas.
In summary, people in deprived areas are more likely to be diagnosed and to have poor
outcomes following diagnosis than those in less deprived areas. High diagnosis rates
may be due to geographic proximity to infections or a high proportion of workers in
occupations that are more likely to be exposed. Poor outcomes remain after adjusting
for ethnicity, but the role of underlying health conditions requires further investigation.
3.2 Background
Evidence from previous analysis suggests that there is some association between area
based deprivation levels and incidence and mortality from COVID-19. However, this
may be weaker once other factors such as ethnicity are taken into consideration (11)
(12).
Deprivation is classified using the Index of Multiple Deprivation and encompasses a
wide range of aspects of an individual’s living conditions including income, employment,
education, health, crime, housing and the living environment (13). Deprived areas can
be found in both urban and rural areas of England.
ONS analysis shows that between 1 March and 17 April 2020 the deprived areas in
England had more than double the mortality rate from COVID-19 than the least deprived
areas (9). Other sources have shown that people living in more deprived areas were
more likely to test positive for COVID-19 (10) and to have higher mortality rates (14).
32Disparities in the risk and outcomes from COVID-19
The latest report from the Intensive Care National Audit and Research Centre
(ICNARC) used data up to 21 May 2020 and showed that a larger proportion of patients
critically ill in intensive care units (ICU) with COVID-19 were from the most deprived
quintile of areas (25.0%) than the least deprived (14.7%), however, this pattern was
similar to the pattern seen previously among patients admitted for viral pneumonia
between 2017 and 2019 (2). Patient outcomes from COVID-19 across deprivation
categories were similar.
3.3 Cases
This section presents laboratory confirmed cases under Pillar 1 testing. The majority of
testing under this pillar has been offered to those in hospital with a medical need as well
as NHS key workers, rather than the general population. Confirmed cases therefore
represent the population of people with severe disease, rather than all of those who get
infected.
The trend in the number of diagnosed cases by deprivation quintile shows that cases in
the least deprived group (quintile 5) peaked earlier and lower than other groups (Figure
3.1). As of 13 May the cumulative number of cases was highest in the most deprived
quintile (quintile 1). Deprivation quintiles are roughly equal in population size and are
defined in section 10.
33Disparities in the risk and outcomes from COVID-19
Figure 3.1. Number of positive confirmed cases by deprivation quintile and week, as of
9 May 2020, England. Source: Public Health England Second Generation Surveillance
System. Note: The last week of data was removed as it was an incomplete week.
The age standardised diagnosis rates were highest in the most deprived quintile in both
males and females, and lowest in the least deprived quintile. The rate in the most
deprived quintile was 1.9 times the rate in the least deprived quintile among males and
1.7 times among females. In quintiles 1 and 2 (the most deprived) the male diagnosis
rates were significantly higher than females, whereas in all other quintiles the rates in
the sexes were very similar (Figure 3.2).
Figure 3.2. Age standardised diagnosis rates by deprivation quintile and sex, as of 13
May 2020, England. Source: Public Health England Second Generation Surveillance
System.
3.4 Deaths in confirmed cases
The trend in the number of deaths in confirmed cases by week in each quintile shows
that by week ending 11 April the number of weekly deaths was highest in the most
deprived quintile (quintile 1) and remained so for every following week. For all quintiles,
the week with the peak number of deaths in confirmed cases was week ending 11 April
2020 (Figure 3.3). By 13 May the cumulative number of deaths was highest in the most
deprived quintile (quintile 1) (6,894) and lowest in the least deprived (quintile 5) (4,672).
34Disparities in the risk and outcomes from COVID-19
Figure 3.3. Number of deaths in laboratory confirmed COVID-19 cases by deprivation
quintile and week, as of 9 May 2020, England. Source: Public Health England COVID-
19 Specific Mortality Surveillance System. Note: The last week of data was removed as
it was an incomplete week.
The age standardised death rates in confirmed cases, per 100,000 population, were
highest in the most deprived quintile in both males and females, and lowest in the least
deprived quintile. The rate in the most deprived quintile was 2.3 times the rate in the
least deprived quintile among males and 2.4 times among females. In all quintiles the
male death rates were significantly higher than females (Figure 3.4).
35Disparities in the risk and outcomes from COVID-19
Figure 3.4. Age standardised death rates in laboratory confirmed COVID-19 cases by
deprivation quintile and sex, as of 13 May 2020, England. Source: Public Health
England COVID-19 Specific Mortality Surveillance System.
An analysis of survival among people with confirmed COVID-19 by sex, age group,
ethnicity, deprivation and region, showed that, among people of working age (20 to 64),
people living in the most deprived areas of the country were almost twice as likely to die
than those living in the least deprived (Appendix A, table A2). For older adults (65 and
over) the disparity remains significant but is much lower, with people in the most
deprived areas having approximately 9% higher risk of death when compared to people
in the least deprived areas (Appendix A, table A3).
3.5 Comparison with inequalities in previous years
This section uses deaths reported by the Office for National Statistics (ONS) to compare
inequalities in death rates mentioning COVID-19 on the death certificate with
inequalities in all cause death rates for previous years (the ‘baseline all cause’ figure).
Figure 3.5A and 3.5B show age standardised mortality rates for all causes of death and
for deaths mentioning COVID-19 by deprivation decile between 21 March 2020 and 8
May 2020. They also show the baseline all cause rate using the average annual all
cause mortality rates for 2014 to 2018.
36Disparities in the risk and outcomes from COVID-19
The age standardised death rate from COVID-19 was highest in the most deprived
decile in males, but in the second most deprived decile in females (Figure 3.5A and
3.5B). The rate in the most deprived decile was 2.2 times the rate in the least deprived
decile among males and females. In all deciles the male death rates were significantly
higher than females. This analysis is consistent with the analysis by ONS (9).
From 2014 to 2018 the baseline all cause mortality rate in the most deprived decile was
1.9 times that in the least deprived decile in both males and females. This is smaller
than the ratio for COVID-19 mortality rates indicating that the level of inequality in
COVID-19 mortality rates is greater than that for all cause mortality in previous years.
37Disparities in the risk and outcomes from COVID-19
Figure 3.5A and 3.5B. Age-standardised mortality rates for all cause deaths and
deaths mentioning COVID-19, 21 March to 8 May 2020, compared with baseline
mortality rates (2014 to 2018), by deprivation decile and sex, England. Source: Public
Health England analysis of ONS death registration data
3.6 Excess mortality
The PHE excess mortality model shows that between 20 March and 7 May 2020, there
was excess mortality among all five deprivation quintiles. The crude number of excess
deaths ranges from 10,678 in the most deprived quintile areas to 8,621 in the least
deprived. This is a slightly larger relative increase in the most deprived quintile. The
number of deaths with COVID-19 mentioned as a percentage of these excess deaths
ranges from 72-77% across the quintiles.
38Disparities in the risk and outcomes from COVID-19
4. Ethnicity
4.1 Main messages
The highest age standardised diagnosis rates of COVID-19 per 100,000 population
were in people of Black ethnic groups (486 in females and 649 in males) and the lowest
were in people of White ethnic groups (220 in females and 224 in males).
An analysis of survival among confirmed COVID-19 cases shows that, after accounting
for the effect of sex, age, deprivation and region, people of Bangladeshi ethnicity had
around twice the risk of death when compared to people of White British ethnicity.
People of Chinese, Indian, Pakistani, Other Asian, Caribbean and Other Black ethnicity
had between 10 and 50% higher risk of death when compared to White British.
Death rates from COVID-19 were higher for Black and Asian ethnic groups when
compared to White ethnic groups. This is the opposite of what is seen in previous years,
when the all cause mortality rates were lower in Asian and Black ethnic groups.
Therefore, the inequality in COVID-19 mortality between ethnic groups is the opposite of
that seen for all causes of death in previous years.
Comparing to previous years, all cause mortality was almost 4 times higher than
expected among Black males for this period, almost 3 times higher in Asian males and
almost 2 times higher in White males. Among females, deaths were almost 3 times
higher in this period in Black, Mixed and Other females, and 2.4 times higher in Asian
females compared with 1.6 times in White females.
These analyses were not able to include the effect of occupation. This is an important
shortcoming because occupation is associated with risk of being exposed to COVID-19
and we know some key occupations have a high proportion of workers from BAME
groups.
These analyses were also not able to include the effect of comorbidities or obesity.
These are also important factors because they are associated with the risk of death and
are more commonly seen in some BAME groups. Other evidence has shown that when
these are included, the difference in risk of death among hospitalised patients is greatly
reduced.
4.2 Background
Evidence suggests that COVID-19 may have a disproportionate impact on people from
Black, Asian and minority ethnic (BAME) groups. The Intensive Care National Audit and
39Disparities in the risk and outcomes from COVID-19
Research Centre (ICNARC) report published on 22 May found that Black and Asian
patients were over-represented among those critically ill with confirmed COVID-19
receiving advanced respiratory support. The report found that 15.2% and 9.7% of
critically ill patients were from Asian and Black ethnic groups respectively (2).
Some evidence also suggests the risk of death from COVID-19 is higher among people
of BAME groups (15) and an ONS analysis showed that, when taking age into account,
Black males were 4.2 times more likely to die from a COVID-19-related death than
White males (16). The risk was also increased for people of Bangladeshi and Pakistani,
Indian and Mixed ethnic groups. However, an analysis of over 10,000 patients with
COVID-19 admitted to intensive care in UK hospitals suggests that, once age, sex,
obesity and comorbidities are taken into account, there is no difference in the likelihood
of being admitted to intensive care or of dying between ethnic groups (17).
The relationship between ethnicity and health is complex and likely to be the result of a
combination of factors. Firstly, people of BAME communities are likely to be at
increased risk of acquiring the infection. This is because BAME people are more likely
to live in urban areas (18), in overcrowded households (19), in deprived areas (20), and
have jobs that expose them to higher risk (21). People of BAME groups are also more
likely than people of White British ethnicity to be born abroad (22), which means they
may face additional barriers in accessing services that are created by, for example,
cultural and language differences.
Secondly, people of BAME communities are also likely to be at increased risk of poorer
outcomes once they acquire the infection. For example, some co-morbidities which
increase the risk of poorer outcomes from COVID-19 are more common among certain
ethnic groups. People of Bangladeshi and Pakistani background have higher rates of
cardiovascular disease than people from White British ethnicity (23), and people of
Black Caribbean and Black African ethnicity have higher rates of hypertension
compared with other ethnic groups (24). Data from the National Diabetes Audit
suggests that type II diabetes prevalence is higher in people from BAME communities
(25).
Most analyses in this section of the review look at five broad ethnic groups: White /
White British, Black / Black British, Asian / Asian British, Mixed / Multiple Ethnic groups
and Other ethnic groups. The survival analysis looks at sixteen smaller ethnic groups.
These are based on the data available from different sources. Appendix B and the data
sources and methodologies section outline these groups and how they were collapsed.
4.3 Cases
This section presents laboratory confirmed cases under Pillar 1 testing. The majority of
testing under this pillar has been offered to those in hospital with a medical need as well
40Disparities in the risk and outcomes from COVID-19
as NHS key workers, rather than the general population. Confirmed cases therefore
represent the population of people with severe disease, rather than all of those who get
infected.
It was possible to assign ethnicity to 127,821 (91.9%) of the 139,086 individuals who
had tested positive for SARS-CoV-2 by 13 May 2020. Figure 4.1 shows the weekly
number of positive cases by ethnic group since the start of the pandemic. For Black and
Other ethnic groups, the highest weekly number of cases was reported in week ending
4 April and for all other ethnic groups the highest weekly number of cases was reported
in week ending 11 April.
Figure 4.1. Number of positive confirmed cases by ethnic group and week, as of 9 May
2020, England. Source: Public Health England Second Generation Surveillance
System. Note: The last week of data was removed as it was an incomplete week.
Figure 4.2 shows the age standardised diagnoses rates by ethnic group. After
adjustment by age, the highest diagnosis rates of COVID-19 per 100,000 population
were in people of Other ethnic groups (1,076 in women and 1,101 in men) followed by
people of Black ethnic groups (486 in females and 649 in males). This compared to 220
per 100,000 among White females and 224 among White males.
These results are not adjusted for some factors that may influence the likelihood of
becoming infected, such as geographical location. The rates in the Other ethnic group
41Disparities in the risk and outcomes from COVID-19
are likely to be an overestimate due to the difference in the method of allocating
ethnicity codes to the cases data and the population data used to calculate the rates.
1,200
Diagnosis rate (per 100,000)
1,000
800
600
400
200
0
White Black / Black Asian / Asian Mixed / Multiple Other
British British ethnic groups
Males Females
Figure 4.2. Age standardised diagnosis rates by ethnicity and sex, as of 13 May 2020,
England. Source: Public Health England Second Generation Surveillance System.
4.4 Hospitalisations
As of 19 May, 42 trusts had reported lower level of care patients (defined as admission
to any hospital ward, excluding ICU or HDU), and 94 trusts contributed ICU/HDU
(critical care) patient data to the COVID-19 Hospitalisations in England surveillance
system (CHESS). Reporting varies by trusts and the majority of trusts in London do not
consistently report to CHESS which will impact on the representativeness of the
hospitalised cases. The data presented in this section have not been adjusted for this,
which means findings must be interpreted with caution.
The lower level of care subset contained 8,508 cases of which 7,617 (89.5%) could be
linked to Hospital Episode Statistics (HES) to assign ethnicity. The critical care subset
contained 3,978 cases of which 3,219 (80.9%) could be linked to HES to assign
ethnicity.
Among cases hospitalised in lower level of care, 11% were of Black, Asian and other
Minority Ethnic (BAME) groups; however, this proportion was 36% of those admitted to
critical care (Figure 4.3). Confirmed cases among BAME groups tend to be younger
than White ethnic groups, which is likely to explain some of this difference, as might
other factors such as comorbidities.
42Disparities in the risk and outcomes from COVID-19
Figure 4.3. Laboratory confirmed admissions for COVID-19 to acute trusts, by level of
care and ethnicity, England, as of 19 May 2020. Source: Public Health England COVID-
19 Hospitalisations in England surveillance system (CHESS).
4.5 Deaths in confirmed cases
There were 29,673 deaths reported to PHE by 13 May 2020 of which it was possible to
obtain ethnicity for 29,500 (99.4%). For all ethnic groups, the highest weekly number of
deaths was recorded on week ending 11 April, except for Mixed / Multiple ethnic groups
who had an equally high number on week ending 18 April (Figure 4.4).
43You can also read