TERRAIN MODELING, CONTOURING AND ANALYSIS IN AUTOCAD CIVIL 3D - JOHN COOKE CIVILTRAINING, LLC
←
→
Page content transcription
If your browser does not render page correctly, please read the page content below
Terrain Modeling,
Contouring and
Analysis in
AutoCAD Civil 3D

John Cooke
CivilTraining, LLC
a division of Wetland Studies and Solutions, Inc.
Terrain Modeling, Contouring and Analysis in AutoCAD Civil 3D

Digital Terrain Modeling Concepts
Digital Terrain Modeling is a concept that underlies all calculations in Civil Engineering involving
elevation or slope - profiles, cross sections, grading and volume calculations. The process of Digital
Terrain Modeling involves the creation of a data structure that the software can instantly "touch" to
retrieve elevations or slopes, representing either existing or proposed conditions.

The basic concept behind Digital
Terrain Modeling is an old one in
the Civil Engineering and Survey
industry - interpolation.

Prior to Digital Terrain Modeling,
the processing of a network of
plotted spot elevations, such as
those seen in Figure 1.01, involved
the interpolation of intermediate
elevations between known values
as shown. The interpolation lines
drawn in Figure 1.01 were
conveniently created with the
Divide command in AutoCAD®; prior
to CAD, this was often
accomplished with a
graduated rubber band. With the
interpolation complete, any                             Figure 1.01 - Interpolation between Known Elevations
intermediate elevation could be
obtained, or contours drawn. The
process is effective, but time
consuming.

Digital Terrain Modeling
mathematically completes all
interpolation possible between the
data supplied, and stores the result
in a digital file for easy retrieval.
Figure 1.02 shows the triangles that
result from Digital Terrain Modeling
in AutoCAD® Civil 3D®, and the
Tooltip that results when the cursor
is stationary over the digital surface;
Civil 3D retrieves the elevation value
from the digital surface and displays
it in the Tooltip, instantly, and
anywhere on the surface.
                                                        Figure 1.02 - Digital Terrain Model Triangles and Tooltip

02/21/2013       1.08 © Copyright (2013) Wetland Studies and Solutions, Inc. Do not reproduce without permission.   1
The Digital Terrain Models in Civil 3D
have the advantage of many display
options, through their Surface Styles.
Displayed as contours, Civil 3D
obligingly places a contour in the
same location as the interpolated
tick.
Figure 1.03 - Contours over Interpolated Ticks
This chapter serves two purposes. The first is to introduce the reader to Digital Terrain Modeling in Civil
3D, a fundamental concept for both existing and proposed as mentioned above. The second objective is
to serve as a detailed introduction into the operational aspects of Civil 3D, processing data and building
a Civil 3D Object. The Civil 3D Surface Object is in many ways the easiest object in the program to grasp
and to master, as it is readily created and displayed, and is managed by only a single Style in Civil 3D - a
Surface Style. As an introduction in this fashion, the examination of surfaces in this chapter is limited to
the processing of Aerial or Photogrammetric data. Surfaces can certainly be produced from other data
types, including point data; but a discussion of Terrain Modeling from points necessitates familiarity
with Civil 3D point management and is, therefore, deferred to a later chapter.
Data Types for Digital Terrain Modeling
There are certain data types that are universally applicable to any Digital Terrain Modeling effort in Civil
Engineering and Surveying. These data types are constant in any program: Civil 3D, Land Desktop,
InRoads, ArcGIS, etc. The three data types which can be used in constructing a DTM are Point Data,
Breakline Data, and Contour Data.
Point Data - Point Data for Digital Terrain Modeling consist of individual discrete X, Y and Z locations,
without connecting features between them. Typically, these will be spot elevations in a contour
drawing, or the mass points themselves in a Mass Points and Breaklines drawing. Critically, the
Point Data must have an elevation or Z component that can be processed in some fashion in
building the elevation model. In drawing form, Point Data may be Civil 3D points, AutoCAD points or
nodes, or block insertions, text or Mtext inserted into the drawing at true Z elevation. If Point Data
are obtained from GIS, they can be used and processed by AutoCAD® Map 3D if an elevation
attribute is present in the GIS data. Similarly, spot elevation text at elevation 0 in a drawing can be
used and processed by Map into an ASCII file, and ASCII files of XYZ format can be used as well.
02/21/2013 1.08 © Copyright (2013) Wetland Studies and Solutions, Inc. Do not reproduce without permission. 2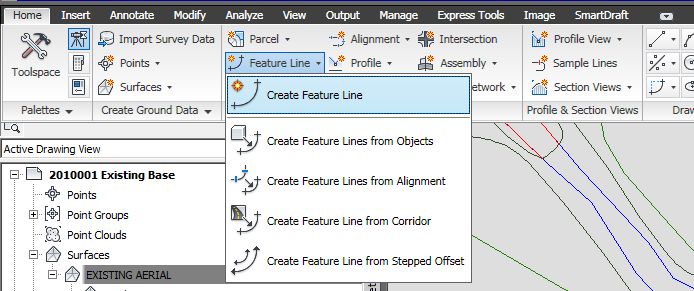
Breakline Data - Breaklines are also referred to as Faults, or Features. Breaklines, as used in this
context, represent the linear edges of site features along which there is a noticeable change in
grade. Successfully applied, a breakline forces a deflection in a contour to show a grade change.
Examples are edges of pavement, shoulders, toes or tops of slope, toes or tops of wall, water
features, etc.
Contour Data - The definition of contour Data for Digital Terrain Modeling is very specific, and not
necessarily what one would expect. Contour Data are strings of point data connected by segments
in complex objects; the CAD representation is a polyline. Contour Data do not have to be at
constant elevation, as one typically thinks of contours. Contour Data are a fast means of selecting
and processing point data, utilizing the vertices of the objects. Most Digital Terrain Modeling
applications will also process the segments between the vertices as breakline data, and can filter out
vertices too close together or add interpolated vertices if required. Contour Data must be at a
correct Z elevation to be processed in a Terrain Model. Polylines must be at a correct Z, either
constant as a 2D polyline, or varying, as a 3D polyline. GIS data can again be used, and AutoCAD
Map can read elevation attributes from GIS Contour Data and apply them to polylines through a
Property Alteration Query.
Most Civil Engineering and Surveying applications will utilize some combination of data types in a
Terrain Model; having two types present is common and all three is not unusual at all.
Critical Civil 3D Surface Feature Settings
Civil 3D has the advantage of being an infinitely customizable program. This advantage allows Civil 3D to
be used effectively in almost any locale or units. Civil 3D has the disadvantage of being an infinitely
customizable program. This disadvantage means that there are a plethora of Civil 3D settings that
control the program, and a concurrent risk that an important setting could be overlooked.
Every element, or Feature, in Civil 3D has its own settings. This means that there are settings that
control the creation, interaction and editing of surfaces, as well as points, alignments, parcels and every
other portion of the Civil 3D system. Civil 3D Feature Settings determine the default styles that will be
applied to each feature, various options unique to the feature's operation, and then Feature Command
settings that fine-tune the way Civil 3D operates.
Feature Settings are among the options controlled on the Toolspace's Settings tab, and are exposed
under each of the various collections listed there. Many Feature Settings can be set at the time data are
actually created, rather than prior to use. Some Feature Settings can be adjusted "on the fly", such as
those for Point Creation. Civil 3D Surface Feature Settings are exceptional, in that certain critical
Surface Feature Settings must be made before any surfaces are created in Civil 3D.
02/21/2013 1.08 © Copyright (2013) Wetland Studies and Solutions, Inc. Do not reproduce without permission. 3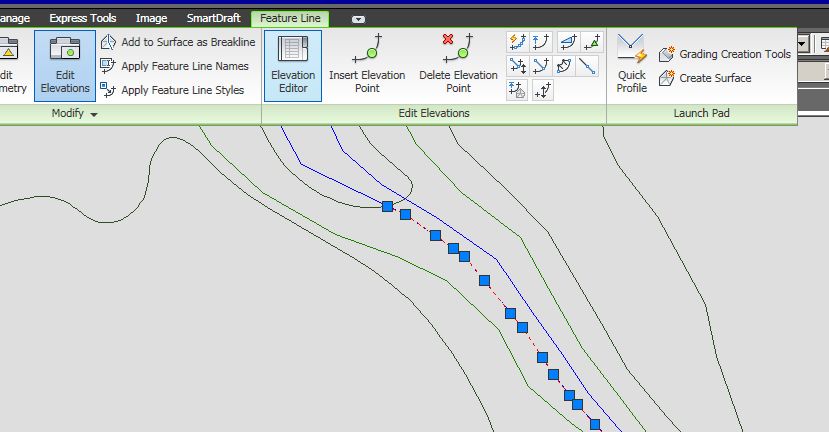
To begin examining Surface Feature settings, expand the
Surface collection on the Toolspace's Settings
tab. Also expand the Commands collection below Surfaces.

Civil 3D Feature Settings are always found at two levels on the
Settings tab: at the parent level of the collection (Surfaces in
this case), and at the appropriate command level for the Civil
3D command to be used (CreateSurface, which we'll get to
shortly).

To examine the settings at the Surfaces parent level, right-
click on Surfaces and pick Edit Feature
Settings from the menu.

In the Edit Feature Settings - Surface dialog, two different
glyphs can be seen.

Settings with the      glyph are actually inherited from the
general Civil 3D Drawing Settings made earlier. Any changes
made to these settings will affect Surface settings only; settings
for any other feature in Civil 3D will continue to reflect the
global drawing settings. An edit of this type would also result
in a Child Override indication in Drawing Settings as discussed
in Chapter 1011.

Settings with the drunken pentagon glyph -       - are the
settings unique to and introduced by the actual Surfaces level.                      Figure 1.23 - Surface Collection and
                                                                                       Command Settings on Settings Tab

Of the three Surface Settings
levels in the dialog, only one
is really important at all
before creating a surface, the
Surface Default
Style. Set to Border Only
in this template, the surface
will initially display only as its
perimeter or border when
built, and this setting can
easily be overridden when
the surface is built. There is
clearly nothing critical here,
so press OK to close the
parent surface Feature
Settings.
                                                      Figure 1.24 - Edit Feature Settings - Surface Dialog

02/21/2013        1.08 © Copyright (2013) Wetland Studies and Solutions, Inc. Do not reproduce without permission.          4
The second level of Civil 3D Feature Settings that should
always be checked on the Settings tab is at the appropriate
command level for the Civil 3D command to be used. In this
instance, we are about to create a surface; to access the
setting for this operation, right-click on
CreateSurface under Commands, and pick Edit
Command Settings from the menu.
Again, different glyphs can be seen in the Edit Command
Settings - CreateSurface dialog. The and glyphs
again refer to settings inherited from the collections above,
Drawing Settings and Parent Surface Feature Settings,
respectively. Changes made at these levels in this dialog
would again be child overrides having no effect on the
drawing or feature settings above.
The new glyph pertains specifically to the operation of
creating a surface, and there are two levels: Surface
Creation and Build Options.
Opening the first collection, Surface Creation, the
options look pretty straight forward. One option that is
somewhat new is the ability to select the Surface
Default Type. Civil 3D can build not only TIN Surfaces
but Grid Surfaces. TINs are Triangulated Irregular Networks,
a specific type of terrain model common to Land Desktop and
many other Civil Engineering and Surveying applications.
TINs are preferable for profiles and cross sections based on
the accuracy of their triangle-based model, but they are not Figure 1.25 - Surface Command
necessarily visually pleasing. Grid surfaces, the other type that Settings on Settings Tab
can be produced by Civil 3D,
model a surface using
quadrangles.
Grid models tend to be visually
smoother, but less accurate for
engineering purposes. Most
surfaces built in Civil 3D will be
TINs so this doesn't seem that
important either. The operator
is being lulled into a false sense
of security at this point, but a
huge land mine in Civil 3D is
looming....
Figure 1.26 - Edit Command Settings - CreateSurface - Surface Creation
02/21/2013 1.08 © Copyright (2013) Wetland Studies and Solutions, Inc. Do not reproduce without permission. 5Collapsing the Surface Creation collection and expanding the Build Options collection, things still appear reasonably familiar. Here the program can exclude data below or above a threshold value, familiar to anyone who has used Land Desktop. There are other data filters, actually restored from earlier versions of Softdesk. One setting seems to stand out though; Allow Crossing Breaklines. Set to yes in this template, the out-of-the- box setting for this value as supplied from Autodesk® is no. Figure 1.27 - Edit Command Settings - CreateSurface - Build Options Anyone who has used any previous Civil product knows that a basic tenet of terrain modeling is that Breaklines, as already defined in this chapter, cannot cross. In Land Desktop, when one breakline crossed over another, one or both would be ignored. This rule extends even to field work - surveyors are taught that when running linework for bottom face and top face of a curb, in a curve, care must be taken to align the bottom and top shots together so the fault lines will not cross. It has always been that way. So why does this setting seem to negate a basic rule of terrain modeling, and allow crossing breaklines? And who would want to anyway? The answer is simple: Autodesk is changing the rules - and the language - on the fly. Used in this dialog, Breaklines, does not mean Breaklines as we have defined (and used for years). Breaklines means TIN Triangles. The setting means "Allow Crossing TIN Triangles: Yes, or No?" As confusing as this seems, one must know a little more about how TINs are constructed in Civil 3D before answering the question. Unlike Land Desktop, Civil 3D does not wait until all data are selected for the surface and then perform the interpolation between all selected data. Civil 3D builds the surface interactively as each set of data are added... As already described, many surfaces are built from a combination of data types. In this example, the aerial spot elevations will be used, the contours will be used, and (true) breaklines will be developed and used. Building the TIN in Civil 3D, as soon as the spot elevations are selected, the program will build TIN triangles between them. The contour vertices will then be added to the TIN in a second step. If the "Allow Crossing TIN Triangles: Yes, or No?" setting is set to No (the factory default), Civil 3D will cheerfully reject the addition of the contours to the surface. The obscure "Allow Crossing Breaklines" setting will reject them. This operation results in an unexpected occurrence of the Event Viewer, packed with warning messages, frustration, and calls to tech support. In order to build a surface from more than one type of data in Civil 3D the "Allow Crossing Breaklines" must be set to Yes. The Allow Crossing Breaklines setting must be set to Yes in Civil 3D. 02/21/2013 1.08 © Copyright (2013) Wetland Studies and Solutions, Inc. Do not reproduce without permission. 6
Now that the "Allow Crossing TIN Triangles" land mine has been avoided, a second one appears.
Setting the Allow Crossing Breaklines option to Yes enables another setting below it,
Elevation to Use. This option has three choices, one of which uses the dreaded "A" word. This
setting determines how triangle edge elevations should be handled when triangles already built are
reevaluated by the addition of another set of data: Should the elevation of the first data set be used, the
elevation of the last data set be used, or the elevations averaged (argh).
Figure 1.27 - Determination of Elevation to Use for Crossing TIN Triangles
Again, some deeper analysis is required. Consider for a moment a cross sectional topographic survey of
a road, and the production of a TIN from the data. The field crews set stationing, and shoot cross
sections at a defined interval, for sake of example 25 feet. The road in question involves a crown, edges
of pavement, and edges of shoulder. The crew runs linework for the crown, EPs and shoulders, and
these lines will be used as breaklines in the surface.
Additionally, the crew also picks up other points on the road surface: manholes, inlets, water shutoffs,
gas shutoffs, traffic light trip plates and the like. All of these data will be added to the TIN as points.
The most reliable way to build this TIN is to set the Elevation to Use setting to Use first
breakline elevation at intersection, then to select the breaklines for the surface first,
then select the point group. This allows the TIN to be built first from the breaklines, which properly
model the general cross sectional characteristics of the crowned road. Adding the points second then
allows the TIN to deflect up or down in the areas influenced by individual points within the general
shape of the road. If the point data were selected first when building the surface, the TIN would
connect the manholes, inlets, water shutoffs, gas shutoffs, and traffic light trip plates, forming
triangles whose elevations would not be changed by the later addition of the breaklines.
The way to use the Terrain Modeler in Civil 3D is to set the Elevation to Use setting to Use
first breakline elevation at intersection, then to select data for the TIN based on its
accuracy, adding the most accurate data first, and moving sequentially through data of lesser
accuracy.
This concept is critical for successful use of the Terrain Modeling in Civil 3D! Civil 3D arguably has the
best Terrain Modeler that has ever appeared in an Autodesk product. It has many new settings and
concepts, and, once understood, can produce TINs of exceptionally high quality.
The Elevation to Use setting should be set to Use first breakline elevation at intersection,
and then data should be selected for addition to the TIN based on their accuracy, with higher
accuracy data selected first.
Set the Allow Crossing Breaklines and Elevation to Use settings as described, and
press OK from Command Settings.
02/21/2013 1.08 © Copyright (2013) Wetland Studies and Solutions, Inc. Do not reproduce without permission. 7Starting the Surface in Civil 3D
To begin creating the existing aerial surface in Civil 3D,
change to the Prospector tab. Right-click on the
Surfaces collection, and click Create Surface
from the menu.
It should be noted that this is only one of several
methods to start the surface. The process can also be
started from the Home tab of the Civil 3D Ribbon, Create
Ground Data Panel, Surfaces Dropdown, Create Surface.
The interface used is the preference of the operator. In
many instances, right-clicks from the Prospector will be used
in these chapters; we feel these are faster in many cases,
and are available to readers using versions prior to Civil 3D
2010.
Figure 1.29 - Create Surface in Prospector
The Create Surface dialog appears. Taking
care of the easy entries first, supply the
surface Name and Description.
A less-than-obvious consideration
for the surface name is the capitalization.
Since the surface name will be suffixed to
a layer name, be sure to type the surface
name in all caps if your layer naming
convention is to use capitals.
Figure 1.30 - Create Surface Dialog with Name and Description
02/21/2013 1.08 © Copyright (2013) Wetland Studies and Solutions, Inc. Do not reproduce without permission. 8The Surface layer in the upper right corner of the dialog is wrong for an existing surface; a C-
TOPO surface would be for proposed. Since this surface is from aerial data, the base layer needs to be
changed to R-TOPO. To override the layer, press the button in the upper right. As the Object
Layer dialog opens, press the button in its upper right. Select a new base layer, or use the New
button to create a new base layer. Press OK from two dialogs back to Create Surface.
Figure 1.31 - Dialogs to Change Surface Base Layer
The Border Only style set as the default for
surface creation will not give a good sense of
how the TIN is built in Civil 3D. Change it by
clicking on the button in the Style field.
As the Select Surface Style dialog opens, use
the drop arrow to select Triangles Only as the
new surface style. Press OK back to the
Surface Creation dialog, and press OK from
there.
Figure 1.32 - Selection of Surface Style
02/21/2013 1.08 © Copyright (2013) Wetland Studies and Solutions, Inc. Do not reproduce without permission. 9The new empty EXISTING AERIAL surface definition is
added to the Prospector. Use the glyphs to expand the
levels below it, including the Definition level where data will
be added.
If the Prospector can be thought of as the equivalent of
the Land Desktop Terrain Model Explorer, it must also be
thought of as the equivalent of the Land Desktop TIN data file.
The TIN in Civil 3D exists only in the Prospector in this
drawing, not in an external data file, unless it must be
exceptionally large.
Figure 1.33 - Surface in Prospector
Adding Spot Elevation Data
The surface in the example project will be built from a combination of spot elevation, breakline and
contour data; following the advice given above, the breakline data would normally be added to the
surface first, as these data are of the greatest accuracy or significance. For instructional purposes, we
will deviate from those instructions here in the interest of showing exactly how a surface is built by Civil
3D, and will add the spot elevation data first. In normal practice, the spot elevations would be the last
data added, after the breaklines and contours.
Data should be selected for addition to the surface based on their accuracy, with higher
accuracy data selected first.
In order to facilitate some layer management magic that will be needed to select the spot elevations, it
is helpful if their layer is made current; if there is more than one layer of spot elevation data to be used,
any one of them can be made current.
Remembering that the spot elevations in this drawing are
AutoCAD points, they will be added to the surface as
Drawing Objects. Right-click on Drawing
Objects under the Definition level for the
EXISTING AERIAL surface, and pick Add from the
menu.
Figure 1.34 - Add Drawing Objects from Prospector
02/21/2013 1.08 © Copyright (2013) Wetland Studies and Solutions, Inc. Do not reproduce without permission. 10The Add Points from Drawing Objects dialog allows selection of a
variety of AutoCAD entities; select Points from the list,
corresponding to the objects found in the drawing. Supply a
Description for the objects, and press OK to select them in
the drawing.
Figure 1.35 - Add Points from Drawing Objects
The Select objects: prompt appears, requiring the selection of the spot elevations in the drawing.
This is one of the places where Civil 3D differs substantially from Land Desktop: selection by layer is not
an option. Civil 3D lacks the social graces that Land Desktop had in many areas; rather than offering a
custom selection option, Civil 3D usually reverts to regular AutoCAD selections. It would have been
possible to isolate the spot elevation layer before starting the selection, and that would have worked
fine. The disadvantage to isolating the spot elevation layer, from a training standpoint, is that the
surface layer would be turned off by that operation and the surface not displayed until the isolate
reversed (assuming, of course, that isolate is set to turn layers off....). The best solution to selecting data
for the surface is to revert to an old AutoCAD trick - a transparent command.
At the Select objects: prompt, type 'LA and press Enter; the Layer Properties Manager appears
inside, and without interrupting, the AutoCAD selection! In the Layer Properties Manager, turn off all
layers except the spot elevations - R-SPOT ELEVATION in this case. Press OK to exit the Layer
Properties Manager, returning to the Select objects: prompt.
Select all of the spot elevations with a Window or Crossing selection, but do not hit Enter to
close the selection.
02/21/2013 1.08 © Copyright (2013) Wetland Studies and Solutions, Inc. Do not reproduce without permission. 11Figure 1.36 - Selecting Spot Elevations with Crossing AutoCAD is still at the Select objects: prompt; again type 'LA and press Enter to redisplay the Layer Properties Manager. Turn the layers back on (or restore a layer snapshot to be really tricky), and again press OK to exit the Layer Properties Manager and return to the Select objects: prompt. At this point, the selection and layer hocus-pocus are done; press Enter to end the selection, and Civil 3D builds the surface. 02/21/2013 1.08 © Copyright (2013) Wetland Studies and Solutions, Inc. Do not reproduce without permission. 12
Figure 1.37 - Drawing with Surface from Spot Elevations

A lot just happened; let's look at the transparent layer stuff first. Many AutoCAD commands can be run
inside another command by typing their command name prefaced with an apostrophe as we did here.
This is an extremely old AutoCAD trick, and has been around at least since AutoCAD 10. Autodesk used
to allow this by picking many of the icons in earlier versions; it was possible in earlier releases to trigger
the Layer Properties Manager transparently by picking its icon from the Layers toolbar, but it doesn't
work in 2010. Typing still works though, and typed commands will often allow access to parts of
AutoCAD that just can't be reached any other way. While we're on the topic, other niceties, like layer
previous, layer isolate, don't work transparently, whether typed or picked - only the low level AutoCAD
commands work.

There also wasn't a better way to do that selection set inside the Civil 3D command. Select similar
doesn't work there, nor does a PICKFIRST selection work. You can pass a selection set to the command
with P for previous, old school AutoCAD again.

Now let's turn our attention to the surface built in the drawing. As soon as data are selected for a
surface in Civil 3D, the surface is built, totally different from the process in Land Desktop. The surface
has triangulated between the spot elevations selected, and the Triangulated Irregular Network, or TIN,
shows in the drawing. The TIN is displayed in the drawing based on our selection of a Surface Style that
shows it, Triangles Only; more on the Surface Style later.

Clicking on a TIN line in the drawing, it is obvious that the whole TIN is one object in the drawing; the
Properties Palette lists it as a TIN Surface, and venturing into the List command reports it as a
AECC_TIN_SURFACE. It is important to remember that the surface in Civil 3D exists only in the drawing.
There is no database. The information shown in the Prospector is the data structure itself. Clicking on
the Definition level in the Prospector shows a summary of the data currently in the surface in the

02/21/2013       1.08 © Copyright (2013) Wetland Studies and Solutions, Inc. Do not reproduce without permission.   13
pane at the bottom. If the TIN is erased from the drawing, it is gone. Period. It's also gone if Joe
Autocad explodes it, but that's another topic....

At this point, it's advisable to save the surface. Since it's drawing data, save the drawing.

Adding Contour Data

Contour data will be the next information added to the surface. Since some layer management magic is
coming once again, set one of the contour layers current.

Remember that the contours in this drawing are polylines, and that they have a significant number of
vertices. They will be subject to filtering when selected, a process known as contour weeding.

Selection of contour data begins in the Prospector again, Right-clicking on Contours under
the Definition level for the EXISTING AERIAL surface, and picking Add from the menu.

What pops up next is the Add Contour Data dialog, with contour Weeding factors, Supplementing
factors and Minimize flat areas settings. This is one of the most misunderstood dialogs in Civil 3D, but a
critical dialog from the standpoint of TIN accuracy, so some detailed explanation is in order.

Figure 1.38 - Add Contours from Prospector

                                                                          Figure 1.39 - Add Contour Data Dialog

02/21/2013         1.08 © Copyright (2013) Wetland Studies and Solutions, Inc. Do not reproduce without permission.   14
Weeding Factors
The Weeding Factors, in the Add Contour Data dialog, supply the filtering of vertices on contours
selected for inclusion in the TIN. Remember that each contour vertex added to the TIN becomes the
endpoint of a TIN triangle; if there's too many vertices, you'll need to lease time on a Cray to build the
TIN. The Weeding Factors filter out vertices too close together through the application of a Weeding
Distance and Weeding Angle, which are applied together to filter along each contour.
The first three vertices of a contour are shown in Figure 1.40.
Figure 1.40 - Vertices along Contour
The Weeding process begins by examining the Distance through the first three vertices of the contour as
highlighted in red in Figure 1.41. If this cumulative distance through the first three vertices is greater
than or equal to the Weeding Distance specified in the Add Contour Data dialog, the vertex will be
used in the TIN, and the program continues, evaluating the next three vertices in the contour. If this
cumulative distance is less than the Weeding Distance specified in the Add Contour Data dialog, the
program evaluates the Deflection Angle between the vertices.
Figure 1.41 - Cumulative Distance through Three Vertices
02/21/2013 1.08 © Copyright (2013) Wetland Studies and Solutions, Inc. Do not reproduce without permission. 15The Deflection Angle is evaluated as shown in Figure 1.42. If the Deflection Angle is greater than or
equal to the Weeding Angle specified in the Add Contour Data dialog, the vertex will be used in the
TIN, and the program continues, evaluating the next three vertices in the contour.
Figure 1.42 - Deflection Angle through Three Vertices
If, however, the Deflection Angle is also less than the value specified in the Add Contour Data dialog,
the contour segment is too short or too straight, the intermediate vertex will be ignored in producing
the TIN, much as shown in Figure 1.43. The program continues to evaluate the next combination of
three vertices along the contour, and cycles through all contours selected.
Figure 1.43 - Resulting Treatment of Short, Straight Segment
It should be noted that Contour Weeding in building a surface does not remove vertices from the
contours; it simply filters which vertices will or will not be used in the surface.
The challenge in working with Civil 3D is to come up with numbers for contour weeding to plug into the
dialog box. For sites ranging in size from 10 to 250 acres, a good rule of thumb is 25' of weeding
distance and 2° of angle. The numbers can be decreased for smaller sites and increased for larger ones.
With the objective of the Weeding Factors being to remove vertices too close together along a contour,
the objective of Supplementing Factors is to add vertices to polylines having very few. Supplementing is
especially important with filleted contour polylines, such as are seen in proposed surfaces, as a filleted
polyline has no vertices around the arc.
02/21/2013 1.08 © Copyright (2013) Wetland Studies and Solutions, Inc. Do not reproduce without permission. 16Supplementing Factors
Supplementing consists also of two values, but they are applied separately rather than together. The
Supplementing Distance is applied through straight segments of a contour, between vertices, and the
Mid-Ordinate Distance is applied through a true arc.
A portion of a filleted contour is shown in Figure 1.44. The original segment is shown in green, and it has
four vertices: the endpoints and beginning and end of the arc. Without supplementing, these would be
the only vertices used in the TIN, and it would jump right across the arc.
The Supplementing Distance is applied to the contour first as shown in Figure 1.44. The program
measures down the contour by the Supplementing Distance; if a vertex is not found, one is added. This
process continues to, and resets at, the next actual vertex, and skips over the arc as seen, continuing to
add more vertices with the same spacing.
Figure 1.44 - Supplementing in Straight Segments
02/21/2013 1.08 © Copyright (2013) Wetland Studies and Solutions, Inc. Do not reproduce without permission. 17The treatment of the arc revolves around the application of a mid-ordinate distance, the deflection of
the arc from its chord measured at and perpendicular to the midpoint of the chord. The definition of a
polyline arc in AutoCAD uses this measurement, shown dashed in red in Figure 1.45, and this is why no
vertices are present around the arc. The Supplementing Mid-Ordinate Distance in Civil 3D specifies a
new shorter chord as seen in the Figure; where this chord hits the arc, a new vertex is added, and the
same new chord length is repeated along each arc found to supplement vertices to allow the TIN to
include the arcs.
Figure 1.45 - Supplementing in Arcs
The challenge again in working with Civil 3D is to come up with numbers for contour supplementing for
the dialog box. For sites ranging in size from 10 to 250 acres, a good rule of thumb is 100' of
supplementing distance and 2' of mid-ordinate distance. The numbers again can be decreased for
smaller sites and increased for larger ones.
Minimizing Flat Areas
The lower half of the Add Contour Data dialog supplies options to Minimize flat areas. These options
control the application of a new concept for Autodesk products found in Civil 3D, Surface Trending.
Surface Trending attempts to minimize flat areas formed by TIN triangles jumping across contours,
rather than by projecting from the bulge in a contour to the next higher or lower elevation. Flat areas
formed in TINs lead to "steps" in profiles and sections, and are the reason why contours formed from
TINs in Land Desktop often did not match the contours from which the TIN was produced.
Figure 1.46 - Minimize Flat Area Options
02/21/2013 1.08 © Copyright (2013) Wetland Studies and Solutions, Inc. Do not reproduce without permission. 18The best guidance for building an Existing surface from contours is to accept the defaults in the Add
Contour Data dialog, leaving Filling gaps in contour data, Adding points to flat
triangle edges and Adding points to flat edges each On, but leaving Swapping
Edges Off. Turning on Swapping Edges slows the processing of the TIN significantly, and additional
flipped faces are often not worth the overhead. It is better to examine the TIN with the defaults
processed, and then rebuild with the fourth option enabled if desired.
It should also be noted that None of the Minimize flat areas options should be used in building a
Proposed TIN from contours. The use of Surface Trending with a proposed TIN would radically alter the
TIN shape from what is desired. An example of the result of Surface Trending is coming later in the
example.
Never use the Minimize Flat Areas
options in building a proposed TIN from
contours.
Returning to the selection of data for this
surface, the Description is entered, the
Weeding Distance and Angle
values supplied, the Supplementing
Distance and Mid-Ordinate
distance supplied, and the Minimize
flat areas settings left in their defaults.
Press OK to select the contours.
Figure 1.47 - Add Contour Dialog Settings in Example
At the Select contours: prompt, type 'LA and press Enter, displaying the Layer Properties
Manager again. In the Layer Properties Manager, turn off all layers except the contours - R-
CONTOURS 2 and R-CONTOURS 10 in this case. Press OK to exit the Layer Properties Manager,
returning to the Select contours: prompt.
Select all of the contours with a Window or Crossing selection, but do not hit Enter to close
the selection.
02/21/2013 1.08 © Copyright (2013) Wetland Studies and Solutions, Inc. Do not reproduce without permission. 19Figure 1.48 - Selecting Spot Elevations with Crossing
AutoCAD is still at the Select objects: prompt; again type 'LA and press Enter to redisplay the
Layer Properties Manager. Turn the layers back on (or again restore a layer snapshot), and again press
OK to exit the Layer Properties Manager and return to the Select objects: prompt.
Press Enter to end the selection, and Civil 3D rebuilds the surface, adding the contour data.
The updated TIN will display in the drawing, and the Event Viewer should appear.
Figure 1.49 - Event Viewer
The appearance of the Event Viewer announces the fact that TIN triangles already formed have been
crossed by the addition of the second set of data, the Crossing Breaklines setting discussed earlier. Had
this setting under Surface Feature Settings not been made, the Event Viewer would be full of error
messages, and the TIN would look significantly different - missing most of the contour data in fact.
Before dismissing the Event Viewer, clear it; use the Action pulldown within the Event Viewer itself,
and select Clear All Events. Then close the Event Viewer with the in its upper corner.
02/21/2013 1.08 © Copyright (2013) Wetland Studies and Solutions, Inc. Do not reproduce without permission. 20This is also a good time to Save the drawing.
Figure 1.50 - Surface after Addition of Contour Data
02/21/2013 1.08 © Copyright (2013) Wetland Studies and Solutions, Inc. Do not reproduce without permission. 21Adding Breakline Data to the Surface Breaklines are essential in the preparation of an accurate surface, and are necessary to correctly illustrate features that have their own grade characteristics, such as the edge of a road. Creating Breaklines from Drawing Information While there are edges of roads in the example aerial, they will actually be replaced by surveyed field work for the two main roads involved, to be supplied as points and breaklines in a later chapter. One location where breaklines would still potentially be useful would be in the streams, shown in this drawing as 2D polyline features. The edges of stream could be important in the surface if HEC-RAS sections were to be prepared from it using tools in SmartDraft®, though an additional breakline would be required for the thalweg of the stream to correctly shape it in the surface. In any event, breaklines often need to be prepared from plan features, such as those provided, and the trick is how to accomplish it. Looking at an area where the breaklines are needed, one can see how the blue edge of stream in the drawing meanders from contour to contour. The elevation where the edge crosses the contour can be determined, and a 3D Polyline could be drawn starting from there. The problem is that there are quite a few vertices required before reaching a known elevation at the next contour crossing, and the elevation of each vertex would have to be interpolated as the polyline is drawn. There is a tool in Civil 3D that can actually handle this interpolation in a somewhat automated fashion, and can be used to ultimately produce a 3D Polyline usable as a breakline in Figure 1.63 - Blue Edge of Water Crossing Contours the existing surface. The command is actually a Grading command that produces a Civil 3D Feature Line, but a Feature Line, when exploded, becomes a 3D Polyline, exactly what we want at this point. Some setup in preparation for drawing the breaklines is required. There is a R-FEATURES layer in the drawing; the features or breaklines for the aerial should really be on this layer, so make it current (it may be frozen). Several running OSNAPS will be required in this exercise: turn on running OSNAPS of Endpoint and Nearest, clearing any other that may be on. Zoom in to an area where breaklines are needed. 02/21/2013 1.08 © Copyright (2013) Wetland Studies and Solutions, Inc. Do not reproduce without permission. 22
If working with the aerial drawing supplied in the dataset, careful inspection of the R-FEATURES
layer will reveal that most of the breaklines are actually there!
To begin, a command will be
selected from the Ribbon. From
the Home Tab, Create
Design Panel, open the
Feature Line Dropdown
and pick Create Feature
Line.
Figure 1.64 - Create Figure Line Command in Ribbon
The Create Feature Lines dialog displays, with way more
options than are needed in this case.
Each Feature Line in Civil 3D needs to be contained in a Site.
Sites have no bearing on what we're doing here, and we really
don't want to spend time on their definition, so leave the
Site set to the default.
Sites are geospatial envelopes serving as the
containers for interrelated alignments, parcels and grading.
Yeah, we'll leave that for another day.
The Name can be turned off, and the Style turned off.
The Layer option can be changed to Use current
layer.
Press OK from the dialog.
Figure 1.65 - Create Figure Lines Dialog
02/21/2013 1.08 © Copyright (2013) Wetland Studies and Solutions, Inc. Do not reproduce without permission. 23The command prompts Specify start point:,
and things now start getting tricky. The intent is to
start a piece of the breakline where the edge of
stream crosses a contour, indicated by the red circle
in Figure 1.66. The problem is that this picked point
must use the elevation of the contour itself, and that
is no small trick in AutoCAD. The point cannot be
picked with an Intersection snap (INT), as there is no
intersection due to the objects being at different
elevations. The use of an Apparent Intersection
snap (APPINT) won't work as planned either, as
AutoCAD would insist on using the elevation of the
object with a Z of 0; not what we want.
Figure 1.66 - Location for Picked Vertex on Breakline
The solution is to use another old trick in AutoCAD,
a .XY filter, which instructs AutoCAD to use only the
X and Y coordinate of a picked point, and to get the
Z from somewhere else. At the Specify start
point: prompt, type .xy and press Enter.
AutoCAD prompts Specify start point:.xy
of; pick the place where the stream and contour
cross; an APPINT snap can be used, but it's overkill.
With the point picked, AutoCAD prompts (need
Z):; place the cursor anywhere on the contour,
allowing the running OSNAP to lock it on the
contour and pick; AutoCAD will read the elevation
from the contour and echo it at the prompt, press
Enter. Figure 1.67 - Cursor after Picking with .XY
This gets the Feature Line started at the elevation of the contour. It's going to get tricky (trickier) from
here, so watch the command line options.
The command should be prompting Specify the next point or [Arc]: Move down the feature
slightly to the next vertex along it to be used, and pick. The running Endpoint and Nearest snaps
should make this easy.
The command will prompt Specify elevation or
[Grade/SLope/Difference/SUrface/Transition] : offering the last elevation used.
The elevation at this picked point is not known; we want the program to interpolate this elevation based
on the next known elevation we give it. To start this interpolation mode, type T for Transition at
this prompt and press Enter.
02/21/2013 1.08 © Copyright (2013) Wetland Studies and Solutions, Inc. Do not reproduce without permission. 24Move along the feature, and pick the next desired
vertex. The command now prompts Transition
or Grade/SLope/Elevation/Difference/
SUrface] :. Since we need to
remain in the Transition mode until the next known
elevation, press Enter, as Transition has now
become the default option on the command line.
Continue picking vertices along the feature, and
remembering to hit Enter for Transition at
each picked point, until just before the next location
where an elevation is to be specified (the next
contour crossing).
Figure 1.68 - Approaching Next Contour
Don’t forget to hit Enter for Transition for each picked point, or this is going to get ugly.
In Figure 1.68 we've come up on another contour, so some more hocus-pocus is due.
To deal with the known elevation at the contour crossing, again type .xy and Enter prior to picking
at the contour crossing. Once the crossing is picked, again pick right on the contour to satisfy the Need
Z: prompt.
The command will now prompt:
Specify the next point or [Arc/Length/Close/Undo]: .xy of _non (need Z):
Distance 116.36', Grade 1.72, Slope 58.18:1, Elevation 180.00'
Transition or [Grade/SLope/Elevation/Difference/SUrface] :
The elevation read is at the command line, but one line up from the current command. Type E for
Elevation to use the elevation value read for this picked vertex, and Enter to confirm the
Elevation. The command uses the original elevation for the first vertex, this picked elevation for the last
vertex, and interpolates all elevations in between!
That elevation wouldn’t even show up if the command line was off and Dynamic Input was the only
command interface being used.
At this point, continue in the command, picking the next vertex and returning to the Transition
mode by typing T. Don't try to go too far, however; it’s better to build a bunch of these rather than
trying to do one long one.
Also, be very careful of the Undo option in the main command line: Specify the next point or
[Arc/Length/Close/Undo]:. When you get buggered up in the command, it seems like it would be
easy to back up on vertex one at a time with the Undo option. In reality, the Undo option hoses the
transition totally. Better to either pull-up and start again, or hope for the best and finish where you are,
hopefully cleaning up a vertex turning toward the center of the earth in AutoCAD. The command is
unforgiving, and won’t let you out without specifying an elevation for the current segment.
02/21/2013 1.08 © Copyright (2013) Wetland Studies and Solutions, Inc. Do not reproduce without permission. 25When you've run along the feature as long as you need or as long as you dare, end the command with
an extra Enter at the command prompt.
Figure 1.69 - Segment of Feature Line Drawn in This Example
Before adding the Feature Line to the surface, it would be helpful to make sure it is correct. This can be
easily accomplished by using one of the Contextual Tabs in the Ribbon.
02/21/2013 1.08 © Copyright (2013) Wetland Studies and Solutions, Inc. Do not reproduce without permission. 26Click on the Feature Line to display its Grips. As the Feature Line Contextual Tab appears,
move to its Edit Elevations tab, and pick Elevation Editor.
Figure 1.70 - Feature Line Contextual Tab in Ribbon
The Feature Line elevations display in the Grading Elevation Editor, which is a tab in the Panorama.
Scroll through the elevations, making sure there is nothing unexpected. Bad elevations could be edited
here; but, frankly, if the Feature Line is buggered up, it's usually better to erase it and start again.
Figure 1.71 - Feature Line Elevations in Grading Elevation Editor
Satisfied that the elevations are (hopefully) fine, close the Grading Elevation Editor with the button
in its corner.
The process used to create the breakline has produced a Civil 3D Feature Line. The Feature Line itself is
overkill at this point, and will just create complication in the Prospector later. Sacrifice the Feature Line
at this point by exploding it in AutoCAD; the exploded Feature Line is a 3D Polyline, the preferred
vehicle for a breakline.
Repeat this process until all breaklines needed in the drawing have been produced.
There will actually be only two that need to be created in the example drawing. You're welcome.
Be sure to Save the drawing when all breaklines are created.
02/21/2013 1.08 © Copyright (2013) Wetland Studies and Solutions, Inc. Do not reproduce without permission. 27Adding Breaklines to the Surface
Before adding the breaklines to the surface, change the Surface Style back to Triangles Only in
Surface Properties. This will make the impact of the additional breaklines easier to see.
The impact of the added breaklines will be most evident in the northwestern most portion of the site,
where there is a major stream which is presently not visible in the TIN triangles. The TIN crosses over
the edges of the stream with no knowledge of its existence, as seen in Figure 1.72.
Figure 1.72 - TIN Crossing over Edges of Stream
The color of the TIN has been changed by changing the color of its layer of insertion.
To add the breaklines to the surface, Right-click on
Breaklines under the Definition level for the
EXISTING AERIAL surface, and pick Add from the menu.
Figure 1.73 - Add Breaklines from Prospector
02/21/2013 1.08 © Copyright (2013) Wetland Studies and Solutions, Inc. Do not reproduce without permission. 28The Add Breaklines dialog displays. Enter a
Description as appropriate. The
breakline type will be Standard, since
the objects to be selected are 3D Polylines.
The other breakline types are
explored in later chapters.
The Weeding factors and
Supplementing factors can be
left off; these can be used to modify the
number of vertices along the breaklines in
the same manner as for contour data.
Press OK from the dialog.
Figure 1.74 - Add Breaklines Dialog Settings in Example
At the Select Objects: prompt, use the same transparent layer magic with 'LA to turn off the
layers other than the breaklines, select the breaklines, then again use 'LA and turn the layers back
on. After pressing enter to end the selection, the surface is rebuilt.
Figure 1.75 - Selecting Breaklines with Crossing
The updated TIN will display in the drawing, and the Event Viewer should again appear.
02/21/2013 1.08 © Copyright (2013) Wetland Studies and Solutions, Inc. Do not reproduce without permission. 29Figure 1.76 - Event Viewer
The appearance of the Event Viewer again announces the fact that TIN triangles already formed have
been crossed by the addition of the third set of data, the Crossing Breaklines setting discussed earlier.
Before dismissing the Event Viewer, clear it; use the Action pulldown within the Event Viewer itself,
and select Clear All Events. Then close the Event Viewer with the in its upper corner.
Returning to a view of the surface again in the northwest corner of the site, notice how the TIN
Triangles, which previously crossed over the stream, now have been re-triangulated to include it. The
breaklines have clearly worked as expected.
Figure 1.77 - TIN Crossing Incorporating Edges of Stream
Again, this is a good time to Save the drawing.
02/21/2013 1.08 © Copyright (2013) Wetland Studies and Solutions, Inc. Do not reproduce without permission. 30Surface Integrity and Data Security With the breaklines added to the surface, some thought should be given to the management of the drawing, and its anticipated uses. This is the Existing Base drawing, which will be Xref'd into the overall drawing set to display existing conditions. Many of the existing features will become start points for proposed features, perhaps being offset or otherwise manipulated in AutoCAD. The breaklines produced are 3D duplicates of features already visible in the drawing as 2D objects, and their duplicate presence would seem unnecessary. 3D polylines are often troublesome in a drawing as they cannot be offset, and are hard to manipulate. In earlier Civil applications, including Land Desktop, when breaklines were defined, they were added to a breakline database, and the original 3D polylines could be erased to reduce the drawing size….. Civil 3D is different. There is no database for the breaklines, in fact, there is no database for the surface. Moreover, everything in the surface continues to be dynamically linked to the objects from which it was produced. If the breakline 3D polylines are erased (or exploded), the breaklines will be removed from the surface and the surface will be rebuilt. Care must be taken in Civil 3D to insure that the objects from which the surface (or other Civil objects) are produced remain in the drawing, intact. This situation extends as well to the aerial contours. In spite of the fact that the surface can now be displayed as contours, the original contours must remain in the drawing. This becomes part of the impetus for use of a Civil Project; using a project, this drawing can be isolated from others in the set, but this surface can be shared with other drawings with far less overhead. More on that in later chapters. Several other related concepts come into play in dealing with the data integrity we're discussing. Surfaces, like most Civil Objects, can be locked to prevent accidental edits and unintended updates. Surfaces should be locked to protect them, and we'll deal with surface locking shortly, after we do some TIN editing. The updating of surfaces can be controlled, and updates are managed through the Rebuild options available by Right- clicking on the surface name in the Prospector. The surface will always Rebuild when new data are added. Whether or not it Rebuilds at other times, including when underlying data disappear, is controlled by the Rebuild Automatic setting in the Prospector. For the time being, we've left Rebuild Automatic Off; if Civil 3D sensed that the surface needed to be rebuilt, it would communicate it by placing a glyph before the surface name. That glyph can be misleading, and we'll talk about it, and the Rebuild Automatic setting, in a later chapter. Civil 3D normally links the surface to the full set of underlying data Figure 1.78 - Surface Options from which the surface is built, providing the dynamic linkage described. An option is to create a Snapshot within the surface, which creates a duplicate copy of the underlying surface data and binds it in the surface object. Doing this "protects" the surface; even if Joe Autocad erases the original contours, the surface will stay intact. In reality, surface snapshots are not the panacea they seem. Surface snapshots bloat already large drawings to huge proportions, with a concurrent degradation of performance. It's much better not to use snapshots, to make sure the drawing is backed up, and to send Joe Autocad to training. 02/21/2013 1.08 © Copyright (2013) Wetland Studies and Solutions, Inc. Do not reproduce without permission. 31
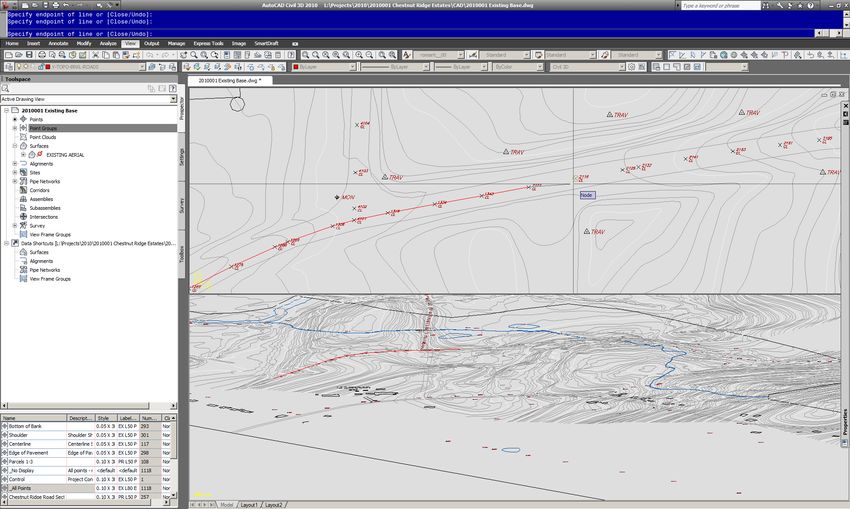
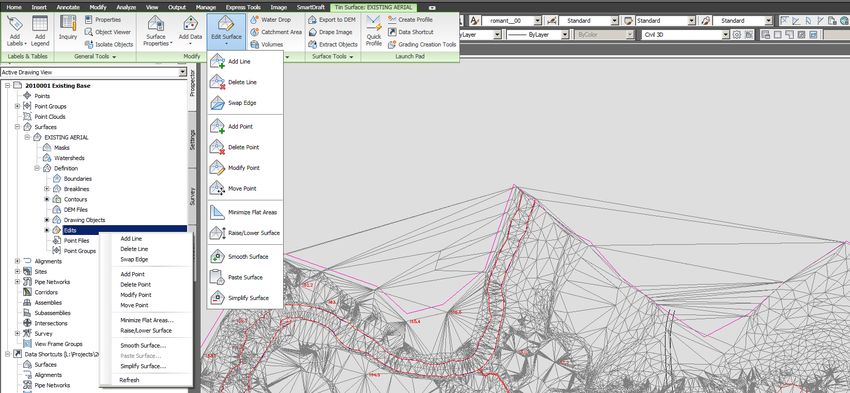
Surface Editing
The surface, as produced thus far, has some TIN triangles around the outside edge that are wrong, and
will need to be cleaned up. These triangles can be affected several ways, by conventional TIN Editing, or
by the application of a Boundary. Though we'll eventually add a boundary in this example, we want to
talk for just a moment about TIN editing.
In order to edit the TIN, the surface must be displayed using a Surface Style that shows the triangles.
The triangles can be the only element shown, as is the case at the moment, or the triangles can be
shown along with other elements, such as the contours. The CivilTraining.Com template drawing
includes two Proposed Contours - Edit Surface styles that display contours and triangles for this
purpose.
The Edit Surface commands themselves can be accessed either of two ways: Right-clicking on the
Edits level below Definition below the Surface Name reveals an Edit Surface Menu,
and clicking on the surface to select it in the drawing displays the TIN Surface Contextual Tab
in the Ribbon, where Edit Surface is found on the Modify Panel. We've managed to show both
through the magic of mirrors in Figure 1.79, along with some of the bad triangles that we're after.
Figure 1.79 - Edit Surface in Prospector and Ribbon
We'll spend more time with other surface edit operations in a later chapter, but the pertinent tool here
is Delete Line. Picking Delete Line from either interface takes one to a Select edges: prompt;
individual TIN edges can then be selected in the drawing to be deleted. Curiously, Civil 3D suppresses
AutoCAD's Selection Set Automatic here. Picking in blank space in the drawing should start an
automatic Window or Crossing, but doesn't. A Crossing selection can be started within the
command by typing C, or a Fence selection by typing F. The advanced selection options work, but
won't start automatically.
Thanks again, Autodesk.
Working around the drawing, as many TIN edges as desired can be cleaned up in this fashion. When
done, the surface needs to be saved. Again, since the surface is drawing information, save the drawing
to save the surface.
02/21/2013 1.08 © Copyright (2013) Wetland Studies and Solutions, Inc. Do not reproduce without permission. 32Though we're supposed to love the Ribbon, this type of TIN editing is WAY faster if the command
is started from the Prospector. To bring up the Contextual Tab, the surface has to be selected in the
drawing. To be selected, AutoCAD highlights the surface - that takes time. Then, as each set of TIN
lines is deleted, AutoCAD has to update the highlight, taking even more time. Some AutoCAD
documentation suggests turning off highlights totally. That's such a bad idea we won't even tell you how
to do it.
Adding Boundaries to The Surface
Boundaries can be added to a surface, to suppress the display of some data, to show other data, or to
add a hard clip beyond which no data will be added.
The boundary concept has been present in Terrain Modeling for some time, and the basic prerequisite
remains the same as in previous versions - boundaries need to be closed polylines, the closed polylines
cannot self-intersect, cannot have duplicate vertices, and the closing segment must be formed by the
Close option in the pline or 3D polyline command, not by snapping back to the original vertex. In fact,
some Data Clip boundaries in Civil 3D can also be defined from other Civil Objects, including Parcels,
Feature Lines or Survey Figures.
The aerial drawing provided includes a good candidate for a surface boundary, the limit of certification
provided as a polyline by the aerial company.
To start the application of the boundary, Right-click on Boundaries below Definition below
the Surface Name and pick Add from the menu. The Add Boundaries dialog displays.
Supply a Name to identify the boundary.
Figure 1.81 - Add Boundaries Dialog
Figure 1.80 - Add Boundaries
There are four different types of boundaries that could be selected: Outer, Show, Hide and
Data Clip. A Hide boundary suppresses the display of TIN data beyond the boundary; the data are
02/21/2013 1.08 © Copyright (2013) Wetland Studies and Solutions, Inc. Do not reproduce without permission. 33You can also read