Statistical Review of Progress to Inform the Mid-Term Review of the Uganda Health Sector Development Plan 2015/2016 2019/2020 - Ministry of Health
←
→
Page content transcription
If your browser does not render page correctly, please read the page content below
Statistical Review of Progress to Inform the
Mid-Term Review of the Uganda Health Sector
 Development Plan 2015/2016 - 2019/2020

                          October 2018

                       Ministry of Health, Uganda

                          In collaboration with

            World Health Organization, Geneva and Brazzaville
           School of Public Health, Makerere University, Uganda
    Countdown to 2030 for Women’s, Children’s and Adolescents’ Health
                     University of Manitoba, Canada

                                    i
TABLE OF CONTENTS

Table of Contents.................................................................................................................................. ii
Figures ...................................................................................................................................................iii
Tables ....................................................................................................................................................iv
Foreword............................................................................................................................................... v
Executive Summary ..............................................................................................................................vi
1.0 Background ................................................................................................................................ 1
2.0 Data And Methods .................................................................................................................... 2
3.0 National Progress ...................................................................................................................... 4
3.1. Progress against HSDP targets .................................................................................................. 4
3.2. Comparative analysis of Uganda’s results................................................................................. 6
3.3. Discussion on findings by program area ................................................................................... 8
3.4. Health information system implications ................................................................................. 10
4.0 Overall mortality and morbidity levels and trends ................................................................. 11
4.1. Maternal and child mortality................................................................................................... 11
4.2. HIV, TB and malaria ................................................................................................................. 12
4.3. Under-5 mortality trends by subregion .................................................................................. 13
5.0 Progress towards the specific HSSP III health and disease targets......................................... 14
5.1. Fertility and family planning – good progress in rural women ............................................... 14
5.1.1. Fertility ..................................................................................................................................... 14
5.1.2. Contraceptive use .................................................................................................................... 15
5.1.3. Adolescent fertility .................................................................................................................. 15
5.2. Maternal and newborn care.................................................................................................... 15
5.3. Child immunization .................................................................................................................. 16
5.4. Child health and nutrition ....................................................................................................... 17
5.5. Malaria ..................................................................................................................................... 18
5.6. HIV/AIDS ...................................................................................................................................19
5.7. Tuberculosis ............................................................................................................................. 20
5.8. Sanitation Coverage ................................................................................................................ 21
6.0    Health system .......................................................................................................................... 22
6.1. Policies and strategies .............................................................................................................22
6.2. Financing ................................................................................................................................. 23
6.3. Health workforce .................................................................................................................... 24
6.4. Health infrastructure and service utilization ......................................................................... 24
6.5. Health service delivery ........................................................................................................... 26
6.6. Health information system ..................................................................................................... 27
6.7. District League Tables ............................................................................................................. 29
6.8. New challenges for the health system: NCD .......................................................................... 30
7.0     Hospital and Health Centre IV assessment ................................................................................                         31
8.0     Equity analysis ............................................................................................................................      34
8.1. General progress in reducing inequalities by wealth and place of residence ....................... 34
8.2. Subnational performance assessment by region ................................................................... 37
9.0    Appendix 1: Assessment of health facility data quality of the districts and subregions ........ 40

                                                                              ii
FIGURES
Figure 3-1: Percent of target population who received key RMNCH interventions, Uganda and 9 peer
countries. (Bar indicates the average score for the 10 interventions) ................................................................ 6
Figure 3-2: Percent distribution of health expenditure by source, Uganda and subregion ................................ 7
Figure 3-3: Main results, factors contributing to change and main implications for HSDP................................. 8
Figure 4.1-1: Adult mortality per 1,000 persons between ages 15 and 50 years................................................ 12
Figure 4.2-1: Malaria inpatient admissions per 1000 and deaths per 100,000 (left panel) and malaria.............12
Figure 4.3-1: Under-5 mortality per 1,000 live births, trends 2000-2015, UDHS, by subregion ......................... 13
Figure 5.1.1-1: Contraceptive use (modern methods) and family planning coverage rates............................... 14
Figure 5.2-1: Antenatal care (ANC 4 or more visits) and deliveries in health facilities:....................................... 16
Figure 5.3-1: DTP3 and Measles immunization coverage trends from UDHS and DHIS data ............................. 17
Figure 5.4-1: Stunting and underweight in children under 5 years (%), UDHS 2011 and UDHS 2016 ................ 18
Figure 5.5-1: Febrile children tested for malaria 2016......................................................................................... 19
Figure 5.5-2: Treatment received by febrile children........................................................................................... 19
Figure 5.6-1: Estimated Number of New HIV Infections .......................................................................................20
Figure 5.8-1: Households by type of sanitary facilities, UDHS 2011 and 2016 .....................................................21
Figure 6.4-1: Figure 6.4-2: .......................................................................................................................25
Figure 6.6-1: Data quality score, by district, 2013-2017 data from HMIS / DHIS .................................................27
Figure 6.8-1: % of women and men 15-49 years overweight or obese, UDHS 2011 and UDHS 2016 .................30
Figure 8.1-1: Under-5 mortality per 1000 live births by wealth quintiles............................................................ 35
Figure 8.1-2: Under-5 mortality per 1,000 live births, by place of residence....................................................... 35
Figure 8.1-3: Stunting in children under 5 years by wealth quintiles................................................................... 36
Figure 8.1-4: Composite coverage index (CCI) for RMNCH interventions by wealth quintiles............................ 36
Figure 8.2-1: Under-5 mortality per 1,000 live births for the top and bottom three regions............................. 37
Figure 8.2-2: Stunting and CCI for the top and bottom three regions (average), UDHS 2011 and UDHS 2016.. 37
Figure 9-1: Number............................................................................................................................................... 41
Figure 9-2: Distribution of districts by relative difference between reported ANC1/DPT1.................................. 44
Figure 9-3: District reported numbers of DPT1 by ANC1, excluding Kampala and Wakiso .................................. 44
Figure 9-4: Distribution of districts by DPT1/ANC1 ratio with expected value of 90 ........................................... 45
Figure 9-5: Distribution of districts by DPT3/DPT1 ratio with expected value in the range of 75-90% ............... 45
Figure 9-6: Consistency of time series DPT1 and ANC1: number of districts in each category ........................... 46
iiiTABLES
Table 2-1: Summary of Uganda health and health related surveys since 2010 .................................. 3
Table 3-1: HSDP 2015/16 – 2019/20 Indicators, with progress........................................................... 4
Table 3-2: Main strengths and priorities for action for the data sources and processes....................10
Table 6.6-1: Overall health facility data quality score by district, Uganda 2013-2017........................ 28
Table 7-1: Quality of data over time for fourteen regional and four large PNFP in Uganda .............. 32
Table 7-2: Hospitals/HC IV with data quality issues based on the presence of outliers...................... 32
Table 8.1-1: Inequality gaps in select indicators by residence, wealth and region.............................. 34
Table 8.1-2: Ranking of the regions according to rates of under 5 mortality, Stunting and CCI......... 38
Table 8.1-3: The percentage coverage of 8 interventions along 4 stages........................................... 39
ivFOREWORD
The Ministry of Health in collaboration with all key stakeholders and health development
partners have conducted a Mid Term Review (MTR) of the progress in implementation of the
Health Sector Development Plan (HSDP). The HSDP was developed and approved as the
Health Sector planning framework within the National Health Policy and National
Development Plan II for the period 2015/16 – 2019/2020. The HSDP provides the overall
strategic and implementation framework for the Health sector and is aimed at contributing
towards Universal Health Coverage and overall Development goal of the Country in regard
to accelerating Economic growth and transformation as the country moves towards middle
income status.
The overall goal of the HSDP is To accelerate movement towards Universal Health Coverage
(UHC) with essential health and related services needed for promotion of a healthy and
productive life”. This was designed to be achieved by focusing on achieving Universal Health
Coverage through addressing four major strategic objectives: 1) To provide inclusive and
quality health care services through policy formulation and providing strategic direction,
planning and coordination of health care provision in Uganda. 2) To address the key
determinants of health through strengthening of inter-sectoral collaborations and
partnerships. 3)To enhance the health sector competitiveness in the region and globally; and
4) To increase financial risk protection of households against impoverishment due to health
expenditures.
Under each of the strategic objectives were key broad interventions and programs to be
implemented and targets to be met during the five year periods. The interventions were set
out in the HSDP compact with partners and in the annual aide memoires. As the sector is in
the 3rd year of implementation of the HSDP, it was necessary to review progress under each
program area. The extent to which the HSDP has been implemented and targets achieved is
reflected in the analytical report of the HSDP MTR report volume 1. The report identifies key
achievements, bottlenecks and proposes areas for modifications in the remaining life span of
the HSDP.
I am delighted that the report was prepared through a consultative process and has
successfully been tabled to the health assembly. I would like to extend my vote of thanks to
the stakeholders and more so to The World Health Organisation, the external and local
consultants and the team from Ministry of Health for the good report. In a special way, I
thank Dr. Ties Boerma and team, Dr. Solome Bakera and the technical team from Policy and
planning Department, Ministry of Health for their invaluable efforts. May I appeal to all
stakeholders to use the recommendations herein to guide future planning in the health
sector.
In conclusion, I thank Government of Uganda for providing an enabling environment for the
sector to deliver quality and efficient health care.
For God and My Country.
Hon. Dr. Jane Ruth Aceng
vEXECUTIVE SUMMARY
1. HSDP 2015/2016-2019/2020 is an ambitious plan that aims for reaching all in Uganda
with quality services, with a focus on control of infectious diseases and reproductive,
maternal, newborn and child health. The IHP+ Joint Assessment of National Strategies
(JANS) flagged the gap between ambition and financing as an area of concern. The
HSDP midterm review is therefore an important moment to take stock of progress and
performance and identify challenges.
2. This report contributes to the midterm review through an analytical review of
statistical progress and performance of Uganda’s health sector during the first half of
HSDP in comparison to the goals and targets of HSDP. It provides a synthesis of
relevant data, including surveys, health facility and disease surveillance data, facility
assessments, administrative resources data, policy data and research studies. It builds
upon and complements the extensive monitoring system through annual health
sector performance profiles.
3. Among the 41 HSDP indicators, 13 indicators were on track, 16 made progress but too
slow to meet the target, and 10 were not on track. For two indicators no data could be
obtained. Major areas of success included child mortality declines, child nutritional
status improvements and HIV. Major areas of concern included neonatal mortality,
maternal mortality and adolescent fertility.
4. The comparison with nine countries in eastern Africa showed that in general, Uganda
occupies a middle position among the countries in the subregion, sometimes in the
top half, sometimes in the middle but rarely in the bottom half. In terms of
government contribution to health, however, Uganda ranks low (9/10).
5. There were sizeable inequalities in key health indicators by region, residence and
socioeconomic status. However, inequalities in Uganda have generally reduced over
time, reducing the gaps between regions, between urban and rural populations and
between the poorest and wealthiest. Despite progress, important inequalities persist,
and need to be addressed to achieve the Sustainable Development Goal of “Leaving
no one behind”.
6. Uganda’s efforts to monitor performance is commendable, including extensive annual
reviews with district league tables, efficiency assessments of all hospitals and Health
Centre IV, 11 national health surveys in the last 5 years and efforts are made to
improve the HMIS and CRVS systems.
7. Yet, there are major gaps in especially the quality of data. The review found evidence
of some improvements in over reporting by districts, especially for immunizations, but
much more is needed. There are also major differences in data quality between
districts and subregions, which provide an opportunity for learning good practice
from the better performing districts. Considerably greater investments in the HMIS /
DHIS are necessary to develop and maintain a high-quality system that is useful at
district and national levels.
vi1. BACKGROUND
This report provides a midterm analysis of the progress and performance of the Health Sector &
Development Plan 2015/2016-2019/2020 (HSDP). HSDP is the key Ministry of Health document
that provides the guiding framework for the detailed planning and implementation of health
sector activities. All available data up January 1, 2018 are considered to capture the levels, trends
and inequalities during the first half of HSDP.
The HSDP is monitored with 41 indicators with targets for 2019/2020, as well as intermediate
targets. Annual health sector reviews are conducted, informed by a health sector performance
report to assess annual progress towards the targets for the indicators of HSDP. In 2013, the
Ministry conducted an extensive midterm review, covering the previous HSDP.
The overall health sector review links to many other plans and reviews. These include plans that
have a broader development focus (e.g. Strategy to improve health service delivery 2016-2021 as
part of the NRM manifesto 2016-2021 aiming to become a middle-income country by 2021),
specific elements of health services (e.g. health financing strategy 2015/16-2024/25 and quality
improvement framework and strategic plan 2015/16-2019/20), and program-specific monitoring
and reviews (e.g. malaria midterm review of the Malaria reduction strategic plan 2014-2020,
conducted in 2017 and HIV Joint annual review 2016-17, published in the second half of 2017).
The Joint Assessment of National Strategies in 2015 concluded the following: “The HSDP is a very
ambitious plan. It will be implemented at a time when government policy aims at stimulating
economic growth through investments in communication, transportation and infrastructure,
even if this means less resources for the social sectors. The tight fiscal space is not expected to
expand in the plan period, and therefore government health expenditure is likely to remain at the
very low level of around 9 USD per capita. On this backdrop the substantial funding gap of the
HSDP will, in the view of the JANS team, severely undermine the feasibility of the plan.” The
midterm review is an important moment to assess whether health progress in Uganda is stalling
because of lack of finances or other issues.
The primary objective of this report is to review statistical progress and performance of Uganda’s
health sector during 2014 /15 to the end of 2017 in comparison to the goals and targets of HSDP.
It provides a synthesis of relevant data, including health and other household surveys, census,
health facility and disease surveillance data, facility assessments, administrative resources data,
policy data and research studies.
The analytical review was carried out as a desk review of technical reports including population
surveys, programme evaluation reports, policy documents and research studies, as well as
primary data analysis of existing survey and HMIS data. A core analytical team consisting of the
Ministry of Health, School of Public Health/Makerere University, University of Manitoba /
Countdown to 2030, and the World Health Organization conducted the analyses and prepared
the report. Two workshops were held (in February and in June) with the Ministry of Health
programs. At the first workshop programs presented their findings and shared data where
feasible. At the second workshop the core team presented their findings and discussions focused
on the interpretation and implications of these results for HSDP and the health information
system.
12. DATA AND METHODS
The analytical report is based on analysis and synthesis of existing data, including preliminary
data from recent data collection efforts. All existing reports and analyses were brought together.
While the focus is on the period 2014/15 - 2017 attention was also paid to the trends prior to
2014 to help interpret more recent data.
The main sources of data were:
Population health surveys
• Uganda Demographic and Health Surveys 1991, 1996, 2001, 2006, 2011, 2016
• Uganda HIV and Malaria Indicator Surveys 2009, 2014/15
• AIDS indicator surveys: 2011, 2016
• TB prevalence survey 2014/15
• PMA 2020 surveys (family planning, WASH): 2014, 2015 (2), 2016, 2017
• NCD risk factors (STEPS): 2014
• National Service Delivery Surveys: 2008, 2015
Health facility data and reports
• Core HMIS data base: 2012/13 – 2014/15; DHIS2 direct extraction 2015/16-December 1 2018
• Programme databases and annual reports of disease programs
Facility assessments
• SARA 2012 and 2013; National Hospital Census 2014
Administrative data
• Financing: National Health Accounts 2012/13, 2015/16
• Human resources: national reports
• Infrastructure: national database of health facilities (public) (DHIS2)
The two most important data sources are the Demographic and Health Surveys (UDHS) 2011 and
2016 and the health facility data. For several indicators, the UDHS provides current data and
therefore up-to-date information on the results achieved during HSDP (e.g. contraceptive use,
current breastfeeding or child illness treatment practices). For most other indicators, the UDHS
provides retrospective information (e.g. 3 or 5 years prior to the survey).
The health facility reports, often referred to as Health Management Information System (HMIS),
also provide critical information on a range of indicators and can be disaggregated to district and
regional level on an annual basis. Prior to HSDP the HMIS changed from a mixed paper and
electronic reporting system to a web-based system DHIS2. The recording and reporting by health
facilities is still paper based but districts are using the national DHIS2 and results are more
standardized and easily accessible. The DHIS2 had full mainland coverage from 2012/13 and data
for 2012/13 - 2017/18 were used for this analysis. The full year 2017/18 was obtained by
multiplying the data for July-Dec 2017 by two. Annex A describes how this report used the health
facility data, including a data quality assessment.
During HSDP implementation period new districts were established. This report focuses on survey
statistics by 15 subregions that were used in the UDHS 2016. We recomputed all statistics from
the UDHS 2011 for the 15 regions. For the facility data we focused on the 122 districts that were
in place by the beginning of HSDP. The logical results framework with all 41 indicators was used
to assess the achievements against the targets. In addition, the review focused on the extent to
which inequalities were reduced – by socioeconomic and geographic dimensions – as well as
compared the progress in Uganda to those of eight peer countries in the region.
2Survey name Year Primary topic SE Main Funding Wealth/ Education Sex / Urban/ Sub- Sample National Sample Sampling Data public Report on
implementor source income gender rural national design sample size (hh) errors domain web
PMA2020 R6 2018 Family planning Makerere BMGF 4 zones 4,558
University
● ● ● ● ● ● ●
PMA2020 R5 2017 Family planning Makerere BMGF 4 zones 4,503
University
● ● ● ● ● ● ●
National 2016- Access/use, Bureau of Government 11 sub- 6,888
Household Survey 2017 expenditure, W&S
● Statistics
● regions
● ● ●
DHS 2016 Health, esp. Bureau of Government, 15 18,298
RMNCH Statistics USAID, UN
● ● ● ● regions
● ● ● ● ●
Population-based 2016 HIV Min of Health PEPFAR 10 12,882 Preliminary
HIV impact
● ● regions only
assessment
PMA2020 R4 2016 Family planning Makerere BMGF 4 zones 4,840
University
● ● ● ● ● ● ●
PMA2020 R3 2015 WASH, family Makerere BMGF 4 zones
planning University
● ● ● ● ● ● ●
PMA2020 R2 2015 Family planning Makerere BMGF 4 zones 4,257
University
● ● ● ● ● ● ●
GAVI FCE 2015 Immunization Makerere GAVI 19 3,990
Household survey University districts
●
National Service 2015 Use, expenditure, Bureau of DFID, 15 sub- 10,101
Delivery Survey immunization,
● Statistics government
● regions
● ● ●
satisfaction,
WASH
TB prevalence 2014- Tuberculosis Min of Health Global Fund 41,156
3
2015
● ● ● ● (p)
● ●
Malaria indicator 2014- Malaria 10 5,345
survey 2015
● ● ● ● regions
● ● ● ● ●
NCD Risk factors 2014 NCD Min of Health Gov, UN 3,987
● ● ● ● (p)
● ●
PMA2020 R1 2014 Family planning Makerere BMGF 4 zones 4,802
University
● ● ● ● ● ● ●
National Panel 2013- LSMS type; Bureau of 3,123
Survey 2014 nutrition,
● Statistics
● ●
coverage,
mortality
Global Adult 2013 Tobacco use Bureau of CDC 8,982
● ● ● ● ● ●
TABLE 2-1: SUMMARY OF UGANDA HEALTH AND HEALTH RELATED SURVEYS SINCE 2010
Tobacco survey Statistics Foundation, RTI
National 2012- Use, expenditure, Bureau of Government 10 sub- 6,887
Household Survey 2013 W&S
● Statistics
● regions
● ● ●
National 2012 Immunization Min of Health
immunization
●
coverage survey
National Panel 2011- LSMS; service Bureau of World Bank, 5 regions 3,123
Survey 2012 use/access
● Statistics BMGF,
● ● ●
government
DHS 2011 Health, esp. Bureau of Gov., USAID, 10 9,033
RMNCH Statistics UN, UK, Ireland
● ● ● ● regions
● ● ● ● ●
AIDS indicator 2011 HIV Min of Health USAID, 10
survey government
● ● ● ● regions
● ● 11,340
● ● ●
Global youth 2011 Tobacco use Min of Health Multiple 3450 (p)
tobacco survey
● ●3. NATIONAL PROGRESS
3.1. PROGRESS AGAINST HSDP TARGETS
Table 3.1 shows the baseline, midterm target (2016/17) and achievements for the 41 indicators
of HSDP. The extent to which the target has been met, or to which the trend is positive, has been
colour-coded with three categories: on track, slow progress, not on tract.
TABLE 3-1: HSDP 2015/16 – 2019/20 INDICATORS, WITH PROGRESS, BASELINE, ACHIEVEMENTS AND
TARGETS.
Target achieved / on Slow progress Decline/No progress
track
Indicator Progress Baseline Achieved TARGET for
2016/17 2016/17
HEALTH IMPACT
Maternal Mortality Ratio (per 100,000) 438 (DHS 2011) 368 (UDHS 425
2016)
Neonatal Mortality Rate (per 1,000) 27 (DHS 2011) 27 (UDHS 2016) 26
Infant Mortality rate (per 1,000) 54 (DHS 2011) 43 (UDHS 2016) 50
Under five mortality rate (per 1,000) 90 (DHS 2011) 64 (UDHS 2016) 64
Total Fertility Rate 6.2 (DHS 2011) 5.8 (UDHS 2016) 5.9
Adolescent Pregnancy Rate 24% (DHS 2011) 25 (UDHS 2016) 23%
HEALTH & RELATED SERVICE TARGETS
Communicable disease prevention &
control
ART coverage 56% (2014/15) 57% 57%
HIV+ pregnant women receiving ARVs for 72% (2013/14) 94% 87%
eMTCT during pregnancy, labour, delivery
and postpartum
TB Case Detection Rate (all forms) 45% (2014/15) 50% 75%
IPT2 or more doses coverage for pregnant 53.4% (2014/15) 54.4% 71%
women
Malaria cases per 1,000 persons per year 408 (2015/16) 433 329
Under-five Vitamin A second dose 26.6% (2013/14) 25.3% 60%
coverage
DPT3HibHeb3 coverage 71.5% (DHS 79.0% (DHS 95%
2011) 2016)
Measles coverage under 1 year 75.8% (DHS 80% (DHS 2016) 92%
2011)
Essential clinical and rehabilitative care
Bed occupancy rate HC IV 59% 60% 70%
(Hospitals & HC IVs) (2013/14)
Hospital 50% 54% 60%
(2013/14)
Average length of stay Hospital - 4 5.1 3
(Hospitals & HC IVs) (2013/14) 3.2 3
HC IV - 3
(2013/14)
Contraceptive Prevalence Rate 30% (DHS 2011) 39.0% 39%
Couple years of protection 2,196,713 2,156,240 4.4 million
(2014/15)
ANC 4 coverage 48% (DHS 2011) 60% (DHS 2016); 40%
4Indicator Progress Baseline Achieved TARGET for
2016/17 2016/17
39% (HMIS)
Health Facility deliveries 57% (DHS 2011) 73.0% (DHS 75%
2016)
HC IVs offering CEmOC Services 33% (2014/15) 45% 55%
HEALTH INVESTMENT OUTPUT TARGETS
Health infrastructure
New OPD utilization rate 1.2 (2014/15) 1.1 1.2
Hospital (inpatient) admissions per 100
6 (2013/14) 7.8 8
population
Population living within 5km of a health 75% 100% 80%
facility
Medicines and supplies
Availability of a basket of commodities in 64% (2014/15) 83.0% 100%
the previous quarter (% of facilities that
had over 95%)
Improving quality of care
Facility based fresh still births (per 1,000 16 (2013/14) 10.1 14
deliveries)
Maternal deaths among 100,000 facility 132 (2013/14) 148 98
deliveries
Maternal death reviews 33.3% (2012/13) 24.0% 45%
Under five deaths among 1,000 under 5 17 (2013/14) 20.2 17.3
admissions
ART Retention rate 79% (2014/15) 82% 84%
TB Treatment Success Rate 79% (2014/15) 80% 82%
Responsiveness
Client satisfaction index - 69% (2014/15) no data 73%
Health information
Timeliness of reporting (HMIS 105) 85% (2013/14) 88.1% 90%
Health financing
Out of pocket health expenditure as a % of 37% (2011/12) 37% 35%
Total Health Expenditure
General Government allocation for health 8.5% (2014/15) 7.3% 12%
as % of total government budget
Human resources
Approved posts in public facilities filled 69% (2014/15) 73% 70%
with qualified personnel
Number of health workers (doctors, Doctors 1:24,725 1: 28,202 1:24,300
midwives, nurses) per 1,000 population (HSSIP MTR 2013)
Midwives 1 :11,000 1:6,838 1:10,500
(HSSIP MTR 2013)
Nurses 1:18,000 (HSSIP 1: 2,121 1:18,000
MTR 2013)
Social and economic determinants of
health
Children below 5 years who are stunted 33% (DHS 2011) 29.0% 29.0%
Children below 5 years who are under 14% (DHS 2011) 11% 14%
weight
Health promotion and environmental
health
Latrine coverage 73% (2013/14) 77% 78%
5Indicator Progress Baseline Achieved TARGET for
2016/17 2016/17
77% (2014/15)
Villages/ wards with a functional VHT - 75% (2014/15) no data 80%
Overall, 13 indicators were on track, 16 made progress but too slow to meet the target, and 10
were not on track. For two indicators no data could be obtained. Major areas of success included
child mortality declines, child nutritional status improvements and HIV. Major areas of concern
included neonatal mortality, maternal mortality and adolescent fertility.
3.2. COMPARATIVE ANALYSIS OF UGANDA’S RESULTS
The levels and progress in Uganda were compared with nine countries of similar socio-economic
status in the eastern and southern Africa region: Burundi, Ethiopia, Kenya, Malawi, Mozambique,
Rwanda, Tanzania, Zambia and Zimbabwe, based on survey data for coverage statistics and
comparable estimates of selected key indicators from WHO which are modelled based on
household surveys and other sources. The aim was to give an idea on where Uganda stands
among its peers in relation to specific indicators and targets.
Under-5 mortality rates were declining in all countries, and the WHO estimates showed that
Uganda had the third lowest under-five mortality after Rwanda and Kenya. Maternal mortality
estimates are heavily affected by the lack of data. According to the WHO estimates, Uganda had
the 5th lowest maternal mortality ratio among the 10 countries after United Republic of
Tanzania, Mozambique, Burundi and Rwanda in 2015, but these results do not yet take into
account the most recent UDHS 2016.
Figure 3.1 presents the coverage of 10 reproductive, maternal and child health interventions for
which comparable data were available, both for the individual interventions and for an index
calculated as the average of equally weighted rates of the 10 interventions. These data are based
on the most recent surveys from the 10 countries.
FIGURE 3-1: PERCENT OF TARGET POPULATION WHO RECEIVED KEY RMNCH INTERVENTIONS, UGANDA AND
9 PEER COUNTRIES. (BAR INDICATES THE AVERAGE SCORE FOR THE 10 INTERVENTIONS)
100
Maternal child health
90 index
80 ANC 4th visit
70
Skilled birth attendance
60
Percent
50 Institutional delivery
40
30 FP needs satisfied with
modern methods
20 Pneumonia treatment
10
0 Diarrhoea treatment
Fever treatment
Exclusive
6The index for Uganda for the period 2005-2016 was 62.8% which is the 5th highest among the 10
countries after Malawi, Rwanda, Zambia, Zimbabwe and Kenya. The Uganda performance is
affected by relatively poorer scores on the following indicators: family planning, care seeking for
diarrhea, ANC 4th visit, early initiation of breastfeeding, skilled birth attendance and institutional
delivery.
Health financing: in terms of percent of general government expenditure that is allocated to
health Uganda score relatively low among the 10 countries. In 2015, 5.6% went to health, and
only Mozambique had a lower proportion. Burundi and Malawi’s allocations were twice as high
as Uganda. Roughly 40% of current health expenditure comes from external sources (Figure 3.2).
This is slightly higher than the median of 38.5%. Within the domestic portion, Uganda has one of
the lowest percentages of expenditure from domestic general government sources with the
majority of domestic spending coming from private sources (78% of domestic spending is from
private sources).
FIGURE 3-2: PERCENT DISTRIBUTION OF HEALTH EXPENDITURE BY SOURCE, UGANDA AND SUBREGION
100
90
80
70
60
50
External
40 Private
30 Government
20
10
0
In general, the health results show that Uganda occupies a middle position among the countries
in the subregion, sometimes in the top half, sometimes in the middle but rarely in the bottom
half.
73.3. DISCUSSION ON FINDINGS BY PROGRAM AREA
Table 3.3 summarizes the main findings by major program area. These findings were reviewed
and discussed by the participants in the second analysis workshop in June 2018 and enriched
with explanations of contributing factors as well as implications of these findings for the
respective programs at a high level.
FIGURE 3-3: MAIN RESULTS, FACTORS CONTRIBUTING TO CHANGE AND MAIN IMPLICATIONS FOR HSDP BY
PROGRAM AREA, AS DISCUSSED DURING THE SECOND ANALYSIS WORKSHOP.
Main implications for HSDP
Program Main results Factors contributing to change part II
Health Government financing for Economic growth leading to more Strengthen development
systems; health low, not increasing (7% money for health: total health partner coordination; greater
financing and of gen.gov. budget); OOP high expenditure per capita increasing efficiency in resource use; fast
governance and not decreasing (37%); low to $55; Multiple laws and policies track NHIS establishment and
insurance coverage (Main implications for HSDP
Program Main results Factors contributing to change part II
multisectoral approaches
TB Stable treatment success rate Program focused on health Stronger focus on detection
at 80%; service-based detection of TB and untreated patients in
Low case detection rates treatment completion; high levels community
(50%), based on new survey of testing among HIV patients, Further improvement of
results stronger HIV program benefits TB; quality of care to reach higher
limited community focus treatment success rates
Malaria Improvements in prevention High levels of coverage of core Address stagnating progress
coverage and some reduced interventions reached by program with high coverage of all key
parasitemia and prior to HSDP; problems with ITN, interventions for prevention
morbidity/mortality, but no addressed in 2017 campaign and treatment
further recent declines
HIV Strong progress in HIV ART Strong donor support, major Continued emphasis on
and PMTCT everywhere; HIV focus on treatment achieving the 90-90-90 targets,
incidence also likely going but also greater attention for
down but slowly prevention measures to
further reduce incidence
Environmental Latrine coverage stagnating, Need for more indicators on
health and with still about three quarters environmental health,
health of the households with especially water and sanitation
promotion inadequate sanitary facilities related; indicators on
functional VHTs, CHEW
New Increasing importance, major Focus on risk factor reduction
challenges differences within country
(NCD, injuries, and socioeconomic groups;
mental hypertension and diabetes
health) common, obesity increasing
rapidly with much higher
levels among women; tobacco
use mainly men and not
increasing
Inequalities Good progress in reducing Attention for lack of urban
inequalities in coverage, but especially Kampala progress;
differences within Uganda still Focus on poorly performing
exist districts
Main implications for HSDP
Program Main results Factors contributing to change part II
93.4. HEALTH INFORMATION SYSTEM IMPLICATIONS
Table 3.3 summarizes the main findings on the components of the health information system.
These findings were reviewed and discussed by the participants in the second analysis workshop
in June 2018 and enriched with establishing general priorities for action by the core MTR review
team.
TABLE 3-2: MAIN STRENGTHS AND PRIORITIES FOR ACTION FOR THE DATA SOURCES AND PROCESSES OF
THE HEALTH INFORMATION SYSTEM
Area Main achievement Priority for action
Reviews Good process of regular national Build on tradition of comprehensive plans and
reviews with extensive reports, documentation of progress to strengthen system of reviews
mainly based on facility and starting at program and district levels, with synthetic overall
administrative data; some programs program review
conduct thorough reviews of
detailed plan (HIV, malaria)
Surveys Regular surveys provide wealth of Gap in EMOC assessments
information
HMIS Improved reporting by districts, but Conduct data reviews at regional levels and regular DQA at
quality issues are many the facility level; introduce EMR at high volume facilities;
complete and maintain master facility list; focus on local data
analysis and use
Birth and Not present, mobile vital Strengthen CRVS system; roll out ICD 10 and implement
death registration developed in facilities proper system of death certification; link to National
registration (UNICEF) Identification and Registration Authority (NIRA)
Administrativ HRH information system extensive, More emphasis on sharing information and data
e data but not easily accessible; NHA
becoming regular (institutionalized)
- high quality products
Disease System in place for surveillance of Strengthen maternal (and perinatal) death surveillance and
surveillance notifiable diseases response system;
Analytical National: Makerere University Good capacity at national level; formalized partnerships
capacity School of Public Health and Bureau between MOH, Makerere University and UBOS desirable to
of Statistics; Ministry of Health focus on analysis
Resource centre
Districts: limited capacity
District league Annual system in place, transparent Further investments urgently needed to be able to use its full
tables methods, good dissemination potential
Challenge is data quality
Hospital Annual system in place, transparent Further investments will be important to improve data
performance methods, good dissemination quality, analysis and use
(SoU) Challenge is data quality
eHealth Strategy in place Develop standards for EMR, compete review of current
practices
Data Annual review and program reviews Quarterly data review meetings in districts; annual data use
communicatio are key vehicles for data use and meetings; use of small set of indicators and scorecards
n and use demand good statistics and analyses
104. OVERALL MORTALITY AND MORBIDITY LEVELS AND TRENDS
The number of deaths reported by health facilities was 51,640 for 2015/16, 44,989 for 2016/17,
and 57,700 for 2017/18 (based on the reports for the second half of 2017). A rough estimate of
the number of deaths occurring in Uganda in 2017 is about 200,000 (crude death rate 5.4/1,000),
which would mean that just under 30% of deaths take place in health facilities.
The health facility data may provide a general picture of the leading causes of morbidity and
mortality, but no standardized classification of diseases (ICD) is used. The most important statistic
that can be derived from these data is the relative levels and trends in malaria indicators. The
surveys provide critical population-based information on mortality and the prevalence of
infectious diseases.
4.1. MATERNAL AND CHILD MORTALITY
Indicators HSDP Baseline Target Achievement Comments
midterm
Maternal mortality per 438 425 336 Decline according to UDHS
100,000 live births (UDHS 2011) (UDHS 2016) but data refer to 7 years
before survey
Neonatal mortality per 1,000 27 26 27 No decline; UDHS rates refer
live births (UDHS 2011) (UDHS 2016) to 5 year period before
survey
Infant mortality per 1,000 live 54 50 43 (UDHS Decline; UDHS rates refer to
births 2016) 5 year period before survey
Under-5 mortality per 1,000 90 64 64 Decline; UDHS rates refer to
live births (UDHS 2011) (UDHS 2016) 5 year period before survey
Good progress in infant and under-5 mortality but not for neonatal mortality: Infant and under-5
mortality declined rapidly between the Uganda DHS surveys in 2011 and 2016, based on the 5-
year period rates (2007-2011 and 2012-2016). Neonatal mortality however did not decline at all
and was still at the same level in the UDHS 2016, as in the UDHS 2006 and UDHS 2011: 27 per
1,000 live births.
Maternal mortality lower during 2010-2016 than before, but not significantly so: In the UDHS
2016, maternal mortality per 100,000 live births was 336 (95% confidence interval 272-401) for
the seven years before the survey (2010-2016). This was lower than in the UDHS 2011 when
maternal mortality was 438 (95% CI: 368-501) but the difference is not statistically significant.
The percent of adult female deaths 15-49 years that were pregnancy-related remained the same
in both UDHS surveys: 17.5% in 2016 and 18.1% in 2011.
Adult mortality declined rapidly for women and men: The probability that a 15-year-old would die
before age 50 years declined rapidly in Uganda, especially for women which have considerably
lower mortality than men at these ages. HIV mortality is likely to be an important contributor to
this decline in adult mortality.
11FIGURE 4.1-1: ADULT MORTALITY PER 1,000 PERSONS BETWEEN AGES 15 AND 50 YEARS FOR MEN AND
WOMEN, UGANDA DHS SURVEYS 2000-2016 (7-YEAR PERIOD PRECEDING THE SURVEYS).
400
Deaths per 1000 person aged 15
350
300
250
by age 50
200
150
100
50
0
UDHS 2000 UDHS 2006 UDHS 2011 UDHS 2016
Men Women
4.2. HIV, TB AND MALARIA
HIV prevalence and incidence on the decline: the 2016 Uganda Population HIV Impact
Assessment shows that 6.0% of adults aged 15-49 years are living with HIV, down from 7.3% in
2011. Children under 5 and 5-14 years both had HIV prevalence of 0.5%. Adult HIV prevalence
was higher among women at 7.5% compared to 4.3% among men, and higher among urban
compared to rural areas (7.1 and 5.5% respectively). The program has estimated that the number
of new infections has been halved during this period.
TB higher than expected: according to the 2014-15 TB prevalence survey: the number of persons
needing TB treatment was about 1.5 times higher than expected based on previous monitoring
through health facilities (and tuberculin surveys), implying that about 89,000 persons get TB
every year in Uganda.
FIGURE 4.2-1: MALARIA INPATIENT ADMISSIONS PER 1000 AND DEATHS PER 100,000 (LEFT PANEL) AND
MALARIA INPATIENT ADMISSIONS AND DEATHS AS % OF TOTAL ADMISSIONS (RIGHT PANEL), BASED ON
HMIS DATA SUBMITTED TO WHO.
30 75%
20 50%
10 25%
- 0%
2010 2011 2012 2013 2014 2015 2016 2017 2010 2011 2012 2013 2014 2015 2016 2017
Malaria inpatients per 1,000 Malaria deaths per 100,000 Malaria Inpatients % Malaria Deaths %
12Malaria progress stagnated in recent years: malaria remained a leading cause for admission and
cause of death among inpatients: just over 10% of inpatient deaths are due to malaria and about
25% of admissions. The increase in reported number of malaria cases per 1,000 persons from 408
in 2015/16 to 433 in 2016/17 wasmainly driven by increased rates of diagnostic testing with the
annual blood examination rate reaching almost 60% in 2017, one of the highest rates globally.
Test positivity rates have been stable since 2014. The 2016 UDHS and the 2014 UMIS show that
malaria and anemia prevalence in children under 5 have remained stable since 2014 at about
30% (through RDT).
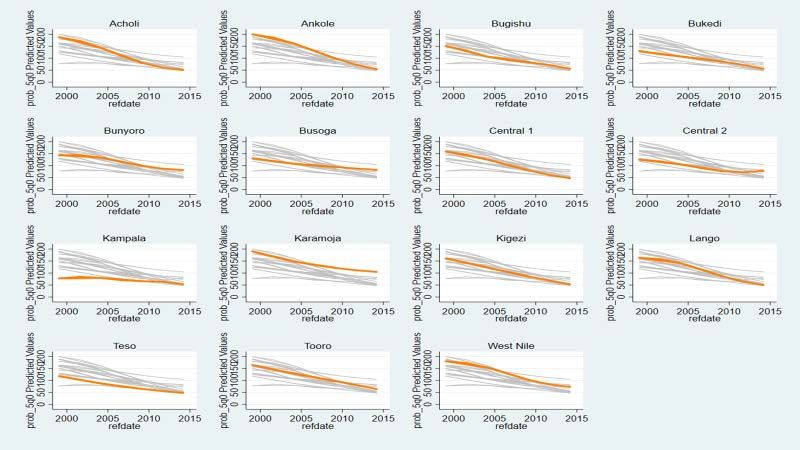
4.3. UNDER-5 MORTALITY TRENDS BY SUBREGION
The UDHS 2016 sample used, for the first time, 15 subregions to assess mortality and health
indicators. New calculations were done with the UDHS 2011 and previous surveys after alignment
of the cluster samples in the survey with the UDHS 2016 subregions. The reference period used
was the 5 years before the survey to capture recent changes. For 2011-2016 Karamoja still had
the highest under-5 mortality (108), followed by Busoga, Bunyoro, North Central and West Nile
(all over 70) and Tooro (66). All other 9 nine subregions had under-5 mortality rates in the narrow
range of 48-57 per 1,000 live births. Confidence intervals around the 5 years regional mortality
rates are wide, but in general the differences are smaller in UDHS 2016 than before.
FIGURE 4.3-1: UNDER-5 MORTALITY PER 1,000 LIVE BIRTHS, TRENDS 2000-2015, UDHS, BY SUBREGION
135. PROGRESS TOWARDS THE SPECIFIC HSSP III HEALTH AND
DISEASE TARGETS
5.1. FERTILITY AND FAMILY PLANNING – GOOD PROGRESS
IN RURAL WOMEN
Indicators HSDP Baseline Target Achievement Comments
Total fertility rate among 6.2 5.9 5.4 Target achieved, rural
women 15-49 years (UDHS 2011) (UDHS 2016) population driving the
decline
Contraceptive prevalence rate 30% 39% 39% Modern methods 34.5% in
(among married women 15- (UDHS 2011) (UDHS 2016) UDHS 2016, 32.3% in PMA
49) 2017
Couple Years of Protection 2.2 mln (DHIS 4.4 mln 2.8 mln (DHIS Increase in CYP according to
2014/15) 2017/18) DHIS data; target not
plausible
Teenagers who have begun 23.8% 23% 24.8% No decrease in adolescent
childbearing (under 20) (UDHS 2011) (UDHS fertility
2015/16)
5.1.1. FERTILITY
• The total fertility rate (TFR), the number of children a woman would have at age 50 by
current fertility rates, declined modestly during HSSP III from 6.2 to 5.4, driven by a decline in
rural fertility from 6.8 to 5.9. Urban fertility rates increased slightly from 3.8 to 4.0.
• TFR was lower in southwestern Uganda, and highest in the eastern and northeastern part of
the country.
• TFR declined in 15 of the 21 regions during HSSP III. The six regions with no decline included
Dar es Salaam and Kilimanjaro, the two lowest fertility regions.
FIGURE 5.1.1-1: CONTRACEPTIVE USE (MODERN METHODS) AND FAMILY PLANNING COVERAGE RATES
(DEMAND SATISFIED) AMONG MARRIED WOMEN 15-49 YEARS, 2011-2017.
60 Contraceptive prevalence rate
Demand satisfied
50
40
30
20
2011, 2014, 2015, 2015, 2016, 2016, 2017,
DHS PMA PMA PMA DHS PMA PMA
145.1.2. CONTRACEPTIVE USE
• Six national surveys were conducted since 2014. Modern contraceptive use among married
women, the main determinant of fertility, increased from 30% to 35% during HSDP (Figure 1).
The demand satisfied for family planning with modern methods (family planning coverage)
increased to 48%.
• Traditional methods are not very common. The increase is largely due to more use of
implants and IUD visits according to PMA surveys and DHIS data.
• The increase in contraceptive use occurred almost exclusively among rural women (23% to
33% during 2011-2016).
• The overall CYP increased from 2.2 million 2015/16 and 2016/17 to 2.8 million in 2017/18
(DHIS). The target is not met, but also unlikely high.
5.1.3. ADOLESCENT FERTILITY
• 25% of girls 15-19 years were either mother or pregnant in 2014/2016, similar to 5 years
earlier (24%). Teenage fertility is twice as common among girls in the poorest quintile (34%)
than among girls in the richest quintile (15%).
5.2. MATERNAL AND NEWBORN CARE
Indicators HSDP Baseline Target Achievement Comments
midterm
ANC 4 visits coverage among 44% (UDHS 43% 60% (UDHS, Major progress in survey,
pregnancy women 2011); 38% 2016); 39% but not in HMIS
(HMIS (HMIS 2017)
2014/15)
Deliveries in health facilities 57% (UDHS 58% 73% (UDHS Increase, target surpassed,
2011); 55% 2016); 60% but major difference
(HMIS, (HMIS, 2017) between survey and HMIS
2014/15)
Fresh still birth rate in health 10.8% 13% 9.7% Overall stillbirth rate
facilities per 1,000 deliveries (2015/16) remains 21/1,000 deliveries
in health facilities
HC IV offering CEmOC 37% 57% 45% (HMIS, Better for Caesarean section
services (2013/14) 2016/17) than blood transfusion
• There is a major increase in both ANC4+ and institutional deliveries during 2009/11 and
2014/16 according the UDHS 2011 and UDHS 2016.for the three-year periods preceding the
2011 and 2016 surveys. According to the UDHS 2016, 73% of women delivered in a health
facility.
• The HMIS data confirm an increase in institutional deliveries rates during the first year of
HSDP but no increase in the percent of women delivering in 2016/17 and the first half of
2017/18, stagnating at about 60%.
15• ANC4 coverage is much lower according to the DHIS data – about 40% - and no progress is
observed during HSDP. The cause of the difference is not clear: UDHS may have
overreporting of visits by women or HMIS may miss many 4th visits.
• The overall stillbirth rate remained at 21 per 1,000 deliveries in 2016/17 and the first half of
2017/18. The fresh stillbirth rate was slightly lower than in 2015/16: 10.2 and 9.7 per 1,000 in
2016/17 and first half of 2017/18 respectively.
• Caesarean Section rates increased gradually from 5.8% to 7.0% per 1,000 births in the
population in 2014/15 in HMIS, and the rate was very close to the UDHS of 6.2% for 2014-16.
• The percent of HC IV facilities offering CEmOC increased to 45% which was still well below
target. The target was met for Caesarean sections (70% of HC IV) but not for blood
transfusion (47%).
FIGURE 5.2-1: ANTENATAL CARE (ANC 4 OR MORE VISITS) AND DELIVERIES IN HEALTH FACILITIES: UDHS
2011, 2016 and HMIS.
100
73
80 57
60
40
20
0
UDHS 2011/12 2012/13 2013/14 2014/15 2015/16 2016/17 2017/18
2011
ANC4 - UDHS 2011 Deliveries - UDHS 2016
ANC - HMIS Deliveries - HMIS
5.3. CHILD IMMUNIZATION
Indicators HSDP Baseline Target Achievement Comments
midterm
DPT – Hib – HepB 3 coverage 93% (HMIS 95% 79% (UDHS, No evidence of progress
(among 12-23 months) 2013/14) 2015/6) after UDHS in HMIS
Measles vaccination coverage 87% (HMIS 95% 80% (UDHS UDHS under 1 yr: 72%; no
(under 1 year) 2013/14) 2016) evidence of progress in
HMIS
• UDHS survey in 2016 provides data for 2015/16 and shows a modest increase since UDHS
2011 for DPT3 (from 71% to 79%) and for measles coverage among children 12-23 months
(from 76% to 80%). The percent children who received measles vaccination before their first
birthday is 72%, well off the HSDP target of 95%.
• HMIS data show much higher coverage rates, but this is likely to be due to overreporting of
immunization data. During the first half of HSDP the numbers of vaccinations (DPT3 and
measles) have declined and the coverage rates estimated from the HMIS have therefore also
16declined. This however may be due to more accurate reporting, and it cannot be concluded
that this is an actual decline of coverage.
FIGURE 5.3-1: DTP3 AND MEASLES IMMUNIZATION COVERAGE TRENDS FROM UDHS AND DHIS DATA
120
100
72 76 76 80
80
60
40
20
0
2010/11 2011/12 2012/13 2013/14 2014/15 2015/16 2016/17 2017/18
DPT3 UDHS Measles - UDHS DPT3 - DHIS Measles - DHIS
5.4. CHILD HEALTH AND NUTRITION
Indicators HSDP Baseline Target Achievement Comments
midterm
Stunting among children 33.4% (UDHS 29% 28.9% (UDHS,
under 5 years 2011) (end) 2015/6)
Underweight among children 13.8% (UDHS 10% 10.5% (UDHS
under 5 years 2011) (end) 2016)
Vit A coverage (2nd dose) 27% (HMIS 62% 37% (HMIS First dose coverage is 60%
children 6-59 months 2013/14) 2017 Jul-Dec)
• Child growth is improving and on target according to the UDHS survey in 2016. Stunting levels
decreased to 29% and underweight to 10.5% of children under 5 years of age.
• Vitamin A supplementation among children 6-59 months was not increasing fast enough to
reach the HSDP target. The HMIS data show 60% coverage of the first dose and 37% of the
second dose in the second half of 2017, similar to the levels in 2015/16. According to the
UDHS there was a slight increase from 57% to 62% of children 6-59 months who had received
a dose of vitamin A in the last 6 months preceding the survey.
• Additional indicators from the UDHS on breastfeeding practices and treatment seeking
patterns for sick children show that in general child health practices did not change much
during 2011-2016 and remained fairly good. Anemia however remained very common.
Indicator 2011 2016 Indicator 2011 2016
Exclusive breastfeeding 0-5 63.2% 65.5% Care seeking for ARI 78.7% 80.4%
months symptoms
Initial breastfeeding < 1 hour 52.5% 66.1% Care seeking for fever 80.1% 81.6%
Moderate and severe anemia 27.0% 29.2% Care seeking for diarrhoea 72.4% 70.5%
17FIGURE 5.4-1: STUNTING AND UNDERWEIGHT IN CHILDREN UNDER 5 YEARS (%), UDHS 2011 AND UDHS
2016
40.0
33.4
28.9
30.0
20.0
13.8
10.4
10.0
-
Stunting Underweight
UDHS 2011 UDHS 2016
5.5. MALARIA
Indicators HSDP 2015/16- Baseline Target Achievement Comments
2019/20 2014/15 2016/17 2016/17
In-patient malaria deaths per 22 (2015/16 13 20.2 (HMIS) Little change in deaths but
100,000 persons per year HMIS) total admission rates
increased.
Malaria cases per 1,000 408 (2015/16 329 433 (HMIS) Increase mainly due to an
persons per year HMIS) increased diagnostic testing
IP 2 or more doses coverage 53.4% (HMIS) 71% 54.4% (HMIS) Little change from HMIS, but
for pregnant women small decline from surveys
• Taking into account all sources of data, the incidence of malaria appears to have been stable
since 2014, though this national trend is likely to conceal local increases and decreases.
• IPT2 coverage is used as a proxy for IPT3 in HSDP monitoring as IPT3 is not currently tracked
in DHIS2. It has changed little and was 54% in 2016/17. However, according to recent MIS
and DHS, IPT2 coverage decreased from 49% in 2014/15 to 46% in 2016 while IPT3 decreased
from 28% to 17%.
• Vector control: 61% of the population slept under an ITN or were protected with IRS in 2016,
compared to 70% in 2014/15. The decrease observed in 2016 can be explained by the
obsolescence of ITN, about 2 years after the 2014 ITN mass distribution campaign. Another
mass distribution of ITNs was completed in 2017 so coverage rates have probably recovered.
Populations aged 5-19 are less likely to sleep under an ITN than other age groups which may
be of concern since parasite prevalence may reach a peak in children over 5 years of age.
• Testing and treatment: according to the DHS 2016 37% of children with fever in the previous
2 weeks attended a public health facility, 44% attended a private facility, while 18% do not
attend any facility. More children in public facilities received a diagnostic test and 72%
received an ACT. Given that recorded test positivity rates are less than 50% these results
suggest over-treatment of fevers with ACTs in both the public and private sectors (i.e. less
than half of those tested should receive an ACT).
18FIGURE 5.5-1: FEBRILE CHILDREN TESTED FOR MALARIA 2016 FIGURE 5.5-2: TREATMENT
RECEIVED BY FEBRILE CHILDREN
50% 50%
40% 40%
No medicine
% of febrile children
% of febrile children
Unknown
30% 30%
Other
Not tested
Analgesics
20% Diagnostic test 20%
Antibiotics
Other antimalarials
10% 10% ACT
0% 0%
Public Private Informal No care Public Private Informal No care
5.6. HIV/AIDS
Indicators HSDP 2015/16- Baseline Target Achievement Comments
2019/20 2014/15 2016/17 2016/17
ART coverage among adults 56% 65% 67% ART coverage exceeded
living with HIV target
HIV+ pregnant women not on 68.3% 87% 90% (AHSPR) Pregnant women using ARVs
HAART receiving ARVs for (2015/16 for eMTCT exceeded target
eMTCT AHSPR)
during pregnancy, labour,
delivery
and postpartum
ART retention rate 79% (HMIS) 84% 82% (HMIS) Increase in ART retention
rate; Target not far from
being achieved
ART coverage and retention rates
• There are 1,300,000 adults living with HIV in Uganda of which 73% know their HIV positive
status. Of those who are HIV positive, there are 67% who are on ART and close to 60% are
virally suppressed.
• ART retention increased to 82% in 2016/17 from 79% in 2014/15 short of the HSDP target of
84%.
eMTCT coverage
• There has been scale up of PMTCT services and there are more than 95% of mothers
accessing the EMTCT services. HIV+ pregnant women not on HAART receiving ARVs for
eMTCT during pregnancy, labour, delivery and postpartum was 90% (38,243/42,467) in
2016/17 which was above the 68% (34,357/50,323) in 2015/16 and above the HSDP target of
87%.
19You can also read