NESTRANS Regional Transport Strategy 2021 - A Rapid Health Impact Assessment Lead Author: David Pfleger
←
→
Page content transcription
If your browser does not render page correctly, please read the page content below
NESTRANS Regional
 Transport Strategy 2021

             A Rapid Health Impact
                 Assessment

Lead Author: David Pfleger

                               January 2008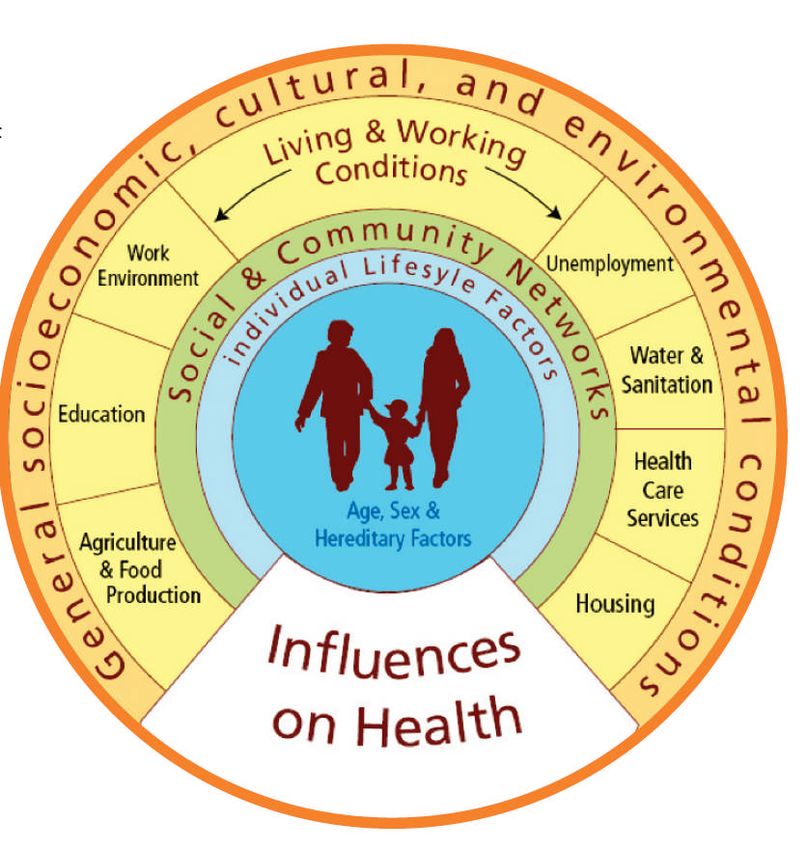
Executive Summary
Background
Nestrans is the Regional Transport Partnership for Aberdeen City and Aberdeenshire. Its
purpose is to develop and deliver a long-term regional transport strategy and take
forward strategic transport improvements that support and improve the economy,
environment and quality of life across Aberdeen City and Shire.
The regional transport strategy published in March 2007 sets out the transport related
challenges for Aberdeen and Aberdeenshire and how these challenges can be
responded to between now and 2021.
Whilst the primary function of transport is enabling access to people, goods and services
it can also have direct or indirect impacts on health. These impacts may be classified as
relating to:
Economic impacts
Accidents related to travel
Pollution (including noise) / impacts on the physical environment affecting health
Physical activity
Access to goods and services
Maintenance and development of community and social networks
Health Impact Assessment
Health impact assessment (HIA) is a combination of procedures or methods by which a
policy, program or project may be judged as to the effects it may have on the health of
the population. The aims of this HIA were as follows:
1. To identify the potential health impacts of elements of the NESTRANS Regional
Transport Strategy (RTS) 2021.
2. To make recommendations as to how positive health impacts associated with the
strategy may be promoted and negative impacts be avoided or ameliorated.
3. To identify elements of the strategy that will require a more detailed health impact
assessment to be undertaken.
Methodology
Following screening by the Public Health Unit, NHS Grampian, a rapid HIA was
undertaken, under the leadership of a joint health and transport Steering Group,
concentrating on the following three sub-elements of the RTS:
1. Expansion and promotion of the use of public transport; e.g. IC1, IC5, IC3, IC7,
EC1, EC3
2. Transport infrastructure proposals; e.g. IC2
3. Changes promoting walking and cycling e.g. IC6
Following a review of the published evidence linking transport and health, a stakeholder
group was brought together including expertise from health, planning, transport and
social care to assess the impacts of the RTS proposals on health and to undertake an
equality assessment.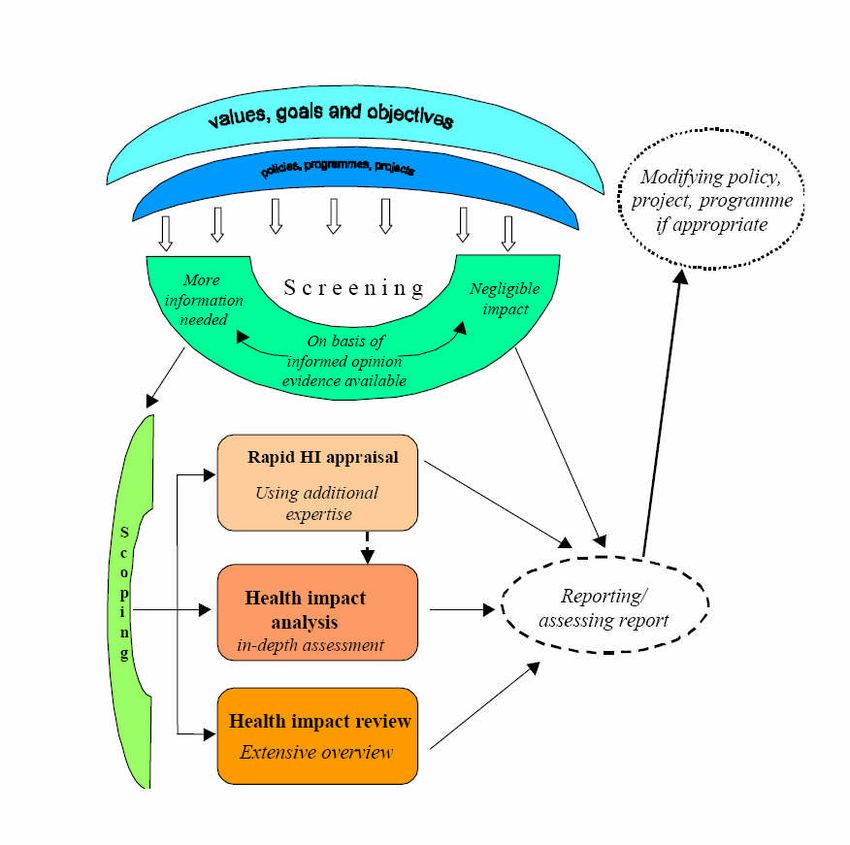
The following recommendations are derived from the stakeholder participatory
workshops. It should be noted that this was a rapid HIA and as such did not include local
community stakeholders. Members of the stakeholder groups were purposively chosen
for their knowledge and experience rather than as representatives of organisations,
groups or geographies.

This rapid HIA set out to assess the impact and inform the implementation of a number
of key strategic proposal areas within the NESTRANS RTS. The following
recommendations are made.

Expansion in public transport

   1. In order to maximise the positive health benefits associated with an expansion in
      public transport, particularly reduced pollution and accidents, it will be necessary
      to ensure that modal shift away from private transportation occurs.

   2. In the initial phases of expansion in public transport provision there will be a need
      to raise awareness of safety, particularly in urban areas, where an initial overall
      increase in traffic density may lead to increases in road traffic accidents.

   3. If the potential negative effects of increased pollution, especially particulates, are
      to be avoided in urban areas, in particular the effects on those in more deprived
      communities, then expansion of public transport must be delivered with
      reductions in both individual and total vehicle emissions.

   4. To create a sustainable change in behaviour action should be taken to promote
      the use of public transport amongst adolescents and young people before they
      take up private transport use and behaviours. This group was also felt to be
      amongst those groups less likely to receive benefits from public transport
      currently.

   5. In expanding public transport consideration should be made of the balance
      between accessibility of public transport access points (e.g. bus stops) and the
      beneficial physical activity undertaken by people in travelling from their point of
      origin to the access point for public transport.

   6. In expanding public transport there is a need to consider the needs of both
      people with physical disabilities, or impaired mobility, and of young families. Both
      these groups could benefit significantly from an expansion in public transport but
      only if their needs for low level access and space once on the bus for
      wheelchairs, frames and prams are provided.

   7. Public transport expansion should take account of where individuals access
      services both now and in the future, particularly essential services such as
      healthcare.
Infrastructure proposals

  1. Accident reductions associated with infrastructure improvements may only be
     delivered if such improvements do not lead to increases in traffic volume.

  2. There is a need to continue the monitoring of air quality within Aberdeen and for
     the NHS to monitor the health of residents within areas of recognised poorer air
     quality.

  3. Infrastructure proposals leading to potential increases in physical activity in the
     form of functional commuting may only occur if traffic volume decreases and or
     safety, and perceived safety, improves.

  4. Infrastructure improvements should be assessed and developed to minimise
     community severance both in new developments e.g. the Aberdeen Western
     Peripheral Route (AWPR) and existing roads where volume of traffic is
     presenting a barrier to community and social networking.

Proposals to increase walking and cycling

  1. Walking and cycling should be promoted as low cost, zero emissions forms of
     transport that benefit the individual and the environment.

  2. Such proposals should be linked to infrastructure changes to improve real and
     perceived safety.

  3. Education should be undertaken to underpin any increase in cycling and walking
     if a rise in the crude number of accidents is to be avoided, particularly until a
     critical mass effect is attained.

  4. Functional physical activity, e.g. commuting to work by bike, should be
     encouraged but not simply as a trade off for other physical activity undertaken in
     spare time.

Recommendations for further work

  1. It is recommended that work should be undertaken through public health, NHS
     Grampian with partners in the local authority and NESTRANS to monitor the
     health of the local population, particularly in areas where air quality is poorest or
     at risk of being poor.

  2. It was noted that detailed environmental impact assessments, including air
     quality and noise, had been or would be carried out for major projects such as
     the AWPR and development at Aberdeen Airport. It is recommended that
     consideration be given to undertaking prospective health impact assessments of
     major projects in the future.
Acknowledgements
The Steering Group would like to acknowledge the input of the following people to the
stakeholder workshops undertaken as part of this assessment.
Rab Dickson Transport Strategy Manager, NESTRANS
Ben Kerfoot Transport Executive, NESTRANS
Ewan Wallace Head of Transportation, Aberdeenshire
Rachel Sharp Infrastructure Strategy Dept, Aberdeen City
Friederike Debus Policy and Planning Children Services to Children & Young People
Aberdeen City Council
Val Tweedie Public Health Lead, Aberdeen City CHP
David Pfleger Consultant in Pharmaceutical Public Health, NHS Grampian
John Gallagher Planning Officer, NHS Grampian
Linda Leighton-Beck Social Inclusion Manager, Public Health, NHS Grampian
Fred Nimmo Statistician Epidemiologist, Public Health, NHS Grampian
Neil Buchanan Physical Activity Co-ordinator, Public Health, NHS Grampian
For further information about this work, please contact David Pfleger, Consultant in
Pharmaceutical Public Health, Public Health Unit, NHS Grampian, Summerfield House,
2 Eday Road, Aberdeen, AB15 6RE.Table of Contents Executive Summary ........................................................................................................1 Background .................................................................................................................1 Health Impact Assessment ..........................................................................................1 Methodology ................................................................................................................1 Expansion in public transport .......................................................................................2 Infrastructure proposals ...............................................................................................3 Proposals to increase walking and cycling ...................................................................3 Recommendations for further work ..............................................................................3 Acknowledgements .........................................................................................................4 Table of Contents............................................................................................................5 List of Tables...................................................................................................................7 List of Figures..................................................................................................................7 List of Appendices ...........................................................................................................8 1: Introduction .................................................................................................................9 1.1 Background ...........................................................................................................9 1.2 Commitment to HIA..............................................................................................10 1.3 Health Impact Assessment ..................................................................................10 1.4 Steps in HIA.........................................................................................................10 1.5 Types of HIA ........................................................................................................10 2: Process and Methods................................................................................................12 2.1 Screening ............................................................................................................12 2.2 Scope of the Health Impact Assessment..............................................................12 2.3 Steering Group ....................................................................................................12 2.4 Aims of this HIA ...................................................................................................12 2.5 Sub-elements of the strategy to be covered by this HIA.......................................12 2.6 Review of the published evidence........................................................................13 2.7 Population profile .................................................................................................13 2.8 Selection of the Transport Rapid HIA Stakeholder Group ....................................13 2.9 Appraisal of health impacts ..................................................................................13 2.9.1 Stakeholder workshops.....................................................................................13 2.9.2 Assessment and grading of health impacts .......................................................14 3: Profile of Aberdeen and Aberdeenshire.....................................................................16 3.1 Geography...........................................................................................................16 3.2 Economy..............................................................................................................16 3.3 Population............................................................................................................16 3.4 Economy and Employment ..................................................................................18 3.5 Deprivation ..........................................................................................................18 3.6 Transport Behaviour ............................................................................................19 3.6.1 Car ownership and use .....................................................................................19 3.6.2 Bus travel..........................................................................................................19 3.6.3 Cycling..............................................................................................................20 3.6.4 Rail travel..........................................................................................................20 3.6.5 Air travel ...........................................................................................................20 4: NESTRANS Regional Transport Strategy..................................................................21 4.1 Background .........................................................................................................21 4.2 Key issues addressed by the strategy..................................................................21 5: Evidence base for health impacts relating to transport ..............................................24 5.1 Determinants of health.........................................................................................24 5.2 Economic.............................................................................................................25 5.3 Transport-related injury and death .......................................................................26
5.4 Pollution and physical environment......................................................................30
   5.4.1 Air pollution .......................................................................................................30
   5.4.2 Transport noise and health ...............................................................................30
   5.5 Physical activity ...................................................................................................31
   5.6 Access to goods and services..............................................................................31
   5.7 Development and maintenance of community and social networks......................31
6: Health Impacts ..........................................................................................................32
   6.1 Health impacts associated with an expansion of public transport .........................32
   6.1.1 Economic impacts.............................................................................................32
   6.1.2 Accidents ..........................................................................................................32
   6.1.3 Pollution / physical environment........................................................................33
   6.1.4 Physical activity ................................................................................................33
   6.1.5 Access to goods and services...........................................................................34
   6.1.6 Development and maintenance of community and social networks...................34
   6.1.7 Specific Groups ................................................................................................34
   6.1.8 Assumptions .....................................................................................................34
   6.2 Health impacts associated with transport infrastructure proposals identified in the
   Regional Transport Strategy ......................................................................................35
   6.2.1 Economic impacts.............................................................................................35
   6.2.2 Accidents ..........................................................................................................36
   6.2.3 Pollution / physical environment........................................................................36
   6.2.4 Physical activity ................................................................................................36
   6.2.5 Access to goods and services...........................................................................37
   6.2.6 Development and maintenance of community and social networks...................37
   6.2.7 Specific Groups ................................................................................................37
   6.2.8 Assumptions .....................................................................................................37
   6.3 Health impacts associated with proposals to increase walking and cycling
   identified in the Regional Transport Strategy .............................................................38
   6.3.1 Economic impacts.............................................................................................38
   6.3.2 Accidents ..........................................................................................................38
   6.3.3 Pollution / physical environment........................................................................38
   6.3.4 Physical activity ................................................................................................38
   6.3.5 Access to goods and services...........................................................................39
   6.3.6 Development and maintenance of community and social networks...................39
   6.3.7 Specific Groups ................................................................................................39
   6.3.8 Assumptions .....................................................................................................39
7: Recommendations ....................................................................................................40
   7.1 Expansion in public transport ...............................................................................40
   7.2 Infrastructure proposals .......................................................................................41
   7.3 Proposals to increase walking and cycling ...........................................................41
   7.4 Recommendations for further work ......................................................................41
References........................................................................................................................
List of Tables
Table 1: Summary of the key transport related effects on health .....................................9
Table 2: Groups and impacts assessed during the participatory stakeholder workshops
......................................................................................................................................14
Table 3: Key issues to be addressed by the NESTRANS RTS ......................................21
Table 4: NESTRANS Regional Transport Strategy Objectives ......................................22
Table 5 Rates of crashes (all vehicles), users and pedestrians killed / seriously injured by
road type (2004) per 100 million vehicle – kilometres travelled......................................26
Table 6: Passengers killed or seriously injured (KSI) rates per billion passenger-
kilometres travelled (2003) ............................................................................................27
Table 7: Summary of reported injury accidents and reported casualties by police force
area, council and severity; 2006 ....................................................................................27
Table 8: Accidents by road type and severity in Scotland; 1996-2006 ...........................28
Table 9: Vehicles involved in RTAs by type of vehicle ...................................................29
Table 10: Casualties by mode of transport and age group, 2006...................................29
Table 11: Summary of noise outputs associated with various forms of transportation ...30

List of Figures
Figure 1: Approach to Health Impact Assessment .........................................................11
Figure 2: Estimated population projections for Aberdeen City and Aberdeenshire 2006-
2031;GRO.....................................................................................................................17
Figure 3: Percentage change in population of Aberdeen city by age group and projection
year ...............................................................................................................................17
Figure 4: Percentage change in population of Aberdeenshire by age group and
projection year...............................................................................................................18
Figure 5: Overview of the main actions proposed in the Regional Transport Strategy ...23
Fig. 6: Dahlgren and Whitehead “Wheel of Health” model .............................................24
Figure 7: Links between Transport and the Economy....................................................25
List of Appendices
Appendix 1 NESTRANS Proposals for Action ...............................................................42
Appendix 2: NESTRANS Rapid HIA Stakeholder Group ...............................................47
Appendix 3: Participatory stakeholder workshops - Rapid Health Impact Assessment of
the NESTRANS Regional Transport Strategy 2021.......................................................48
Appendix 4: HIA matrix for participatory stakeholder workshop to assess health impacts
of expansion and promotion of the use of public transport.............................................51
Appendix 5: HIA matrix for participatory stakeholder workshop to assess health impacts
of Transport infrastructure proposals .............................................................................53
Appendix 6: HIA matrix for participatory stakeholder workshop to assess health impacts
of Promotion of cycling and walking ..............................................................................55
1: Introduction
1.1 Background
Nestrans is the Regional Transport Partnership for Aberdeen City and Aberdeenshire. Its
purpose is to develop and deliver a long-term regional transport strategy and take
forward strategic transport improvements that support and improve the economy,
environment and quality of life across Aberdeen City and Shire.
The regional transport strategy published in March 2007 sets out the transport related
challenges for Aberdeen and Aberdeenshire and how these challenges can be
responded to between now and 20211.
The strategic vision outlined in the strategy is one of a ‘transport system for the north
east of Scotland which enables a more economically competitive, sustainable inclusive
society’.
Whilst the primary function of transport is enabling access to people, goods and services
it can also have direct or indirect impacts on health. These impacts may be classified as
relating to:
Economic impacts
Accidents related to travel
Pollution (including noise) / impacts on the physical environment affecting health
Physical activity
Access to goods and services
Maintenance and development of community and social networks
A summary of key health impacts is provided in Table 1.
Table 1: Summary of the key transport related effects on health
Health Promoting Health Damaging
Enables access to: Pollution:
Employment Particulates
Shops Carbon monoxide
Recreation Nitrogen oxides
Social support networks Hydrocarbons
Health services Ozones
Countryside Carbon dioxide
Lead
Recreation Transport related injuries
Exercise Noise
Economic development Stress and anxiety
Loss of land and planning blight
Severance of communities
Constraints on mobility access and independence
Reduced social use of outdoor space due to traffic
and roads / streets
Source: Faculty of Public Health Medicine 21.2 Commitment to HIA
Health and transport have a close interdependence, both in terms of the particular
accessibility requirements to health care facilities, and the generic impacts that transport
can have upon community health. The Regional Transport Strategy recognises the need
to address the issues of access to hospitals and health services, encouraging active
travel to improve health, and addressing the impact of emissions on public health.
The regional strategy makes a commitment to the development of a health and transport
action plan and the undertaking of a health impact assessment.
This document describes the process, results and recommendations of the health impact
assessment undertaken for the Regional Transport Strategy.
1.3 Health Impact Assessment
Health impact assessment (HIA) is a combination of procedures or methods by which a
policy, program or project may be judged as to the effects it may have on the health of
the population3. Its purpose is two-fold:
1. To assess the potential health impacts - positive and negative - of policies,
programmes and projects.
2. To improve the quality of public policy decision making through recommendations
to enhance predicted positive health impacts and minimise negative ones3.
The results of HIA may be used to change a proposal or guide the implementation of a
strategy to protect and promote the health of the community or population.
1.4 Steps in HIA
Figure 2 provides a schematic overview of the stages undertaken in health impact
assessments3.
HIA involves five key stages4:
1. Screening – To make a decision as to which proposals should be subject to HIA.
2. Scoping – Agreeing the boundaries of the HIA.
3. Appraisal – Assessing the health impacts of this proposal, and what changes
could be suggested to minimise / ameliorate the negative and maximise the
positive.
4. Decision-making – Making recommendations to change the proposal in order to
minimise / ameliorate the negative and maximise the positive health effects.
5. Monitoring and evaluation – Agreement of the outcomes to be assessed
associated with the changes to implementation recommended as part of the HIA.
1.5 Types of HIA
There are three types of HIA5:
1. Rapid – Completed in a limited timeframe using existing, readily available
information and data.
2. Comprehensive / in-depth: Completed in an extended timeframe, including the
collection and analysis of new information and data.
3. Intermediate: A combination of rapid and comprehensive approaches where
timeframes are limited but new data collection and analysis is involved.Figure 1: Approach to Health Impact Assessment Source: WHO, 19993
2: Process and Methods
2.1 Screening
Screening was undertaken by members of the public health unit, NHS Grampian.
Following the screening process it was concluded that the proposals laid out in the
strategy may have potentially significant impacts on health to a large proportion of the
Grampian population and that a number of the proposals within the strategy will be
irreversible when implemented. The evidence base for transport impacts on health has
been recently reviewed5 but there still remained significant gaps in knowledge. Therefore
it was agreed there was a need to consider the local health impact of the transport
strategy in more depth through a rapid health impact assessment.
2.2 Scope of the Health Impact Assessment
Rapid Health Impact Appraisal is a systematic assessment of the health impact of a
policy, programme or project by a number of experts, decision-makers and
representatives of those potentially affected by the proposed policy. It is based on an
exchange of the existing knowledge of the participants involved, including knowledge
gained from previous similar exercises and research. The rapid HIA of the NESTRANS
strategy was delivered through a combination of desktop analysis and participatory
workshops (Appendix 2).
2.3 Steering Group
A steering group was set up including representation from NESTRANS, NHS Planning
and Public Health. This group undertook the role of overseeing the health impact
assessment process and specifically to advise / agree the scope and aims of the HIA,
the elements of the NESTRANS strategy to be focussed on in the HIA, the planning and
development of the participatory workshops and delivery of the final report.
2.4 Aims of this HIA
1. To identify the potential health impacts of elements of the NESTRANS Regional
Transport Strategy 2021.
2. To make recommendations as to how positive health impacts associated with the
strategy may be promoted and negative impacts be avoided or ameliorated.
3. To identify elements of the strategy that will require a more detailed health impact
assessment to be undertaken.
2.5 Sub-elements of the strategy to be covered by this HIA
In deciding which elements of the strategy were to be included in the rapid HIA the
steering group considered which elements were the greatest:
priority in the context of local, regional and/or national targets, goals and priorities
concern in terms of potential health impact based on an analysis of the available
evidence for the health impacts of transport and transport policy
in terms of local needs and circumstances
In considering the above the steering group also considered whether impacts would be
potentially severe or irreversible negative impacts effecting a large number of people
differentially experienced by those who are socially excluded or currently
experience poor health
positive impacts with potential for greater health gain.
The steering group considered the following elements to be a high priority for inclusion in
the rapid HIA:
1. Expansion and promotion of the use of public transport; e.g. IC1, IC5, IC3, IC7,
EC1, EC3
2. Transport infrastructure proposals; e.g. IC2
3. Changes promoting walking and cycling e.g. IC6
N.B. More detailed descriptions of these proposals are provided in Appendix 1.
The Steering Group agreed that whilst the general health impacts of the expansion of
Aberdeen airport and the Aberdeen western peripheral route would be included in the
assessment of the transport infrastructure proposals, there may be a need to undertake
further specific work relating to these two developments.
2.6 Review of the published evidence
At the time of undertaking this HIA work was being completed nationally, led by Health
Scotland, to publish a guide to health impact assessment for transport initiatives. This
guide includes an up-to-date systematic review of published evidence of transport,
access and health, transport and links to health and health determinants and health and
health related impacts of transport interventions. Therefore it was with the agreement of
the Steering Group that this review be used as the mainstay of the evidence in the
NESTRANS RTS HIA and that this should be supplemented by retrieval of HIA reports
from other areas or which demonstrated best practice in HIA methodology.
2.7 Population profile
Population profiles for Aberdeen city and Aberdeenshire were collated using routine
local data and key local strategy documents, particularly the local Joint Health
Improvement Plans.
2.8 Selection of the Transport Rapid HIA Stakeholder Group
The Stakeholder Group was selected to provide a range of expertise across health and
transport across the NESTRANS geography. Invitees were selected on the basis of their
individual expertise in either health, transport or both with the aim of putting together a
group whose combined experience and expertise could be used to assess the health
impacts of the NESTRANS RTS.
Stakeholder group membership is provided in Appendix 2.
2.9 Appraisal of health impacts
2.9.1 Stakeholder workshops
Two participatory stakeholder workshops were undertaken in late 2007, details provided
in Appendix 3. The first concentrated on the expansion and promotion of the use of
public transport; e.g. IC1, IC5, IC3, IC7, EC1, EC3 whilst the second covered
NESTRANS transport infrastructure proposals; e.g. IC2 and changes promoting walking
and cycling e.g. IC6.The aims of the workshops were to:
Identify the potential health impacts of selected elements of the NESTRANS RTS
2021.
Make recommendations as to how positive health impacts associated with the
strategy may be promoted and negative impacts be avoided or ameliorated.
2.9.2 Assessment and grading of health impacts
A HIA matrix was developed for the assessment of health impacts based on the results
of the literature review.
The matrix used was developed based on a combination of approaches used in the HIA
of Edinburgh Council’s urban transport strategy 6, the Integrated impact assessment
checklist developed by NHS Grampian 7 and the health outcomes and related health
determinants identified in the guide to ‘health Impact Assessment of Transport Initiatives’
published by health Scotland in 2007 5. Groups and impacts included in the assessment
are provided in Table 2.
Table 2: Groups and impacts assessed during the participatory
stakeholder workshops
Population sub-group Impact assessed
Young Families General
Affluent
Deprived
Adolescents Economic
Affluent
Deprived
Elderly Accidents
Affluent
Deprived
Working people Pollution / physical environment
Affluent
Deprived
Unemployed Physical activity
Deprived
Specific groups effected?1 Access to goods and services
Community and social networks
1
Any particular community groups effected by the assessed element of the strategy including:
Black and ethnic minority (inc. gypsy / travellers, refugees and asylum seekers); people with
disabilities, religious groups / faiths, lesbian, gay, bisexual and transgender; communities in
areas of disadvantage; people with mental health problems; homeless people; people involved
in the criminal justice system; rural groups.
Workshop participants used the matrix to quantify impacts for each population sub-
groups on a scale of -3, -2, -1, 0, +1, +2, +3 (negative through neutral to positive
impacts).In addition an assessment of Equality impact was undertaken based on the assessment criteria used in the equality domain of the Integrated impact assessment checklist developed by, and used in, NHS Grampian. This assessment included the impact on: relations between groups; discrimination; social and family support; inclusion and access to information.
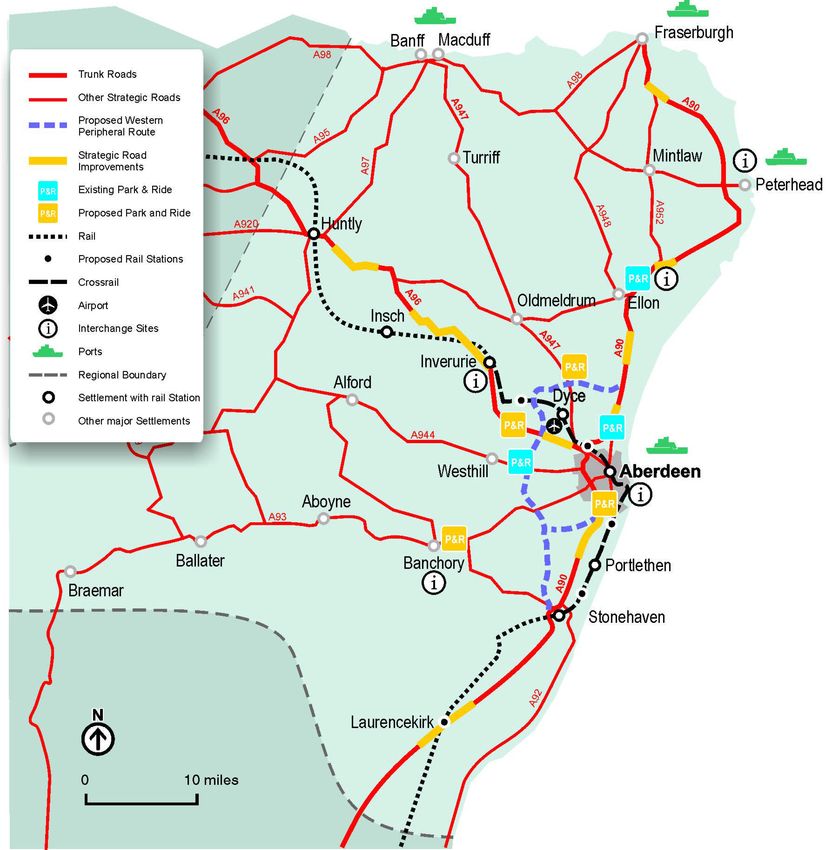
3: Profile of Aberdeen and Aberdeenshire

3.1 Geography
In the north east of Scotland Aberdeen city sits around the mouths of the rivers Don and
Dee covering an area of almost 73 square miles. Aberdeenshire extends around the city
of Aberdeen, representing 8% of Scotland's overall territory, making it the 4th
geographically largest of the 32 local authority areas. Aberdeenshire is predominantly
rural, with a mixture of rural villages and small towns.

The way land use and the economy have developed has led to housing and employment
locations in the area being dispersed. More than half of the region’s population (56%)
lives outside the City and employment density averaged across the north east is very
low. High income levels, rural living, employment sites away from transport nodes and
other factors combine to generate high levels of car ownership and car use. Scottish
Household Statistics show that 60% of Aberdeen residents and 71% of Aberdeenshire
residents drove to work in 2002/03.

3.2 Economy
The region makes a strong contribution to the Scottish economy with the wider
Grampian area (that is Aberdeen City, Aberdeenshire and the neighbouring area of
Moray) outperforming Scotland as a whole in terms of economic performance over a
number of years. In recent years, the region has ranked third in the UK with 2004 Gross
Value Added (GVA - a measure of economic performance) per head 25% above the
national average, reflecting the economic structure and the level of wealth generated by
the oil and gas sector.

3.3 Population
The General Register Office (GRO) for Scotland estimates for the mid-year populations
of Aberdeen City and Aberdeenshire for 2006 were 206880 and 236260 respectively.

Projections indicate an overall increase in the population between 2006 and 2031
although this will be made up by a fall in population in Aberdeen city of around 9% and
an increase in the Aberdeenshire population of 19% (Figure 2). As can be seen in
Figures 3 and 4 these changes are also significant because of the changing structure in
the population. In Aberdeen city there is a predicted marked fall in children and working
population (over 20% for each) and in Aberdeenshire whilst child and working population
numbers remain relatively stable population growth is driven by retirees. GRO estimates
indicate an expected 120% increase in the number of retired people living in
Aberdeenshire.
Figure 2: Estimated population projections for Aberdeen City and
Aberdeenshire 2006-2031;GRO

                         25

                         20
 Percentage change

                         15

                         10
                                                                                                                 Aberdeen
                           5                                                                                     Aberdeenshire

                           0
                             06 008 010 012 014 016 018 020 022 024 026 028 030
                           20
                          -5    2   2   2   2   2   2   2   2   2   2   2   2

                         -10

                         -15
                                                                                        Year

Figure 3: Percentage change in population of Aberdeen city by age
group and projection year
                 60

                 50

                 40

                 30
 % Change

                 20

                 10

                     0

              -10

              -20

              -30
                         2006 2007 2008 2009 2010 2011 2012 2013 2014 2015 2016 2017 2018 2019 2020 2021 2022 2023 2024 2025 2026 2027 2028 2029 2030 2031
                                                                                        Year

                                                                                 0-15   16-64   65+
Figure 4: Percentage change in population of Aberdeenshire by age
group and projection year
140
120
100
80
% Change
60
40
20
0
-20
2006 2007 2008 2009 2010 2011 2012 2013 2014 2015 2016 2017 2018 2019 2020 2021 2022 2023 2024 2025 2026 2027 2028 2029 2030 2031
Year
0-15 16-64 65+
In addition to the crude population growth and decline envisaged there are changes in
the household makeup within the area which is expected to fuel further growth in the
number of households.
3.4 Economy and Employment
Evidence on earnings shows that the region enjoys higher male average earnings than
for Scotland, and Great Britain as a whole. Scottish Executive Statistics show that
average earnings in the north east were 3% higher than GB in 2004, despite Scotland,
as a whole, being 10% below the GB average. This reflects earnings in the oil and gas
related sector, which despite accounting for only some 15% of employment is a
dominant player in the regional labour market. Unemployment rates within the region are
relatively very low. Aberdeen City has an average rate of 1.7% (2006), whereas
Aberdeenshire has a rate of just 1.1% (2006). These rates remain lower than both
Scottish statistics (3.0%) and UK (2.7%).
3.5 Deprivation
The picture of a generally wealthy area often hides the fact that there are pockets of
significant deprivation within Aberdeen city and Aberdeenshire which are ranked among
the 5% most deprived areas in Scotland, according to the Scottish Index of Multiple
Deprivation.
These include areas within the Woodside, Tillydrone, Middlefield, Cummings Park, Torry
and Seaton neighbourhoods in Aberdeen, which are the focus of regeneration master
plans whilst Northfield, Hanover, Hilton, Sunnybank, Mastrick and the city centre are
considered as being ‘at risk’. In Aberdeenshire, two areas covering Fraserburgh North
and Peterhead Central (Roanheads) fall within the 5% most deprived in Scotland, and afurther four areas fall within the worst 15% in Scotland. They cover Fraserburgh East
and Blackhouse, Buchanhaven and Clerkhill.
3.6 Transport Behaviour
3.6.1 Car ownership and use
Car ownership in the north east is higher than the national average of 66% of
households, and the rate of increase is slightly higher than the average for Scotland,
however a significant number of people do not have access to a car. Aberdeen’s level of
car ownership with 85,600 cars is 24% greater than the average of Scotland’s large
urban areas. In Aberdeenshire, car ownership of 123,100 cars is 21% greater than in
comparable rural areas (the average of accessible small towns, remote small towns and
accessible rural areas).
The 2001 Census showed that in Aberdeen over 30% of households (and in some
Aberdeenshire towns over 20% of households) do not have access to a car. Car use is
high in the north east; half of motorists in the north east of Scotland use their car every
day. Within the population aged 17 and over:
• 45% of residents in Aberdeen City use a car every day, compared to 34% in
urban Scotland as a whole.
• 55% of Aberdeenshire residents use a car every day, compared to 47% in rural
areas averaged across Scotland, although often this is a necessity which causes
economic hardship requiring other sacrifices.
These proportions have remained relatively stable between 1999/2000 and 2003/2004.
The proportion of journeys to work by car in the north east has risen steadily from 68% in
1999/2000 to 73% in 2003/2004, in contrast to the average for Scotland which remained
static at around 68%. Distances travelled to and from work or study are higher for those
people living in Aberdeenshire than in Aberdeen city 8.
3.6.2 Bus travel
While use of the car has grown, in contrast, numbers travelling to work by bus have
dropped relative to the national average. In 2003/04 among employed adults:
• 12% of city residents travelled to work by bus compared to 19% in urban areas.
• 4% of Aberdeenshire residents travelled to work by bus compared to 7% in rural
areas.
• 15% of city residents walked to work compared to 14% in urban areas.
• 11% of Aberdeenshire residents walked to work compared with 15% in rural
areas.
Overall, bus use is relatively low in the north east, although investment in improved
services and fleet has resulted in growth in recent years. In both the City and Shire, the
proportion of residents using buses more than twice a week was below the
corresponding urban and rural averages, and especially so in Aberdeenshire. Access to
services and service frequencies are factors that affect how often people use buses:• 72% of city residents live within 6 minutes walk of a bus stop and a service
frequency of 26 minutes or better, compared to 65% for large urban areas in
general.
• Only 9% of Aberdeenshire residents live within 6 minutes walk of a bus stop
and a service frequency of one bus every 26 minutes or better, compared with
16% in rural areas on average.
Survey findings on views on bus services show more positive views in the north east
than other areas with regard to running on time, frequency, meeting needs, personal
safety/security and information. However, residents of both Aberdeen and
Aberdeenshire were more negative than residents of Scotland’s urban and rural areas
with regard to interchange (integration) and value for money.
3.6.3 Cycling
Levels of cycling to work were similar in all areas at between 1% and 2%, despite cycle
ownership being relatively high. In 2003/04 just 3% of people in Aberdeen and 4% in
Aberdeenshire had cycled as a means of transport in the previous week; 3% in
Aberdeen and 6% in Aberdeenshire cycled for pleasure or to keep fit.
3.6.4 Rail travel
The rail network in the north east is very limited in extent and less than 1% use rail for
travel to work, although in towns with a good rail service this can rise to 4%, such as
Stonehaven. Scottish Household Survey data show that
• 91% of Aberdeen residents had not used a train in the month prior to the
survey, compared to 81% in large urban areas across Scotland.
• 93% of Aberdeenshire residents had not used a train in the month prior to the
survey, compared to 87% in rural areas on average.
There are three direct rail services to London per day via the East Coast, plus an
overnight sleeper service. There is one Cross-Country service per day, providing a direct
link to the north of England.
3.6.5 Air travel
The north east depends to a greater degree than many regions on the ability of people to
use air travel in and out of the region on business - not just the day and short stay
business visitor but also for people working offshore. Research indicates that access to a
range of frequent direct air services is important for inward investment and city
development. Aberdeen currently has services to many UK and European destinations
including direct services to 24 business destinations.4: NESTRANS Regional Transport Strategy
4.1 Background
It is not the purpose of this document to convey the full description of the NESTRANS
RTS. A brief summary is provided as context to the HIA. Further information is available
in the full RTS report (available at http://www.nestrans.org.uk/strategy/strategy.asp)
The Regional Transport Strategy (RTS) sets out the challenges facing Aberdeen City
and Aberdeenshire over the next fifteen years and how we will address them. It includes
a comprehensive appraisal of the problems and issues affecting transport in the north
east, sets clear objectives and proposes a detailed plan of action for improving transport
in the region between now and 2021.
The accessibility of Aberdeen City and Shire to the rest of Scotland, the UK and the
wider world is essential to achieving sustainable economic growth and a high quality of
life. Transport connects people to jobs, healthcare, education and other public services.
It also helps connect communities and enables people to access retail and leisure
facilities, meet with friends and family, promoting social inclusion across the region. The
RTS has a key role to play in shaping the future of Aberdeen City and Shire and
contributing to the achievement of wider economic and social goals for the region.
4.2 Key issues addressed by the strategy
In developing its strategy NESTRANS identified twelve key issues that required to be
addressed (Table 3).
Table 3: Key issues to be addressed by the NESTRANS RTS
Supporting sustainable Improving connectivity Developing a strong city
economic growth centre
Reducing emissions of Increasing public transport Supporting vibrant
greenhouse gases and usage Aberdeenshire towns
pollutants
Ensuring social inclusion Ensuring efficient Embracing new
movement of goods technologies
Improving safety and Maximising the benefits of Changing travel behaviour
security the Aberdeen Western
Peripheral Route (AWPR)Table 4: NESTRANS Regional Transport Strategy Objectives
Economy To enhance and exploit the north • To make the movement of goods
east’s competitive economic and people within the north east
advantages, and reduce the and to/from the area more efficient
impacts of peripherality. and reliable.
• To improve the range and quality
of transport to/ from the north east
to key business destinations.
• To improve connectivity within the
north east, particularly between
residential and employment
areas.
Accessibility, To enhance choice, accessibility • To enhance travel opportunities
safety and and safety of transport, and achieve sustained cost and
social particularly for disadvantaged and quality advantages for public
inclusion vulnerable members of society transport relative to the car.
and those living in areas where • To reduce the number and
transport options are limited. severity of traffic related accidents
and improve personal safety and
security for all users of transport.
• To achieve increased use of
active travel and improve air quality
as part of wider strategies to
improve the health of north east
residents.
Environment To conserve and enhance the • To reduce the proportion of
north east’s natural and built journeys made by
environment and heritage and cars and especially by single
reduce the effects of transport on occupant cars.
climate and air quality. • To reduce the environmental
impacts of transport, in line with
national targets
• To reduce growth in vehicle
kilometres travelled.
Spatial To support transport integration • To improve connectivity to and
planning and a strong, vibrant and within Aberdeen City and
dynamic city centre and town Aberdeenshire towns, especially by
centres across the north east. public transport, walking and
cycling.
• To encourage integration of
transport and spatial planning and
improve connections between
transport modes and services.
• To enhance public transport
opportunities and reduce barriers to
use across the north east,
especially rural areas.
Source: NESTRANS RTS 20211Figure 5 provides an overview of the main actions proposed in the regional Transport Strategy Figure 5: Overview of the main actions proposed in the Regional Transport Strategy
5: Evidence base for health impacts relating to
transport
This section summarises the evidence for impacts related to transport on those
determinants of health used in the assessment process.

5.1 Determinants of health
Health determination is complex and is perhaps best visualised in the model proposed
by Dahlgren and Whitehead. In this model interaction can take place both within the
layers and between them. For example an individuals cardiovascular risk could be linked
to their genetic predisposition; their sex; their age; their socioeconomic status, which will
impact on both their lifestyle behaviour and their responses to ill health and health
promoting messages; their job; local environment and services, including transport and
the legislative changes delivered through, for example, the ban on smoking in public
places.

Fig. 6: Dahlgren and Whitehead “Wheel of Health” model

Source: Dahlgren, G. & Whitehead, M. 1991. Policies and strategies to promote social
equity in health. Stockholm: Institute of Futures Studies 9.
5.2 Economic
Transport policy and systems directly affect mobility of goods and people. An efficient
transport system, and well equipped transport infrastructure, are key to a strong
economy.
The Standing Advisory Committee on Trunk Road Assessment (SACTRA) put forward a
number of important mechanisms by which transport can improve economic
performance10:
Reorganisation or rationalisation of production, distribution and land use.
Effects on labour market catchment areas and hence on labour costs.
Increases in output resulting from lower costs of production.
Stimulation of inward investment.
Unlocking inaccessible sites for development.
Triggering growth which in turn stimulates further growth.
A number of key points are brought out in the SACTRA report:
The lack of any consensus as to transport's role in economic development.
The importance of considering the extent of imperfect competition in the sectors
using transport.
The importance of distinguishing the re-distributive effects from net impacts.
The incidence of the "two-way road" effect where transport improvements sought
by a region may work against its best interests.
The need to demonstrate clearly the relationship between the wider economic
and environmental impacts of any proposal.
The links between transport and the economy are summarised schematically below:
Figure 7: Links between Transport and the Economy
Source: adapted from Ecoplan 2003 in ‘Analysis of the links between transport and
economic growth. Report of the working party on national environmental policy; Working
Group on transport 11Many reports and studies have demonstrated the clear link between material deprivation
and ill health. The concept of relative poverty and the effects of income inequality are
also widely accepted. A strong local economy has the potential to affect health gain
through improvements in economic status for members of the population. However, for
those groups potentially left behind such growth e.g. those who remain unemployed or
unemployable, income inequality may well increase.
5.3 Transport-related injury and death
The vast majority of transport related injury and deaths are caused by road traffic
accidents (RTAs) with rail and air travel having the lowest rates of fatality and serious
injury. Rates of RTA in Scotland are generally falling, despite increases in the volume of
road traffic5.
In the UK, approximately 60% of RTAs occur in built up areas, 30% outside built up
areas and around 4-5% on motorways. Table 5 illustrates the rates of RTA on different
road types in 2004.
Risk of RTA varies depending on the type of road, traffic mix, time, weather and speed
and mass of vehicles involved5.
Pedestrians and cyclists are at the highest risk of death or injury. Rates of cyclists killed
or injured on UK roads have been falling and Scotland has lower rates of cyclists killed
or injured than England. Evidence shows that in countries where cycling is common
rates of RTA involving cyclists are lower, possibly due to a critical mass effect 5.
Table 5 Rates of crashes (all vehicles), users and pedestrians killed /
seriously injured by road type (2004) per 100 million vehicle –
kilometres travelled.
Accident rates Users killed or Pedestrians killed /
seriously injured seriously injured
Motorways 9 1.2 0.0
Urban A roads 70 6.3 3.2
Urban B, C and 64 5.3 3.2
unclassified roads
Rural A roads 25 5.8 0.4
Rural B, C and 46 8.9 1.0
unclassified roads
Source: Department of Transport 2005. Road casualties Great Britain: 2004 Annual
Report National Statistics publication 12Table 6: Passengers killed or seriously injured (KSI) rates per billion
passenger-kilometres travelled (2003)
Mode of transport KSI rates
Rail (2002/3) 0.4* **
Air 0.01 **
Water 61** -
Road (Car) 27+
Road (Van) 10 +
Road (Bus / coach) 10
Road (Motorcycle) 1264 +
Road (Cycle) 534
Road (Pedestrian) 443
* Fatalities only
**1994-2003 average
-Passenger casualties on UK registered merchant vessels (includes public ferries and
ships
+Includes drivers and passengers KSI
Table 7: Summary of reported injury accidents and reported
casualties by police force area, council and severity; 2006
Area Accidents Casualties Child
casualties
Killed serious Slight Total Killed serious Slight Total All
severities
Grampian 56 165 880 1101 62 217 1180 1459 139
City 7 49 333 389 8 53 394 455 48
Shire 43 88 418 549 46 125 602 773 69
Source: Scottish Government, 2007 Road Accidents: Scotland 2006Table 8: Accidents by road type and severity in Scotland; 1996-2006
1996 1997 1998
1999 2000 2001 2002 2003 2004 2005 2006
Built up roads
Fatal 111 89 116 95 93 91 71 85 90 76 83
Serious 1,932 1,899 1,884 1,841 1,674 1,557 1,528 1,389 1,232 1,224 1,256
Fatal and
2,043 1,988 2,000 1,936 1,767 1,648 1,599 1,474 1,322 1,300 1,339
Serious
Slight 8,667 8,932 8,743 8,053 8,003 7,788 7,587 7,269 7,384 7,087 6,859
All
10,710 10,920 10,743 9,989 9,770 9,436 9,186 8,743 8,706 8,387 8,198
severities
Non-built up roads
Fatal 205 251 223 190 204 218 203 216 193 188 210
Serious 1,383 1,413 1,434 1,368 1,333 1,283 1,156 1,107 1,099 1,026 991
Fatal and
1,588 1,664 1,657 1,558 1,537 1,501 1,359 1,323 1,292 1,214 1,201
Serious
Slight 3,775 4,062 4,119 3,868 3,822 3,789 3,799 3,851 3,919 3,833 3,710
All
5,363 5,726 5,776 5,426 5,359 5,290 5,158 5,174 5,211 5,047 4,911
severities
All roads
Fatal 316 340 339 285 297 309 274 301 283 264 293
Serious 3,315 3,312 3,318 3,209 3,007 2,840 2,684 2,496 2,331 2,250 2,247
Fatal and
3,631 3,652 3,657 3,494 3,304 3,149 2,958 2,797 2,614 2,514 2,540
Serious
Slight 12,442 12,994 12,862 11,921 11,825 11,577 11,386 11,120 11,303 10,920 10,569
All
16,073 16,646 16,519 15,415 15,129 14,726 14,344 13,917 13,917 13,434 13,109
severities
Source: Scottish Transport Statistics No 26 – 2007 EditionTable 9: Vehicles involved in RTAs by type of vehicle
1996 1997 1998 1999 2000 2001 2002 2003 2004 2005 2006
Pedal
1,346 1,309 1,167 1,062 900 942 852 840 793 808 807
cycle
Motor
867 951 972 1,032 1,155 1,207 1,200 1,153 1,033 1,098 1,091
cycle 1
Car 20,343 21,785 21,328 19,622 19,284 18,611 18,193 17,724 17,717 16,765 16,391
Taxi 571 555 594 552 589 548 504 487 477 468 474
Minibus 2 140 145 145| 125 134 101 115 111 109 84 87
Bus/coach 1,095 1,098 1,181 1,040 1,109 1,086 1,059 1,069 1,131 1,039 980
Light
1,137 1,143 1,189 1,073 984 934 858 795 975 911 925
goods
Heavy
805 853 847 944 924 1,013 999 930 800 738 698
goods
Other 2 372 368 358| 384 474 434 374 348 365 558 509
Total 26,676 28,207 27,781 25,834 25,553 24,876 24,154 23,457 23,400 22,469 21,962
1. Includes all two wheeled motor vehicles.
2. The series is affected by a change in the way in which motor caravans are counted:
for years up to 1998 they are included under "minibus": from 1999 they are counted as
"other".
Source: Scottish Transport Statistics No 26 – 2007 Edition
Table 10: Casualties by mode of transport and age group, 2006
Numbers Rates per 1,000 population
Young Older Young Older
age not Children Adults Children Adults
Persons Adults Total Persons Adults Total
known 0-15 25-59 0-15 25-59
16-24 60+ 16-24 60+
Pedestrian 7 992 500 904 448 2,851 1.08 .83 .37 .40 .56
Pedal cycle 0 209 101 428 43 781 .23 .17 .17 .04 .15
Motorcycle 3 27 274 731 33 1,068 .03 .46 .30 .03 .21
Car 20 657 3,213 5,674 1,140 10,704 .71 5.34 2.29 1.02 2.09
Taxi 0 8 27 188 25 248 .01 .04 .08 .02 .05
Minibus 0 13 20 41 20 94 .01 .03 .02 .02 .02
Bus/Coach 1 102 49 287 324 763 .11 .08 .12 .29 .15
Light
1 7 63 299 23 393 .01 .10 .12 .02 .08
goods
Heavy
0 0 10 167 14 191 .00 .02 .07 .01 .04
goods
Other 1 0 6 28 119 21 174 .01 .05 .05 .02 .03
Total 32 2,021 4,285 8,838 2,091 17,267 2.19 7.12 3.57 1.87 3.37
Source: Scottish Transport Statistics No 26 – 2007 EditionYou can also read