Reducing Illness and Lives Lost from Heatwaves - Physical Environment Analysis Network (PEAN) 2019-21
←
→
Page content transcription
If your browser does not render page correctly, please read the page content below
Reducing Illness and Lives Lost from Heatwaves
Physical Environment Analysis Network (PEAN) 2019-21
Final Report - March 2021
Contact details
  Shannon Panchuk                                    Matt Beaty
  Bureau of Meteorology                              Bureau of Meteorology
  shannon.panchuk@bom.gov.au                         Department of Health
  Ph: 0438 143 459                                   matt.beaty@bom.gov.au
                                                     Ph: 0414 205 730

Project Working Group
  Bureau of Meteorology (BOM)               Blesson Varghese, John Nairn, Shannon Panchuk, Brenda
                                            Mackie

  Department of Health (DOH)                Matt Beaty

  Bureau of Statistics (ABS)                Cheng Chen, Neil Parker, Kim Van Korven

  Geoscience Australia (GA)                 Tina Yang, Shane Crossman, Matt Jakob

Project Steering Committee
  Bureau of Meteorology                     Shoni McGuire, Carla Mooney

  Department of Health                      Loc Thai

  Bureau of Statistics                      Deepa Wright

  Geoscience Australia                      Irina Bastrakova

  Department of Agriculture, Water          Katrina Phillips
  and the Environment (DAWE)

  Physical Environment Analysis             Peter Graham
  Network (PEAN)

Copyright
© 2021 Commonwealth of Australia

Suggested citation
Physical Environment Research Network. (2021). Reducing Illness and Lives Lost from Heatwaves:
Project Report. Canberra, Australia: Australian Government Data Integration Partnership for Australia.

Reducing Illness and Lives Lost from Heatwaves                                                           1
Acknowledgements
The RILLH project was funded by the Data Integrated Partnership for Australia (DIPA) and administered
through the Physical Environment Analysis Network (PEAN). The Department of Agriculture, Water and
Environment (DAWE) coordinated and facilitated the PEAN network.

Disclaimers
This report reflects the views of the authors and should not be construed to represent the agency views
or policies.

Reducing Illness and Lives Lost from Heatwaves                                                            2
Contents
Executive summary ................................................................................................................................. 5
Project background ................................................................................................................................. 8
1.1       Partner agencies........................................................................................................................... 8
1.2       Heatwaves and human health ....................................................................................................... 8
1.3       Linked social, health and environmental data................................................................................ 9
1.4       Project objectives .........................................................................................................................10
Methodology ...........................................................................................................................................11
   2.1       Data sources ............................................................................................................................11
   2.2       Heat-health modelling ..............................................................................................................12
   2.3       Heat vulnerability indices ..........................................................................................................14
   2.4       Spatial analysis ........................................................................................................................16
Results ...................................................................................................................................................17
   3.1       Heatwave chronology ...............................................................................................................17
   3.2       Mortality ...................................................................................................................................17
   3.3       Morbidity ..................................................................................................................................19
   3.3.1        General practice attendance .................................................................................................19
   3.3.2        Emergency department presentations ..................................................................................21
   3.4       Spatial analysis ........................................................................................................................22
   3.4.1        Heat vulnerability mapping ....................................................................................................22
   3.4.2        Health outcomes mapping ....................................................................................................24
   3.5       Vulnerability and health outcomes ............................................................................................24
   3.5.1        Global relationships ..............................................................................................................24
   3.5.2        Local relationships ................................................................................................................26
Discussion ..............................................................................................................................................27
   4.1       Australian heatwave characteristics and trends ........................................................................27
   4.2       Heatwaves and human health ..................................................................................................28
   4.3       Populations and places most at risk .........................................................................................29
   4.4       Linked social and environmental data analysis .........................................................................30
   4.5       Extending Heat Vulnerability Index with the Location Index ......................................................31
   4.6       Heatwave warnings and impact forecasting..............................................................................33
Conclusion .............................................................................................................................................34
References .............................................................................................................................................35
Appendix ................................................................................................................................................39

Reducing Illness and Lives Lost from Heatwaves                                                                                                             3
Abbreviations used in this report
ABS              Australian Bureau of Statistics
ASGS             Australian Statistical Geography Standard
AWAP             Australian Water Availability Project
BARRA            BOM Atmospheric high-resolution Regional Reanalysis for Australia
BOM              Bureau of Meteorology
CDC              Centers for Disease Control and Prevention
CI               Confidence intervals
COPD             Chronic Obstructive Pulmonary Disease
CSIRO            Commonwealth Scientific and Industrial Research Organisation
DEA              Digital Earth Australia
DOH              Department of Health
ED               Emergency Department
EHF              Excess Heat Factor
EMA              Emergency Management Australia
GA               Geoscience Australia
GCCSA            Greater Capital City Statistical Areas
GP               General Practitioners
HVI              Heat Vulnerability Index
IPCC             Intergovernmental Panel on Climate Change
LST              Land Surface Temperature
MADIP            Multi-Agency Data Integration Project
MBS              Medicare Benefits Schedule
MMM              Modified Monash Model
NEXIS            National Exposure Information System
NHS              National Health Survey
NHSD             National Health Services Directory
NPEDC            Non-admitted Patient Emergency Department Care Database
PBS              Pharmaceutical Benefits Scheme
PCA              Principal Component Analysis
PHIDU            Public Health Information Development Unit
RILLH            Reducing Illness and Lives Lost from Heatwaves
RR               Relative Risk
SA2              Statistical Areas 2
SVI              Social Vulnerability Index
UCL              Urban Centres and Localities Classification

Reducing Illness and Lives Lost from Heatwaves                                       4

Executive summary
        Background

        The Reducing Illness and Lives Lost from Heatwaves (RILLH) project is a multi-agency
        collaboration that assessed the utility of linked government data for understanding a significant,
        complex, and coupled social and environmental problem. Specifically, how do individual and
        neighbourhood characteristics influence health outcomes related to heatwaves?

        Heatwaves are an enduring feature of Australia’s climate and have significant social, health
        (physical and mental), and economic impacts on the Australian community. A primary motivation
        for the RILLH project was to address the complexity of heatwaves and their impacts with a
        nationally consistent approach using multiple mortality and morbidity measures assessed at
        different spatial scales.

        By identifying which Australians are most at risk from heatwaves and exploring what can be
        learnt from large datasets about the key vulnerabilities to affect Australians during heatwaves,
        this project has laid the groundwork for improving warnings, emergency response, and health
        services for heatwaves.

        The overall aims of this project were to:

            •    Use individual and neighbourhood level data to model the impact of heatwaves on human
                 health (mortality/morbidity) in Australia and identify populations and places most at risk.

            •    Demonstrate the utility of linked social and environmental data from multiple agencies for
                 understanding complex, coupled social and environmental problems.

            •    Engage with stakeholders to explore how project outputs and spatial analysis could inform
                 heatwave warning services, and preparedness and response efforts for those most
                 vulnerable to heatwave.

        The RILLH project was led by the Australian Bureau of Meteorology (BOM) in collaboration with
        the Commonwealth Department of Health (DOH), Australian Bureau of Statistics (ABS) and
        Geoscience Australia (GA). Given the nature and complexity of heatwave vulnerability and health
        impacts, the project could not have been accomplished without the expertise, datasets and
        analytical skills drawn from the partner agencies.

        Methods

        Our methodology and analytical approaches focus on understanding how health outcomes relate
        to heatwaves and are modified by individual and neighbourhood characteristics. Two main
        analyses were conducted:

Reducing Illness and Lives Lost from Heatwaves                                                                 5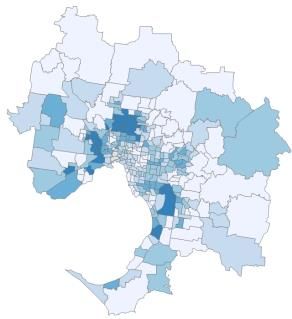
•    Modelling of the relative risk of all cause and specific causes of mortality or morbidity
                 (General Practice Attendances, and Ambulance callouts) during heatwaves of varying
                 severity. Base models looked at each health outcome risk as related to heatwave days as
                 defined by the BOM’s Excess Heat Factor (EHF) heatwave metric. [78] Subsequent
                 models were built that take into consideration individual (person level) and area
                 (neighbourhood) level factors.

            •    Spatial analysis of heat-health risk (e.g., mapping and hotspot analysis) was conducted
                 for the eight Greater Capital City Statistical Areas (GCCSA). This included analysis of
                 each health outcome separately and, in relation to heat vulnerability indices (Overall
                 vulnerability, Exposure, Sensitivity and Adaptive Capacity), derived from over 50 social,
                 health, and environmental indicators.

        These are large datasets with varying degrees of sensitivity and required the use of secure
        computing environments (Australian Bureau of Statistics DataLab and Department of Health
        servers).

        Key findings and recommendations

        The project demonstrates how existing data assets and emerging linked data can provide new
        opportunities for understanding complex social and environmental problems, particularly in the
        health domain. There are several key findings and recommendations from the RILLH project.

        Key findings

            •    Mortality and morbidity – Mortality and morbidity increase during heatwaves across
                 Australia with the magnitude of the increase varying by location.

            •    Individuals and communities – Individual and neighbourhood level factors are important
                 in driving patterns of risk of dying and getting sick during heatwaves. Individuals are more
                 susceptible if they have certain underlying health conditions, are from vulnerable groups
                 or live in heat exposed neighbourhoods.

            •    Spatial variation – There is considerable spatial variation in heat vulnerability and health
                 outcomes across Australia, especially within larger urban areas. Different factors drive
                 these patterns including the degree to which communities can respond and adapt to
                 heatwaves.

        Recommendations

            •    Cross-agency collaboration - Cross-agency collaboration is vital for the sharing of
                 expertise and diverse viewpoints to address complex problems. The RILLH project

Reducing Illness and Lives Lost from Heatwaves                                                               6
brought together expertise in the areas of extreme weather (forecasting and warnings),
                 environmental epidemiology, health geography, and the built environment.

            •    Evidence for planning and response - As heatwave impacts vary between populations
                 and locations, evidence concerning vulnerable people and places is critical for effective
                 policy, planning, and interventions, especially in a warming climate.

            •    Spatially targeted interventions - Opportunities for spatial targeted interventions should
                 be identified so warnings, targeted response plans, and other outreach methods can be
                 customised for specific places and segments of the population.

Reducing Illness and Lives Lost from Heatwaves                                                               7
Project background

1.1   Partner agencies

      The Reducing Illness and Lives Lost from Heatwaves (RILLH) project is a multi-agency
      collaboration between the Australian Bureau of Meteorology ('the Bureau'), Commonwealth
      Department of Health (DOH), Australian Bureau of Statistics (ABS), and Geoscience Australia
      (GA). The project was funded for the 2019-20 Financial year through the Data Integrated
      Partnership for Australia (DIPA) which is a three-year $130.8 million investment to maximise the
      use and value of the Government's data assets. The project is one of several reporting to DIPA
      through the Physical Environment Analysis Network (PEAN) which is a collaboration between
      Commonwealth agencies who are custodians of data related to natural resources, the
      environment, water, agriculture, farms, and biodiversity. The Department of Agriculture, Water and
      Environment (DAWE) coordinated and facilitated the PEAN network.

1.2   Heatwaves and human health

      Heatwaves have increased across much of the world as global average temperatures have
      increased.[1-5] Peak temperatures, frequency and duration of heatwave events have increased
      throughout Australia, consistent with historical and projected global trends in heatwave severity.[1,
      5-8]   Heatwaves vary in severity and duration and have significant social, health (physical and
      mental), and economic impacts on the Australian community (Table 1).[9,10] For example,
      heatwaves as extreme weather events have contributed to excess mortality in Australia more than
      all other natural hazards combined.[11] Much of the current understanding of heat-health risk
      relates to the role of heatwaves in mortality and morbidity at the city-scale [12-18] while limited
      evidence exists on the individual person level (e.g. physical and mental health, age) and local (e.g.
      neighbourhood) area factors (e.g. urban environment, dwelling type) that place populations most at
      risk.[19-21] A primary motivation for the RILLH project was to address this complexity with a
      nationally consistent approach using multiple mortality and morbidity measures assessed at
      different spatial scales.

      Heat-health impacts are largely preventable [3,4] and heatwave warning systems and interventions
      addressing the public health risks have been developed by most Australian jurisdictions.[12] As
      climate change intensifies, the need to better warn, prepare for, respond to, and mitigate the
      impacts of heatwaves becomes more pressing. However, currently there is not a consistent
      approach to addressing heatwaves risk and impacts across Australia.[12, 22] States and territories
      have different portfolio responsibilities for heatwave management and warnings and their own
      heatwave metrics, plans, warnings thresholds, terminology, and processes. Because of this there

Reducing Illness and Lives Lost from Heatwaves                                                                8
are different levels of maturity of heatwave services across the nation in terms of warnings and
      public health interventions.[22] In 2019-20, the National Heatwave Warning Framework working
      group (NHWF, co-chaired by the Department of Home Affairs and Emergency Management
      Australia) was established to develop a national framework for consistent heatwave information
      and warnings. The RILLH project contributes information that will assist NHWF and other
      stakeholders to develop future impact-based heatwave warnings. It will also support products and
      services developed in partnerships between the Bureau, health and emergency service agencies.

      Table 1- Heatwave severity as defined by Excess Heat Factor (EHF) and potential health impacts

         Severity class1           Potential health impacts

         Low intensity             Most people expected to have adequate capacity to cope with this level
                                   of heat.

         Severe                    Challenging for more vulnerable people, such as those over 65, pregnant
                                   women, babies, and young children, and those with a chronic illness.

         Extreme                   Will impact normally reliable infrastructure, such as power and transport
                                   and are a risk for anyone who does not take precautions to keep cool,
                                   even those who are healthy.

         1Heatwaves  are categorised by the Bureau of Meteorology as based on the excess heat factor (EHF) which
         provides a nationally consistent measure that includes local meteorological observations.
         Source: Bureau of Meteorology http://www.bom.gov.au/australia/heatwave/about.shtml

      For additional information about heatwaves and health impacts, readers are directed to the
      research and recent reviews in Table 2.

1.3   Linked social, health and environmental data

      An additional motivation for the RILLH project was assessing the utility of linked government data
      for understanding a significant, complex, and coupled social and environmental problem.
      Specifically: how do individual and neighbourhood characteristics influence health outcomes
      related to heatwaves? Details of the datasets and scales of data linkage are described in detail
      below, and include linked data from the ABS’s Multi-Agency Data Integration Project (MADIP) [62]
      asset (including mortality), Excess Heat Factor (EHF), and social and built environment attributes.
      These are all very large datasets which required the use of the secure computing environments at
      ABS DataLab [63] and DOH. Working with data across agencies will also contribute to the objective

Reducing Illness and Lives Lost from Heatwaves                                                                     9
of providing evidence to support the development of improved government services that will
prevent deaths from heatwaves (and other natural hazards) expected to increase as the climate
changes.
Table 2 - Selected literature on heatwaves and health
Topics References
Heatwave characteristics [1, 6, 7]
Comprehensive reviews [2, 23-25]
Mortality All-cause deaths [15-18, 26-39]
Morbidity Ambulance calls [32-34, 36, 38, 40-42]
Emergency department visits [13, 15, 28-36, 38, 40, 43, 44]
Hospitalisations [35, 45-47]
Occupational injuries and [48-53]
Heat-illness
Food-borne [54, 55]
Perinatal outcomes [56]
Vulnerability Area factors [57-59]
Vulnerability indices and [19-21]
mapping
Heat warning systems General [60, 61]
Evaluation [32]
1.4 Project objectives
The overall aims of this project were to:
• Use individual and neighbourhood level data to model the impact of heatwaves on
human health (mortality/morbidity) in Australia and identify populations and places
most at risk.
• Demonstrate the utility of linked social and environmental data from multiple agencies
to understand complex, coupled, social and environmental problems.
• Engage with stakeholders to explore how project outputs and spatial analysis could
inform impact warning services and preparedness and response efforts for those most
vulnerable to heatwave.
Reducing Illness and Lives Lost from Heatwaves 10Methodology
2.1 Data sources
An important aspect of this work is the use of datasets from a wide range of Commonwealth
agencies, and allied sources. These datasets fall into six main categories, summarised here (See
the Appendix for complete details):
• Heatwaves and climate - Excess Heat Factor (EHF), derived from Australian Water
Availability Project (AWAP) and the Australian Bureau of Meteorology's Atmospheric High-
Resolution Regional Reanalysis for Australia (BARRA), and Land Surface Temperature
(LST) from the Commonwealth Scientific and Industrial Research Organisation (CSIRO).
• Built environment – Vegetation/bare earth cover (GA)/ Digital Earth Australia (DEA));
Housing (National Exposure information System (NEXIS) and ABS).
• Neighbourhood and community – ABS Population Census and National Health Survey
(NHS); Chronic disease and risk factors (ABS NHS & Public Health Information
Development Unit (PHIDU).
• Service and amenity locations – Health facilities and services (National Health Services
Directory (NHSD).
• Individual level characteristics – Demographics (MADIP), Pre-existing conditions (MADIP
Pharmaceutical Benefits Schedule (PBS).[62]
• Individual level health outcomes – Mortality (MADIP)[62], ambulance callouts (South
Australia Health Department), ED presentations (National Non-admitted Patient Emergency
Department Care Database (NNAPEDCD), medical attendances (MADIP Medicare Benefit
Schedule (MBS)).
The time-period considered in this study is 2007-2018, but some of the health outcome datasets
did not cover the entire period, and this is noted below. An important step in developing datasets
for the analysis involved the linkage of social, health and environmental data. In some cases,
these data have not been analysed together previously. Two forms of linked data were used:
• Person-level linkage – The ABS and partners have developed the MADIP data asset[62]
that links existing government datasets at the person level. This includes demographic,
census, health (MBS, PBS, and deaths), social services, and tax office data.
• Area linkage – All datasets considered in this study were aggregated or downscaled to a
common geography/unit of analysis, the Australian Statistical Geography Standard
(ASGS) Statistical Area Level 2 (SA2). In many cases, data were already available at the
SA2 level while other data such as EHF were apportioned to SA2s from their native
resolution (5 km).
Reducing Illness and Lives Lost from Heatwaves 112.2 Heat-health modelling
Relationships between heatwaves and human health outcomes are shaped by factors including
the health status of individuals, their socioeconomic context and living conditions, and access to
essential services. The project examined three health outcomes datasets each representing an
increasing degree of severity for affected individuals – mortality (nationally), emergency
department presentations, and general practice (GP) attendances (nationally). A multilevel
approach was adopted as the conceptual framework for analysis, which involved analysis of the
data from a highly aggregated (National) level to a finer geographic (neighbourhoods within
cities) level. (see Figure 1).
Figure 1 - Analysis scales and datasets used for heat-health modelling
A time-stratified case-crossover design with conditional logistic regression was used to quantify
the effects of heatwaves on health outcomes (mortality and morbidity).[59] This commonly used
approach in environmental epidemiological studies is suitable to assess the impacts of health
outcomes arising from exposure to short-term events like heatwaves. The case-crossover models
by design consider the influence of temporal trends (short/long-term) and other individual-level
factors that do not change over a month, as each case acts as its own control. In other words, a
person is compared to themselves during heatwave and non-heatwave conditions. Most data
processing and statistical analysis were conducted using Stata 16 MP within the ABS’s secure
virtual-server DataLab environment [63] except for morbidity related to emergency department
presentations which were analysed on DOH’s secure server system.
For all analyses, the models estimate the relative risk (RR; Figure 2), for health outcomes during
heatwave periods compared to non-heatwave periods during the warm season (October to
Reducing Illness and Lives Lost from Heatwaves 12March). In simple terms, RR tells us "how much more, or less likely the outcome" is in the
exposed group (heatwaves) compared to the non-exposed group (non-heatwaves). RRs are unit-
less and range from 0 to infinity and is one of the 'safe measures' allowed to be released by the
ABS from DataLab.[63] A RR of one means there is no difference in the risk of an event in the
exposed and unexposed group, while a RR greater than one indicates an increased risk of an
event in the exposed group compared with the unexposed group. Confidence intervals (CI)
indicate the range in which the true estimate would fall 95% of the time (Figure 2).
For example, a RR of 1.60 from the mortality analysis means that the risk of death is 60% higher
during heatwaves compared with non-heatwaves. If the RR is less than 1, then the risk of an
event is less in the exposed group compared with the unexposed group. For example, a RR of
0.70 from the morbidity analysis means that the risk of renal outcomes was 30% lower during
heatwaves compared with non-heatwaves. For ease of comparison, we have expressed RR as a
percent change e.g., RR = 1.30 expressed as 30% increase.
Figure 2 - Interpretation of Relative Risk and percent change in risk statistics
Following the approach of previous studies,[57,59,64-67] the modification of heat-health
relationships by each of the neighbourhood level factors and individual-level factors was
assessed using single-interaction models by including an interaction term between heatwaves
and each potential modifier. Each of the neighbourhood-level indicators were categorised into
quartiles (0-25th, 25th-50th, 50th-75th and >75th percentiles) and RRs were estimated for each
of the four subgroups with the highest quartile considered as the most vulnerable during
heatwaves. For example, RR modelling incorporating EHF and Disability produced four models:
Quartile 1 (Least vulnerability) – Quartile 2 – Quartile 3 – Quartile 4 (Most vulnerable).
Individual-level factors were assessed using indicator variables for individuals with or without the
characteristic, where those with a certain characteristic were considered as more vulnerable than
Reducing Illness and Lives Lost from Heatwaves 13others during heatwaves. For example, individuals who live alone compared to those who do not
live alone.
Three general model forms were developed that included some combination of heatwave
(Excess Heat Factor), individual (person) and/or neighbourhood (SA2) level variables.
Model 1: Baseline models predicting RR in relation to EHF alone.
Model 2: Base model with the addition of individual level variables.
Model 3: Base model with the addition of neighbourhood level variables.
Models were developed for each health outcome where applicable.
2.3 Heat vulnerability indices
To complement the health risk modelling and identify spatial variation in heatwave vulnerability
and intervention options, a heat vulnerability index (HVI) was constructed, and neighbourhood
level datasets compiled for the heat-health modelling. This approach furthered the assessment of
spatial variability in heat-health risk but without some of the limitations related to the health data
alone (See Discussion).
Two vulnerability assessment and mapping approaches were adapted for this project. The first is
the Centres for Disease Control and Prevention’s (CDC) Social Vulnerability Index (SVI).[68] The
SVI is commonly used to map community vulnerability to natural and manmade health hazards,
and it includes an overall vulnerability index and several sub-themes including Socioeconomic
Status and Housing and Transportation. This approach was expanded by adding two additional
dimensions relevant for heat-health analysis, Exposure and Adaptive Capacity. This draws upon
the vulnerability framework developed by the UN Intergovernmental Panel on Climate Change[69]
and used in other studies of heat vulnerability.
The HVI uses the following components and definitions (Table 3):
• Exposure – Factors related to direct heat exposure including microclimate, building
performance, or outside work.
• Sensitivity – Factors that influence a community’s ability to prepare for, cope with and
recover from heatwaves. This component is similar to the CDC SVI approach.
• Adaptive Capacity – Factors that may help promote a community’s ability to prepare for,
cope with and recover from heatwaves. Adaptive Capacity refers to factors that reduce
the overall impact of Exposure and Sensitivity.
• Overall Vulnerability - the combined effects of Exposure and Sensitivity and Adaptive
Capacity
Reducing Illness and Lives Lost from Heatwaves 14The HVIs were constructed using the SVI approach developed by the CDC.[68] Over 50 different
indicators of vulnerability were used to determine the heatwave vulnerability for every city
neighbourhood (SA2). The construction of the HVI is based on ranking variables at the
neighbourhood (SA2) level for each indicator variable, theme, and index. An overall ranking and
a combined index were calculated as: HVI = (Exposure + Sensitivity) - Adaptive Capacity.
Themes and indices range from 0.0 to 1.0, representing low to high vulnerability. For example,
the Socioeconomic Status Theme in Table 3 is a composite of household income,
unemployment, and educational attainment. The Themes and Indices describe dimensions of
vulnerability that are difficult to describe with single variables. [68] Table 3 describes the indicator
variables and themes used construct the HVI indices.
Table 3 - Heat Vulnerability Index framework. Vulnerability Themes are derived from indicator
variables and aggregated to form Exposure, Sensitivity, Adaptive and Overall Vulnerability indices
HVI Indices Themes Indicators
Land surface temperature, No vegetation, Housing age (Pre-war,
Exposure Heat Exposure Post-war, Late 20th Century, Contemporary), High rise dwellings
(Four storeys or more), Outdoor workers
Low equivalised total household income, High unemployment,
Socioeconomic Status Education - Year 10 or less
Household Composition Aged 65 or older, Aged 0 - 4 years, Disability, Living alone
Heat Health Vulnerablity
Language and Culture English language profiency, New arrivals/refugees, Indigenous
Flats or apartments, Rental housing, Crowding, No Vehicle, Social
Housing Conditions
Sensitivity housing, No home internet
Arthritis, Asthma, Circulatory System, Chronic Obstructive Pulmonary
Health Status Disease, Diabetes, High Cholesterol, Hypertension,
Mental/Behavioural Problems, Musculoskeletal System, Respiratory
Health Risk Factors Alcohol Consumption, Overweight and Obesity, Smokers
Hospitals, General practitioners, Aged care, Aboriginal and Torres
Access to Health Services Strait Islander, Community services, Emergency departments,
Adaptive Hospitals, Mental health, Pharmacy, Psychiatry
Capacity Access to Cool Places Public open space, Cool places, Vegetation, Water bodies
Household stability - moved last year, Household stability - moved
Social Connectedness last 5 years, Volunteerism, Vehicle at home, Internet at home
An important step in the analysis involved the determination of how well the HVI captures
variation in heat-health outcomes.[70-72] In other words: are the HVIs robust indicators of heat-
Reducing Illness and Lives Lost from Heatwaves 15health vulnerability in general? This type of comparison of HVI with relative risk data is not
commonly done in Australia. The analysis was conducted in two parts:
• Global analysis – Following the approach outlined above, the HVI components (Exposure,
Sensitivity, Adaptive Capacity and Overall Vulnerability) and Themes as effect-modifiers
were included in the EHF relative risk models.[70] This allowed examination of
neighbourhoods characterised with greater Index and Theme-level vulnerability which
have greater mortality/morbidity.[71]
• Local analysis – Spatial analysis of the relationship between HVIs and Themes with
relative risk maps of mortality, emergency department presentations, ambulance callouts
and primary care attendances. This was undertaken through bivariate mapping and
hotspot analysis (See Section 2.4).
2.4 Spatial analysis
The analysis of spatial variation in heat-health outcomes and heat vulnerability was conducted in
two parts:
1. Mapping of each heat-health risk across each capital city, and
2. The use of spatial statistics to identify the degree to which heat-health outcomes are
clustered or uniformly distributed.
Mapping and spatial analysis was conducted for each Greater Capital City Statistical Area
(GCCSA) at the ASGS Statistical Area Level 2 (SA2). SA2's are designed to represent a
community that interacts together socially and economically.[73] In urban areas, SA2 areas
approximate neighbourhoods in cities and have a population range of 3,000 to 25,000 persons
(Figure 3).
Figure 3 - Neighbourhood boundaries based on ASGS Statistical Area Level 2 (SA2) geography
Reducing Illness and Lives Lost from Heatwaves 16Each heat-health relative risk was mapped along with the HVIs. The univariate mapping is largely
descriptive and does not provide a clear indication of statistically significant spatial patterns. To
account for this, Anselin’s Local Moran’s I was applied, also known as local indicators of spatial
association (LISA) analysis.[74] This technique identifies statistically significant spatial clusters of
features with similar attribute values (hot spots or cold spots). Areas where similar features were
not associated with their neighbours were also identified. The Moran’s I statistic compares
observed patterns to complete spatial randomness (CSR) for significance testing.
Next, the bivariate relationships between heat-health risk and the heat vulnerability indices were
examined. This analysis addressed the question: "Are health outcomes related to surrounding
neighbourhood vulnerability?" To accomplish this, the bivariate version of Anselin’s Local
Moran’s I analysis was used (or Bivariate LISA).[74] In this analysis, two dimensions with the
general form of heat-health risk compared to health vulnerability were specified. In the case of
bivariate LISA, of most interest were the two categories with high health risk (HH and HL), or in
other words, places where heat risk is the greatest. For each city, bivariate clusters for all health
risk variables and heat vulnerability index combinations were identified and mapped. Finally, for
each neighbourhood, cluster membership was counted separately for HH and HL clusters and
mapped e.g., two HH clusters in a given neighbourhood could mean co-occurring mortality
and ED presentation risk.
Results
3.1 Heatwave chronology
Heatwave days as defined by EHF (Table 1) were frequent over the period of analyses in this
study (2007-2017). Table 4 shows the number of non-heatwave and heatwaves days by EHF
class for each GCCSA. Overall, the ACT had the largest percentage of warm-season days
defined as heatwave days. Melbourne had similar numbers but also had the most days rated as
Extreme, the greatest number across all cities. The temporal characteristics of heatwaves over
the study period varied considerably in terms of duration and severity, so some caution needs to
be taken when comparing results across cities given this variation.
3.2 Mortality
During the 2007-2017 study period, there were 739,639 deaths nationally during the warm
season (October to March) which were included in the analysis. Cancers and diseases of the
circulatory system combined were the principal causes of deaths in 62% of cases. There were
increases in mortality in causes associated with heatwave deaths including external causes of
morbidity and mortality (injuries; 8%), diabetes (7%), Chronic Obstructive Pulmonary Disorder
(COPD; 7%) and heart attack (ischemic heart disease; 7%). The largest increase in all-cause
Reducing Illness and Lives Lost from Heatwaves 17mortality were observed among females (3%), children aged 5-19 years (6%) and working age
adults 20-64 years (4%).
Table 4 - Number of heatwave days by varying severity of EHF across Australian capital cities
(2007-2017).
City Non-heatwave Low intensity Severe Extreme
Adelaide 1832 138 32 3
Brisbane 1774 196 33 2
Canberra 1766 193 46 0
Darwin 1862 109 33 1
Hobart 1820 163 19 3
Melbourne 1796 182 20 7
Perth 1821 158 26 0
Sydney 1822 148 33 2
Nationally all-cause mortality increased by two percent during heatwaves. However, relative risk
and excess mortality varied geographically and by cause of death. Based on geographic
remoteness (Table 5), increased risk of mortality was highest for 'very remote Australia' (7.5%
increased risk), ‘outer regional’ (3.4%) and 'major cities' (2.3%). Regional areas Victoria,
Tasmania, Queensland, and New South Wales experienced the largest mortality risk (1-11%)
and excess deaths (108-245 deaths) during heatwaves.
Table 5 - Percent change in mortality risk during heatwaves by remoteness areas, Australia (2007-
2017)
Remoteness Areas Mortality risk (%)
Major Cities 2.3
Inner Regional 2.0
Outer Regional 3.4
Remote 1.9
Very Remote 7.5
In terms of relative risk and excess mortality, major cities experienced most pronounced effects.
Among capital cities, the greatest increase in heatwave related mortality risk and excess deaths
Reducing Illness and Lives Lost from Heatwaves 18was observed in Adelaide (8%; 328 deaths), Hobart (6%; 48 deaths), Melbourne (3%; 355
deaths), Sydney (3%; 341 deaths) and Perth (2%; 94 deaths).
The influence of a range of neighbourhood-level factors on the heatwave-mortality relationship
described above was evaluated next. Given the relatively small size of the mortality dataset, the
city (GCCSA) data was aggregated for analysis. Table 6 shows the neighbourhood
characteristics most associated with increased risk of dying during heatwaves. These include
high heat exposure, low socioeconomic status, poor housing and transport, vulnerable household
composition, and poor health status.
A similar analysis of the influence of individual level factors on the base heatwave-mortality
relationship was conducted. Using linked census and pre-existing conditions data with mortality, it
was found that mortality risk was higher during heatwaves among individuals who were culturally
and linguistically diverse, and had low socioeconomic status, vulnerable household composition,
poor housing and transport, and poor underlying health status (Table 6).
Table 6 - Influence of neighbourhood and individual-level factors on the heatwave-mortality
relationship
Index / Theme Neighbourhood-level Individual level
Heat exposure Low vegetation
No air conditioning (AC)
Socioeconomic status Low equivalised household Low equivalised household
income income
Household composition and Living alone Living alone
disability Over 64 years and living alone Disability
Language and culture Insufficient English language
proficiency
Housing and transportation Private rental No vehicle
No vehicle
Health status and risk factor Diabetes Diabetes
Hypertension Poor mental health
Asthma Severe mental illness
Poor mental health
Severe mental illness
Self-reported health as ‘poor’
Overweight
Obesity
Consistent risk factors Low equivalised household income; Living alone; No vehicle
across levels Diabetes and Mental health conditions
3.3 Morbidity
3.3.1 General practice attendance
General practice is often the first point of contact with the health care system for individuals
feeling unwell during heatwaves. Thus, changes in GP attendances during hot weather may be a
Reducing Illness and Lives Lost from Heatwaves 19leading indicator of other more severe illness leading to ambulance response, ED visits, and
hospital admissions. A total of 251,772,190 GP attendances occurred in Australia during the
warm-seasons (October - March) in the 5-year period 2011-2016. Based on classification of
remoteness, 70% of GP attendances were in 'major cities', followed by "inner regional Australia"
(19%). Nationally GP attendances only increased during severe/extreme heatwaves by four
percent (95%CI: 3-4%) with an estimated 130,915 excess GP attendances, while no increase
was found during low-intensity heatwaves.
Among capital cities, the highest impact of heatwave on GP attendances was found in Canberra
(16%) and Greater Adelaide (14%), while in regional areas the highest impact areas were Rest of
Vic (13%) and SA (10%). No significant increases were observed in Perth, and Rest-of NT, QLD,
and WA. Based on the remoteness classification (Table 7), the increases in GP attendances
during severe/extreme heatwaves were observed only in “Inner regional Australia” (4.6%), “Major
cities” (4.3%), and “Outer regional Australia” (2.4%).
Table 7 - Morbidity risk during severe/extreme heatwaves by remoteness areas, Australia (2011-
2016)
Remoteness Areas GP Attendance risk (%)
Major Cities 4.4
Inner Regional 4.6
Outer Regional 2.4
Remote nil
Very Remote nil
Analysis of neighbourhood level factors on heatwave and GP attendances nationally, revealed
higher impacts during severe/extreme heatwaves in areas characterised by high percentages of
populations with high heat exposure, low socioeconomic status, poor housing and transport,
vulnerable household composition, and poor health status (Table 8).
Based on individual level linked census and pre-existing conditions data, the analysis found that
GP attendances were higher during severe/extreme heatwaves among individuals in vulnerable
household composition, culturally and linguistically diverse, poor housing and transport, and poor
underlying health status (Table 8).
Reducing Illness and Lives Lost from Heatwaves 20It was found that for most cities, the risk of requiring a GP attendance during severe/extreme
heatwaves increased across the entire metropolitan area (See Section 3.4.2). However,
individual and neighbourhood-level factors increased utilisation of GP services during heatwaves
and were related to sensitivity factors such as Household Composition, Language and Culture,
Housing Conditions and Health Status.
Table 8 - Influence of neighbourhood individual-level factors on the heatwave-GP visits
relationship.
Index / Theme Neighbourhood-level Individual level
Heat exposure No AC
Socioeconomic status Low equivalised household income
Household composition Over 65 years Over 65 years
and disability Living alone Living alone
Over 65 years and living alone Disability
Disability
Language and culture Insufficient English language Insufficient English language
proficiency proficiency
Housing and transportation Public rental Flats or apartments
No vehicle
No internet
Health status and risk Diabetes Diabetes
factors Arthritis Hypertension
Respiratory diseases Congestive heart failure
Circulatory diseases Dementia
High cholesterol Psychological
Poor mental health
Severe mental illness Medications:
Anti-coagulants, Diuretics
Anti-psychotics, Statins
Consistent risk factors Over 65 years; Living alone; Disability; Insufficient English
across levels proficiency
Diabetes; Circulatory diseases and medications; Mental health
conditions
3.3.2 Emergency department presentations
Reporting results from the analysis of the national emergency department dataset requires
approval from each State and Territory health department before findings can be made public.
These approvals were underway at the time of this publication. An update to this report will be
Reducing Illness and Lives Lost from Heatwaves 21released mid-2021. It will describe the analysis undertaken, and how it contributions to
understanding heat-health impacts as measured through acute presentations to emergency
departments.
Over 23 million all-cause emergency department (ED) admissions were analysed in relation to
heatwave severity across the eight capital cities during the warm-seasons (October –
March) in the period 2013-2018. As with the mortality and general practice analysis, individual
and neighbourhood level variables were included to understand factors contributing overall heat-
health. Although the ED dataset has limited individual variables (sex, age), the data does
provide an opportunity to assess heat related presentations for specific conditions e.g., direct
effects of heat and light, mental health, and cardiovascular health (Table 9). As with the mortality
analysis, heat-health relationships were analysed for all the area level factors listed in Table 3.
This included the composite vulnerability measures as well.
Table 9 - Heatwave related emergency department presentations considered in this study
Condition group Specific conditions based on ICD-10-AM and SNOMED-CT
Direct effects Dehydration
Heat exhaustion and stroke
Electrolyte imbalance
Drugs and alcohol related
Foodborne illness
Diabetes Diabetes complications
Cardiovascular High blood pressure complications
Ischemic heart disease complications
Stroke
Renal Acute kidney failure
Kidney stones
Respiratory COPD
Asthma
Mental health Poor mental health
Severe mental illness
Dementia
3.4 Spatial analysis
3.4.1 Heat vulnerability mapping
Four heat vulnerability indices (Exposure, Sensitivity, Adaptive Capacity and Overall
Vulnerability) were developed based on the definitions and structure described in Table 3. As
with the health risk maps presented below, the vulnerability indices were mapped for the capital
Reducing Illness and Lives Lost from Heatwaves 22cities at the neighbourhood (SA2) scale. The maps for Melbourne are presented in this report and
a complete set of analysis is available in other publications and by request.
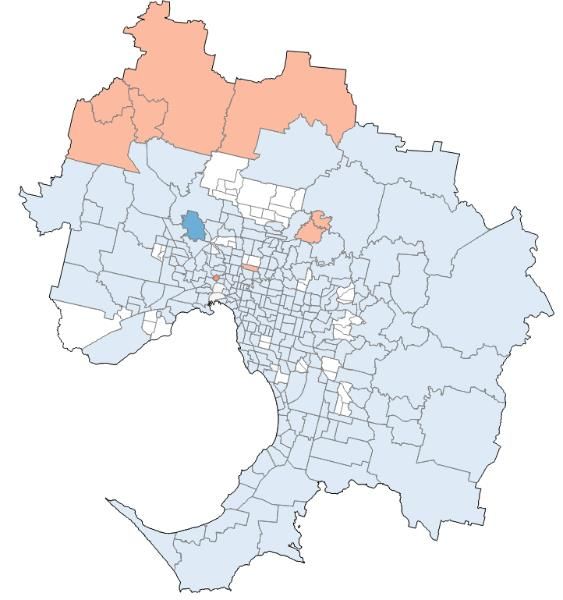
There is clear variation in heat vulnerability across Melbourne (Figure 4). The Overall
Vulnerability map is a composite of the other three measures and most closely resembles the
Sensitivity map. Exposure and Sensitivity maps have some similarities regarding highly
vulnerable suburbs in Melbourne’s west and southeast. The Sensitivity map shows some of the
most disadvantaged parts of the city as having a lower capacity to cope with extreme heat.
Exposure and Sensitivity taken together describe potential heat impacts. Adaptive Capacity
describes factors that may mitigate these impacts and is highest in the inner suburbs and CBD.
This is due largely to the availability of health services, cool refuges, and high social connectivity.
The Overall Vulnerability map combines these factors, and this is evident in places like inner
Melbourne which is not considered highly vulnerable due to the offset effect of Adaptive Capacity.
b) Exposure
a) Vulnerability
c) Sensitivity
d) Adaptive Capacity
Figure 4 – Heat vulnerability indices for Greater Melbourne
Reducing Illness and Lives Lost from Heatwaves 233.4.2 Health outcomes mapping
Analysis of the heatwave-health relationships at the neighbourhood scale allowed for the
production of high resolution national and capital city (GCCSA) maps (Figure 5). For brevity, this
report focuses on the results for Greater Melbourne. The overall patterns observed for Melbourne
are indicative of the types of insights from the analysis and can be generalised to other locations.
There was considerable spatial variation in mortality and morbidity across Melbourne. Note the
mortality models underpinning relative risk are based on all EHF heatwave classes. The following
sections present spatial analyses that incorporate other variables from the HVI to further explain
the heat-health risk geography.
There are some important features in the geography of different heat-health outcomes observed
for Melbourne. Changes in mortality risk varies from lower risk ( 50%) in several inner-city suburbs. However, within the city and inner suburbs a
distinguishing feature is the high degree of heterogeneity from neighbourhood to neighbourhood.
In other words, there are pockets of high mortality risk adjacent to areas with lower risk. Note that
given the limitations related to sample size and the mortality dataset, relative risk for any
heatwave day is reported for this measure.
There is evidence that health impacts increase with heatwaves severity. For example, Figures 5a
and 5b demonstrates that GP attendance increases dramatically from low severity to
extreme/severe heatwaves. The relative risk of requiring a GP attendance is high only in the far
north of Melbourne during low severity events, but risk increased by >20% across the entire city
area during extreme and severe events.
3.5 Vulnerability and health outcomes
3.5.1 Global relationships
The relationships between heat-health outcomes and components of the HVI were assessed in
two ways. First, a global analysis was conducted following the modelling approach described
earlier and using the HVI indices and themes as effect-modifiers in our EHF relative risk models.
Figure 7 shows the percent change in risk from the regression analysis, and how the risk of
adverse health outcomes (mortality and morbidity) changes with a unit increase in HVI Indices
and Themes. At the most aggregate level, overall Vulnerability raises the risk of dying (3.9%) and
GP attendance (2.2%). Overall Exposure has a similar influence (mortality 4.4% and GP
attendance 2.0%). Sensitivity raises the risk of dying (3.4%), and GP attendance (3.4%). Finally,
Adaptive Capacity also has a significant influence on health outcomes. Note that in contrast with
the other measures, higher Adaptive Capacity values mean less vulnerability. Higher Adaptive
Capacity reduces the risk of dying (1.8%) and GP attendance (4.0%).
Reducing Illness and Lives Lost from Heatwaves 24a) GP Attendance b) GP Attendance
Low severity heatwaves Severe/extreme heatwaves
c) Mortality d) Vulnerability
All heatwaves Greater Melbourne
Figure 5 - Change in risk of general practice attendance for low and severe/extreme heatwaves in
Melbourne
Reducing Illness and Lives Lost from Heatwaves 25Figure 7: Change in health outcome risk during heatwaves by heat vulnerability index
3.5.2 Local relationships
In addition to assessing the overall (or global) relationships between health outcomes and
vulnerability, a bivariate spatial analysis was conducted for each GCCSA using Local Indicators
of Spatial Association (LISA).[74] Specifically, the bivariate local Moran’s I statistic was used to
determine where health outcomes are significantly related to neighbourhood level vulnerability.
The degree to which heat-health outcomes overlap in neighbourhoods across Melbourne was
evaluated. However, in this case the role of neighbourhood characteristics based on the heat
vulnerably themes and indices was considered. For bivariate LISA, there were two categories;
places with High (health) risk AND High vulnerability (HH) and places with High (health) risk AND
Low vulnerability (HL), or in other words, places where heat risk is the greatest. For each city,
bivariate clusters were identified and mapped for all health risk variables and heat vulnerability
index combinations. Cluster membership for a given neighbourhood was counted separately for
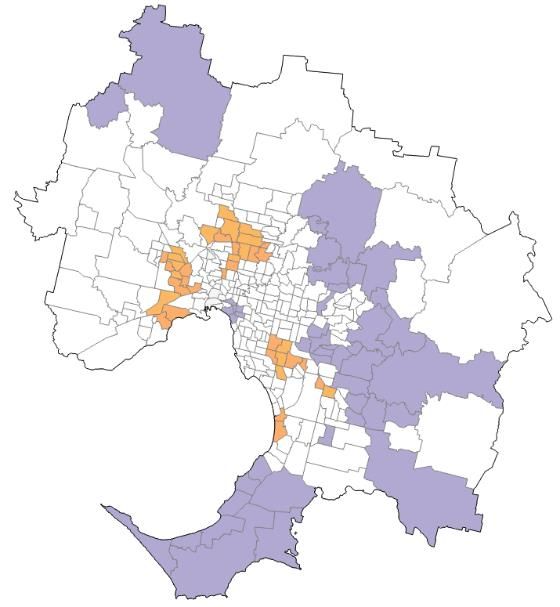
HH and HL clusters and mapped (Figure 8).
Reducing Illness and Lives Lost from Heatwaves 26Overall vulnerability Adaptive Capacity
Figure 8: Change in health outcome risk during heatwaves by heat vulnerability index
There were strong spatial associations found between health risk and the four HVIs (Figure 8).
High health risk was significantly associated with high vulnerability in inner suburbs in
Melbourne’s west and south. The outer suburbs to the west and north also had high heat-health
risk but overall vulnerability was low in these areas. This was a recurring pattern where heat
related mortality and morbidity was widespread but underlying vulnerabilities were different. The
spatial patterns are different depending on which index is being considered. For example, there is
a strong relationship between heat exposure and health risk in inner Melbourne, but this is offset
by the influence of Adaptive Capacity and thus these areas drop out of the overall vulnerability
map.
Discussion
4.1 Australian heatwave characteristics and trends
Heatwaves already present a significant social and environmental burden in nearly all parts of
Australia. The frequency, duration and severity of heatwave events is increasing (Table 10),
consistent with historical and projected global trends in heatwave severity.[5,8] For example,
heatwaves are occurring earlier in the warm season in most capital cities (e.g., 19 and 17 days
earlier than is normal for Sydney and Brisbane, respectively), and heatwave intensity has
increased as much as 2.5 degrees C for Adelaide.
Reducing Illness and Lives Lost from Heatwaves 27Table 10: The average number of heatwave days, number of events, length of the longest event,
average heatwave intensity, average intensity of the peak heatwave day, and change in the timing
of the first summer heatwave for Australia’s capital cities (after Perkins and Alexander 2013 in
Climate Council 2014).
Number of Number of Length of Change in Change in Change
heatwave days heatwaves longest event average average in
(events) heatwave intensity of timing
intensity the peak of first
City 1950- 1981- 1950- 1981- 1950- 1981-
(°C) day (°C) event
1980 2011 1980 2011 1980 2011
(days)
Adelaide 5 9 1-2 1-2 4 6 2.5 4.3 -2
Brisbane 10 10 2-3 2-3 6 6 1 1.5 -8
Canberra 6 13 1-2 2-3 5 7 0 1.5 -3
Darwin 3 7 1 1-2 4 5 0 1 -7
Hobart 4 5 1 1-2 4 4 -1.5 1.7 -12
Melbourne 5 6 1-2 1-2 4 4 1.5 2 -17
Perth 6 9 1-2 2-3 4 5 1.5 1.5 3
Sydney 6 9 1-2 2-3 4 5 1.5 1.5 -19
These trends are projected to continue with further increases (Table 11) in the number of hot
days out to 2030 and 2070 relative to the 2000-2009 reference period based on modelling by the
Bureau (2013) and the CSIRO (2007). While similar variability was captured in the study
regarding extreme events (Table 4), the use of EHF allowed for the identification of low severity
heatwaves. However, our 2007-2017 study period may not have captured the full range of
variability in all the areas studied. For example, heatwave conditions for Perth were not
necessarily representative of typical longer-term patterns in terms of the most severe events.
4.2 Heatwaves and human health
The severity and duration of heatwaves have significant social, health (physical and mental) and
economic impacts on the Australian community [11,16] however, these are largely preventable.
More work has been done on heat-related mortality than on heat-related morbidity, and this has
probably led to an underestimation of the disease burden caused by heatwaves. Australian and
international studies have identified the impacts of heatwaves on different populations including
the direct effects of heat (e.g., heat stroke, dehydration across a range of age groups) for those
with certain pre-existing health conditions (e.g., diabetes, heart disease). Other factors such as
living alone or having a disability also increase risk. [2, 75-77]
Reducing Illness and Lives Lost from Heatwaves 28Table 11 - The long-term annual average number of hot days (above 35°C) compared to the 2000 –
2009 average and the projected average number for 2030 and 2070 for some Australian capital
cities (Source: Webb and Hennessy 2015).
City Current 2030 RCP4.5 2070 RCP4.5 2070 RCP8.5
ADE 20 26 (24 to 29) 32 (29 to 38) 47 (38 to 57)
BNE 12 18 (15 to 22) 27 (21 to 42) 55 (37 to 80)
CBR 7.1 12 (9.4 to 14) 17 (13 to 23) 29 (22 to 39)
DWN 11 43 (25 to 74) 111 (54 to 211) 265 (180 to 322)
HOB 1.6 2.0 (1.9 to 2.1) 2.6 (2.0 to 3.1) 4.2 (3.2 to 6.3)
MEL 11 13 (12 to 15) 16 (15 to 20) 24 (19 to 32)
PER 28 36 (33 to 39) 43 (37 to 52) 63 (50 to 72)
SYD 3.1 4.3 (4.0 to 5.0) 6.0 (4.9 to 8.2) 11 (8.2 to 15)
Much of the current understanding of heat-health risk relates to the role of heatwaves at the city-
scale[14,15, 35], while limited evidence exists for identifying the individual person level (e.g.
physical and mental health, age) and local (area or neighbourhood) factors (e.g. urban
environment, dwelling type) that place populations most at risk. Heatwave studies are also often
limited in their spatial and temporal scope e.g., analysis of a single city during a particular
heatwave. In contrast, the RILLH project is one of the few studies that applies a nationally
consistent approach using multiple mortality and morbidity measures assessed at different spatial
scales.
4.3 Populations and places most at risk
The focus of this project was to evaluate the impact of heatwaves on mortality and morbidity
across Australia in order to identify the populations most at risk and where they live. We
incorporated individual (person) and neighbourhood level factors that includes demographic,
socioeconomic, housing and the built environment, and accessibility to medical facilities and cool
places. In some cases, these data have not previously been analysed together. Multiple health
measures were used including mortality, ambulance callouts, and attendances at GP.
The results of this study show that mortality/morbidity increases during heatwaves in Australia,
but the magnitude of the increase varies both amongst and within places. One of the main drivers
of this variation is the difference between individual characteristics and attributes of where they
live. For example, mortality risk is high for low-income people who also live in disadvantaged
neighbourhoods. Generally, individuals are more susceptible if they have certain underlying
health conditions, are from vulnerable groups or live in heat exposed neighbourhoods.
There is considerable spatial variation in heat vulnerability and health outcomes across Australia
and especially within larger urban areas. Different factors drive these patterns including the
degree to which communities can respond and adapt to heatwaves. In Melbourne there were
Reducing Illness and Lives Lost from Heatwaves 29You can also read