Auckland Transport Alignment Project - Supporting information - Ministry of Transport
←
→
Page content transcription
If your browser does not render page correctly, please read the page content below
BC5979
Auckland Transport
Alignment Project
Supporting information
Contents
Introduction ................................................................................................................ 4
   1.       Background ................................................................................................... 4
   2.       Methodology.................................................................................................. 7
        2.1.      Project objectives and KPIs .................................................................... 7
        2.2.      Analytical tools........................................................................................ 9
Phase 1 - Understanding the Challenge................................................................... 11
   3.       Increasing Demand for Travel ..................................................................... 11
        3.1.      Growth assumptions ............................................................................. 11
        3.2.      Projected travel demand growth ........................................................... 12
   4.       Regional and Sub-Regional Challenges ..................................................... 15
        4.1.      Region-wide performance of APTN ...................................................... 15
        4.2.      Sub-regional performance of APTN ...................................................... 17
   5.       Specific Focus Areas .................................................................................. 19
        5.1.      Auckland’s housing growth ................................................................... 19
        5.2.      Central area access .............................................................................. 21
        5.3.      Airport area access ............................................................................... 22
        5.4.      Growing motorway network demand .................................................... 23
        5.5.      Growing cross-harbour demand ........................................................... 25
        5.6.      Growing freight and services demand .................................................. 27
        5.7.      Rail passenger and freight growth ........................................................ 29
        5.8.      Arterial road network demands ............................................................. 30
        5.9.      New transport technologies .................................................................. 31
Phase 2 - Option Testing.......................................................................................... 33
   6.       Initial Testing (Round 1) .............................................................................. 33
        6.1.      Potential interventions .......................................................................... 33
        6.2.      Smarter pricing: initial analysis ............................................................. 34
        6.3.      Technology scenario testing ................................................................. 35
        6.4.      Eastern strategic corridor...................................................................... 38
   7.       Package Analysis (Round 2) ....................................................................... 40
        7.1.      Changing the mix of investment ........................................................... 40
        7.2.      Smarter transport pricing ...................................................................... 44

                                                                                                                             2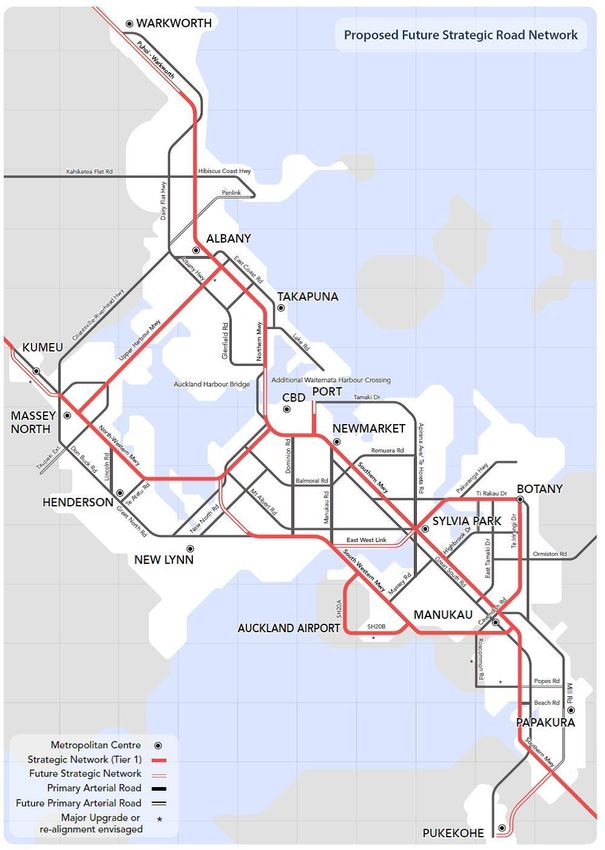
8. Package Refinement (Round 3) .................................................................. 48
8.1. Refined package development ............................................................. 48
8.2. Strategic road and public transport networks........................................ 50
8.3. Refined Package Analysis .................................................................... 54
8.4. Refined package conclusions ............................................................... 60
Phase 3 – Indicative Package .................................................................................. 61
9. Indicative Package Development ................................................................ 61
10. Prioritisation Framework ............................................................................. 63
10.1. Key assumptions .................................................................................. 63
10.2. Methodology ......................................................................................... 64
10.3. Priorities................................................................................................ 65
11. Final Indicative Package ............................................................................. 67
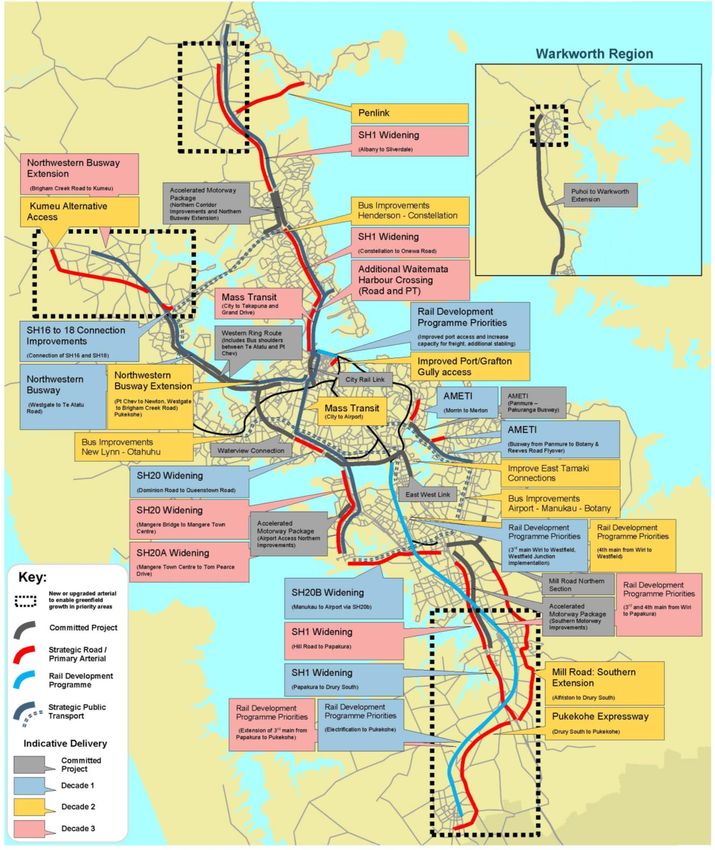
11.1. Overview of Indicative package ............................................................ 67
11.2. Timing of major investments ................................................................. 67
11.3. Cost estimates for Indicative Package .................................................. 71
12. Indicative Package Evaluation .................................................................... 72
12.1. Access to employment.......................................................................... 72
12.2. Congestion ........................................................................................... 76
12.3. Public transport mode share ................................................................. 79
12.4. Value for money ................................................................................... 79
12.5. Full evaluation results ........................................................................... 80
13. Risks and Uncertainties .............................................................................. 85
3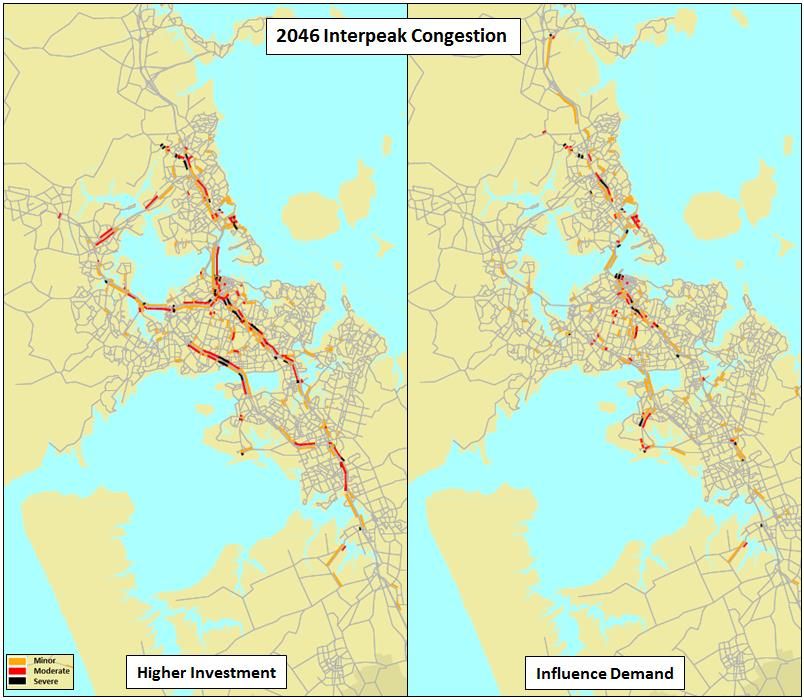
Introduction
1. Background
As joint transport funders with a shared interest in a successful Auckland, the Government
and Auckland Council have agreed on the need to improve alignment on a long-term
strategic approach to transport in Auckland.

The focus of the Auckland Transport Alignment Project (ATAP) is to test whether better
returns from transport investment can be achieved in the medium and long-term, particularly
in relation to the following objectives:

  i.    To support economic growth and increased productivity by ensuring access to
        employment/labour improves relative to current levels as Auckland's population
        grows
  ii.   To improve congestion results, relative to predicted levels, in particular travel time
        and reliability, in the peak period and to ensure congestion does not become
        widespread during working hours
 iii.   To improve public transport's mode share, relative to predicted results, where it
        will address congestion
 iv.    To ensure any increases in the financial costs of using the transport system deliver
        net benefits to users of the system.

This report supports the Auckland Transport Alignment Project: Recommended Strategic
Approach, together forming the completion of the Project. It builds on the work reported in
two previous documents: the Foundation Report (February 2016) and the Interim Report
(June 2016),

This report outlines the approach and methodology adopted for the project, and provides
details of the analysis that has been undertaken to support the conclusions in the
Recommended Strategic Approach. This work has also been informed by research reports
from a number of specialist workstreams. The relationship between the key ATAP
documents is illustrated below.

                                                                                              4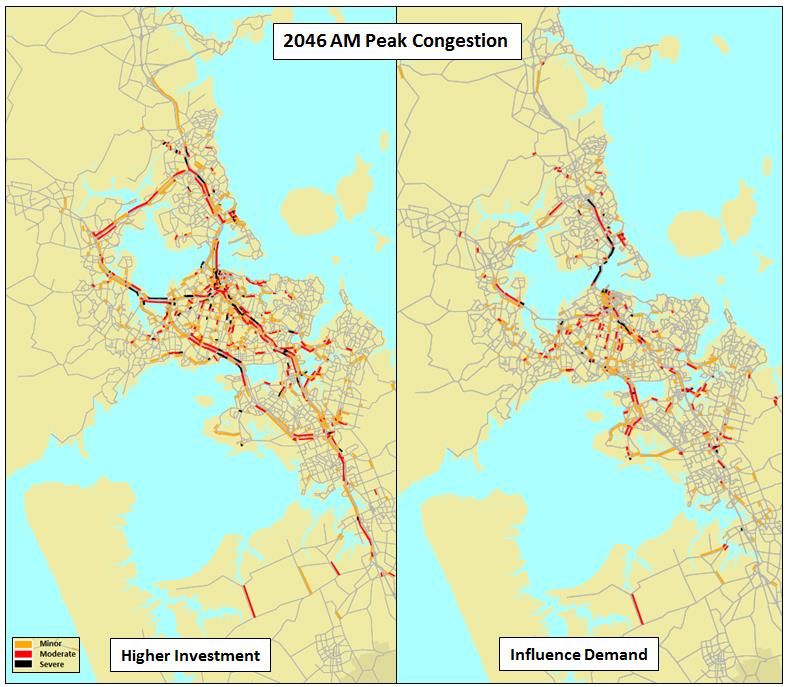
Key ATAP documents
ATAP Terms of Reference
Foundation Report
(February 2016) Workstream Reports and
Supporting Documents
Demand Management
Interim Findings Report Pricing
(June 2016) Arterial Roads
Revenue and
Expenditure
Supporting Information Maintenance,
(this report) Operations and
(August 2016) Renewals
Technology
Recommended Strategic
Freight
Approach
Evaluation
(August 2016) Eastern Strategic
Corridor Assessment
5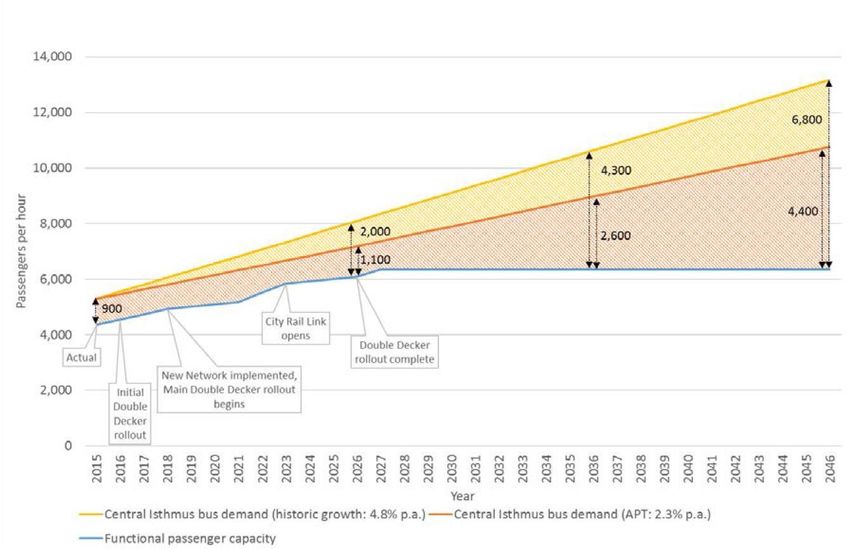
6
2. Methodology
The analysis to support the project has been undertaken in three main phases:
Understanding Indicative
Option Testing
the Challenge Package
This report outlines key findings from each phase, drawing on a range of workstreams and
technical analysis, including strategic transport modelling, cost and revenue estimates, input
from specialist project teams and engagement with key stakeholders.
2.1. Project objectives and KPIs
An evaluation framework was developed to test how the current 30-year transport plan1 and
different packages perform against the project objectives, an overall requirement to achieve
value for money, and other key outcomes.
For each project objective, measures and key performance indicators (KPIs) were developed
to enable evaluation. These are listed below.
Objective Measure Headline KPI
Improve access to Access to employment and Jobs accessible by car within a 30-minute
employment and labour within a reasonable trip in the AM peak
labour travel time Jobs accessible by public transport within
a 45-minute trip in AM peak
Proportion of jobs accessible to other jobs
by car within a 30-minute trip in the inter-
peak
Improve Impact on general traffic Per capita annual delay (compared to
congestion results congestion maximum throughput)
Proportion of travel time in severe
congestion in the AM peak and inter-peak
Impact on freight and goods Proportion of business and freight travel
(commercial traffic) time spent in severe congestion (in the
congestion AM peak and inter-peak
Travel time reliability Proportion of total travel subject to volume
to capacity ratio of greater than 0.9 during
AM peak, PM peak and inter-peak.
1
The Auckland Plan Transport Network (APTN) was assessed to represent ‘current plans’, as
required by the project Terms of Reference. The APTN was developed by Auckland Transport, the
NZ Transport Agency and Auckland Council to inform 2015 funding plans. The term APTN is used
throughout this report to refer to the current 30-year transport plan.
7
Objective Measure Headline KPI
Increase public Public transport mode share Proportion of vehicular trips in the AM
transport mode peak made by public transport
share Increase public transport Proportion of vehicular trips over 10km in
where it impacts on the AM peak made by public transport
congestion
Increase vehicle occupancy Average vehicle occupancy
Increased financial Net benefits to users from Increase in financial cost per trip
costs deliver net additional transport compared to savings in travel time and
user benefits expenditure vehicle operating cost
Ensure value for Value for money Package benefits and costs
money
In addition to the project objectives, a number of other key outcomes were included in the
evaluation framework, as outlined below.
Other Key Measure Headline Key Performance Indicator
Outcomes
Support access to Transport infrastructure Transport does not delay urbanisation in line
housing in place when required with timeframes of Future Urban Land
for new housing Supply Strategy.
Minimise harm Safety Deaths and serious injuries per capita and
per distance travelled
Emissions Greenhouse gas emissions
Maintain existing Effects of maintenance Asset condition levels of service
assets and renewals Renewals backlog
programme
Social inclusion and Impacts on Access to employment in high deprivation
equity geographical areas areas
Distribution of impacts (costs and benefits)
by area
Network resilience Network vulnerability Impact in the event of disruption on
and adaptability vulnerable parts of the network
Measuring accessibility
This project has focused on measuring ‘accessibility’" by reporting on the potential number of jobs that
can be reached within a certain travel time (30 minutes by car and 45 minutes by public transport,
which includes allowance for walk and wait times).
These measures enable comparisons between different options, and align with commonly reported
international measures. The use of 'number of jobs' is considered a reasonable proxy for accessing
other opportunities (e.g. shopping, education, healthcare, recreation) as these activities tend to cluster
in similar locations.
However, the use of travel time to measure accessibility does not reflect the financial cost of travel to
the individual, which can also impact on accessibility, especially for options where the user faces
additional costs, such as road pricing.
Future consideration of options may need to take this broader measure of accessibility into account.
This issue is also relevant to measurement of the objective that increased financial costs deliver net
user benefits.
8
2.2. Analytical tools
Two main strategic transport models were used for much of the project's technical analysis.
The Auckland Regional Transport Model (ART3) provides regional outputs on private
vehicle use and public transport trips. It also provides an indication of the likely changes
to vehicle volumes and speeds on each major road and public transport route in the city.
The Auckland Public Transport Model (APT3) provides more detailed information on
public transport use resulting from infrastructure and service changes.
Each strategic modelling tool has strengths and weaknesses. Both tools, particularly ART3,
are strongest at a 'high' regional level - rather than for providing detailed information at a
'street by street' level. Furthermore, utilising the APT3 model is necessary to simulate the
impacts of public transport capacity constraints, as the capacity of buses, trains and ferries is
not constrained in the ART3 model.
Limitations of the transport modelling tools are outlined in more detail in the ’Risks and
Uncertainties’ section at the end of this report and were taken into consideration throughout
the project. Strategic transport modelling was supplemented with other information to inform
decision-making.
The table below shows the transport modelling tests undertaken at different stages of the
project. In addition, various ’baselines’ were used in each phase to help gain an
understanding of the impact of the interventions tested.
Project Phase Stage Packages Tested Pricing tests Other tests
Understanding Auckland Plan
the Challenge Transport
Network (APTN)
Option Testing Initial Testing Individual project CBD cordon
(Round 1) testing Motorway
(particularly new charge
ideas) Peak/off-peak
network charge
Package ‘Capacity “Smarter Scenario tests:
Development Constraints’ pricing” effect of connected
(Round 2) package package tested vehicles, and
‘Employment a full network effect of higher
Centres’ charge varying vehicle occupancy
package by time, Test of new
‘Smarter Pricing’ location and strategic corridor
package route (eastern corridor)
Refined ‘Higher Different Scenario tests:
Packages Investment’ pricing levels effect of higher
(Round 3) package population growth
‘Influence rate
Demand’
package
Refinement & Final ‘Indicative
Prioritisation Indicative Package’
Package
9
Model results were produced for 2026, 2036 and 2046. The results for these years are
indicative of the conditions that are expected to prevail towards the end of each of the three
decades under review in this project (2018-28, 2028-38, and 2038-48).

Throughout the project we have used a base year of 2013 for our analysis, because the
transport models are calibrated against Census information and travel patterns from this
base year. It is important to note that since 2013 there has been a marked increase in travel
demand, resulting in slower travel speeds and higher congestion in Auckland. This recent
decline in performance needs to be taken into account when reviewing changes in
performance between 2013 and 2026.

                                                                                            10
Phase 1 - Understanding the Challenge
Understanding Indicative
the Challenge Option Testing Package
The first phase of the Project focused on understanding Auckland’s current and future
transport challenges in detail through assessing the Auckland Plan Transport Network
(APTN).
The Foundation Report released in February 2016 provides an overview of the key transport
challenges facing Auckland over the next 30 years. Analysis of the APTN against key
indicators showed mixed results. The following sections build on this work, and highlight the
key points and conclusions.
3. Increasing Demand for Travel
In the last three years Auckland has grown by approximately 120,000 people. This growth
has resulted in a marked increase in travel demand.
Total vehicle travel has increased by around 10%, from 12.2 billion km in 2012 to 13.4
billion in 2015. 2015’s increase equates to around 78 million additional car driver trips.
This increase in vehicular travel has ended a period of slow growth since the mid-2000s,
although vehicle travel per capita is still below 2007 levels.
Annual public transport boardings have increased by around 20%, from 69.1 million in
2013 to 82.9 million in the year to July 2016.
On the motorway network, this growth has contributed to average peak time travel speeds
declining by around 9% because of growing congestion. In some parts of Auckland, such as
the southern section of the Southern Motorway and parts of the Northwestern Motorway,
increases in congestion have been particularly significant. Bus services have also faced
significant overcrowding, especially on isthmus routes serving the city centre.
3.1. Growth assumptions
The scale, timing, nature and location of future travel demand will be largely be driven by
where and when population and employment growth occurs. We have used Statistics New
Zealand’s medium population growth scenario for the majority of our analysis, although a
high growth population scenario has also been used as a sensitivity test, as recent growth
has been tracking well ahead of the medium projection.
The spatial distribution of this growth into new households and jobs will be determined by
many thousands of individual decisions over time. However, our best estimate of where and
when growth may happen has been developed by Auckland Council’s in-house research
unit, based on population and employment growth assumptions. This projection is known as
11‘Scenario I9’. It reflects the Auckland Plan's development strategy and matches fairly well
with where growth has been enabled by the Auckland Unitary Plan adopted in August 2016.
The main difference relates to the timing of some greenfield development areas (particularly
in the north), which has been addressed throughout the project.
In Scenario I9, future population growth is expected to be accommodated throughout the
Auckland urban area and major future urban growth areas. Projected employment growth,
driven by an on-going shift to service-sector employment, is relatively concentrated in a few
locations, with over a third of employment growth projected to occur within 5km of the city
centre. The patterns of travel demand generated by this projected land-use place significant
pressure on the transport network through longer trip lengths, especially to the city centre
and other major centres.
Projected Increase in Population & Employment 2013-46 by Distance
from City Centre
Growth in Population or Employment
300,000
250,000
200,000
150,000
100,000
50,000
-
Less than 5km 5-10 km 10-15km 15-20km Greater than
20km
Population Growth Employment Growth
Source: Scenario I9 growth assumptions
3.2. Projected travel demand growth
Under the APTN, growth in travel demand is projected to occur across all travel purposes:
commuting to employment or education, shopping, business and freight trips and trips for
other purposes (visiting friends and relatives, undertaking errands, etc.). During the morning
peak, when the transport system is under the greatest pressure, the greatest projected
increase in travel demand is for trips to employment, followed by trips for other purposes.
By 2046 there are expected to be around 270,000 more morning peak vehicular trips (car
and public transport) than in 2013 under the APTN. This growth is projected to be split
broadly evenly between car and public transport across all trip types under current plans.
However, there are considerable differences in mode split by trip purpose. The majority of
growth in morning peak journeys to employment, education and shopping is projected to be
by public transport while most growth in business/freight and other trips purposes is
projected to be by car.
12APTN: Growth in Travel Demand 2013-46 (AM
Peak)
8
7
Millions of Kilometres
6
5
4
3
2
1
0
Vehicle Km PT Passenger Km
2013 2013-46 Growth
Source: APTN ART3 model outputs
Growth in travel demand contributes to substantial increases in the number of trips by
private and commercial vehicles and public transport over the next 30 years.
Vehicle travel during the morning peak is projected to grow by 2.3 million kilometres
from 2013 to 2046, a 46% increase
Morning peak public transport passenger kilometres are projected to grow by 1.3
million kilometres over the same time period, an increase of 190% on 2013 levels.
Heavy vehicle trip numbers in the morning peak are projected to grow by 65%, from
26,000 in 2013 to 43,000 by 2046.
Auckland’s geography creates particular challenges in serving trips between different parts
of the region, as there are only a limited number of connections able to be used (e.g. the
Auckland Harbour Bridge, crossings of the Tamaki River, etc.). Trips accessing the city
centre also face particular challenges, due to the limited number of access points and very
high, competing demands for limited street space.
The majority of trips are ‘internal’ to their sub-region – for example a trip from one part of the
North Shore to another. Private vehicles are projected to continue to serve the majority of
these trips into the future. However, as shown below, the role of public transport is much
more significant for trips into the central isthmus and into the city centre. Almost all growth in
these ‘inbound’ trips is projected to be through public transport under the APTN.
13APTN: 2013 AM Peak Trips APTN: 2013-46 Growth in AM
600,000 Peak Trips
200,000
500,000
400,000 150,000
300,000
100,000
200,000
50,000
100,000
0 0
Internal To City Between Into Internal To City Between Into
Centre North, Isthmus -50,000 Centre North, Isthmus
West and West and
South South
Car Public Transport Car Public Transport
Source: APTN ART3 model outputs
Commercial and freight travel is projected to increase by78% over the next 30 years, driven
by growth in Auckland’s economy.
Projected Auckland Freight Demand 2012-42
80
70.1
70
Million Tonnes Per Annum
60
50
38.3
40 34.4
30 21.8
20
10
0
2012 2042
Internal distribution Inter-regional
Source: Ministry of Transport freight demand study (2012)
International/inter-regional freight is generally larger scale (i.e. containers) than domestic
freight and can be carried by road, rail and coastal shipping. However, the vast majority of
commercial travel within Auckland is for internal distribution and service trips, with over 70%
of freight kilometres travelled within Auckland being light commercial vehicles such as
couriers and local deliveries2.
2
Ministry of Transport Fleet Profile 2012
144. Regional and Sub-Regional Challenges
As outlined in the project’s Foundation Report, a combination of Auckland’s constrained
natural geography, population growth and forecast land-use patterns makes providing an
effective and efficient transport network challenging into the future. Under the APTN, road
and public transport networks come under increasing pressure over time, leading to
increased congestion, more frequent overcrowding, and reduced reliability. Many of the
issues currently experienced during morning and evening peak periods are projected to
spread to other times of the day.
Overall transport network performance is best measured through the extent to which it
enables people to access opportunities. If Auckland is to benefit from future growth, then the
opportunities each resident can reach in a given travel time need to be increased or at least
held constant. This is challenging to achieve in a growing city.
The APTN was assessed against the evaluation framework outlined in the Foundation
Report. This helped inform where efforts should be focused to improve performance against
the project objectives and other important outcomes. A summary of this analysis, at regional
and sub-regional levels, is outlined in this section.
4.1. Region-wide performance of APTN
At a regional level, the APTN delivers mixed results: addressing some of the challenges
posed by Auckland's projected growth but struggling with others. Overall employment
access is projected to grow over time, but access to employment by car only increases after
2030 through delivery of a substantial motorway widening programme. Furthermore,
increasing congestion over the next 20 years means that access to employment by car does
not keep up with total projected employment growth. This results in the proportion of
Auckland jobs within a 30-minute peak time car commute declining until the mid-2030s.
Access to employment by public transport is projected to perform much better, with a
substantial increase in the number and proportion of jobs able to be reached within a 45-
minute trip.
15APTN: Number of Jobs Accessible APTN: % of Jobs Accessible
400 60
Number of Jobs (AM Peak - thousands)
% of Jobs Accessible (AM Peak)
350
50
300
40
250
200 30
150
20
100
10
50
0 0
2013 2020 2027 2034 2041 2013 2020 2027 2034 2041
Car 30 mins PT 45 mins Car 30 mins PT 45 mins
Source: APTN ART3 model outputs
As illustrated below, congestion is projected to increase and spread under the APTN, as
capacity is exceeded by growing demand. This crowding increasingly extends into the inter-
peak, affecting travel throughout the business day, with particular impacts on high value
commercial trips. Conditions are projected to improve in the longer term as investments
increase capacity, but not sufficiently to get back to 2013 levels.
APTN: Projected Severe Congestion 2013-46
35%
Proportion of Time in Severe Congestion
30%
25%
20%
15%
10%
5%
0%
Car AM Peak Public Transport AM Peak
Car Interpeak Freight Network Interpeak
Source: APTN ART3 model outputs
16Morning peak public transport services are projected to be less affected by road congestion
over time, as a greater proportion of trips are taken on dedicated rights of way. However, a
growing proportion of bus services would be severely overcrowded, particularly on
approaches to the city centre from the isthmus and North Shore.
Public transport mode share in the morning peak is projected to grow over time, more than
doubling from 7% in 2013 to 15% by 2046. For vehicular trips (i.e. excluding walking and
cycling) to employment at peak times, public transport mode share grows from 13% in 2013
to 29% by 2046.
Source: APTN ART3 model outputs
4.2. Sub-regional performance of APTN
Access to employment projections discussed in the previous sections vary significantly
across different parts of Auckland:
In central isthmus areas, current plans enable substantial growth in accessibility by both
car and public transport as job numbers in the central area increase.
In the north, accessibility gains are limited to public transport users until the 2030s when
substantial additional road capacity is provided.
In the west and south, access to employment from the west and the south by both car
and public transport is projected to decline, or grow more slowly than in other parts of the
city.
17Change in jobs accessible within Change in jobs accessible within
30 mins by car 45 mins by public transport
(APTN - AM Peak)
Change in Number of Jobs Accessible from 2013
(APTN - AM Peak)
Change in Number of Jobs Accessible from 2013
200 200
150 150
(thousands)
100 100
(thousands)
50 50
0 0
2013 2020 2027 2034 2041 2013 2020 2027 2034 2041
-50 -50
-100 -100
North West Central South North West Central South
Source: APTN ART3 model outputs
With over one million people projected to live in west and south Auckland by 2046, these
projections are cause for concern. Furthermore, west and south Auckland include many of
Auckland's substantial future growth areas and most deprived communities. A major focus
for subsequent phases of the project was exploring options for addressing projected access
challenges in the west and south.
185. Specific Focus Areas
Alongside the broad regional and sub-regional transport challenges Auckland is projected to
face over the next 30 years, there are a number of specific major challenges, focus areas
and opportunities that need to be addressed. These include:
Auckland’s housing growth
Central area access
Airport area access
Growing motorway network demand
Growing cross-harbour demand
Growing freight and service demand
Rail passenger and freight growth
Arterial road network demands
New transport technologies.
This section briefly discusses the nature of each of these focus areas, and how they are
expected to evolve over time.
5.1. Auckland’s housing growth
Auckland is expected to grow by around 700,000 people in the next 30 years. Transport has
a critical role to play in enabling and supporting this growth, particularly through providing
new infrastructure that opens up land for urbanisation. Within existing urban areas, transport
investment can also support growth by improving the commercial feasibility of
redevelopment and the market attractiveness of areas by increasing accessibility and
improving transport choices.
Over 12,000 hectares of ‘Future Urban’ land has been
identified in the Auckland Unitary Plan, providing
capacity for around 150,000 new houses and large
areas of new business land. Substantial and ongoing
investment will be required to realise this capacity,
including new arterial roads to make land ready for
development and larger upgrades to improve
connections with existing urban areas. Travel
demands generated by growth in these areas will also
place pressure on existing networks, especially major
road and public transport corridors that extend to the
north, west and south.
Early investment needs to focus on accelerating
housing development in areas ‘live-zoned’ by the
Unitary Plan, as well as Special Housing Areas. There
is also a need for substantial early investment in route
New future urban land
19
New “live zoned” urban areasprotection and land acquisition for future transport infrastructure, to minimise future costs
and protect corridors.
Supporting redevelopment of existing urban areas is also an important task, as around 65%
of Auckland’s future growth is expected to occur through redevelopment to higher densities.
Transport investment in these areas can help unlock growth by improving accessibility and
making redevelopment more market attractive. For example:
Public transport investments can enable ‘transit-oriented developments’ around key
stops and stations, encouraging higher intensity developments that make more efficient
use of available land.
Road investments can redirect through-traffic away from town centres, encouraging
more vibrant, successful centres.
Walking and cycling investments in centres and higher intensity areas can boost land
values and encourage higher development intensities.
A ‘heat map’ of where future redevelopment of residential areas is projected to be
concentrated under the Unitary Plan (based on current market feasibility) is shown below.
Development Potential in Existing
Residential Areas
Source: Unitary Plan Independent Hearings Panel Report:
http://www.aucklandcity.govt.nz/council/documents/unitaryplan/ihpoverviewofrecommendationsann1.pdf
20Supporting this growth, as well as ensuring that Auckland’s transport networks can continue
to operate effectively as growth occurs in these areas, is a fundamental requirement of
future transport investment.
5.2. Central area access
The central part of Auckland (city centre, its surrounds and Newmarket) is New Zealand’s
largest employment hub. The area is projected to grow strongly to reach nearly a quarter of
a million jobs by 2046. This jobs growth will be accompanied by a substantial projected
increase in tertiary student and visitor numbers and a continuation of the household growth
that has occurred over the past 20 years.
Accommodating such significant growth in trip-making to the central area will be challenging.
High competition for limited street-space between vehicles, pedestrians, cyclists and public
space in the city centre creates a need to move more people in progressively less space
over time. This will need to be achieved through a substantial modal shift towards public
transport, walking and cycling.
Over the next 30 years, around 60,000 more public transport trips (from 35,000 to 93,000)
into the central area during the morning peak will need to be provided for. Outside the peak,
private vehicle access to the central area is still expected to play an important role –
especially for deliveries and business trips – but most growth in trip making is still anticipated
to be via public transport.
Recent investment in the rail network, coupled with the City Rail Link and associated further
rail network improvements, will cater for a substantial proportion of future growth. Public
transport trips into the central area from the south, southeast, west and parts of the isthmus
will be increasingly made via rail, as bus networks are reconfigured to feed into the rail
network as a more integrated system. Ferry services also have an important role in city
centre access from some locations.
However, three key parts of Auckland (the North Shore, the northwest and the central and
southern isthmus) are not served by rail or buses that feed into the rail network. Trips from
these parts of Auckland into the central area will continue to rely on the bus network under
current plans. As bus demand grows, substantial ongoing additional services will need to be
provided. Over time, a variety of constraints, including use of corridor space, limited
turnaround facilities, frequent intersections and bus stop capacity limits, will create major
challenges in catering for growth in bus services to meet demand.
Efficiency improvements to the bus network will enable an increase in the effective capacity
of key bus corridors over the next decade. These improvements include:
Fully utilising the benefits of City Rail Link to turn more routes into rail-feeder buses
Moving to double-decker buses along major corridors into the city centre
New and upgraded bus interchange and terminus facilities in the downtown, Wynyard
Quarter and universities areas
Upgraded bus priority along Fanshawe and Wellesley streets
Re-routing of bus services away from key bottlenecks.
21The diagram below shows the relationship between bus capacity and demand on the
Symonds Street corridor which serves the southern and central isthmus. Capacity increases
enabled by the improvements outlined above are projected to be broadly matched by
modelled demand growth, meaning that current capacity constraints do not substantially
grow until after the middle of the next decade. However, ongoing projected demand growth
means bus efficiency improvements alone will increasingly struggle to deliver the capacity
that is required in the central isthmus.
Symonds Street Bus Capacity and Demand
Source: Central Access Plan, Project Team
Over time, similar issues will be faced on Fanshawe Street, which serves the North Shore.
Towards the end of the third decade, capacity challenges may also start to be faced along
Karangahape Road, the key access point for buses serving the northwest.
Without capacity improvements and use of alternative corridors, there is likely to be a
reduction in public transport mode share and potentially an increase in congestion faced by
those attempting to access the central area. Overall accessibility to the city centre would
also be reduced.
Long-term solutions to these capacity constraints potentially involve substantial investments
with major network-wide implications. A network-wide approach to their planning, timing and
funding is important to inform investment decisions.
5.3. Airport area access
The Airport area is nationally significant as New Zealand’s main international gateway,
Auckland’s air gateway to the rest of the country, a major and growing employment area and
a significant freight hub. Growth in travel demand to and from the Airport area is projected to
22place significant pressure on existing networks, which if left unaddressed will have significant
economic implications.
Auckland International Airport has the highest number of passengers per year in New
Zealand, with 17 million passenger movements currently (up from 14 million in 2013). The
Airport projects this growth to continue, to 40 million passenger movements by 20443.
Auckland Airport also handles about 15% of foreign trade by value and on this basis is New
Zealand’s third largest port behind the Auckland seaport and Port of Tauranga4.
The Airport area is also a growing employment area: both within the Airport’s landholdings
and in adjacent industrial and business park areas. Job numbers in the broader Airport area
are projected to grow substantially over the next 30 years to become one of the largest job
centres in Auckland. Combined with growing passenger and freight flows, this employment
growth is projected to drive an increase in forecast daily trips to and from the Airport area
from 63,000 currently to around 140,000 by 20445.
Providing for this growth in travel demand is challenging due to the Airport’s location in the
southwest corner of Auckland’s urban area, with access limited to two primary corridors. The
very specialised nature of the Airport also means that people come from all over Auckland to
work at the Airport business area and travel though the Airport. This is expected to lead to
an increase in congestion on Airport area access points from the north along the State
Highway 20A corridor, and east along the State Highway 20B corridor.
Improvements are currently being made to State Highway 20A that will improve access from
the north and extend the motorway to the Airport’s edge. State Highway 20B from the east,
which also provides access to the Airport from the south, has seen a rapid increase in
congestion in recent years and is where efforts need to be focused next.
Over time, space and capacity constraints within the Airport area mean that road capacity
and bus service improvements alone are unlikely to be sufficient to meet the area’s transport
requirements. A mass transit improvement will ultimately be necessary to support the area's
employment growth and take pressure off the road network.
5.4. Growing motorway network demand
Motorways cater for around one-third of total vehicle travel in Auckland. Much of the network
carries higher volumes of vehicles, including freight, than transport networks anywhere else
in New Zealand.
Ensuring the motorway network can function effectively is of critical importance to Auckland
and New Zealand’s economy, as well as to the daily lives of the many hundreds of
thousands of people who use it.
Ongoing growth across Auckland will place significant pressure on the motorway network.
Addressing these constraints will be challenging as most corridors previously protected for
3
Auckland Airport Master Plan http://www.aucklandairport.co.nz/downloads/aial-masterplan.pdf
4
King, M & Paling, R (2016) New Zealand International Air Freight, prepared for Ministry of Transport
5
Auckland Airport Master Plan, p29
23network expansion have now been utilised and in parts of the current network adding
capacity appears infeasible or prohibitively expensive.
Parts of the motorway network have different characteristics and constraints:
Inner parts of the network carry the highest traffic volumes but face physical constraints
to further widening, particularly along State Highway 1 between Takapuna and Mt
Wellington where the motorway pushes right up against high intensity development,
coastlines and other major infrastructure (such as railway lines). Within the inner
motorway network, limited capacity additions can provide some local benefits but appear
to shift rather than address congestion. Conversely, major widening is likely to involve
significant land acquisition, extremely high costs and potentially major amenity impacts.
Outer parts of the network are generally less physically constrained, making the
provision for additional capacity more feasible and cost-effective. Motorway
improvements north of Albany, west of Waterview, south of Manukau, along the Western
Ring Route and connections to the Airport and Port appears to generate more
substantial accessibility and congestion benefits than in inner areas. The outer motorway
network also has a key role to play in providing critical links to new greenfield housing
areas.
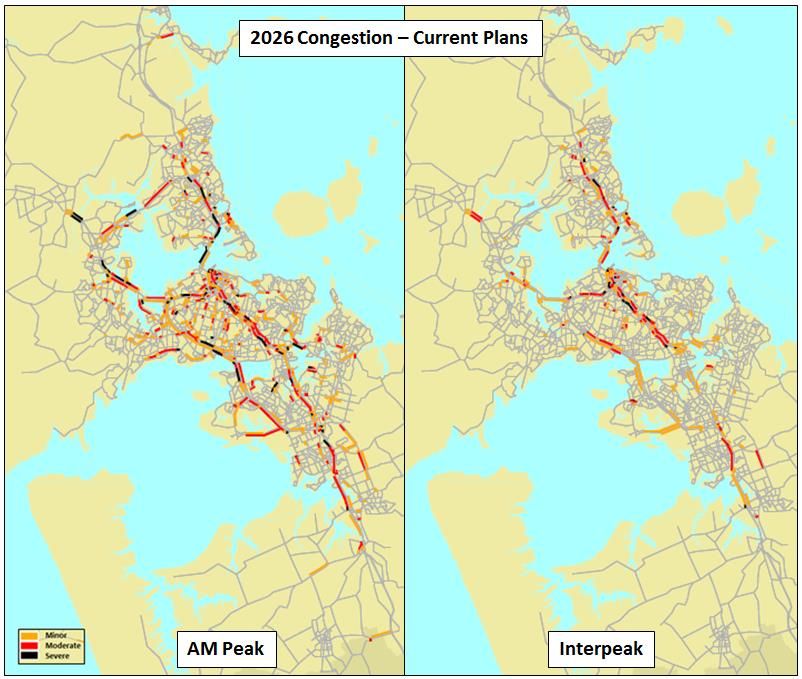
Under the APTN, a substantial proportion of future congestion is projected to occur on the
motorway network, particularly on its innermost core where providing additional capacity is
most challenging. This is illustrated by the congestion plots below.
24Source: APTN ART3 model outputs
5.5. Growing cross-harbour demand
The existing harbour bridge carries around 170,000 vehicles per day, including 7,500 heavy
vehicles. The bridge also carries around 4 million bus passengers annually. After a lull
between 2006 and 2014, the bridge is again experiencing increases in daily vehicular
transport demand, as illustrated below.
25Auckland Harbour Bridge - average daily traffic volumes
180 12
Number of heavy vehicles (thousands)
Total number of vehicles (thousands)
160
10
140
120 8
100
6
80
60 4
40
2
20
0 0
1995
1997
1988
1989
1990
1991
1992
1993
1994
1996
1998
1999
2000
2001
2002
2003
2004
2005
2006
2007
2008
2009
2010
2011
2012
2013
2014
2015
All Vehicles (LHS) Heavy Vehicles (RHS)
Source: NZTA
Increasing traffic flows across the harbour present two challenges:
Providing sufficient cross-harbour capacity to provide for the movement of people, goods
and services
Protecting the continued functionality of the Auckland Harbour Bridge’s structure,
ensuring a resilient transport network for Auckland.
Existing capacity constraints are mainly on approaches to the bridge in the peak direction
(especially from the north), although the variable lane operation frequently results in severe
counter-peak congestion. These delays also affect public transport services, as there is no
dedicated public transport corridor over the harbour. Over time, the bridge itself is projected
to become increasingly congested.
Although the bridge has been strengthened in the past decade, it has limited ability to cater
for ongoing growth in heavy vehicle traffic. Consequently, some level of heavy vehicle
management will be needed in the future. Initial work indicates that the economic impacts of
this heavy vehicle management on its own are likely to be relatively minor compared to the
construction cost of a new crossing.
Due to environmental and resource consent issues, previous work has indicated that any
new crossing of the Waitemata Harbour would be tunnelled and therefore involve significant
costs.
Overall the timing of harbour crossing improvements would appear to be driven by a
combination of factors, including:
Cross-harbour public transport and road capacity in this corridor to provide sufficient
accessibility to/from the North Shore
Improving the overall network resilience of the transport system
The need to limit and manage heavy traffic on the existing bridge.
265.6. Growing freight and services demand
Auckland’s freight and service task is forecast to grow faster than commuter and education
related travel as the economy grows. The city’s road and rail networks are of critical
importance to business traffic, including light and heavy freight. Congestion on the road
network and increasingly frequent passenger rail services are projected to affect the
distribution of goods and services throughout the business day.
The two most severe projected future freight and service challenges are:
Network delays and travel time variability: increasing congestion during the business day
is forcing freight operators to increase the size of their fleets or reduce the frequency of
services and needing to allow for worst case delivery/travel times.
Access to key freight hubs: constraints in these locations affect large freight volumes.
Locations of particular concern include road and rail access to the Port of Auckland
access to Airport area, and connectivity between East Tamaki and logistics centres to
the west.
The Port of Auckland is the country’s largest import container port by volume and value.
Approximately $26.4 billion of trade passes through Ports of Auckland each year, roughly
31% of New Zealand’s total trade. Over 900,000 containers are moved to and from the port
every year, along with bulk imports and exports. Auckland Council’s recently completed
Future Port Study has concluded that the port will need to be in use at its current location for
the time horizon of this project.
The Metro Port terminal in Penrose, operated by the Port of Tauranga, is also an important
international gateway for exports and imports. Around 170,000 containers annually move to
and from the terminal by road within Auckland, with rail moving freight to Metro Port to and
from the Port of Tauranga. Currently trains carrying up to 100 containers run five to six times
a day to and from this part of Auckland.
Auckland Airport is also a key freight hub, as New Zealand's third largest port by value.
The ‘Regional Freight Network‘ is shown in the map below, alongside the location of freight
generating areas and international gateways.
27Under the APTN, congestion on the key freight routes is projected to grow and spread south
over time. Conditions improve for traffic on the motorway network after 2036 due to capacity
improvements, but do not return to 2013 levels. Inter-peak congestion projections follow a
similar trend, but generally increase faster than at peaks, suggesting 'peak spreading' will
occur over time.
28APTN: Projected Freight Network Congestion
25%
Proportion of Travel Time in Severe Congestion
20%
15%
10%
5%
0%
AM Peak Interpeak
Source: APTN ART3 model outputs
There is limited and incomplete available detailed information on the movement of freight in
Auckland at a 'street by street' level. This makes specific recommendations challenging, but
at a high level to address Auckland's freight challenge, we consider the following outcomes
are important:
Limiting the growth in congestion on the freight network, particularly during inter-peak
periods
Improving the efficiency of connections to major freight hubs, especially the ports and the
Airport
Ensuring that the rail network is able to provide for growing passenger and freight
volumes (discussed further below).
5.7. Rail passenger and freight growth
Auckland's rail network has two key functions:
It forms a core part of the public transport network, providing high capacity services to
parts of the isthmus, the west, and the south. Annual passenger trips are forecast to
increase from around 17 million trips currently to over 60 million in the next 30 years.
Rail freight connects Auckland to other cities and ports, providing an alternative to road
freight. Port shuttles to rail hubs also help take pressure off road networks within
Auckland. Growth in freight services is projected to continue over the next 30 years.
Key current rail freight movements are shown in the map below. These highlight the
pressure being placed on the rail network between Wiri and Southdown, where different
freight services need to be provided alongside regular passenger services on the Southern
and Eastern Lines.
29Key Rail Freight Movements
Catering for growing demand in both passenger and freight services will require ongoing
improvements in infrastructure. Without this, the rail network will be unable to reliably meet
freight and passenger demand, which will ultimately limit the extent to which it can perform
either of its key functions.
5.8. Arterial road network demands
Auckland's arterial road network is distinct from the motorway network and local/collector
streets. This network has a number of crucial and contradictory functions:
Many roads carry high traffic and freight volumes, often higher than major state highways
outside Auckland. For these roads, through-movement is of primary importance.
A number of high demand bus corridors utilise arterial roads, particularly on the isthmus
A large number of Aucklanders live on or very near arterial roads, and they are the focus
of substantial future population growth
Arterial roads pass through a number of metropolitan, town and local centres, forming a
key part of the city's public space
Increasingly arterial roads are being utilised for cycle infrastructure improvements.
Prioritising this wide variety of competing uses is challenging, especially where movement
and place functions come into conflict, requiring unavoidable but challenging trade-offs.
As Auckland grows, these trade-offs will become increasingly challenging. With most growth
occurring in existing urban areas and limited potential for major new corridors, our current
transport network – including arterial roads – will need to move greater volumes of people,
30goods and services. Poor performance of this network will lengthen journey times, reduce
accessibility and ultimately undermine the extent to which Aucklanders benefits from this
future growth.
Conversely, population and employment growth in centres and along transport corridors – as
enabled by the Unitary Plan – will increase the number of people living, working and visiting
locations along arterial roads. High traffic volumes could adversely affect amenity values,
safety for those walking or cycling, the economic success of centres and overall quality of life
along these routes.
A number of existing documents provide guidance for the management, operation and
development of arterial roads. However, stronger direction is necessary to ensure that trade-
offs consider network-wide impacts and that key movement routes are managed in a way
that improves their throughput and efficiency.
5.9. New transport technologies
Emerging transport technology is developing rapidly. Intelligent Transport Systems (ITS) as
well as emerging vehicle and communication technologies have the potential to radically
alter the way that transport is delivered in the future, with significant impacts on demand and
supply. Such changes have the potential to improve network productivity, as well as deliver
significant improvements in congestion, safety and environmental outcomes.
The three main components of current and emerging transport technology, and their
potential benefits, are outlined in the table below.
Intelligent Network Shared Mobility Emerging Vehicle
Management Technology
Components Real-time Ride-sharing, car- Connected vehicles
understanding of sharing, bike-sharing, enable
network use motorbike-sharing communication
Dynamically manage through supporting between vehicles and
travel demand applications infrastructure
Automated vehicles
enable self-driving
features, ranging from
partial to full
automation
Potential Greater network Higher vehicle Connected and/or
benefits productivity occupancy rates autonomous vehicles
More accurate leading to greater can increase lane
targeting of network productivity throughput, reduce
maintenance and Increasing public accidents and
renewals and better transport catchment improve reliability
planning of new areas through better Accessibility
infrastructure first leg/last leg improvements for
Reduced cost of those unable to drive
transportation through Reduced chauffeuring
lower vehicle trips
ownership rates
31Our work on transport technology was informed by a workstream that provided research
about the potential timing and effects of developing technologies. Key findings in each area
are:
Intelligent network management: Further investment in this area could lead to material
accessibility and congestion improvements by enabling more comprehensive real time
information and analytics, better traffic management tools (such as smarter traffic
signals) and preparation for the roll-out and management of new vehicle technologies
through vehicle-to-infrastructure communication. Additional investment is likely to deliver
good value for money, by enabling more efficient use of existing infrastructure.
Shared mobility: New technology (e.g. instant matching of trip demands) enables many
previous barriers to ride-sharing or carpooling to be overcome. Increasing vehicle
occupancy rates could provide significant congestion relief and environmental benefits
by lowering total vehicle travel. Most advances in this area are likely to be private sector
led, but will require public sector co-ordination to bring together providers, developers,
customers, trials, data, research, public transport planning and funding.
Developing vehicle technologies: Connected vehicles enable communication between
vehicles, roadside infrastructure or the ‘cloud’. There is a growing industry and academic
consensus that fully autonomously-driven vehicles will eventually replace the
conventional vehicle fleet. Key players such as Google, Tesla, Ford and Volvo also
consider that privately-owned vehicles are likely to be replaced by industry-owned
vehicles and in the future mobility will be provided as a service. These firms are
developing new business models and investing billions of dollars aimed at achieving this
change. Uptake of new vehicle technologies is expected to grow slowly at first, but
accelerate throughout the next 30 years. This could enable significant productivity gains,
especially on the motorway network.
Overall, we expect developing transport technologies will have profound impacts on
Auckland’s transport requirements over the next 30 years, particularly through enabling
much more efficient use of existing transport infrastructure. It is likely that these new
technologies will work together, potentially in unforeseen ways, to provide new options that
will help Auckland achieve its transport objectives.
However, the timing and more detailed effects of new transport technologies are highly
uncertain and the tools for assessing these impacts in detail are still under development. In
particular, the effect of developing technology on travel demand patterns is highly uncertain
(e.g. it could result in additional trips for current non-drivers such as the very old and very
young which could be positive for access but not congestion). This uncertainty led us to
progress a ‘what if’ approach in our technical analysis and to focus on the potential effects of
higher vehicle occupancies and the uptake of connected vehicles.
32Phase 2 - Option Testing
Understanding Indicative
Option Testing
the Challenge Package
In this phase of the project, we progressively refined intervention packages in three main
stages of analysis.
Initial Testing (Round 1) examined a wide range of interventions to compare
performance against the project objectives.
Package Analysis (Round 2) took the best performing interventions and tested the
effect of changing the mix of investment and the potential of new technology and smarter
transport pricing.
Package Refinement (Round 3) compared increasing investment with a pricing focused
approach.
6. Initial Testing (Round 1)
2. Package 3. Package
1. Initial Testing
Analysis Refinement
Initial analysis cast a wide net to look at different approaches to current plans to see whether
it was possible to achieve better performance against the project objectives. A number of
possible new interventions were identified that could be applied either in addition to, or in
place of, interventions in the current plans.
6.1. Potential interventions
Potential new interventions to address key issues identified in the Foundation Report are
outlined below.
Key Deficiencies to Address Potential New Interventions
Worsening congestion and region-wide car Targeted further motorway widening
accessibility until the mid-2030s Eastern strategic roading corridor
Motorway and network pricing schemes
Slowing of region-wide improvement in public Isthmus mass transit
transport access after 2026 North Shore rapid transit
Busway expansion/extension schemes
Substantial decline in car accessibility for the Various motorway and local road widening
west and south between 2013 and 2036 projects
Karaka-Weymouth connection
33You can also read