BRINGING ZERO CARBON GAS TO AOTEAROA - Hydrogen Feasibility Study - Summary Report - First Gas
←
→
Page content transcription
If your browser does not render page correctly, please read the page content below

BRINGING
ZERO CARBON
GAS TO
AOTEAROA
Hydrogen Feasibility Study – Summary Report

I OREA TE
                                T UATA R A
                                K A P U TA
                                K I WA H O
                                                    – Ta Hirini Moko Mead

                                                          Translation:

                                          The Tuatara comes out before it is too late.
                                      A problem is solved by continuing to find solutions.

2   HYDROGEN FEASIBILITY STUDY – SUMMARY REPORT                                              Foreword
FOREWORD
           Every day Firstgas Group supplies the energy needs
           of 430,000 New Zealanders. Our pipelines generate
           jobs and value for New Zealand by supporting the
           meat, dairy, steel, petrochemicals and pulp and
           paper sectors. We are committed to ensuring we
           play our role in providing energy to New Zealanders
           in a zero carbon world and see hydrogen as an
           exciting prospect to unlock low-carbon solutions
           for future industry, transport and heating needs.

                    FIRSTGAS GROUP IS BRINGING
                 ZERO CARBON GASES TO AOTEAROA...                    We’d like to thank all of those involved to date.
                                                                     We will call on you again as this is just the start.

           As a member of the Climate Leader’s Coalition,            We have also been fortunate enough to have the
           Firstgas Group has committed to reducing our scope        support of the Government which contributed
           1 and 2 emissions by 30% by 2030. We are doing            50% of the funding required for this study,
           this by making improvements to our compressor             through the Provincial Development Unit.
           fleet, which is our largest source of emissions by far.   This backing from the Government has been
           This includes investigating the use of zero carbon        invaluable in supporting the study and helping
           gases like hydrogen as a fuel for gas compression.        us connect with government stakeholders.

           For over two years, Firstgas has had a dedicated
           workstream investigating low carbon gases, such                     OUR GOAL: 30% REDUCTION IN
           as hydrogen, biogas, and bioLPG. Developing
           these technologies will help us provide low                            EMISSIONS BY 2030...
           emissions options for our customers in the future,
           while retaining the benefits of gas provided via          I’m excited to be presenting this report to you
           existing pipeline networks in New Zealand.                as I see this work as crucial in setting Firstgas
                                                                     Group up for the future. The Firstgas Group
           This study is the first step in a programme of            team is a bright bunch of individuals with a huge
           work we will be undertaking to prove that our             amount of passion for supplying New Zealand
           pipelines can be converted to hydrogen and to             with energy. The opportunities to decarbonise
           make that conversion happen. This study helps             our gas networks are simply too big to ignore
           us get clarity over what we need to do to ensure          We’re up for the challenge presented in this
           that our networks can transport hydrogen as               report and we want to have you alongside us.
           demand ramps up over the coming years and
           informs our next steps in this programme.

           Our customers and stakeholders need to be
           part of New Zealand’s journey towards zero
           carbon gases. We’re pleased to say that they
           have had a lot of input into this study. They have
                                                                     NGĀ MIHI NUI
           helped us scope the scenarios for conversion,
           providing their valuable time and expertise.              PAUL GOODEVE

FOREWORD                                                                                HYDROGEN FEASIBILITY STUDY – SUMMARY REPORT   3
CONTENTS

4   HYDROGEN FEASIBILITY STUDY – SUMMARY REPORT   Contents

FOREWORD                                                                                            3

           1     EXECUTIVE SUMMARY                                                                             6

           2     INTRODUCTION                                                                                18

                 2.1 About our consultants                                                                   19
                 2.2 Focus of this work                                                                      19
                 2.3 Study process                                                                           19
                 2.4 Report structure                                                                        20

           3     FUTURE HYDROGEN DEMAND                                                                      21

                 3.1 Energy demand in 2050                                                                   23
                 3.2 Growth in Hydrogen demand prior to 2050                                                 25
                 3.3 High-level economic assessment of Hydrogen demand                                       26
                 3.4 Energy sector carbon emissions in 2050                                                  27

           4     PROJECTIONS AND IMPLICATIONS OF HYDROGEN SUPPLY                                             28

                 4.1 Hydrogen supply sources                                                                 29
                 4.2 Electricity system impacts of Hydrogen supply                                           32
                 4.3 Water consumption from Hydrogen supply                                                  35

           5     TECHNICAL FEASIBILITY AND REGULATORY ASSESSMENT                                             36

            5.1 Consumer equipment assessment                                                                37
            5.2 Network capacity and materials assessment                                                    37
            5.3 Conversion strategy                                                                          40
           		5.3.1 Blended network prior to 2035                                                             40
           		5.3.2 Conversion to 100% hydrogen network                                                       41
            5.4 Regulatory assessment                                                                        41

           6     NEXT STEPS FOR NEW ZEALAND’S HYDROGEN GAS NETWORK                                           44

                 6.1 Confirming network characteristics                                                      45
                 6.2 Building experience with Hydrogen                                                       46
                 6.3 Building the Hydrogen value chain                                                       47
                 6.4 Later phase activities                                                                  48

           UNIT CONVERSIONS                                                                                  50

           GLOSSARY                                                                                          51

CONTENTS                                                                  HYDROGEN FEASIBILITY STUDY – SUMMARY REPORT   5
01                                        EXECUTIVE
                                              SUMMARY
    Firstgas Group supports
    the decarbonisation of
    New Zealand’s energy
    sector. As a member of
    the Climate Leader’s
    Coalition, we are
    committed to leading the
    decarbonisation of New
    Zealand’s gas networks
    with low emissions
    technology and to
    provide our customers
    with zero carbon gas.

6   HYDROGEN FEASIBILITY STUDY – SUMMARY REPORT       Executive summary
We see transitioning to lower emitting gases as an                 This study builds on technical and economic
            essential step in New Zealand’s decarbonisation.                   modelling work carried out overseas and considers
            That’s why we have a dedicated programme of                        this work in the New Zealand context. Figure 1
            work to investigate zero carbon gas options, such                  below summarises the hydrogen pipeline feasibility
            as hydrogen, biogas, and bioLPG. We believe that                   study process and intended future sequencing of
            New Zealand’s energy future will be a combination                  hydrogen trials and blending within the gas network.
            of renewable electricity and zero carbon gases
            that can meet all of our varied energy needs;                      We’ve investigated what New Zealand’s
            from vehicles, to homes, to restaurants, to steel                  hydrogen future could look like and
            production, to electricity generation at peak times                how our network can play its part.
            supported by large scale, long-term energy storage.
                                                                               This study concludes that the use of the existing
                                                                               gas pipeline network to transport hydrogen
                                                                               throughout the North Island is technically feasible
                           ...GIVING NZ A RANGE OF                             and can make a valuable contribution to carbon
                                                                               emissions reductions. This report also describes
                        RENEWABLE ENERGY CHOICES...                            further steps that need to be taken to progress
                                                                               towards the introduction of hydrogen into the
                                                                               natural gas network later this decade, with
                                                                               more detail provided in the full study report.
            This study has progressed our understanding of
            how Firstgas Group can prepare for hydrogen use                    The future role of hydrogen in New Zealand’s
            as part of New Zealand’s energy future. The work                   economy and the potential future demand for
            allows us to confirm the feasibility of converting                 hydrogen were investigated through three distinct
            Firstgas pipelines to hydrogen — initially as a                    scenarios, each representing a variation of a
            blend, and then to 100% in the future if required.                 decarbonised New Zealand energy sector by
            We have gained a better understanding of the                       2050. These scenarios are outlined in Figure 2
            likely challenges in this conversion process                       and are described in detail in the full study report.
            and have designed an indicative programme of
            future work for converting the gas network.

                  2020                                        2020                       2021-30                              2035+

                                                                                                                           Conversion
                                                                                        Hydrogen
           International                                    Desktop                                                          to 100%
                                                                                         Pipeline
             Research                                       Analysis                                                        Hydrogen
                                                                                         Testing
                                                                                                                           in Pipeline

                                                                       Hydrogen
                                                                                                        Hydrogen
                                Stakeholder                             Network
                                                                                                       Blending in
                                Engagement                             Feasibility
                                                                                                      Live Network
                                                                         Report

                                      2020                              2020-21                        2030-2035
                                                                               WE ARE HERE
Figure 1: Firstgas hydrogen network trial and conversion stages

Executive summary                                                                                HYDROGEN FEASIBILITY STUDY – SUMMARY REPORT   7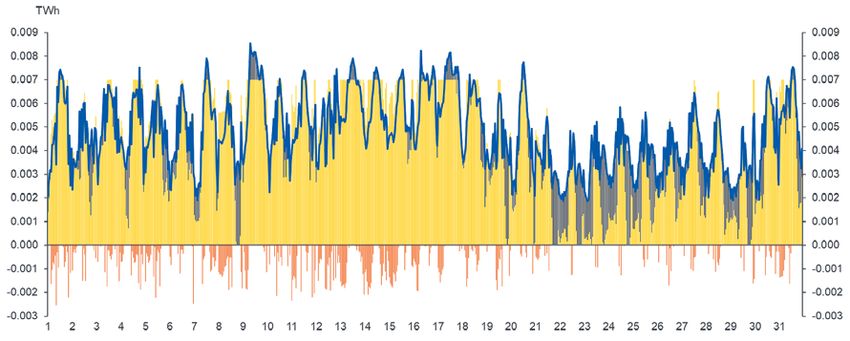
OUR ENERGY SCENARIOS
                                                                              HIGH
                                                                            HYDROGEN
                                                                    Both hydrogen fuel switching
                                                                    and electrification contribute
                                                                     to energy decarbonisation.

                         HIGH
                    ELECTRIFICATION
                    Electrification is the
                 preferred strategy for the       DECARBONISED
                                                  ENERGY SECTOR
                decarbonisation of energy.

                                                                       INTEGRATED
                                                                     ENERGY SYSTEM
                                                               The power system and a 100%
                                                               hydrogen gas network operate
                                                                  as an integrated system.

       Figure 2: The study scenarios

       The scenarios are based on a set of assumptions     In the context of these scenarios,
       around future government support and policies       the study considers:
       for the decarbonisation of energy, as well as
       the role of customer choice, which will influence   — How and why the gas network might
       the type of low-carbon fuels and technologies         be used to transport hydrogen
       that will prevail in the coming decades.
                                                           — The suitability of the materials that the
                                                             current network is constructed from to
       All of the scenarios used in this study are based
                                                             transport hydrogen to energy users
       on the assumption that hydrogen demand is met
       entirely with green hydrogen. While other zero      — The capacity of the network to transfer the
       carbon sources of hydrogen may emerge over            quantities of hydrogen to the areas where it
       the time frames considered in this report (such       will be required, including how the network
       as blue hydrogen which involves capturing and         may need to be re-configured and;
       storing the carbon created by reforming natural
                                                           — T
                                                              he cost of generating green hydrogen and the
       gas into hydrogen), this report has focused on
                                                             changes required to allow transportation and use
       a green hydrogen pathway for New Zealand.
                                                             of natural gas/hydrogen blends and hydrogen.

                                                           The results presented in this summary report focus
                                                           on the Integrated Energy System scenario, which
                                                           was selected as the focus of the analysis in the full
                                                           study report. The implementation of this scenario
                                                           has the potential to bring the greatest economic
                                                           and operational benefits for New Zealand’s energy

8   HYDROGEN FEASIBILITY STUDY – SUMMARY REPORT                                                           Executive summary
Maximizing the use of hydrogen in these applications
                    A RANGE OF ENERGY CHOICES GIVES                                     delivers significant carbon reductions. The study
                                                                                        estimates that hydrogen would contribute
                     NZ THE BEST ECONOMIC BENEFIT                                       8 Mt CO2/yr of emissions reductions in 2050 from
                                                                                        a baseline of energy sector emissions of 32 Mt CO2/
                                                                                        yr in 2018 – removing one quarter of New Zealand’s
            future and has a wide range of implications for                             energy system emissions. Other emissions
            the use of gas infrastructure. Since this scenario                          reductions of 6 Mt CO2/yr come from reduced
            requires the most significant changes to the existing                       demand (energy efficiency), 11 Mt CO2/yr from direct
            gas network to accommodate energy needs, being                              electrification and 5 Mt CO2/yr from bioenergy.
            ready for this scenario will set us up well to manage
            the transportation of hydrogen in other scenarios.

            Hydrogen can play a significant role                                             ACHIEVING 2050 GOAL REQUIRES ZERO
            in decarbonising New Zealand’s
            integrated energy system.
                                                                                             CARBON GAS, RENEWABLE ELECTRICITY
            The study identifies the potential for hydrogen to
                                                                                              AND A DECREASE IN ENERGY DEMAND
            decarbonise high temperature process heat and
            heavy transport, and to provide an energy storage
            vector that supports a 100% renewable electricity                           The switch from coal, oil and natural gas to
            system. These uses are sometimes referred to as                             hydrogen, renewable electricity and biofuels,
            generating ‘hard to abate’ sources of emissions                             together with the overall reduction in energy
            because the direct use of renewable electricity                             demand, results in near zero energy sector
            does not provide a realistic option for reducing                            emissions in 2050, as shown in Figure 4.
            emissions. The potential roles for hydrogen within
            the energy system are shown in Figure 3.

                                               HYDROGEN'S ROLE IN DECARBONISING OUR ENERGY

                 Decarbonising industrial                                 Removing the need                         Decarbonising transport
                 energy uses that are not                               to overbuild renewable                    applications that are not well
                 well suited to electricity,                           electricity generation in                    suited to electricity, such
                  such as steel, cement,                               order to achieve a 100%                     as heavy vehicles, marine,
                        chemicals.                                    renewable electricity grid.                            aviation.

                                                                                               Allowing on-demand
                                           Providing inter-seasonal
                                                                                                power generation to
                                            and inter-year storage
                                                                                            support the intermittency of
                                           of energy to support the
                                                                                            renewables when the dams
                                           electricity system in dry
                                                                                               are low, the wind isn’t
                                             years when the dams
                                                                                              blowing or the sun isn’t
                                             remain at low levels.
                                                                                                      shining.

Figure 3: How hydrogen supports a 100% renewable electricity system

Executive summary                                                                                          HYDROGEN FEASIBILITY STUDY – SUMMARY REPORT   9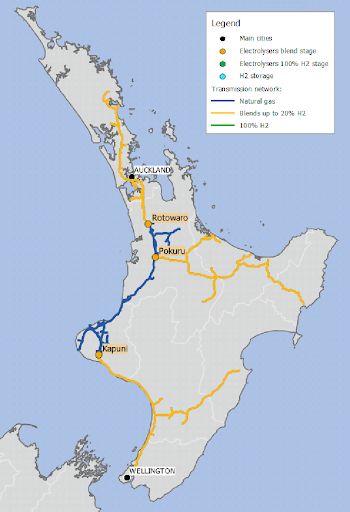
35

                                                                30
                                                                                                                            8             -23%
                                                                                                               Hydrogen

                                                                25

                                                                                                                 Demand
                                                                                                                            6
                   ANNUAL                                       20
                                                                                                                reduction

                EMISSIONS
                  (MTCO2)                                       15
                                                                                                                                                                  TODAY*

            Figure 4: Contribution of carbon                                                             Electrification
                                                                                                                          11
            emissions reductions from
            today’s baseline to 2050                            10

                                                                                                  Bioenergy / Other
                                                                                                                            5
                                                                    5

                                                                                                       Residual 2050
                                                                                                                           4
                                                    MtCO2           0

                                                                                                       *Excludes agricultural, land use, forestry and waste emissions

                                                                                         MILESTONE 3                                                                     MILESTONE 5
                                                                                         Commence network                                                                All networks converted
                                                                                         conversion to 100% H2                                                           to 100% H2
                                                                                       2035                                                                             2050

                    2020                 2025                                                                  2040

                              Phase 1: Trials                             Phase 2:
                                                                                                                Phase 3: Conversion
                           Trials and conversion                           Blends
                                                                                                            Stepwise conversion of network
                                  planning                              H2 blends up
                                                                                                                branches to 100% H2.
                                                                         to 20% vol

                                                             2030                      2035                                                2045
                                                  MILESTONE 1                            MILESTONE 2                                         MILESTONE 4
                                                  Start of 1%                           20% H2 blending                                      H2 storage starts
                                                  H2 blending                           achieved                                             operations

Figure 5: Indicative hydrogen conversion strategy timeline

10      HYDROGEN FEASIBILITY STUDY – SUMMARY REPORT                                                                                                                            Executive summary
ANNUAL HYDROGEN
DEMAND PROJECTION
TW/h / yr Mt / yr PJ/yr
50
160
1.25
40
1 120
2040s
30 100% H2
0.75
80
20
0.5
2030s
Blending
40
10
0.25
2020s
Transport
0 0 0
2010 2020 2030 2040 2050
Figure 6: Projection of annual hydrogen demand
The expected cost of hydrogen is within the range of and additional costs. Pipeline transportation
expected costs for other fuels—but higher than most also avoids truck movements and therefore has
energy costs incurred today. The study estimates safety advantages and is a more environmentally
the cost of producing hydrogen will fall to $3.26/ friendly method of transporting energy.
kg in 2050 ($98/MWh or $27/GJ). This compares
with a likely range of conventional natural gas Network connections also provide the ability to
prices between $8/GJ and $30/GJ (including carbon optimise the value of hydrogen production by
prices of between $25/tCO2e and $200/t CO2e). combining other (potentially high value) uses
of hydrogen such as heavy transport, export
Using the existing Firstgas network to transport production and industrial use with the ability to feed
hydrogen improves its overall economics by the surplus hydrogen produced into gas networks.
avoiding the need to compress hydrogen for Used in this way, gas network connections enhance
transport in a tube trailer or make a chemical the economic viability of hydrogen production
conversion (e.g. ammonia) to transport as part of multi-use hydrogen ‘hubs’, rather than
hydrogen as a liquid1. These steps both incur relying on a single use case for hydrogen.
additional penalties in terms of energy losses
FIRSTGAS GROUP TARGET IS A 20% BLEND OF HYDROGEN
STARTING 2030 WITH 100% STARTING 2035
1 https://www.iea.org/reports/the-future-of-hydrogen
Executive summary HYDROGEN FEASIBILITY STUDY – SUMMARY REPORT 11We have sufficient network capacity and a might meet other energy system needs. For
viable strategy for converting the networks to example, if hydrogen storage was required to
hydrogen blends and then 100% hydrogen. support a fully renewable electricity grid from
an earlier date then this would be feasible
The study modelled demand growth in hydrogen and may change the dates for progressing
increasing from an initial transport load that builds other elements of the conversion strategy.
in the 2020s, with blending into the gas network
starting at scale from 2030. This work suggests
that the network could be 20% hydrogen by 2035,
with a move to full hydrogen by 2050 supported NZ CAN ACCESS BLENDED ZERO
by large scale storage of hydrogen in Taranaki to
provide inter-seasonal and inter-year flexibility for CARBON GAS THROUGH MOST EXISTING
the energy system. Starting 2035 the network would
be progressively converted to 100% hydrogen
NETWORKS AND APPLIANCES
from the end of the network back to Taranaki as
hydrogen demand grows. Working inwards in this
manner means we could keep supplying natural gas To understand if our assets can facilitate the
to users in Taranaki as hydrogen demand grows. level of hydrogen demand estimated, the study
explored whether our gas networks could deliver
We’ve shown this indicative conversion time line the energy and volume of hydrogen required
in Figure 5. This is a good start to show what’s safely – within pressure, flow and velocity limits.
possible, but it is important to bear in mind that The study found that the transmission system
other sequences and timings are possible that (long distance, high pressure gas transportation
Figure 7: Hydrogen programme focus areas
Building Experience
with Hydrogen (2022)
• Live distribution blend trial
• Off-grid test infrastructure
• Live 100% distribution trial
• Live transmission trials
Confirming network Later Phase Activities
characteristics (2021) (2025-)
GAS TRANSMISSION AND
• Consumer equipment
assessments
DISTRIBUTION PIPELINES • Conversion safety assessment
• Conversion strategy review
• Network material • Network modifications
assessments • Operating procedures review
Building the Hydrogen
Value Chain (2021-) KEY
Led by Firstgas
• Hydrogen storage
• Commercial arrangements Led by other stakeholders
• Research Hub
• Public acceptance
• Regulatory change
12 HYDROGEN FEASIBILITY STUDY – SUMMARY REPORT Executive summarynetwork) has enough capacity to transport the Of particular relevance here in New Zealand is
projected energy demand as either a blend of the body of work being undertaken by the Future
hydrogen in natural gas, or entirely as hydrogen Fuels Cooperative Research Centre (FFCRC) in
gas, with minimal capacity reinforcement. Australia. The FFCRC consists of a combination of
However, Firstgas will need to change the
configuration of our compressors as compression HYDROGEN CAN BE STORED AT SCALE,
will be needed in different locations, since hydrogen
production will be distributed across the network. MEANING LESS INVESTMENT TO PRODUCE
Changing compressors is likely to occur during the
already programmed renewal of our assets prior to industry experts, government representatives and
network conversion to hydrogen. The introduction academic researchers to cover multiple streams
of hydrogen also creates potential for reduced of technical evidencing required to decarbonise
pipeline compression needs (with associated capex Australia’s energy networks using hydrogen
and opex savings), since electrolysers can likely and biomethane. Their RP3 Network lifecycle
inject hydrogen at pressure across the network. management programme is a 30+ topic research
stream focusing on quantifying and combating
The study also modelled a typical low-pressure gas key issues of equipment material compatibility
distribution network (localised, lower pressure gas and performance under hydrogen service. A key
transportation network), and found that distribution focus of this research is the issue of hydrogen
networks are likely to be able to deliver enough embrittlement and the FFCRC is setting up large
hydrogen blends and 100% hydrogen for projected scale research test facilities to test the effect of
demands, with some reinforcement required. hydrogen on transmission pipeline material.
The cost of the modifications over all distribution Firstgas is a member of the Australian Pipeline
networks is projected to be in order of $270 million
over the coming 30 years. While this expenditure
is significant, the Firstgas Distribution Asset
Management Plan already projects $100 million
FIRSTGAS GROUP IS LEADING THE WAY
of capital expenditure over the next 10 years with
similar (or greater) levels of investment planned on
BY STAYING ABREAST OF INTERNATIONAL
the other gas distribution systems owned by Vector DEVELOPMENTS AND LEADING NZ INDUSTRY
and Powerco. Investments to enable hydrogen
could be incorporated into the existing asset renewal
programme to manage consumer cost impacts. and Gas Association (APGA) who partly fund
the FFCRC, which allows us to participate in this
We think that much of the Firstgas network research programme and access the findings of the
will be capable of transporting hydrogen work. We aim to leverage this connection to ensure
blends and hydrogen without replacement. that we can both influence the direction of the
programme and potentially provide representative
The study assessed the typical components of samples of existing pipeline materials for testing.
our transmission network for likely risks when
operating with hydrogen blends or 100% hydrogen. Hydrogen production opportunities are large
This assessment was made based on the current and dispersed across the Firstgas network.
state of international research. At this point we have
The Firstgas network is designed to transport
gas from Taranaki to users across the North
Island. Hydrogen changes that dynamic as
HYDROGEN CAN BE PRODUCED ANYWHERE, hydrogen can be produced across the island.
SUPPORTING LOCAL ECONOMIES This means that the compressors will work in
a different way and gas will potentially flow in
different directions. Also, as the study assumes
that electrolysers will discharge at high pressure
identified some issues. The key issue of hydrogen into the network, the Firstgas compressors will
embrittlement of high-strength steel potentially have less work to do – saving on operating
applies to around one third of our transmission expenditure. This distribution of electrolysers
network. This and other issues are being actively across the network provides the opportunity to
investigated in overseas research programmes. develop hydrogen economy hubs across the
We therefore expect that some of these technical regions to take advantage of this infrastructure.
issues are likely to be resolved as more work is
done on gas pipelines overseas and by the forward The build-out of electrolysers estimated in the
Firstgas research, development and demonstration study is significant. Hydrogen demand in 2050
(RD&D) programme set out in this summary report. is projected to be 42 TWh and this will need
2 Equivalent to approximately 2,000m3/hr or 178 tonnesH2/hr production capacity.
3 https://www.nationalgrid.com/uk/gas-transmission/insight-and-innovation/transmission-innovation/futuregrid
Executive summary HYDROGEN FEASIBILITY STUDY – SUMMARY REPORT 138.5 GW of electrolyser capacity2 and use 50 TWh Our results set a good foundation to
of electricity. This would require the addition of define the forward programme.
around 28 GW of electricity generation capacity by
2050. While this is more that the new generation To prove reliable and safe operation of our pipeline
capacity required in Transpower’s Whakamana networks with hydrogen, we need to regularly
i Te Mauri Hiko report, our study also study review worldwide research and adopt results where
encompasses greater decarbonisation as more practicable. Some of this work, like the HyNTS
energy requirements are decarbonised, particularly programme currently underway in the United
in high temperature process heat and heavy Kingdom3, involves removing components of their
transport. Importantly, the required generation network from service and testing them for hydrogen
investment to produce hydrogen is less than if all blends and 100% hydrogen in an off-grid facility.
energy end uses are electrified (which the study These programmes will give us a realistic view on the
estimates would require 32 GW of new generation likely performance of our similar network componentry
capacity). This is because hydrogen enables energy of a similar age. There will be gaps, which will need
to be stored at scale, storing hydrogen produced to be addressed by New Zealand specific research
off-peak for use during peak demand periods. and demonstration. While many of our components
are similar to overseas networks, they may not be
Our consultants estimate the cost to build the identical or the operating conditions may differ.
electrolyser capacity at around $3.3 billion by 2035, To successfully convert our pipeline networks,
with an additional cost of $11.6 billion from 2035 to a programme of activities will need to be
2050. We view this as the upper bound of electricity undertaken. Some of these activities are
generation and electrolyser build out to produce directly related to assuring the components
large amounts of hydrogen. However, many of the of our network work with hydrogen.
hydrogen storage and energy system integration
benefits would still be realised with lower levels of Others relate to equipment owned by third parties
electricity generation and hydrogen production. or the need to set up appropriate commercial
and regulatory regimes. We see Firstgas Group
as the natural leader for work relating directly
to our network assets, but think that other
stakeholders are best placed to lead hydrogen-
related work in the wider energy sector. The
work programme is set out in Figure 7.
FIRSTGAS INTENDS Live distribution blend trial planning:
TO START WORK
03
Final network
selection and
execution of a
STRAIGHT AWAY hydrogen blend in
a live network.
Consumer equipment assessments: Hydrogen storage scoping work:
Building understanding
Preparing a full inventory
01 04
of the options for storing
of appliances connected
hydrogen at various
to our networks and those
scales, the maturity of
of other network operators
these options and the
to understand RD&D and
RD&D required to mature
conversion requirements.
the technologies.
Materials assessments: Commercial arrangements scoping work:
Undertaking a detailed Developing an
02 05
materials assessment of understanding of changes to
our networks and those of commercial arrangements
other network operators that will be needed to
to understand RD&D and introduce hydrogen blends
conversion requirements. into the network post trials.
14 HYDROGEN FEASIBILITY STUDY – SUMMARY REPORT Executive summaryAlongside this work, we will also actively monitor
the progress being made on gas network trials
overseas and will incorporate the findings of that
work (as applicable) into our programme. We will
also continue to participate in the Australian FFCRC
programme through our membership of APGA.
We would like to see other parties
working on the following as a priority:
— Establishing a research hub: providing
a central clearing house for international
research to allow this to be quickly understood
and assimilated by stakeholders.
— Reviews of the regulatory regime: end to
end assessment of all potential regulatory
barriers to hydrogen uptake and an action
plan to create a facilitative regime.
— Building public acceptance: providing
impartial, factual information to the public
about the potential uses of hydrogen, safety
impacts and how it will impact them.
THIS STUDY IS A
GOOD FIRST STEP
When launching this study, we said
we believed realising a hydrogen
economy will be a collaborative effort.
Our findings support this view. We
see the role of Firstgas Group as
facilitating the programme to convert
the gas network to hydrogen, while
others can join us in developing other
parts of the hydrogen ecosystem.
This collaboration will ensure New Zealand is
well placed to roll out hydrogen as a part of its
approach to energy sector decarbonisation.
Executive summary HYDROGEN FEASIBILITY STUDY – SUMMARY REPORT 15ACKNOWLEDGEMENTS
This study was 50% funded by Government investment managed by the Provincial Development Unit
(PDU). We would like to thank the Provincial Development Unit for their support in furthering this very
important work.
We would like to acknowledge the members of our governance group who gave their time to support
this study:
• Bridget Sullivan, Provincial Development Unit
• Dr Linda Wright, NZ Hydrogen Council
• Pam Walklin, National New Energy Development Centre Establishment
We would also like to acknowledge the support of all our workshop attendees and interviewees.
Special thanks also to Dr Megan Woods, Minister of Energy and Resources for her support of this study.
Finally, we would like to acknowledge the assistance of the following organisations in the preparation
of this report:
• Ara Ake
• Beca
• Business Energy Council
• Callaghan Innovation
• Commerce Commission
• Concept Consulting
• Contact Energy
• Elemental Group
• Energy Efficiency and Conservation Authority
• EHL Solutions
• Fonterra
• Gas Industry Company
• Genesis Energy
• GNS
• Halcyon Power
• Hiringa Energy
• Hyundai NZ
• JGP Ltd
• MacDiarmid Institute
• Major Gas Users Group
• Methanex NZ
• M
inistry for Business Innovation
and Employment
• Mitsubishi NZ
• Nova Energy
• Office of the Minister for Energy and Resources
• Obayashi Corporation
• Refining NZ
• Standards NZ
• PowerCo
• Transpower
• Venture Taranaki
• Victoria University Wellington
• Worksafe NZ
• Worley
• Z Energy
16 HYDROGEN FEASIBILITY STUDY – SUMMARY REPORT AcknowledgementsFIRST GAS TRANSMISSION NETWORK MAP
Waitoki
Auckland
Kauri
Whangarei Southdown
Henderson Westfield
Marsden Point Bruce Mclaren
Waikumete Flatbush
Maungaturoto Otahuhu Alfriston
Papakura Hunua
Drury
Pukekohe Ramarama
Kingseat
Wellsford
Glenbrook Harrisville
Tuakau
Warkworth
Tauranga
Rotowaro Huntly
Tatuanui Rotorua
New Plymouth Waitara Ngaruawahia
Morrinsville Waitoa
Te Kowhai Mt Manganui
Kiwitahi
Papamoa
Pyes Pa
Matangi Papamoa
Oakura Kaimiro Hamilton Cambridge
Te Puke
Inglewood Temple View
Okato Te Awamutu
DF Tirau Okoroire Whakatane
Norfolk Pirongia
Pungarahu No.2 Pungarehu Waikeria Edgecumbe
Stratford Pokuru Putaruru Opotiki
Te Teko
Cardiff Kihikihi Kawerau
Lichfield
Opunake Kaponga
Otorohanga Tokoroa Kawerau
Kupe Eltham
Oaonui
Kapuni Te Kuiti North
Lactose
Te Kuiti South Kinleith
AUP Matapu
Hawera
Reporoa
Okaiawa/ Manaia
Mahoenui Broadlands
Mokau
Gisborne
Taupo
Patea Hastings
Waverley
Mokoia
Waitotara
Mangaroa
Kaitoke
Lake Marton
Alice
Kakariki
Whanganui Kaitoke Feilding
Takapau
Oroua Ashhurst
Downs Dannevirke
Flockhouse
Foxton Mangatainoka
longburn
Pahiatua
Levin
Map Key Kuku
Otaki
Te Horo
Waikanae
Production Station Paraparaumu
Palmerston North
Compressor Station Pauatahanui No.2
Waitangirua
Belmont
Delivery Point Tawa
Delivery Point
City/Town Lower Hutt
Wellington
Firstgas High Pressure Pipelines
Maui High Pressure Pipelines
Transmission network map HYDROGEN FEASIBILITY STUDY – SUMMARY REPORT 1702
INTRODUCTION
In May 2019, Firstgas Group
announced our intention to explore
how hydrogen might be used in
our existing gas pipeline networks
as part of a low carbon energy
system in New Zealand. This report
and the accompanying technical
study from Aqua Consultants and
Element Energy, document the
work completed to establish and
inform our trial programme.
18 HYDROGEN FEASIBILITY STUDY – SUMMARY REPORT Introduction2.1 ABOUT OUR CONSULTANTS
Element Energy is a low carbon energy economics consultant firm based in London. They have
significant experience in the analysis of hydrogen projects and are involved in the Hy4Heat study4
and the Gigastack project5 among a wide range of work they have done for public and private sector
clients throughout Europe. This economic expertise is complemented by the practical engineering
expertise provided by Aqua Consultants. Aqua have been integral to numerous UK gas transmission
innovation projects in the hydrogen and new energy space, such as the Leeds H21 project6.
2.2 FOCUS OF THIS WORK 2.3 STUDY PROCESS
The focus of this work is to better understand This work could not have happened without
how existing natural gas infrastructure might the input of Firstgas’ stakeholders. We began
be used to transport hydrogen from where in early March 2020 with a series of workshops
it is produced to where it is required. and interviews in Wellington and New Plymouth.
This allowed our study team to understand
While natural gas today provides over 20% of more about the NZ energy system and source
New Zealand’s primary energy supply7, hydrogen data for the study. We interviewed over 40
has the potential to decarbonise more parts of individuals across 14 organisations over a week
the economy than are currently fuelled by natural to kick off the study. A further 30 people from
gas, such as vehicles like trucks, trains, ferries 15 organisations attended two, four-hour long
and planes. To stimulate discussion on the role of workshops in Wellington and New Plymouth.
hydrogen in New Zealand’s zero carbon future,
the Government released its Vision for Hydrogen We also held stakeholder events for around
in New Zealand Green Paper in 2019.8 180 people to further engage with potential
sources of information and users.
The study Firstgas has commissioned aims
to help improve our understanding on how The study team took this information away to
pipeline infrastructure can help realise this develop the hydrogen scenarios. We set up further
vision. Firstgas’ extensive pipeline network in meetings with other stakeholders focused on
the North Island reaches all major centres. This specific topics. This allowed for ground-truthing
creates the opportunity for existing infrastructure of the scenarios and testing of their robustness.
to play a substantial role in decarbonising Following on from this work we set to work
New Zealand’s energy system through: modelling these scenarios from an economic and
physical perspective to understand the implications
of introducing hydrogen into the system.
— Storage in our pipeline network to support
intraday/daily and weekly energy flexibility; It was intended that further stakeholder
workshops were to be held during the course
— C
onnection to large scale hydrogen storage for
of the study. Unfortunately, due to COVID-19
seasonal flexibility;
the team were unable to return to NZ following
— Low-cost transportation of hydrogen as a their initial visit. However, they were able to
transport fuel; complete the study with only limited delays.
— Systems to manage specification, measurement
and gas safety;
— Commercial chain of custody between hydrogen
producers and users;
— E
nabling ‘hard to treat’ industrial users the ability
to decarbonise by providing zero emission gas to
their site; and
— M
anagement of hydrogen blends prior to 100%
hydrogen operations commencing.
4 https://www.hy4heat.info/
5 https://gigastack.co.uk/
6 https://www.h21.green/projects/
7 Gas Industry Company, 2016, NZ Gas Story, p6. https://www.gasindustry.co.nz/about-the-industry/nz-gas story/document/5806
8 https://www.mbie.govt.nz/building-and-energy/energy-and-natural-resources/energy-strategies-for-new-zealand/a-vision-for hydrogen-in-new-zealand/
Introduction HYDROGEN FEASIBILITY STUDY – SUMMARY REPORT 192.4 REPORT STRUCTURE
This report is set out with the following sections:
— Future hydrogen demand – how we think
hydrogen could be used in a decarbonised New
Zealand economy.
— Future hydrogen supply – how we think hydrogen
could be supplied and the implications for the
electricity and water sectors.
— Network conversion strategy – how we could roll
out hydrogen to our networks based on our views
of future hydrogen supply and demand.
— T
echnical feasibility – what we think we will need
to test to undertake conversion of the network.
— Our next steps – what we will need to test, who
we need to engage with and what we should
investigate first.
This summary report highlights the key
elements of the full study report, which can be
found on our website www.firstgas.co.nz
We invite you to contact us if there is something you
would like to know more about. Please contact:
comms@firstgasgroup.co.nz
20 HYDROGEN FEASIBILITY STUDY – SUMMARY REPORT Introduction03
FUTURE
HYDROGEN
DEMAND
The study considered three
scenarios for the potential future
demand for hydrogen - each
representing a variation of a
decarbonised New Zealand
energy sector by 2050.
FUTURE HYDROGEN DEMAND HYDROGEN FEASIBILITY STUDY – SUMMARY REPORT 21The scenarios are based on a set of assumptions This scenario was chosen as the focal point for
around future government support and policies our work since it has wide ranging impacts on the
for the decarbonisation of energy, as well as use of the gas pipeline system. If we are prepared
the role of customer choice, which will influence for that scenario to play out, then we believe we
the type of low-carbon fuels and technologies can confidently facilitate the use of hydrogen
that will prevail in the coming decades. under other plausible scenarios. This scenario also
performed best when assessed against the World
All of the scenarios used in this study are based Energy Council’s Energy Trilemma objectives
on the assumption that hydrogen demand is met – delivering on energy security, energy equity
entirely with green hydrogen. While other zero and environmental sustainability outcomes.9
carbon sources of hydrogen may emerge over This section provides an overview of energy demand
the time frames considered in this report (such under this scenario, the main uses and possible
as blue hydrogen which involves capturing and costs of hydrogen over the 30-year time frame
storing the carbon created from reforming natural analysed and summarises the resulting carbon
gas into hydrogen), this report has focused on emissions from the energy sector in this scenario.
a green hydrogen pathway for New Zealand.
In this summary report we present the results of the
Integrated Energy System scenario, which assumes
3.1 ENERGY DEMAND IN 2050
that Government policy and network economics Hydrogen is expected to largely replace natural
drive the integration of the power and gas sectors gas demand in most sectors by 2050. It will also
to deliver a balanced low carbon energy supply replace a large portion of fossil fuels utilised
system. In this scenario, surplus renewable power in transport, especially for heavy vehicles.
is stored as hydrogen and used for industrial and Additionally, hydrogen is expected to be able to
transport needs, as well as being reconverted replace coal in the steelmaking process and for
to power when required to support the grid. dry-year storage. Natural gas demand to produce
OUR ENERGY SCENARIOS
HIGH
HYDROGEN
Both hydrogen fuel switching
and electrification contribute
to energy decarbonisation.
HIGH
ELECTRIFICATION
Electrification is the
preferred strategy for the
decarbonisation of energy.
DECARBONISED
ENERGY SECTOR
INTEGRATED
ENERGY SYSTEM
The power system and a 100%
hydrogen gas network operate
as an integrated system.
Figure 8: The study scenarios
9 https://trilemma.worldenergy.org/
22 HYDROGEN FEASIBILITY STUDY – SUMMARY REPORT FUTURE HYDROGEN DEMANDmethanol in New Zealand is not replaced by
hydrogen, due to the reliance on a large source
of CO2 to be used as feedstock in the chemical
3.2 GROWTH IN HYDROGEN
processes involved. More detailed information
on our assumptions on fuel switching is reported
DEMAND PRIOR TO 2050
in the appendices of the full study report.
The increase in hydrogen demand is
assumed to follow the following order:
A comparison of the energy demand and fuel
mix in 2020 and 2050 in the study is provided in
— Transport demand commencing in the early
Figure 9. This shows final energy consumed by
2020s – commencing with a network of hydrogen
sector. The demand for hydrogen and natural gas
refuelling stations. Electrolysers will be built at
in this scenario is summarised in Table 1 below.
refuelling stations connected by road tanker.
The network of refuelling will grow as the
In this scenario, fossil fuels are replaced by
hydrogen fleet grows in size. These locations
electrification and conversion to hydrogen in
will be close to transport infrastructure and will
relatively equal proportions. In fact, as a result of the
act as hubs – not only serving onsite hydrogen
similar expected cost of electricity and hydrogen,
refuellers for vehicles travelling on the highways,
we expect the two energy vectors to be used
but also generating hydrogen to be distributed
according to their technical suitability and assume
by road tanker to a network of smaller refuelling
they are complementary and interchangeable.
sites.
HYDROGEN COMPLEMENTS AND — From the early 2030s blending of gas into the
gas network is assumed – reaching 20% by
EXTENDS ELECTRIFICATION 2035.
Table 1: Demand for hydrogen and natural gas
Demand
Sector Fuel type Comments
2020 2050
Significant reduction from 2020:
24 TWh 9 TWh
Natural gas Remaining demand predominantly
(85 PJ) (32 PJ)
in methanol production
Energy
40 TWh
Hydrogen 0 TWh New supply across all sectors
(143 PJ)
Largely unchanged from
14 TWh 14 TWh
Natural gas 2020. Demand from methanol
(51 PJ) (51 PJ)
and urea production
Process feedstock
1.2 TWh New supply for iron reduction
Hydrogen 0 TWh
(4.3 PJ) at Glenbrook Steel Mill
11 TWh Natural gas CCGTs replaced
Natural gas 0 TWh
(41 PJ) by renewable generation
Electricity
generation
0.16 TWh Hydrogen gas turbines
Hydrogen 0 TWh
(0.6 PJ) supplement renewable generation
FUTURE HYDROGEN DEMAND HYDROGEN FEASIBILITY STUDY – SUMMARY REPORT 232020 Natural Gas 38TWh Hydrogen 0TWh Primary
Commerce
Household Feedstock etc
38% Transport 37% Industry 11% 9% 5%
Feedstock:
Energy: 166TWh 17.5TWh
Electricity Hydrogen Oil Biofuel Gas Coal Geothermal
2050 Natural Gas: 24TWh Hydrogen 41TWh Primary
Commerce
Household Feedstock etc
26% Transport 43% Industry 14% 12% 5%
Feedstock:
Energy: 142TWh 15.3TWh
Figure 9: Final energy demand by fuel in 2020 and 2050
24 HYDROGEN FEASIBILITY STUDY – SUMMARY REPORT FUTURE HYDROGEN DEMAND— Starting in 2035 the gas network will be The results of this economic analysis are presented
converted sequentially to 100% hydrogen and in Figure 11. The largest contributor to the cost
there will be large scale storage of hydrogen of hydrogen is the cost of electricity, followed by
available (assumed to be operational from 2045). capex and opex costs of the electrolysers used
Hydrogen demand from users connected to the to produce hydrogen. “Other” costs including the
gas grid in 2050 will account for roughly 50% of cost of implementation and operation of the inter-
overall hydrogen demand in New Zealand. seasonal storage and the cost of water for the
electrolysers are relatively minor in comparison.
The growth in total hydrogen demand over the
period from 2020 to 2050 is shown in Figure 10.
The forecast of the 2050 electricity costs
for dedicated renewables is $61 /MWh (real
3.3 HIGH-LEVEL ECONOMIC terms 2020), which is based on the long run
marginal cost of wind generation. The study
ASSESSMENT OF HYDROGEN assumes that using a mixed supply and
allowing hydrogen to be generated to storage
DEMAND from renewable spill through the grid, reduces
the 2050 electricity cost for hydrogen by
10% to $55 NZ$/MWh (real terms 2020).
The study developed a detailed economic
assessment to evaluate the role of hydrogen The study also compares expected hydrogen
in New Zealand’s energy system from an costs with other studies and with estimated future
economic perspective. This work included costs of natural gas (which is the alternative
estimating the costs of infrastructure conversion fuel in many cases). This analysis is shown in
and operating hydrogen production facilities to Figure 12. These comparisons suggest that the
develop indicative hydrogen resource costs. future hydrogen costs used in the work, fall within
ANNUAL HYDROGEN
DEMAND PROJECTION
TW/h / yr Mt / yr PJ/yr
50
160
1.25
40
1 120
2040s
30 100% H2
0.75
80
20
0.5
2030s
Blending
40
10
0.25
2020s
Transport
0 0 0
2010 2020 2030 2040 2050
Figure 10: Projection of annual hydrogen demand
FUTURE HYDROGEN DEMAND HYDROGEN FEASIBILITY STUDY – SUMMARY REPORT 25the range of other studies, being higher than
those used for the Australia Hydrogen Roadmap
but lower than Castalia’s work for MBIE on
hydrogen costs in New Zealand. The analysis
also suggests that hydrogen would be a lower-
cost option than natural gas in a high gas cost
scenario – where wholesale gas costs $19.50/
GJ and the carbon price increased to $200/tCO2.
The purpose of these estimates is not to predict
the future price of hydrogen. Since large-scale
hydrogen production and distribution is not
yet commonplace around the world, costs are
expected to decline over coming decades –
although the rate and level of those cost decreases
is highly uncertain. The purpose of estimating
these costs for this work is to demonstrate that
expected costs are within the range that would
support the deployment of hydrogen at scale.
Technical Blending up to Conversion to 100% H2 System continuous
evidencing 20% H2 operation
$/KG
7 6.3 6.0 5.1 5.3 3.9 3.3 3.3 3.4
-46.1%
0
2025 2030 2035 2040 2045 2050 2055 2060
Water & storage Electricity Electrolyser opex Electrolyser capex
Figure 11: Annual hydrogen cost in NZ$/kg
26 HYDROGEN FEASIBILITY STUDY – SUMMARY REPORT FUTURE HYDROGEN DEMANDCOST OF HYDROGEN & NATURAL GAS COST OF HYDROGEN
NZ$/GJ NZ$/kg10
35 6
0 0
Core 2050 2050 2050 Core 2030 2020-2050 2020-2050
scenario High Mid Low scenario Australia Castalia Castalia
mixed mixed Roadmap Grid Dedicated
supply 2050 supply 2050 Wind
NATURAL GAS IN NZ H2- OTHER STUDIES
Figure 12 Cost of hydrogen compared with other studies
and natural gas estimates
3.4 ENERGY SECTOR CARBON
EMISSIONS IN 2050
35
The impact on carbon emissions with the shift in the
fuel mix is shown in Figure 13. The switch from coal,
30
8 -23%
Hydrogen
oil and natural gas to hydrogen, renewable electricity
and increased use of biofuels, together with
overall demand reduction, results in energy sector 25
emissions being reduced to near zero and a small
amount of residual emissions in 2050, attributable Demand
6
ANNUAL
to remaining natural gas use in the industry sector. 20
reduction
EMISSIONS
(MTCO2) 15
TODAY*
Electrification
11
10
Bioenergy / Other
5
5
Residual 2050
4
MtCO2 0
Figure 13: Contribution of carbon emissions
reduction from today’s baseline to 2050 *Excludes agricultural, land use, forestry and waste emissions
10 Exchange rate of NZD/AUD of 1.1
FUTURE HYDROGEN DEMAND HYDROGEN FEASIBILITY STUDY – SUMMARY REPORT 2704
PROJECTIONS AND
IMPLICATIONS OF
HYDROGEN SUPPLY
Ramping up hydrogen production
capacity to meet the hydrogen
demands estimated in the study will
present a significant challenge and
investment requirement. In this section
we consider the hydrogen production
infrastructure required to meet the
demand, based on the assumption
that all hydrogen demand is met with
green hydrogen. We also outline
how this interacts with the electricity
system and impacts on water usage.
28 HYDROGEN FEASIBILITY STUDY – SUMMARY REPORT Projections and implications of hydrogen supplyThe operation of the large-scale storage to meet
4.1 HYDROGEN SUPPLY SOURCES demand alongside hydrogen production is shown
in Figure 15 overleaf for three time-scales: over the
year, over the peak demand month and during the
To assess the hydrogen production requirements, peak day. These graphs demonstrate how hydrogen
the study developed an hourly model of hydrogen is contributing to our energy system flexibility.
and electricity supply and demand out to 2050.
If hydrogen is produced via electrolysis, a key The electrolyser capacity will be built up over
consideration for the supply infrastructure will be time as the hydrogen demand increases. The
to ensure there is adequate renewable electricity total electrolyser capacity reaches 8.5 GW (178
available to meet the electrolyser demand, tonnesH2/hr) by 2050 as shown in Figure 14
while also meeting the anticipated growth of alongside average utilisation. The build is relatively
electricity demand across the economy. slow over the period to 2035 as hydrogen is
only present in the network at up to a maximum
Based on projected hydrogen demand, the hourly 20% blend. It increases more rapidly in the
model allowed estimation of the following: decade to 2050 as the network converts fully to
hydrogen supply. The impact of the large-scale
— Required electrolyser capacity storage coming online in 2045 can be seen by
— Required hydrogen storage the sharp increase in electrolyser utilisation.
— Electricity demand due to hydrogen production Compared to the current global electrolyser market
— Electricity generated from hydrogen of around 150 MW, this clearly represents a very
significant electrolyser build programme. However,
— Water usage multiple recent market studies forecast a rapid
We assume that renewable energy spilled at ramp-up in the electrolyser market, with a gigawatt
times of low electricity demand will be used per year market expected to develop in the 2020-
to make hydrogen which is stored for later 2025 period, hence gigawatt-scale installed capacity
use. This increases the capacity factor of the by 2050 in New Zealand is not unreasonable.12
electrolyser and the renewable generation and
reduces the production capacity required for
both hydrogen and electricity. Both these factors
reduce the cost of hydrogen and electricity.
ELECTROLYSER CAPACITY AND UTILISATION
Electrolyser Utilisation (%) Electrolyser Capacity (GW)
GW %
9 70%
9
6
5
1 2
0 0%
2030 2035 2040 2045 2050
Figure 14: Build-up of electrolyser capacity and utilisation of the installed capacity
12 https://publications.jrc.ec.europa.eu/repository/bitstream/JRC115958/kjna29695enn.pdf
Projections and implications of hydrogen supply HYDROGEN FEASIBILITY STUDY – SUMMARY REPORT 29H2 demand H2 from storage H2 generated H2 into storage
HYDROGEN DAILY SUPPLY AND DEMAND BALANCE
1 60 120 180 240 300 360
Days of the year
OPERATION OF ELECTROLYSERS AND STORAGE – PEAK MONTH
Days of the month
OPERATION OF ELECTROLYSERS AND STORAGE – PEAK DAY
Hours of the day
Figure 15: Hydrogen production by electrolysers and operation of storage to meet
demand – annual, peak month and peak day timescales
30 HYDROGEN FEASIBILITY STUDY – SUMMARY REPORT Projections and implications of hydrogen supplyThe large-scale hydrogen storage facility required The study assumes that supply of hydrogen
is assumed to be located in Taranaki using will develop in step with the demand created
a depleted oil and gas reservoir. The rate of in different sectors as they develop:
withdrawal required to meet modelled demand
is 4 GWh (15 TJ/h), which has been applied as — Transport demand commencing in the early
a cap on the maximum rate at which hydrogen 2020s. Electrolysers will be built at re-fuelling
can be fed into the network from the large-scale stations connected by road tanker. The network
store. This is larger than the current capacity of refuelling stations will grow as the hydrogen
at the Ahuroa gas storage facility of 2.7TJ/h. fleet grows in size. (these locations are shown
in the left panel of Figure 17). This proposed
Hydrogen storage has been sized at 5TWh (18PJ) network of refuelling hubs has been supported
such that hydrogen can be used to generate by discussions with Hiringa Energy on the likely
electricity to meet peak power sector demands and distribution of hydrogen demand in the transport
to provide dry year resilience. Increasing the storage sector.
volume beyond this level delivers diminishing
returns in terms of improving electrolyser utilisation
— From the early 2030s we assume blending
and minimising the renewable generation capacity
of gas into the gas network – reaching 20%
required in the system. The variation in the level of
by 2035. It is assumed that the locations of
hydrogen in storage over the year is shown in Figure
the electrolysers would build on the hydrogen
16 below for an average year and a dry year (we
transport infrastructure (as shown in the middle
assume in both cases that the store is 50% full at
panel of Figure 17).
the start of the year). The hydrogen store is not fully
depleted during the winter period even in a dry year,
despite a rapid draw-down on the stored hydrogen. — From 2040 the gas network will be 100%
hydrogen. The electrolysers used in the
blended network will remain in place and be
supplemented to form the network in the right-
hand panel of Figure 17. This assumes large
scale storage of hydrogen in Taranaki.
ANNUAL VARIATION IN H2 STORAGE LEVEL
TWh Average year Dry year
6
5
4
3
2
1
0
01 100 188 276 365
Days from start of year
Figure 16 Variation of large-scale storage under average and dry year conditions
Projections and implications of hydrogen supply HYDROGEN FEASIBILITY STUDY – SUMMARY REPORT 31Refuelling station ‘hub’ locations Electrolyser locations in 2035 Electrolysers and hydrogen
– sites for onsite electrolysers to – additional sites for injection storage in 2050 – locations of
meet transport demands. of hydrogen into the transmis- electrolyser plant and large-
sion network (20 vol% hydrogen scale storage to feed the 100%
blend). H2 network.
Figure 17 Locations of refuelling stations and electrolyser sites
Electrolyser locations have been determined to the New Zealand economy, including domestic,
ensure that the peak demands on the gas network commercial, industrial and transport demands.
can be met without encountering any network Electricity demand in these non-hydrogen sectors
constraints, such as unacceptable pressure drops. (collectively referred to as the power sector) is
The study assumes that the electrolysers installed based on the growth projections in the Whakamana
for grid injection will produce hydrogen at high i Te Mauri Hiko (WiTMH) report, modified to
pressure, enabling injection into the transmission reflect the impact of hydrogen penetration into
network without additional compression. The the sectors where hydrogen and electricity
injection of hydrogen at high pressure at dispersed compete, for example transport and heating.
locations around the network is expected to
have a beneficial impact on the requirement The supply and demand model was used to
for pipeline network compressors. Additional assess the electricity generation capacity required
compressor stations will still be required, but to meet total electricity demand as the demand
the duty on the compressors should be reduced for hydrogen ramps up, in particular the capacity
potentially resulting in reduced operating costs of new renewable generation such as wind and
compared to the current natural gas network. solar. Annual 2050 hydrogen and electricity
demand is shown in Table 2. The electricity
4.2 ELECTRICITY SYSTEM demand is similar to that in the WiTMH ‘Mobilise
to Decarbonise’ and ‘Tiwai Exit’ scenarios.
IMPACTS OF HYDROGEN SUPPLY Table 2 2050 hydrogen and electricity demand
The study modelled the interactions between the
hydrogen production system and the electricity Demand in 2050
system using a supply and demand model, which (TWh)
includes an hourly representation of supply and
demand for both hydrogen and electricity over Hydrogen 41.5
the period to 2050. The electricity supply and
demand model incorporates electricity required Electricity* 63.2
for electrolysis (the hydrogen sector demand)
*Excludes demand for hydrogen production through electrolysis
and electricity demand across other sectors of
32 HYDROGEN FEASIBILITY STUDY – SUMMARY REPORT Projections and implications of hydrogen supplyThe study includes a relatively limited use of demand is calculated. ‘Other’ generating capacity
bioenergy and some industrial gas use in 2050, includes fossil fuel plant in the earlier years, that
but no other fossil fuels remain in the energy are assumed to be retired over the period to 2050
mix (petrol and diesel in the transport sector is and dispatchable renewable generation (such as
entirely replaced by electricity and hydrogen). biomass) after that point. In this analysis there is
no requirement for ‘Other’ generating capacity in
In line with WiTMH, the study represents a 2050, as the peaks in power sector demand can
significant increase in electricity demand compared be met by hydrogen-fuelled generating plant.
to today - requiring growth in the electricity
generation capacity and phasing out of fossil fuel The capacity of renewable electricity generation
generation with renewable generating capacity. required to meet the combined power and hydrogen
Production of hydrogen via electrolysis results sector demand is large – 18 GW of wind and
in a significant additional demand for electricity, 13.5 GW of solar by 2050. However, the required
on top of the growth in power sector demand. generating capacity is less than would be needed
The growth in overall New Zealand electricity if all energy uses were directly electrified.
demand is shown in Figure 18, with demand from
electrolysers accounting for just under half (44%) This is because hydrogen storage allows use wind
of New Zealand’s total electricity demand in 2050. and solar plant more efficiently in two ways:
To meet this rapid growth in electricity demand — Generating hydrogen at times when wind and
whilst also decarbonising the power sector solar are available but there is no electricity
will require a significant increase in renewable demand stores energy that would otherwise have
generation capacity. The generation capacity been wasted and increases utilisation of the
required is shown in Figure 19. The capacities of generation plant
hydro and geothermal generation are taken from
— Generating electricity using hydrogen at times
the Whakamana i Te Mauri Hiko (WiTMH) report
of peak demand reduces the requirement for
projections with the capacity of wind, solar and
additional wind and solar generation capacity to
other generating plant then sized to meet the power
cover peak times.
sector demand before the additional wind and solar
capacity required to meet the hydrogen sector
ANNUAL ELECTRICITY DEMAND (TWh/Y)
42 43 49 60 77 96 114
2020 2025 2030 2035 2040 2045 2050
Electrolyser demand Power sector demand
Figure 18 Growth of total electricity demand
Projections and implications of hydrogen supply HYDROGEN FEASIBILITY STUDY – SUMMARY REPORT 33You can also read