WHAT SELLS IN E-COMMERCE - NEW EVIDENCE FROM ASIAN LDCs - International Trade Centre
←
→
Page content transcription
If your browser does not render page correctly, please read the page content below
WHAT SELLS IN E-COMMERCE
NEW EVIDENCE FROM ASIAN LDCs

                               In partnership with: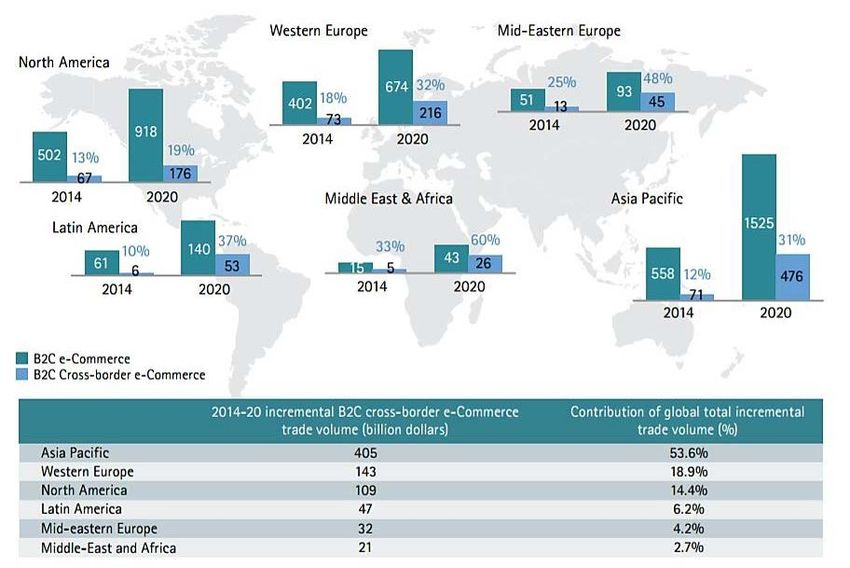
What sells in e-commerce

New evidence from Asian LDCs
WHAT SELLS IN E-COMMERCE: NEW EVIDENCE FROM ASIAN LDCs

About the paper

Cross-border e-commerce can help least developed countries (LDCs) to become more competitive and
diversify their exports – and this is especially true for Asia-Pacific, the most dynamic region in global
e-commerce. To capture that potential, small businesses in these countries need more market intelligence.

This paper fills that gap, using market data from Alibaba.com to identify which products from five Asian LDCs
– Bangladesh, Cambodia, Lao People's Democratic Republic, Myanmar and Nepal – can generate the most
demand abroad.

Publisher: International Trade Centre

Title: What Sells in E-commerce: New Evidence from Asian LDCs

Publication date and place: Geneva, April 2018

Page count: 47

Language: English

ITC Document Number: CEES-18-10.E

Citation: International Trade Centre (2018). What Sells in E-commerce: New Evidence from Asian LDCs. ITC, Geneva.

For more information, contact: Marion Jansen, Jansen@intracen.org.

For more information on ITC publications on e-commerce, see: http://www.intracen.org/itc/sectors/services/e-commerce/.

ITC encourages the reprinting and translation of its publications to achieve wider dissemination. Short extracts of this paper may be
freely reproduced, with due acknowledgement of the source. Permission should be requested for more extensive reproduction or
translation. A copy of the reprinted or translated material should be sent to ITC.

Digital image(s) on the cover: © Shutterstock

© International Trade Centre (ITC)

ITC is the joint agency of the World Trade Organization and the United Nations.

ii
WHAT SELLS IN E-COMMERCE: NEW EVIDENCE FROM ASIAN LDCs

Foreword by ITC

Cross-border e-commerce represents a new pathway for small and medium-sized enterprises (SMEs) to
increase competitiveness in the global market and diversify their export portfolio. Yet this potential is not fully
exploited, particularly for companies from least developed countries (LDCs). Apart from the common
challenges around limited telecommunication infrastructure and access to e-payment and logistics services,
a major challenge for SMEs is the lack of market intelligence to identify demand for their products in the
international market.

This publication is a contribution to addressing that challenge, providing new evidence on cross-country
trade relationships in e-commerce. It draws on actual market data from Alibaba’s international business-to-
business (B2B) e-commerce platform (Alibaba.com) to help companies from five Asian LDCs (Bangladesh,
Cambodia, Lao People’s Democratic Republic, Myanmar and Nepal) identify which products generate
demand from international buyers. This analysis enables SMEs to better target potential markets and clients.

The publication also compares online and offline trade and offers an insight into how,
e-commerce is different from traditional trade. For example, although there are similarities in terms of main
products and markets, e-commerce tends to focus more on consumer products and higher value added
products. In Myanmar’s agricultural exports via e-commerce, for example, beans, nuts and rice replace the
cereals, sugar and vegetables of offline trade as the products of most interest abroad.

E-commerce offers opportunities to diversify exports in terms of both products and markets. Apparel and
clothing accessories account for around 86% of Bangladesh’s total exports, for example, but only 47% of
online demand. Agriculture, food and beverages, and consumer electronic products fill the gap. Similarly,
the United States market accounts for only 1% of Myanmar’s total exports, but 22% of online demand,
suggesting that there is significant unfulfilled trade potential.

In e-commerce, companies also tend to focus on niche products and unique offerings. In textile and leather,
star products for Bangladesh are T-shirts, jeans and hoodies. For Lao People’s Democratic Republic, it is
pillows, cushions, mats and sheets, while for Nepal, it is carpets and rugs that account for a predominant
share of online demand.

Asia-Pacific is a dynamic region in global e-commerce. Strong economic growth coupled with industrial
transformation, rising productivity, improving electricity, telecommunication and transportation infrastructure,
and enhanced trade facilitation provides fertile ground for rapid e-commerce growth in the region, including
in the LDCs under study.

Previous publications and firm-level surveys on e-commerce from the International Trade Centre (ITC) have
highlighted this potential of e-commerce for SMEs. They have also identified the bottlenecks SMEs face in
their online business. Together with ITC’s broader offering on e-strategies and e-entrepreneurship, this new
publication represents a step towards overcoming those bottlenecks and maximizing that potential.

I would like to express our appreciation to AliResearch for their excellent collaboration. Big data analysis is
already widely used by large companies to improve their product development and marketing strategies, but
SMEs often lack resources and access to these transformative tools. In partnership with the private sector,
ITC brings these tools to SMEs and offers market data analysis to boost their competitiveness in the global
e-commerce market.

                                                                                              Arancha González
                                                                                               Executive Director
                                                                                      International Trade Centre

                                                                                                                 iii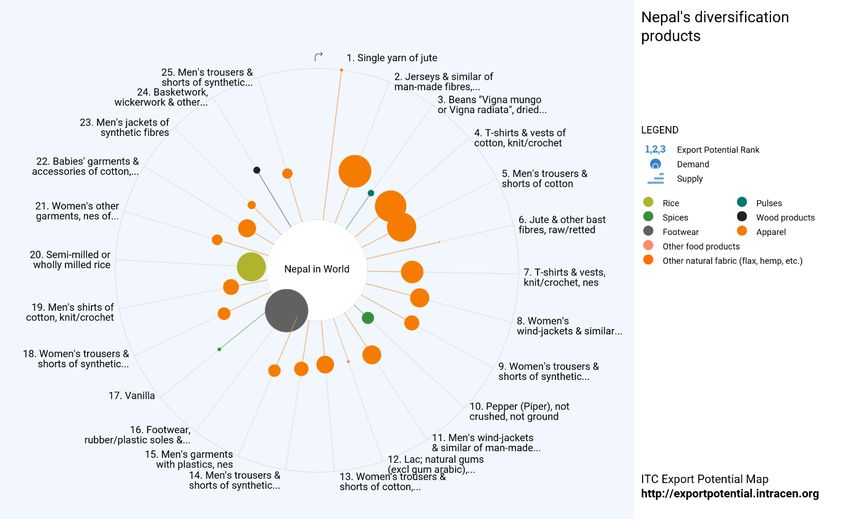
WHAT SELLS IN E-COMMERCE: NEW EVIDENCE FROM ASIAN LDCs

Foreword by AliResearch

Since the turn of the 21st century, international trade has greatly changed in terms of participating entities,
trade patterns, business models and organizational modes due to the rapid worldwide adoption of internet
technology and e-commerce. This has promoted the inclusive development of the global economy and trade.
In particular, the dividends of economic development are more equitably distributed among countries and
communities, which creates more opportunities for small and medium-sized enterprises (SMEs), rural areas,
young people and disadvantaged groups.
E-commerce is inclusive. It empowers SMEs, least developed countries (LDCs) and regions to embrace the
digital economy, access international markets, create new job opportunities, stimulate industrial
transformation and promote the growth of the economy and trade, thus contributing to sustainable and
inclusive development.
Alibaba Group serves SMEs and consumers around the globe and aims to make it easy to do business
anywhere. As one of the new providers of business infrastructure in the digital age –infrastructure that
includes e-commerce platforms, inclusive finance, intelligent logistics, big data, cloud computing and cross-
border e-commerce services – Alibaba Group helps SMEs to buy and sell globally and to identify innovative
growth enablers.
In March 2016, Jack Ma, Executive Chairman of Alibaba Group, proposed the Electronic World Trade
Platform (eWTP) initiative, which aims to take advantage of the digital e-commerce growth trend, boost
SMEs, lower barriers of trade and investment and incubate new trade rules. In September 2016, eWTP was
accepted as a core policy recommendation of the Business 20 (B20) and mentioned in the communiqué
issued by the Group of 20 (G20) leaders at their Hangzhou Summit.
The eWTP initiative has been widely endorsed by the international community. In November 2017, the first
eHub programme under eWTP was launched in Malaysia, which provides e-commerce, logistics, cloud
computing, mobile payment, talent cultivation and other infrastructure services for SMEs. In collaboration
with the World Trade Organization (WTO) and the World Economic Forum (WEF), eWTP is also engaged in
the new ‘Enabling E-commerce’ initiative.
Cross-border e-commerce is building a free, open, universal and inclusive platform for global trade. On this
platform, global connectivity is fulfilled, with hundreds of millions of consumers ‘buying globally’ and SMEs
‘selling globally’. In fact, cross-border e-commerce stands a good chance of becoming the main form of
global trade in the future.
I wish to express my appreciation to the International Trade Centre (ITC) for their dedicated efforts to this
publication. Alibaba has been working with ITC to help SMEs, in particular those from LDCs in Asia, expand
their exports through cross-border e-commerce. We are happy to see that SMEs from Bangladesh,
Cambodia, Lao People’s Democratic Republic, Myanmar and Nepal are actively exploring the global market
on the Alibaba.com platform and gradually improving their e-commerce capabilities.
I hope that this publication can help SMEs and government agencies in the developing and least developed
countries to better understand and leverage cross-border e-commerce, unleash their potential for
international trade and achieve greater development in the process.

                                                                                               Hongbing GAO
                                                                         Vice President of Alibaba Group and
                                                                                      Director of AliResearch

iv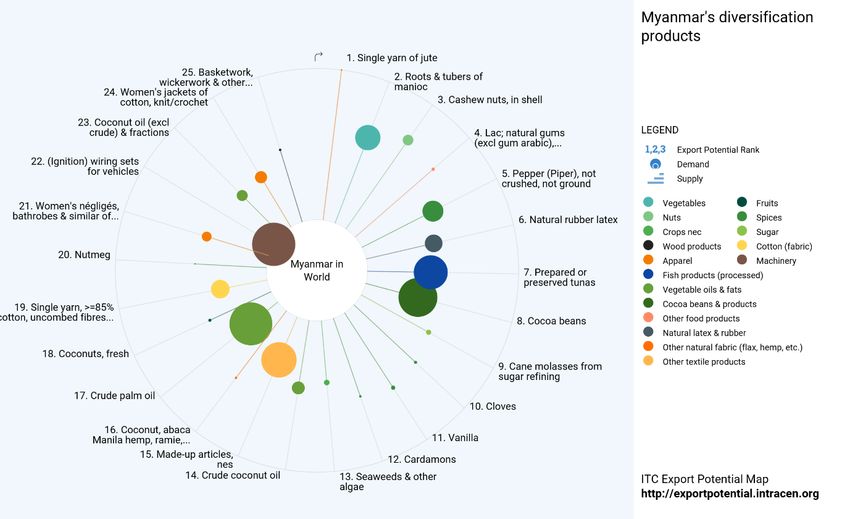
WHAT SELLS IN E-COMMERCE: NEW EVIDENCE FROM ASIAN LDCs

Acknowledgements

This paper was prepared by Quan Zhao, ITC Trade Policy Advisor; Jimena Sotelo, ITC international
consultant; and Yutong Dang, ITC intern, under the supervision of Marion Jansen, ITC Chief Economist.

Thanks are also due to Xue Yan, Deputy Director, Ali Cross-border E-commerce Research Centre; Ouyang
Cheng, Director of Ali Cross-border E-commerce Research Centre and Executive Senior Adviser of
AliResearch; Lv Xiaodong, Data Analyst of AliResearch; and Chen Xin, Senior Adviser of AliResearch for
support with data and analysis. ITC also extends its thanks to AliResearch for providing access to the
proprietary data used for the publication.

In addition, ITC would like to thank Erica Meltzer for editing; Natalie Domeisen, ITC, for peer review; and
Evelyn Seltier, ITC, for production coordination and quality control. Kristina Golubic, Serge Adeagbo and
Franco Iacovino provided graphic and printing support.

                                                                                                          v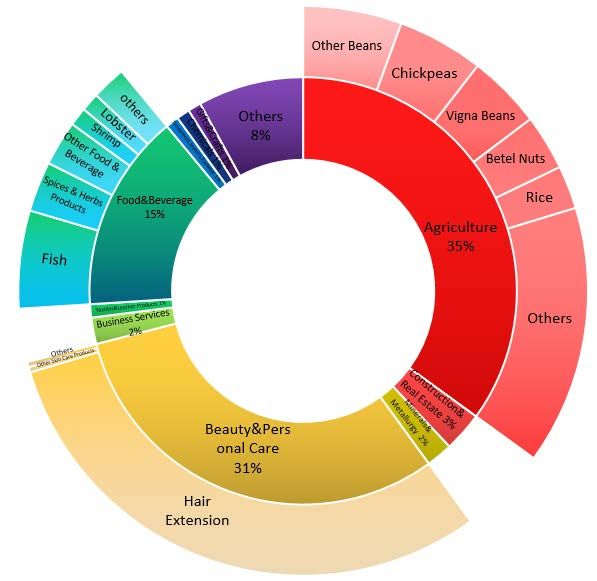
WHAT SELLS IN E-COMMERCE: NEW EVIDENCE FROM ASIAN LDCs

Contents

Foreword by ITC                                             iii
Foreword by AliResearch                                     iv
Acknowledgements                                             v
Acronyms                                                   viii
Executive summary                                           ix

CHAPTER 1 ASIAN LDCS: PREPARING FOR A BOOM IN E-COMMERCE     1

Rapid regional e-commerce growth                             1
Using the power of online market data                        2

CHAPTER 2 OVERVIEW OF TRENDS                                 4

Improving business ecosystems for e-commerce                 4
Increasing SME participation in e-commerce                   7

CHAPTER 3 COUNTRY-SPECIFIC INFORMATION                     10

Bangladesh                                                 11
Cambodia                                                   15
Lao People’s Democratic Republic                           19
Myanmar                                                    23
Nepal                                                      27

CHAPTER 4 MAIN FINDINGS                                    32

Appendices                                                 34
References                                                 35

vi
WHAT SELLS IN E-COMMERCE: NEW EVIDENCE FROM ASIAN LDCs
Tables and Figures
Table 1 ICT infrastructure access indicators (2016) 5
Table 2 Emerging e-payment solutions in Asian LDCs 5
Table 3 Logistics performance indicators 6
Table 4 Annual growth rate of the number of registered sellers 7
Table 5 Total purchase inquires received, annual change rate (2015-2017) 7
Table 6 Comparison of top export markets in online and offline demand 9
Table 7 Top 10 product categories in Bangladesh’s overall exports (2016) and e-commerce (2017) 12
Table 8 Changes in online demand, by product category (2015-2017) 12
Table 9 Top 10 markets in Bangladesh’s overall exports (2016) and e-commerce (2017) 14
Table 10 Top 10 product categories in Cambodia’s overall exports (2016) and e-commerce (2017) 16
Table 11 Changes in online demand, by product category (2015-2017) 17
Table 12 Top 10 markets in Cambodia’s overall exports (2016) and e-commerce (2017) 18
Table 13 Top 10 product categories in Lao People’s Democratic Republic’s overall exports (2016)
and e-commerce (2017) 20
Table 14 Changes in online demand, by product category (2015-2017) 20
Table 15 Top 10 markets in Lao People’s Democratic Republic’s overall exports (2016)
and e-commerce (2017) 22
Table 16 Top 10 product categories in Myanmar’s overall exports (2016) and e-commerce (2017) 24
Table 17 Changes in online demand, by product category (2015-2017) 24
Table 18 Top 10 product categories in Myanmar’s overall exports (2016) and e-commerce (2017) 26
Table 19 Top 10 product categories in Nepal’s overall exports (2016) and e-commerce (2017) 28
Table 20 Changes in online demand, by product category (2015-2017) 29
Table 21 Top 10 markets in Nepal’s overall exports (2016) and e-commerce (2017) 30
Figure 1 Global cross-border B2C e-commerce transaction value ($ billion) 1
Figure 2 Internet users as percentage of population (2005-2016) 4
Figure 3 Number of registered sellers and active buyers on Alibaba.com 8
Figure 4 Trending products in Bangladesh’s e-commerce exports (2017) 11
Figure 5 Product diversification indicator for Bangladesh 13
Figure 6 Market diversification indicator for Bangladesh 14
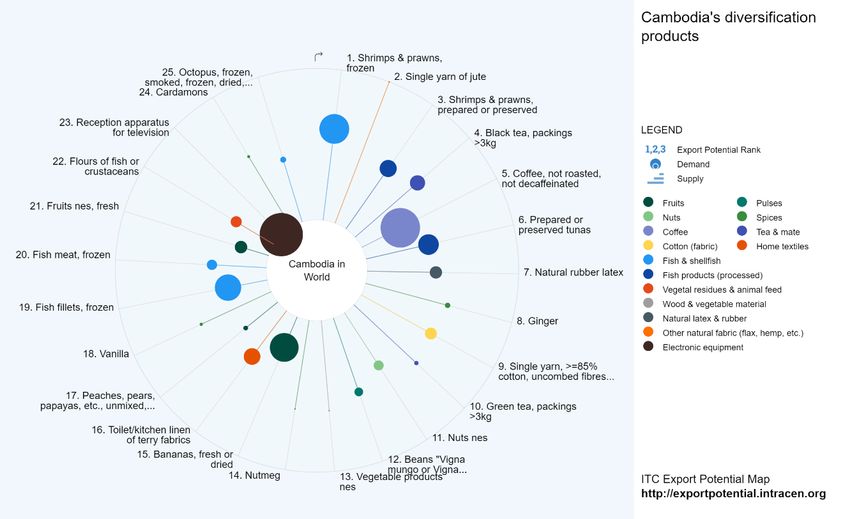
Figure 7 Trending products in Cambodia’s e-commerce exports (2017) 15
Figure 8 Product diversification indicator for Cambodia 17
Figure 9 Market diversification indicator for Cambodia 18
Figure 10 Trending products in Lao People’s Democratic Republic’s e-commerce exports (2017) 19
Figure 11 Product diversification indicator for Lao People’s Democratic Republic 21
Figure 12 Market diversification indicator for Lao People’s Democratic Republic 22
Figure 13 Trending products in Myanmar’s e-commerce exports (2017) 23
Figure 14 Product diversification indicator for Myanmar 25
Figure 15 Market diversification indicator for Myanmar 26
Figure 16 Trending products in Nepal’s e-commerce exports (2017) 27
Figure 17 Product diversification indicator for Nepal 29
Figure 18 Market diversification indicator for Nepal 31
vii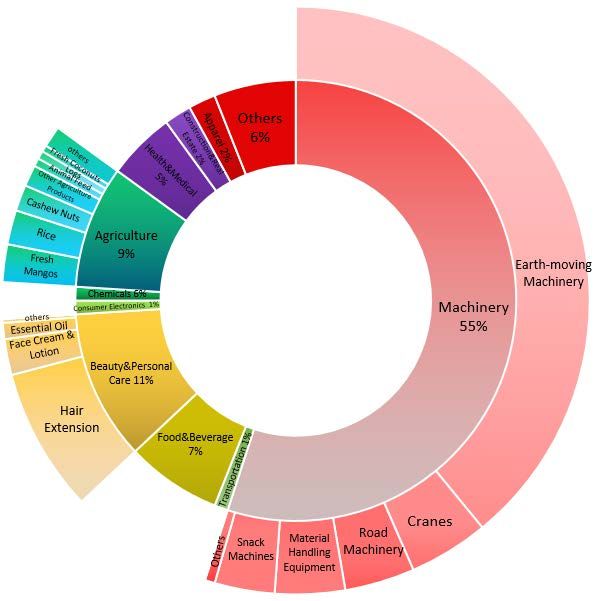
WHAT SELLS IN E-COMMERCE: NEW EVIDENCE FROM ASIAN LDCs

Acronyms

Unless otherwise specified, all references to dollars ($) are to United States dollars, and all references to
tons are to metric tons.

B2B                     Business-to-business
B2C                     Business-to-consumer
E-commerce              Electronic commerce
E-payment               Electronic payment
FDI                     Foreign direct investment
GDP                     Gross domestic product
GNI                     Gross national income
ICT                     Information and communications technology
IMF                     International Monetary Fund
ITC                     International Trade Centre
ITU                     International Telecommunication Union
LDC                     Least developed country
MDI                     Market diversification indicator
PDI                     Product diversification indicator
SME                     Small and medium-sized enterprise
UNCTAD                  United Nations Conference on Trade and Development
WTO                     World Trade Organization

viii
WHAT SELLS IN E-COMMERCE: NEW EVIDENCE FROM ASIAN LDCs

Executive summary

This publication uses market data from Alibaba’s international business-to-business (B2B) e-commerce
platform (Alibaba.com) to examine the cross-border e-commerce exports of five least developed countries
(LDCs) in South and South-East Asia, namely, Bangladesh, Cambodia, Lao People’s Democratic Republic,
Myanmar and Nepal.

Strong economic growth, coupled with industrial transformation, growing productivity, improving electricity,
expanding telecommunication and transportation infrastructure, and enhanced trade facilitation, has led to
rapid e-commerce growth in these countries in recent years. Yet one of the main challenges for their small
and medium-sized enterprises (SMEs) to leverage e-commerce and expand their exports is the lack of
market intelligence that would allow them to identify demand for their products in the international market.
This publication addresses that challenge, providing insights into what products attract demand on online
platforms and how e-commerce is different from traditional trade.

Increasing SME participation in cross-border e-commerce

The number of registered sellers and active buyers from these countries on Alibaba’s B2B platform grew by
over 30% per year in 2015-2017, indicating a rapid expansion and growing interest in e-commerce.
International demand for these countries’ products is also growing, reflected in the increasing number of
purchase inquiries received from international buyers. But the change in demand varies from country to
country, with Bangladesh and Cambodia registering steadier growth than the other three countries.

E-commerce vs. traditional trade

The use of both traditional trade data and Alibaba e-commerce data for this publication makes it possible to
compare online and offline trade. The two have several things in common, including the fact that champion
products in offline trade also attract demand via e-commerce. Apparel and textile products, along with
agricultural products, are the largest export categories in offline trade for the five countries discussed here,
and they also feature prominently in e-commerce. Large markets in offline trade, such as the United States,
China and India, also tend to be the largest markets for e-commerce exports.

Nevertheless, there are key differences between the two types of trade.

First, e-commerce focuses on processed products ready for consumption. By contrast, raw materials and
commodities, such as mineral ores, do not feature prominently in e-commerce even though they are top
exports in offline trade.

Second, product lines in which SMEs predominate, such as gifts and crafts, attract a greater share of total
demand in online trade, while those commercialized by large companies with well-established distribution
and trade channels, such as beverages and spirits, are not big in online trade.

Third, e-commerce provides opportunities to expand and diversify exports, notably into higher value added
segments across and within sectors. Apparel and clothing accessories account for around 86% of
Bangladesh’s total exports, for example, but only 47% of online demand. The gap is filled by agriculture,
food and beverages, and consumer electronic products. Export diversification through e-commerce can also
occur within the same sector. For instance, agriculture is a top traded category for Myanmar in both online
and offline trade, but in online trade, higher value added products, such as beans, nuts and rice, replace
vegetables, sugar and cereals as the main products attracting international demand.

Fourth, e-commerce is more likely to generate demand in new sectors. Beauty and personal care products
feature prominently in Cambodia and Myanmar’s online trade, and is the fastest-growing category for
Bangladesh. Hair extensions, a lightweight and high-value product ideal for e-commerce, are the single
largest export in this category, attracting about a third of all purchase inquiries received by sellers from
Myanmar.

Fifth, each country has its unique offerings in e-commerce. Though there are similarities between the broad
export categories of the five LDCs, the star products in e-commerce vary significantly from country to country.
In textile and leather products, for example, Bangladesh excels in T-shirts, jeans and hoodies. For Lao

                                                                                                              ix
WHAT SELLS IN E-COMMERCE: NEW EVIDENCE FROM ASIAN LDCs
People’s Democratic Republic, the stars are pillows, cushions, mats and sheets, while for Nepal, carpets
and rugs account for over 70% of total demand in this category. This shows that countries focus on their
unique offerings, and may not necessarily compete on the same products in the international market. At the
same time, these products seem to be at different levels of sophistication in different countries, which
suggests varying production capacities for textile goods.
In terms of markets, the United States appears to be the largest source of demand for these countries’
e-commerce exports, followed by China and India. The United States market is particularly noteworthy for
Myanmar, since it accounts for only 1% of the country’s total exports. The number of purchase inquiries,
however, suggests that there is significant interest from United States buyers in products from Myanmar,
and considerable unfulfilled export potential.
Report overview
Chapter 1 outlines e-commerce growth in the region and explains how Alibaba market data has been used.
Chapter 2 gives an overview of e-commerce export trends in the five countries under study. There is an
improving e-commerce business ecosystem in these countries, an increased uptake of e-commerce by
SMEs and increased demand for their products from international buyers.
Chapter 3 provides country-specific information on e-commerce products and markets. This includes
trending products in e-commerce, changes in demand over 2015-2017, and main sources of demand. The
chapter compares the demand in online and offline trade 1 and identifies products and markets with potential
for export growth and diversification through e-commerce.
Chapter 4 highlights the differences between online and offline trade and looks at the e-commerce potential
of each of the five countries.
1
To simplify, offline trade refers to a country’s overall exports, which include trade facilitated by B2B e-commerce.
xWHAT SELLS IN E-COMMERCE: NEW EVIDENCE FROM ASIAN LDCs
CHAPTER 1 ASIAN LDCS: PREPARING FOR A BOOM IN
E-COMMERCE
Cross-border e-commerce is rapidly transforming global trade. As of 2016, 12% of global goods trade
was conducted via cross-border e-commerce, 2 and this rapid transformation is expected to continue in
the coming years.
Rapid regional e-commerce growth
Asia-Pacific is the most dynamic region in cross-border e-commerce, with China and the United States
being the largest global players. Cross-border business-to-consumer (B2C) e-commerce transactions
in Asia-Pacific are expected to grow more than sixfold in six years, from $71 billion in 2014 to $476
billion in 2020. 3
Figure 1 Global cross-border B2C e-commerce transaction values ($ billion)
Source: Accenture & AliResearch
This rapid growth may mean significant export opportunities for the developing countries in the region,
including the five Asian LDCs covered by this report. There is fertile ground in these countries for cross-
border e-commerce exports. Their GDP is growing at around 7% per year, and industrial transformation
is rapidly reshaping their economies.
Some have already gained a solid foothold in the e-commerce market for light manufacturing, with
textile and apparels becoming increasingly competitive in the global market. Others have a competitive
edge in unique offerings, such as agricultural products, gifts and crafts, and natural resources-related
products.
2
Mckinsey (2016).
3
Accenture & AliResearch (2015), Cross-border B2C E-commerce Market Trends.
1WHAT SELLS IN E-COMMERCE: NEW EVIDENCE FROM ASIAN LDCs
Increasing investment in e-commerce-related infrastructure, such as electricity grids,
telecommunication and transportation networks, and improved trade facilitation, is paving the way for
e-commerce growth. The use of mobile devices and broadband Internet is rising rapidly . An expanding
urban middle class and increasingly youth-centred population lay a solid foundation for rapid
e-commerce growth in these countries.
Companies from these five countries are already actively exploring ways to expand their exports
through cross-border e-commerce. The number of registered sellers from these countries on Alibaba’s
B2B e-commerce platform (Alibaba.com) grew by over 30% per year between 2015 and 2017. The
number of interactions with global buyers is also rapidly increasing, indicating growing demand for the
countries’ products.
Nevertheless, SMEs in LDCs still face significant challenges to cross-border e-commerce, including
inadequate infrastructure and support services, limited access to markets and lack of capacity. One of
the greatest challenges is the lack of market intelligence to identify demand for their products in the
international market. SMEs often do not have the resources or the capacity to analyse demand, and
without market intelligence may miss out on business opportunities. Results from an ITC survey of more
than 2,200 enterprises show that acquiring online visibility is another major issue, more important than
insufficient technical skills. 4
Using the power of online market data
This publication, in partnership with AliResearch, for the first time uses actual market data from
Alibaba.com to examine demand for cross-border e-commerce exports from these five countries,
helping to fill the gap for market intelligence.
With over 50 million registered buyers globally, Alibaba.com is the world’s largest online business-to-
business (B2B) marketplace and plays a key role in helping SMEs to trade globally through e-
commerce. Data from Alibaba’s platform provide useful insights into demand for different types of
products and from different markets, which can guide companies to better target their potential clients
and to expand their business operations more strategically.
The main objective of this publication is to identify which products from the five LDCs under study have
existing and/or potential demand from international buyers via cross-border e-commerce.
For each of the countries, the data extracted from Alibaba.com include:
• Number of registered sellers. This indicates the level of participation of local businesses in
selling through e-commerce.
• Number of active buyers. 5 This indicates the level of participation of local businesses in
purchasing through e-commerce.
• Number of purchase inquiries. A purchase inquiry consists of a buyer’s request for information
from a seller through Alibaba.com. This request can include inquiries about products, requests
for price quotes, communication through the platform’s instant messaging app “TradeManager”,
and actually placing an order for purchase.
The key data category here is the number of purchase inquiries. It serves as a reliable proxy for demand
and interest from international buyers 6 for a particular product that could potentially lead to purchases.
The greater the number of purchase inquiries about a product, the greater the demand/interest for that
particular product is likely to be.
4
International Trade Centre (2017). New Pathways to E-commerce: A Global SME Competitiveness Survey. Geneva, ITC.
5
This refers to the buyers from the countries under study who have made at least one purchase-related activity, including
purchase inquiries, during the period concerned.
6
Alibaba.com is mainly a platform for cross-border B2B e-commerce. Inquiries from domestic buyers normally account for a
negligible share of the total, except in the case of Bangladesh, where purchase inquiries from domestic buyers represent 4% of
the total.
2WHAT SELLS IN E-COMMERCE: NEW EVIDENCE FROM ASIAN LDCs
The reason for using purchase inquiries rather than actual transaction data is that as a B2B platform,
Alibaba.com mainly serves to match supply and demand, and actual transactions are predominantly
done offline through direct contact between sellers and buyers. Because they do not reflect interest in
a product, actual transaction data, even if they were available, would not provide a full picture of the
country’s e-commerce.
For each country, purchase inquiries are examined by product categories and by the countries in which
the products originate. The data are then used to identify demand for a particular group of products as
well as demand from a specific country.
Although the publication provides useful information based on actual market data, there are certain
limitations.
First, e-commerce data are limited to one platform and thus do not capture the entire global demand
through e-commerce. This is particularly noticeable in the study of markets. In countries where buyers
use other platforms for B2B purchases, the demand is not captured and thus not reflected in the results.
Germany, for instance, is the second largest importer of products from Bangladesh, yet is not in the top
ranking of Bangladesh’s e-commerce markets through Alibaba.com. Comparing online demand with
the countries’ overall exports shows that Alibaba’s platform is most frequently used by buyers from the
United States, China and Asia in general, and to a lesser extent from Europe, except for the United
Kingdom.
Second, more disaggregated data are required for in-depth analysis. The available data provide only
aggregate numbers of purchase inquiries for products and markets, and thus it is not possible to look
at the demand for a particular product from a particular market. Such detailed examination would be
particularly useful for SMEs to pinpoint specific demands for their products or even to trace demand at
the company level.
Third, product categories on Alibaba.com do not correspond strictly to the Harmonized System (HS)
classifications. For e-commerce sites, products are classified from a consumer end-use perspective,
and thus include such categories as “Gifts” and “Gardening”. At a broader level, main categories – such
as textiles, agriculture and machineries – do have a closer match with the HS codes. Nevertheless,
comparing online and offline demand can provide only an estimate, and not an accurate assessment.
A list of product categories on Alibaba.com is attached in Annex I.
Despite these limitations, the publication offers insights into e-commerce opportunities for SMEs in the
Asian LDCs and represents the first attempt to use actual market data from a leading global e-
commerce site to help SMEs from LDCs identify demand for their products.
3WHAT SELLS IN E-COMMERCE: NEW EVIDENCE FROM ASIAN LDCs
CHAPTER 2 OVERVIEW OF TRENDS
This chapter summarizes the key e-commerce trends in the five LDCs under study and puts them into
the context of the business environment for e-commerce within individual countries.
Improving business ecosystems for e-commerce
Rapid improvements in internet access
Affordable and reliable Internet access is one of the preconditions for the growth of online business. It
is particularly important for firms that conduct only online trade. ITC’s e-commerce survey, referred to
earlier, finds that 80% of respondents were SMEs engaging in international trade solely through cross-
border e-commerce, with no operations in offline trade. 7
The five LDCs discussed in this publication have all seen rapid improvements in Internet access in
recent years. In 2016, their Internet penetration was above the LDC average (17.5 Internet users per
100 inhabitants). 8 Myanmar and Cambodia stand out as particularly well-connected nations, with
Internet reaching over 25% of the total population (Figure 2).
Figure 2 Internet users as percentage of population (2005-2016)
30
25
20
15
10
5
0
2005 2006 2007 2008 2009 2010 2011 2012 2013 2014 2015 2016
Bangladesh Nepal Cambodia Myanmar Lao PDR
Source: International Telecommunication Union (ITU).
Mobile broadband is of growing importance, particularly with 4G and the incoming 5G technology. For
all five countries, 2G and 3G coverage is almost ubiquitous, surpassing the LDC average, with the
exception of Lao People’s Democratic Republic, where 30% of the population remains outside of the
3G signal range. 4G mobile network development is uneven: over half of the population is covered in
Bangladesh and Cambodia, but in Lao People’s Democratic Republic and Myanmar such networks are
only just emerging (Table 1).
Improving Internet access is accompanied by the increasing affordability of mobile data. Mobile
broadband in Bangladesh, Cambodia, Lao People’s Democratic Republic and Myanmar appears to be
relatively affordable, with a price below the LDC average (see Table 1). The price for mobile data in
Nepal is considerably higher than in the other four countries, however, at $5.80 for 500MB of mobile
broadband, representing 9.5% of gross national income (GNI) per capita.
7
ITC (2017). New Pathways to E-commerce: A Global SME Competitiveness Survey.
8
ITU. World Telecommunication/ICT Development Report and database.
4WHAT SELLS IN E-COMMERCE: NEW EVIDENCE FROM ASIAN LDCs
Table 1 ICT infrastructure access indicators (2016)
Percentage of the population Subscriptions per 100 inhabitants Price of 500 MB of
covered by mobile data
2G 3G 4G LTE/ Mobile Active Fixed Price Price as a
Country mobile mobile WiMAX phones mobile broadband ( $) percentage
network network mobile broadband of GNI per
network capita
Bangladesh 99 90 65 77.88 17.79 3.77 2.3 2.3
Cambodia 99 80 50 124.94 50.19 0.61 1.0 1.1
Lao 98 71 7 55.39 34.66 0.34 2.5 1.7
People’s
Democratic
Republic
Myanmar 100 96 9 89.26 47.63 0.06 2.4 2.5
Nepal 92 90 0 111.70 30.78 0.78 5.8 9.5
LDCs 88 61 9 16 67.7 19.1 0.9 8.3 12.0
Note: Figures for LDCs are ITC calculations based on ITU data.
Source: ITU. 10
Emerging e-payment solutions
Electronic payment (e-payment) capability is essential for e-commerce transactions. Policy and
regulatory changes in recent years have spurred the emergence of e-payment providers in the five
LDCs, both domestic and foreign (Table 2). Bangladesh Bank first approved online payments in 2009
and, in 2013, the use of debit and credit cards for online payments. 11 Cambodia introduced its online
banking system in 2016, and Lao People’s Democratic Republic is developing its own such system with
international cooperation. These e-payment solutions have provided impetus for e-commerce growth.
Table 2 Emerging e-payment solutions in Asian LDCs
Payment
Country Description
Solution
Sslcommerz The first payment gateway in Bangladesh.
Bangladesh Others EasyPayWay, PortWallet, aamarPay, shurjoPay, and Payza
Wing The most widely adopted payment app in Cambodia. 12 A popular
phone-to-phone payment service.
Cambodia Others True Money, E-Money, Lybour Pay-pro Smart buy Paygo Sea.
Lao People’s OnePay Launched by Banque Pour Le Commerce Extérieur Lao (BCEL). It
Democratic allows customers to transfer through bank accounts by means of a QR
Republic code.
2C2P Provides e-commerce payment service in partnership with Myanmar
Payment Union (MPU), the national payment network. There are
already some 900,000 MPU cards in Myanmar.
Myanmar MyPay Ltd A Myanmar mobile payment firm which acquired Singapore’s
Fastacash in March 2017 and is developing social and mobile
payment.
eSewa Offers a mobile wallet that can be linked to accounts in a wide range
of banks and that supports both face-to-face and online payments.
IME Pay Can be linked to accounts in a range of banks and supports both face-
to-face (offline) and remote (online, e-commerce) payments
Nepal RuPaiya brand Launched by Prabhu Bank. Includes a prepaid card, which is intended
for bill payments, domestic e-commerce and general retail purchases.
Others PayPal, iPay, SCT, MoCo, net banking from Nepal Investment Bank
Limited.
Source: UNCTAD, export.gov, BCEL, Myanmar Business Today.
9
ITU. ICTs, LDCs and the SDGs: Achieving universal and affordable Internet in the least developed countries, 2018, p.91.
10
ITU(2018). ICTs, LDCs and the SDGs: Achieving universal and affordable Internet in the least developed countries [this title is
different from what is listed in the references]
11
www.export.gov (2017), Bangladesh-Ecommerce.
12
UNCTAD (2017). Cambodia Rapid eTrade Readiness Assessment.
5WHAT SELLS IN E-COMMERCE: NEW EVIDENCE FROM ASIAN LDCs
E-commerce logistics remains a major challenge
Access and cost of logistics services are key determinants of the competitiveness of e-commerce firms.
According to the findings of the ITC survey based on 2,200 responses, the share of logistic costs in the
final price in cross-border e-commerce transactions could be almost twice as high for firms in developing
countries (26%, as opposed to 14% for firms in developed countries). 13
Table 3 summarizes access to and quality of logistics infrastructure and services, especially in e-
commerce-relevant areas, such as ease tracking and tracing ability, timeliness of shipment to
destination and post-service efficiency. 14
According to the World Economic Forum, the five countries discussed here remain at the lower end of
the competitive spectrum in the global ranking of logistics performance. 15 Bangladesh and Cambodia
perform better in terms of the overall availability and quality of transport infrastructure and services
within the group. The rankings for Lao People’s Democratic Republic are a matter of concern, since
most of the country’s indicators declined between 2014 and 2016.
Table 3 Logistics performance indicators
Bangladesh Nepal Lao Cambodia Myanmar
People’s
Democratic
Republic
Availability and quality of
2.7 2.1 ▼ 2.4 ▼ 2.6 2.33 ▲
transport infrastructure 1-7 (best)
Availability and quality of
3.5 ▼ 3.2 3.2 ▼ 3.7 ▲ -
transport services 1-7 (best)
Ease and affordability of shipment 1-5
2.7 2.5 ▲ 2.2 ▼ 2.6 2.23
(best)
Logistics competence 1-5 (best) 2.7 ▲ 2.1 2.1 ▼ 2.7 2.36 ▲
Tracking and tracing ability 1-5 (best) 2.6 ▼ 2.5 ▲ 1.8 3.3 ▲ 2.57 ▲
Timeliness of shipment to destination 1-
2.9 ▼ 2.9 ▲ 2.7 ▲ 3.2 ▼ 2.85 ▼
5 (best)
Post-service efficiency 1-7 (best) 3.4 3.4 4.5 ▼ 3.5 -
Note: Upward and downward arrows denote the change in value during 2014-2016.
Source: World Economic Forum Global Enabling Trade Index and World Bank Logistics Performance Index for Myanmar.
13
International Trade Centre (2017). New Pathways to E-commerce: A Global SME Competitiveness Survey. Geneva.
14
Transport infrastructure measures availability and quality in the four main modes of transport (road, air, railroad and seaport).
Logistics services assess the availability and quality of transport services, considering competition of shipping and logistics
companies in the country. World Economic Forum, The Global Enabling Index.
15
World Economic Forum ranking in transport infrastructure and out of 136 countries is as follows: Bangladesh, 109; Cambodia,
113; Lao People’s Democratic Republic, 125; and Nepal, 135. When it comes to the transportation service ranking, the positions
are: Cambodia, 87; Bangladesh, 100; Nepal, 119; and Lao People’s Democratic Republic, 121. As for Myanmar, it ranks 113 of
the 160 countries in the World Bank Logistics Performance Index.
6WHAT SELLS IN E-COMMERCE: NEW EVIDENCE FROM ASIAN LDCs
Increasing SME participation in e-commerce
Within this context, the number of registered sellers from these countries on the Alibaba platform has
been growing steadily, at over 30% per year in 2015-2017 (Table 4). This indicates that companies are
actively exploring e-commerce opportunities.
The highest two-year average growth rate is registered in Myanmar (54.3%), and the lowest in
Bangladesh (29.1%). But this does not necessarily mean that e-commerce is growing more slowly in
the latter. On the contrary, considering the cumulative number of registered sellers, it may suggest that
growth in Bangladesh has already passed beyond the rapid expansion period, whereas Myanmar is
just entering that period.
In 2017, with over 145,000 registered sellers (cumulative) on Alibaba.com, Bangladesh stands out as
the largest player among the five countries. This corresponds to the size of the economy and the volume
of the country’s overall exports.
On average, the gross domestic product (GDP) of these five countries grew at around 7% in 2016. The
number of online sellers on Alibaba.com is increasing considerably faster than the countries’ respective
GDP growth: more than four times in Bangladesh; more than five times in Cambodia, Lao People’s
Democratic Republic and Nepal; and more than seven times in Nepal. This rapid growth is fuelled by
strong economic growth, improving telecommunication and transportation infrastructure, a youth-
centred population and increasing investment in e-commerce-related activities.
Table 4 Annual growth rate of the number of registered sellers
Growth rate Growth rate Average growth 16 Number of online GDP growth rate
2015-2016 2016-2017 2015-2017 sellers 2017 2016-2017 17
Bangladesh 28.2% 30.0% 29.1% 145,629 7.1%
Cambodia 49.5% 40.6% 45.0% 26,998 6.8%
Lao People’s 37.5% 36.8% 37.1% 4,705 6.9%
Democratic
Republic
Myanmar 63.1% 45.5% 54.1% 25,614 7.6%
Nepal 29.3% 37.6% 33.4% 30,483 5.0%
Average 33.5% 33.8% 33.7%
Source: ITC, using data from Alibaba.com and GDP figures from the International Monetary Fund (IMF).
As mentioned earlier, the total number of purchase inquiries received by sellers can be regarded as a
proxy for overall demand for a country’s products. Comparing year-on-year changes in the total demand,
it could also serve as an indicator for estimating overall e-commerce performance.
This important indicator, however, varies from country to country (Table 5). Purchase inquiries for
products from Bangladesh rose by 25% in 2016 and 6% in 2017. Strong growth is also seen for products
from Cambodia, which received 10% more purchase inquiries in 2016 and an additional 41% more
registered sellers in 2017.
Table 5 Total purchase inquires received, annual percentage change rate (2015-2017)
2015-2016 2016-2017
Bangladesh ▲ 25% ▲ 6%
Cambodia ▲ 10% ▲ 41%
Lao People’s Democratic Republic ▼ 47% ▼ 9%
Myanmar ▲ 33% ▼ 45%
Nepal ▲ 14% ▼ 12%
Source: ITC, using data from Alibaba.com.
16
Compound Annual Growth Rate (CAGR)= ( Ending Value / Beginning Value)1 / 2 – 1.
17
Source: IMF (October 2017), World Economic Outlook, Real GDP Growth.
7WHAT SELLS IN E-COMMERCE: NEW EVIDENCE FROM ASIAN LDCs
For Myanmar and Nepal, growth was strong in 2016 (33% and 14% respectively), but this was followed
by a similarly large drop in 2017 (45% and 12% respectively). Purchase inquiries received by sellers
from Lao People’s Democratic Republic declined by 47% and 9% respectively in 2016 and 2017.
The reasons for these variations in each country’s performance across the years are hard to identify.
They could be related to the types of products that the countries trade and the markets that they target.
They could also be related to how buyers in different destination markets actually use the platform.
Purchase inquiries received per company may also vary significantly, though specific data on that are
not available. One could assume that, as in many other platforms, a small share of sellers, particularly
paying members, actively use the platform and receive the bulk of purchase inquiries, while the rest are
rather using it as a “yellow page” in which they simply list the company’s information and offers.
Figure 3 Number of registered sellers and active buyers on Alibaba.com
Bangladesh Cambodia
26998
22817
19201
145629
112007 12840 13047
87347 82668
7954
57381
33563
2015 2016 2017 2015 2016 2017
Lao People’s Democratic Republic Myanmar
4705
25614
3440
3206
17607 16711
2502
2064 11752
1553 10792
6312
2015 2016 2017 2015 2016 2017
Nepal
30483
22153 22109
17134
12644
7629
2015 2016 2017
Source: ITC, using data from Alibaba.com.
8WHAT SELLS IN E-COMMERCE: NEW EVIDENCE FROM ASIAN LDCs
In terms of the sources of demand, the United States, China and India are the three largest markets in
which e-commerce purchase inquiries originate. This is to a certain extent consistent with the countries’
overall trade pattern: the United States is the largest export market for Bangladesh and Cambodia;
China is the largest export market for Lao People’s Democratic Republic and Myanmar; and India is the
largest export market for Nepal. Table 5 compares the largest destination markets in online and offline
trade.
However, apart from these three largest markets, there seems to be limited overlap in the rest of the
list. New destination markets, such as Pakistan, Austria, Egypt, Poland, Russian Federation and Saudi
Arabia, appear in the list of top markets for e-commerce export. This does not necessarily mean that e-
commerce is helping SMEs to diversify into new markets, since international demand coming through
the platform rather depends on the use of the platform by buyers in the destination markets and on the
types of products being traded. Europe, for instance, a major market for Asian exports, is sometimes
missing from online demand.
The United States market is particularly noteworthy for Myanmar. The United States accounts for only
1% of Myanmar’s total exports but a sizeable proportion of purchase inquiries. This suggests there is
significant interest from United States buyers in products from Myanmar and significant unfulfilled export
potential.
Table 6 Comparison of top export markets in online and offline demand
Bangladesh Cambodia Lao People’s Democratic Myanmar Nepal
Republic
Overall E-commerce Overall E- Overall E- Overall E-commerce Overall E-
commerce commerce commerce
United United United United China United China United India United
States States States States States States States
Germany China United India Thailand China Thailand India United China
Kingdom States
United Bangladesh Germany China Viet Nam India India Bangladesh Germany India
Kingdom
France India Japan Canada India Thailand Singapore China Turkey Australia
Spain United Canada United Japan Hong Japan Viet Nam United Canada
Kingdom Kingdom Kong SAR Kingdom
Italy Canada China Egypt Germany Korea, Korea, Pakistan China United
Rep. of Rep. of Kingdom
Canada Pakistan Thailand Pakistan United Arab Canada Hong Canada France Nepal
Emirates Kong SAR
Japan Austria Spain Australia Swaziland Poland Germany Thailand Japan Germany
Belgium Malaysia Belgium Saudi United Malaysia United United Canada France
Arabia Kingdom States Kingdom
Netherlands Russian France Russian Switzerland Australia Malaysia Nigeria Italy Russian
Fed. Fed. Fed.
Note: Top 10 e-commerce destination markets are compiled based on the number of inquiries received from international buyers.
Source: ITC Trade Map and Alibaba.com.
9WHAT SELLS IN E-COMMERCE: NEW EVIDENCE FROM ASIAN LDCs
CHAPTER 3 COUNTRY-SPECIFIC INFORMATION
This chapter features country-specific analysis of the products and markets for each of the five
countries’ B2B e-commerce. Discussion of each country is divided into three sections:
1. Trending products in e-commerce
The trending products in e-commerce are the ones which received the greatest number of purchase
inquiries, which serves as a proxy for demand and interest from buyers. This provides an indication of
which products from the countries may attract interest from international buyers.
This section also compares the most demanded products in e-commerce with the country’s overall
exports to provide insights into whether, and if so how, products traded through e-commerce are
different from those traded offline.
2. Products for export growth and diversification
This section traces changes in online demand for different products over the period 2015-2017 and
examines products which products saw an increased or decreased demand from international buyers.
This change may indicate potential future demand. The section also draws on ITC’s product
diversification indicator (PDI) 18, which analyses a country’s best options for product diversification for
export, based on its existing trade pattern and comparative advantages.
3. Markets for export growth and diversification
This section ranks the countries/economies in which purchase inquiries originate in order to identify
where existing and potential buyers are located. It also compares the top 10 sources of e-commerce
demand with the top 10 markets for the country’s overall exports, offering insights into which markets
may have e-commerce potential. The section further draws on ITC’s market diversification indicator
(MDI), which analyses a country’s best options for market diversification for export, based on its existing
trade pattern and comparative advantages.
18
More information on ITC’s Export Potential Map is available at http://exportpotential.intracen.org.
10WHAT SELLS IN E-COMMERCE: NEW EVIDENCE FROM ASIAN LDCs
Bangladesh
Trending products in e-commerce
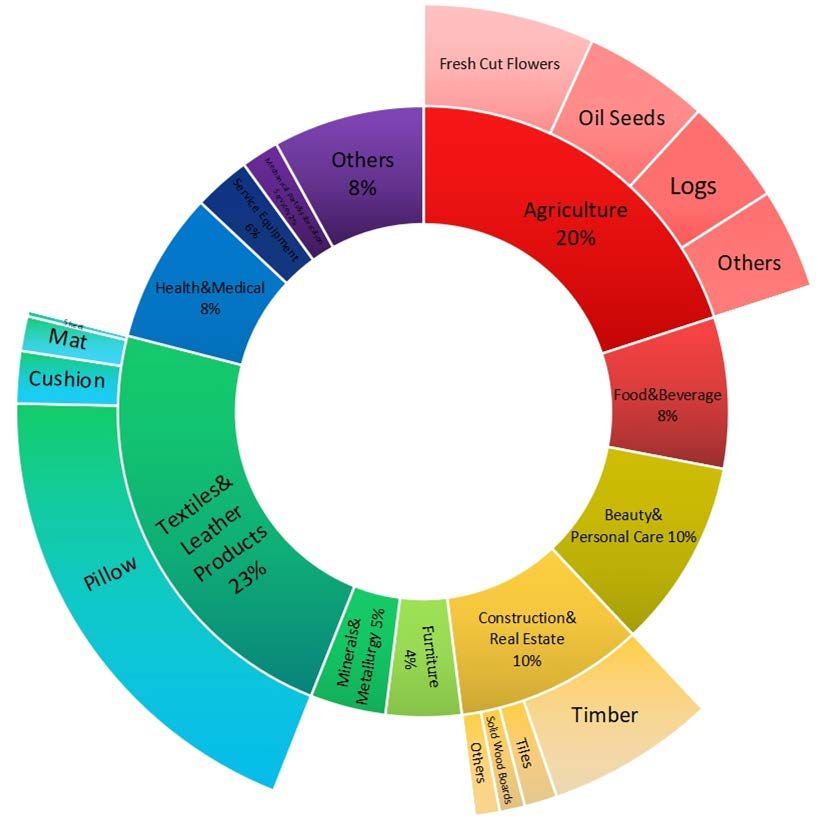
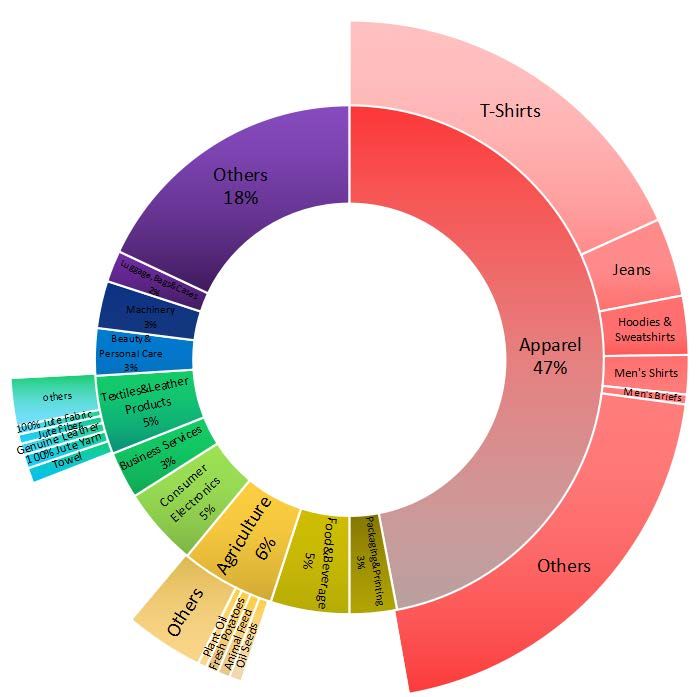
According to data from Alibaba.com, the product categories that received the largest number of online
purchase inquiries (a proxy for international demand, as mentioned earlier) in Bangladesh include
apparel (47% of all purchase inquiries), agriculture (6%), food and beverages (5%), consumer
electronics (5%), business services 19 (3%), packaging and printing 20 (3%), beauty and personal care
(3%), machineries (3%), and luggage, bags and cases (2%). These top 10 categories account for 82%
of all purchase inquiries.
To get a closer look at the demand for specific products within each category, the table in Figure 4
provides a breakdown of the three categories that attract the most demand in e-commerce. In apparel,
T-shirts (39%), jeans (8%), hoodies and sweatshirts (6%), men’s shirts (4%) and men’s underwear (1%)
received the most purchase inquiries. In agriculture, star products include oil seeds (10%), animal feed
(10%), fresh potatoes (10%) and plant oil (7%). In textile and leather products, towels (15%), jute yarn
(13%), genuine leather (11%), jute fibre (9%) and jute fabric (8%) stand out.
Figure 4 Trending products in Bangladesh’s e-commerce exports (2017)
Product Share
Apparel
T-shirts 39%
Jeans 8%
Hoodies & 6%
sweatshirts
Men's shirts 4%
Men's underwear 1%
Others 43%
Agriculture
Oil seeds 10%
Animal feed 10%
Fresh potatoes 10%
Plant oil 7%
Others 63%
Textiles & leather
Towels 15%
100% jute yarn 13%
Genuine leather 11%
Jute fibre 9%
100% jute fabric 8%
Others 46%
Source: ITC, using data from Alibaba.com.
Comparing the most demanded products in e-commerce with the country’s overall exports (Table 7)
provides insights into whether, and if so how, products traded through e-commerce are different from
19
Business services include exhibition services, processing services, consulting, logistics services, designing services, agency
services and supply chain management.
20
Packaging and printing include both goods and services. Goods include such products as carton, cardboard, pill cases,
aluminium foil and packaging labels. Services mainly include printing and packaging services.
11WHAT SELLS IN E-COMMERCE: NEW EVIDENCE FROM ASIAN LDCs
those traded offline. Apparel and clothing accessories account for around 86% of Bangladesh’s exports.
In fact, seven of the country’s top 10 export products are related to apparel and clothing, including
footwear, yarn, rags and raw materials.
When it comes to e-commerce, apparel remains a top category, but accounts for a much smaller share.
Only 47% of all purchase inquiries received by sellers from Bangladesh are related to apparel. Other
products, including agriculture (6%), food and beverages (5%), and consumer electronics (5%), also
receive a significant number of inquiries.
Table 7 Top 10 product categories in Bangladesh’s overall exports (2016) and e-commerce (2017)
Rank Overall exports E-commerce
Product Share Product Share
1 Apparel, not knitted or crocheted 43% Apparel 47%
2 Apparel, knitted or crocheted 43% Agriculture 6%
3 Other made-up textile articles 3% Textiles and leather products 5%
4 Footwear, gaiters and the like 2% Food and beverages 5%
5 Other vegetable textile fibres 2% Consumer electronics 5%
6 Fish and crustaceans, molluscs 2% Business services 3%
7 Headgear and parts thereof 1% Packaging and printing 3%
8 Leather; saddlery and harness 1% Beauty and personal care 3%
9 Raw hides and skins (other than foreskins) 1% Machinery 3%
10 Vehicles (other than railway)WHAT SELLS IN E-COMMERCE: NEW EVIDENCE FROM ASIAN LDCs
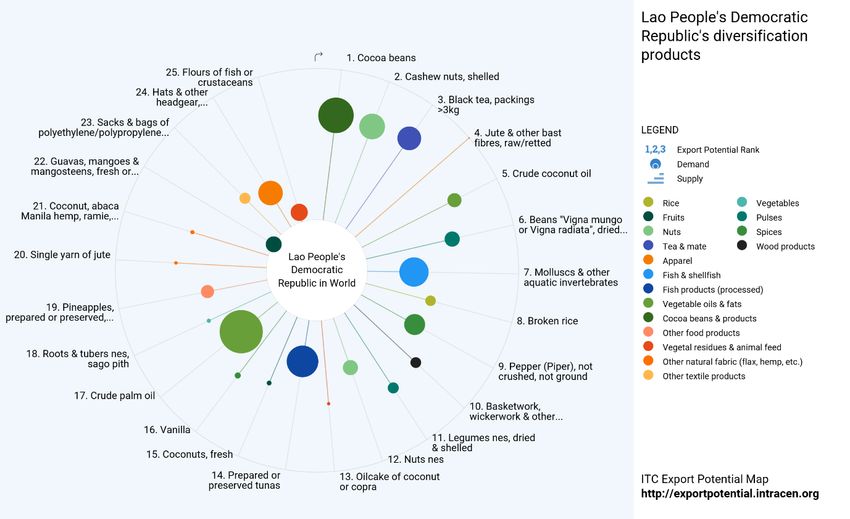
Figure 5 Product diversification indicator for Bangladesh
Source: ITC Export Potential Map.
Markets for export growth and diversification
In 2017, 59% of all purchase inquiries to registered sellers from Bangladesh on Alibaba.com came from
the following 10 countries: United States, China, Bangladesh, India, United Kingdom, Canada,
Pakistan, Austria, Malaysia and Russian Federation. The United States takes the largest share of 14%,
followed by China (12%) and India (10%). Inquiries from domestic buyers in Bangladesh account for
4% of inquiries.
Table 9 compares the top 10 destination markets in Bangladesh’s overall exports and online purchase
inquiries. The United States is the largest market in both cases, with a 16% share of overall exports and
14% of all purchase inquiries. However, there is a significant difference in the rest of the list. In overall
exports, Germany is the second largest market (14%), followed by the United Kingdom (9%) and France
(7%). In fact, geographically, seven of the top 10 are European countries.
In e-commerce, however, with the exception of the United Kingdom and Russian Federation, the top
European markets are missing from the list. This might be due to the market orientation of the e-
commerce platform and to differences in the types of products traded online and offline – apparel and
clothing, for instance, have a lower share in online demand than in offline trade, where they are a major
product traded between Bangladesh and Europe.
13WHAT SELLS IN E-COMMERCE: NEW EVIDENCE FROM ASIAN LDCs
Table 9 Top 10 markets in Bangladesh’s overall exports (2016) and e-commerce (2017)
Overall exports E-commerce
Rank Market Share in exports Market Share in inquiries
1 United States 16% United States 14%
2 Germany 14% China 12%
3 United Kingdom 9% Bangladesh 10%
4 France 7% India 9%
5 Spain 7% United Kingdom 3%
6 Italy 4% Canada 3%
7 Canada 3% Pakistan 2%
7 Japan 3% Austria 2%
8 Belgium 3% Malaysia 2%
10 Netherlands 3% Russian Federation 2%
Sum Top 10 markets 69% Top 10 markets 59%
Source: ITC Trade Map and Alibaba.com.
ITC’s Export Potential Map also offers insights into market diversification. The markets with the greatest
potential for Bangladesh’s exports are the United States, Germany and the United Kingdom. The United
States shows the largest absolute difference between potential and actual exports in value terms,
leaving room to realize additional exports worth $2.3 billion.
Figure 6 Market diversification indicator for Bangladesh
Source: ITC Export Potential Map.
14WHAT SELLS IN E-COMMERCE: NEW EVIDENCE FROM ASIAN LDCs
Cambodia
Trending products in e-commerce
According to data from Alibaba.com, the product categories that received the largest number of online
purchase inquiries in Cambodia include machinery (55% of all purchase inquiries), beauty and personal
care (11%), agriculture (9%), food and beverages (7%), health and medical (5%), construction and real
estate 21 (2%), consumer electronics (1%), chemicals (1%) and transportation 22 (1%). These top 10
categories account for 94% of all purchase inquiries.
To get a closer look at the demand for specific products within each category, the table in Figure 7
provides a breakdown of the three categories that attract the most demand in e-commerce. In
machineries, earth-moving machinery (71%), cranes (9%), road machinery (7%), material handling
equipment (7%) and snack machines (6%) received the largest number of purchase inquiries. In beauty
and personal care, star products include hair extensions (72%), face creams and lotions (18%) and
essential oils (8%). In agricultural products, fresh mangos(23%), rice (21%), cashew nuts (16%), animal
feed (5%), logs (4%) and fresh coconuts (3%) stand out.
Figure 7 Trending products in Cambodia’s e-commerce exports (2017)
Product Share
Machinery
Earth-moving 71%
machinery
Cranes 9%
Road machinery 7%
Material handling 7%
equipment
Snack machines 6%
OthersWHAT SELLS IN E-COMMERCE: NEW EVIDENCE FROM ASIAN LDCs
Comparing the most demanded products in e-commerce with the country’s overall exports (Table 10)
provides insights into whether, and if so how, products traded through e-commerce are different from
those traded offline. In Cambodia’s overall exports, apparel and related products (including footwear
and clothing accessories) account for over 70% of the volume.
When it comes to e-commerce, the product at the top of the list is, interestingly, machineries, which
accounts for more than half of the international inquiries addressed to Cambodian e-commerce firms.
Further examination reveals that there are indeed several companies active in this field. They offer a
range of machinery products, mostly used and second-hand earth-moving machinery and cranes.
There are two paying membership companies in this sector that actively use the platform. Both are
SMEs with annual revenue of $2 million to $5 million; they mainly target the Middle Eastern and North
and South American markets.
The second largest category in e-commerce exports is beauty and personal care, with an 11% share
of all purchase inquiries received. As in the case of Myanmar, hair extensions dominate, garnering 72%
of all inquiries in this category. Hair extensions are a trending and relatively recent product in global e-
commerce, today accounting for $985 million in global imports. 23They are typical of the high-value, low-
weight products that are ideal for cross-border e-commerce.
Agriculture accounts for 9% of all purchase inquiries. In e-commerce, the demand is primarily for fresh
mangos, rice and cashew nuts, whereas in Cambodia’s overall exports, only cereals appear as a major
agricultural product in the top 10 exports, accounting for 3% of all exports. This indicates that e-
commerce provides opportunities to diversify exports within a traditional sector like agriculture into
higher value added segments.
Table 10 Top 10 product categories in Cambodia’s overall exports (2016) and e-commerce (2017)
Rank Overall exports E-commerce
Product Share Product Share
1 Apparel, knitted or crocheted 61% Machinery 55%
2 Footwear, gaiters and the like 8% Beauty and personal care 11%
3 Apparel and clothing accessories 5% Agriculture 9%
4 Electrical machinery and parts thereof 4% Food and beverage 7%
5 Vehicles (other than railway) 4% Health and medical 5%
6 Cereals 3% Construction and real estate 2%
7 Pearls and stones 2% Apparel 2%
8 Fur skins and artificial fur 2% Consumer electronics 1%
9 Rubber and articles thereof 2% Chemicals 1%
10 Articles of leather 1% Transportation 1%
Sum Sum of the top 10 products 92% Sum of the top 10 products 94%
Source: ITC Trade Map and Alibaba.com.
Products for export growth and diversification
Tracing changes in demand for different products over the past two years (2015-2017), this section
examines products that saw increased or decreased online demand from international buyers, which
may serve as an indicator for future demand.
23
divality.com, Market research, hair extensions.
16You can also read