Grocery Market Study: Review of the NZCC Draft Report - Woolworths New Zealand Limited
←
→
Page content transcription
If your browser does not render page correctly, please read the page content below
Grocery Market Study: Review of the NZCC
Draft Report
Woolworths New Zealand Limited
6 September 2021
Project Team
James Mellsop
Will Taylor, PhD
Kate Eyre
Barbara Kaleff

NERA Economic Consulting
Level 11
15 Customs Street West
Auckland 1010
New Zealand
+64 9 928 3292
www.nera.com
CONFIDENTIALITY
Our clients’ industries are extremely competitive, and the maintenance of confidentiality with respect
to our clients’ plans and data is critical. NERA Economic Consulting rigorously applies internal
confidentiality practices to protect the confidentiality of all client information.

Similarly, our industry is very competitive. We view our approaches and insights as proprietary and
therefore look to our clients to protect our interests in our proposals, presentations, methodologies,
and analytical techniques. Under no circumstances should this material be shared with any third party
without the prior written consent of NERA Economic Consulting.

© NERA Economic Consulting

© NERA Economic Consulting
Contents

Contents
Executive Summary .................................................................................................. i

1. Introduction ................................................................................................ 1

2. The NZCC’s ROACE analysis has overstated WWNZ’s profitability ...... 2
2.1. Conceptual difficulties with using ROACE to infer excess returns .......................... 2
2.2. The ROACE calculation is very sensitive to the treatment of goodwill .................. 10
2.3. Excluding leased assets from capital employed understates the assets being used
 to provide grocery services .................................................................................. 12
2.4. Brands are a cost incurred in providing grocery services ..................................... 17
2.5. Summary of ROACE analysis .............................................................................. 18

3. The Commission has understated WWNZ’s cost of capital ................. 20
3.1. WWNZ’s internal WACC estimates are likely to be an unbiased estimate of its
 WACC .................................................................................................................. 20
3.2. The NZCC beta comparator sample results in a very broad range ....................... 23

4. Distribution of comparator margins ....................................................... 27

5. The Commission has overstated the relative price of groceries in New
 Zealand ...................................................................................................... 30
5.1. On the NZCC’s approach, New Zealand is an expensive place overall ................ 32
5.2. The NZCC has overstated how expensive groceries in New Zealand are ............ 33
5.3. Response to NZCC comments on NERA analysis ............................................... 35
5.4. Expenditure and proportion of income spent on groceries .................................... 36

Appendix A. The NZCC has improperly weighted its price level
 indices when including alcohol and tobacco ........................... 39

© NERA Economic Consulting
Executive Summary

Executive Summary
▪ On 29 July 2021, the New Zealand Commerce Commission (“the NZCC”) released the draft
 report from its market study into the retail grocery sector. We have been asked by Woolworths
 New Zealand Limited (“WWNZ”) to review two particular aspects of the NZCC’s draft report:
 – The profitability assessment; and
 – The international price comparisons.
▪ Our findings are summarised below.

The NZCC’s ROACE analysis has overstated WWNZ’s profitability
▪ If the economic value of assets is not accurately measured, the return on average capital employed
 (“ROACE”) is an unreliable measure for inferring excess profits:
 – This has been recognised by overseas competition agencies such as the Australian
 Competition and Consumer Commission (“ACCC”), who are cautious in their application of
 return on capital measures (and in the case of the ACCC’s 2008 grocery inquiry, specifically
 placed little weight on this type of analysis).
 – For heavily depreciated assets, ROACE can be above the weighted average cost of capital
 (“WACC”) even if there are no excess profits being earned.
 – Empirical evidence consistent with these problems includes:
 - There is no statistical relationship between the NZCC’s price benchmarking and ROACE
 findings, suggesting higher prices represent higher costs, and/or there are problems with
 one or both measures.
 - Independent analysis by Armillary Capital of return on capital employed (“ROCE”) for
 New Zealand firms shows wide variation in ROCE as well as ROCE in excess of a
 reasonable WACC estimate for firms that would be considered to be operating in
 competitive markets.
 - The NZCC’s sample of comparator firms also displays a very large range for ROACE.
▪ The NZCC’s ROACE calculation for WWNZ is very sensitive to the treatment of goodwill,
 changing from 6.4 percent to 24.2 percent simply by removing it. The size of WWNZ’s goodwill
 and its impact means it is not appropriate to assume it entirely reflects market power rents.
▪ By ignoring the value of leased assets when calculating ROACE, the NZCC has materially
 understated the value of the assets employed to provide grocery services in New Zealand and
 therefore materially overstated the ROACE. An illustrative calculation including leased assets
 results in the calculated ROACE for WWNZ dropping from 21.6 percent1 to 12.2 percent.
▪ WWNZ’s brand assets have also been inappropriately excluded. Including brand assets further
 reduces the ROACE to 11.2 percent. The cumulative impact of these two adjustments is shown in
 Figure 1 below.

1
 Being the NZCC calculation of 24.4 percent after making an adjustment for the market value of land and buildings.

© NERA Economic Consulting i
Executive Summary

 Figure 1: Cumulative impact on ROACE of including brands and leased assets

 Source: NERA analysis, NZCC WWNZ ROACE Model.

The NZCC has understated WWNZ’s cost of capital
▪ The NZCC has ignored the WACC calculation and inputs used by Woolworths Australia
 (“WWAU”) to set the WACC for WWNZ for commercial purposes independent of the market
 study. Disregarding this estimate means the NZCC either considers:
 – It is better placed to estimate WACC than WWAU, despite WWAU having a multi-billion-
 dollar investment in WWNZ to manage; or
 – WWAU has incentives to bias the WACC upwards.
▪ There is no reason to believe that WWAU has an incentive to bias upwards the WACC it uses for
 commercial purposes.
▪ Using the asset beta that has been set for WWNZ by WWAU with the NZCC’s WACC
 parameters results in the WACC range increasing, from:
 – 4.6 percent to 6.1 percent; to
 – 6.4 percent to 8.3 percent.
▪ The result of using the beta set by WWAU for WWNZ and our adjustments to the ROACE
 calculation to include leased assets and brands are shown Figure 2 below.

© NERA Economic Consulting ii
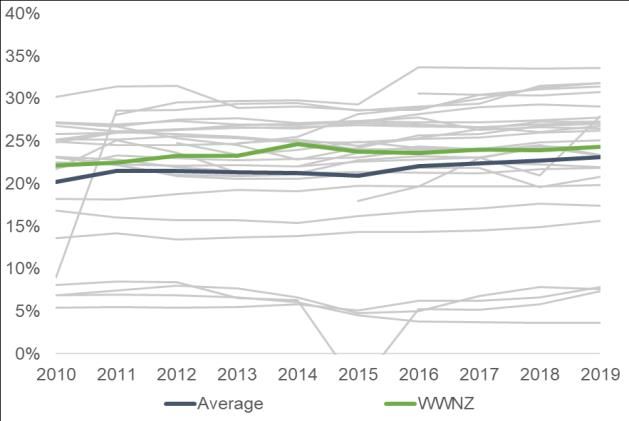
Executive Summary

 Figure 2: Revised WWNZ ROACE and WACC ranges, average 2015–2019

 Source: NERA analysis, NZCC WWNZ ROACE Model, NZCC WACC Estimation Model.

▪ The NZCC’s comparator sample for the asset beta is also very broad, with a range of -0.07 to 0.9
 and a resultant WACC estimate range of 1.3 percent to 9.1 percent. Cross checking the NZCC
 and WWAU estimates by focusing on a narrower set of the likely closest comparators to WWNZ
 (the UK supermarkets and WWAU) shows that
 – These close comparators have betas above the comparator sample average (but within the
 WWAU range set for WWNZ); and
 – These betas have been increasing over time.
▪ This is supportive of the WWAU estimate for WWNZ and suggests that the NZCC comparator
 sample average may be underestimating WWNZ’s beta.

Margin analysis does not provide conclusive evidence that WWNZ’s margins
are higher than comparators
▪ The NZCC has focussed its profit margin benchmarking on the average margins from its
 comparator sample. However, when this comparator sample is closely analysed, it is clear that
 there is a very large variability.
▪ A key explanation for this variation is likely to be accounting policy variation, particularly for
 gross profit (“GP”) margins. We understand from WWNZ that, for example, Sainsbury and
 Tesco include costs in their GP margin that WWNZ does not and that if WWNZ reported its
 margin in this manner, WWNZ’s GP margin would be less than 10 percent (well below the
 sample average and confidence interval we discuss below). This implies it is not meaningful to
 compare GP margins across companies, as an apples to apples comparison is not being made.

© NERA Economic Consulting iii
Executive Summary

▪ Furthermore, from a statistical perspective the large variation means there is uncertainty about the
 “true” mean. Accordingly, it is appropriate to estimate a confidence interval around the
 comparator sample average. This analysis is shown in the figure below.
Figure 3: WWNZ GP and NPAT margins are not statistically significantly different from
 the comparator mean, EBIT margin has recently been trending downwards

 Source: NERA analysis, NZCC WWNZ ROACE and Margins Model.

▪ This analysis demonstrates that:
 – For GP and net profit after tax (“NPAT”), WWNZ’s margins are generally within the
 confidence interval (although as already discussed, it does not seem meaningful to compare
 GP margins across the comparator firms); and
 – For earnings before interest and taxes (“EBIT”), the WWNZ margin has historically been
 outside (above) the confidence interval, but it has been generally falling since 2015 and was
 inside the confidence interval at the end of the period.
▪ In addition, similar to ROACE, we find no statistically significant correlation between the food
 price indices used by the NZCC and margins for comparator companies. This is consistent with
 higher prices being related to higher costs and/or measurement issues with profit margins and
 price levels.

© NERA Economic Consulting iv
Executive Summary

The NZCC has overstated the relative price of groceries in New Zealand
▪ Using the same methodology the NZCC does, but using prices across all sectors in the economy,
 New Zealand has the eighth most expensive prices in the OECD (see Figure 4) across all sectors.
 Thus, the NZCC finding (if correct) that New Zealand has the seventh most expensive food and
 non-alcoholic beverage grocery prices in the OECD could simply reflect that New Zealand is a
 high cost-to-serve country.
 Figure 4: Economy-wide price levels, 2017

 Source: OECD.Stat, 2017 PPP Benchmark results, Table 1.11: Price level indices (OECD=100).

▪ The NZCC finds that including alcohol and tobacco in grocery prices pushes New Zealand’s
 ranking to sixth highest amongst OECD countries. We think it is incorrect to include alcohol and
 tobacco in the measure of grocery price levels, due to countries’ varying excise taxes on these
 products and varying policies globally on where these products are sold. In addition, the NZCC
 itself proposed to exclude these products in its Preliminary Issues Paper for this market study.
▪ The NZCC relies on market exchange rates to make international comparisons, while we think
 that there is justification for using PPP rates. Our reconstructed price level index using the PPP
 exchange rate puts New Zealand 21st out of OECD countries (see Figure 5) compared to seventh
 using the market exchange rate. The interpretation of this alternative index is that there are 20
 OECD countries whose relativity between grocery price levels and economy wide price levels is
 “worse” (higher) than the relativity for New Zealand.

© NERA Economic Consulting v
Executive Summary

 Figure 5: Grocery price level indices excluding alcohol and tobacco using PPP rates,
 2017

 Source: OECD.Stat, 2017 PPP Benchmark results, Table 1.11: Price level indices (OECD=100).

▪ The NZCC critiques the results of our earlier analysis using product-level price rankings, stating
 the methodology used may limit the influence of very cheap or expensive goods that might be a
 large share of expenditure, and that averages across prices should have been used. However, a
 central feature of our methodology is to avoid assuming a fixed basket of goods across countries.
 Instead, our methodology ranks the prices of individual goods and displays the distributions of
 rankings, such that countries with cheaper prices by item will rank lower.

▪ The NZCC makes a statement in the Chapter 3 summary that New Zealanders appear to spend a
 relatively high proportion of their income on groceries. However, the analysis performed by the
 NZCC is simply of expenditure per capita (i.e., with no relativity to income). When analysing the
 expenditure per capita as a percent of GNI per capita for OECD countries, New Zealand ranks
 17th using market exchange rates (see Figure 6) and 14th using PPP rates.2 This compares to the
 NZCC finding that New Zealand ranks fifth on expenditure per capita across OECD countries.

 Figure 6: Expenditure on groceries per capita as a percent of GNI per capita using
 market exchange rates, 2017

 Source: World Bank, ICP 2017 results and World Bank DataBank, World Development Indicators.

2
 The results are similar when we also use other metrics to represent income.

© NERA Economic Consulting vi
Introduction

1. Introduction
1. On 29 July 2021, the New Zealand Commerce Commission (“the NZCC”) released the draft
 report from its market study into the retail grocery sector. We have been asked by Woolworths
 New Zealand Limited (“WWNZ”) to review two particular aspects of the NZCC’s draft report:
 a. The profitability assessment; and
 b. The international price comparisons.
2. Our key findings are that the NZCC has:
 a. Overstated the profitability of WWNZ’s grocery business; and
 b. Overstated how expensive groceries are in New Zealand, both in terms of price levels and the
 proportion of income that is spent on groceries.
3. The NZCC has canvassed a range of options to deal with the issues it considers it has identified in
 its draft report, some of which are quite intrusive (e.g., mandatory wholesaling or even vertical
 disintegration). While the NZCC has stated that performing a cost benefit analysis is outside the
 scope of the market study, as the expert competition agency of the government it seems
 appropriate for the NZCC to give some consideration to the costs as well as the benefits of the
 reform options it proposes.
4. In this regard, as we explain in this report, the NZCC’s analysis in the draft report, which places a
 large emphasis on profitability and price comparisons, overstates any issues.
5. The rest of this report is laid out as follows:
 a. Section 2 reviews the NZCC’s return on average capital employed (“ROACE”) analysis;
 b. Section 3 reviews the NZCC’s analysis of the weighted average cost of capital (“WACC”);
 c. Section 4 reviews the NZCC’s profit margin analysis; and
 d. Section 5 reviews the NZCC’s international price and food expenditure benchmarking.

© NERA Economic Consulting 1
The NZCC’s ROACE analysis has overstated WWNZ’s
 profitability

2. The NZCC’s ROACE analysis has overstated
 WWNZ’s profitability
6. In this section of our report we discuss:
 a. The conceptual difficulties in using ROACE to infer whether excess profits are being earned,
 with a particular focus on how ROACE is influenced by the age and depreciation profile of
 the assets. As we show, applying ROACE to heavily depreciated assets results in a high
 ROACE even if only normal returns are being earned.
 b. The measurement difficulties that make it difficult to infer that a ROACE above WACC
 reflects excess returns. Within the NZCC’s own comparator sample and independent analysis
 of ROCE for New Zealand firms, the return on capital varies greatly and is often above any
 reasonable measure of WACC.
 c. That the ROACE calculation is extremely sensitive to the NZCC’s decision to exclude
 goodwill, which combined with recent and current overseas grocery transactions resulting in
 significant goodwill, casts doubt on the calculated ROACE.
 d. In the present context, a proper application of the NZCC’s approach would include leased
 assets and brands in the capital base. Appropriately accounting for leased assets reduces the
 NZCC’s calculated ROACE to 12.2 percent. Accounting for brand assets further reduces
 ROACE to 11.2 percent.

2.1. Conceptual difficulties with using ROACE to infer
 excess returns
7. The return on capital employed (“ROCE”) measures returns, based on the assets employed to
 generate those earnings. ROACE is similar to ROCE, but uses the average of capital employed at
 the start and end of the period for a better estimate of the value of assets used to generate earnings
 in that period.3
8. The NZCC finds that ROACE appears to be significantly and persistently above its estimate of
 the normal return for a grocery business in New Zealand, being its estimate of WACC.4,5 In the
 case of WWNZ, the NZCC finds that over the period 2015–2019, WWNZ had an average
 ROACE of 21.6 percent compared to the NZCC’s WACC estimate of 4.6 percent to 6.1 percent.6
9. As a profitability measure, ROACE is very sensitive to the valuation of the assets and also how
 depreciated the assets are. Because of this, it can be an unreliable measure of whether excess
 returns are being earned in a market.
10. In this subsection we set out:
 a. The conceptual problems with inferring excess returns from a ROACE in excess of WACC
 (section 2.1.1);
 b. An illustrative example of how heavily depreciated assets will show a ROACE in excess of
 WACC even when there are no excess returns (section 2.1.2);

3
 We discuss ROACE and some sources only discuss ROCE, but for the conceptual issues we discuss here, ROACE and
 ROCE are equivalent.
4
 NZCC (2021), Market study into the retail grocery sector – Draft report, 29 July 2021, pg.7.
5
 We note that the NZCC calculates a post-tax ROACE in order to compare it a post-tax WACC.
6
 See Figure 16.

© NERA Economic Consulting 2
The NZCC’s ROACE analysis has overstated WWNZ’s
 profitability

 c. Empirical evidence which suggests the NZCC’s ROACE analysis is unreliable. Specifically:
 i. There is no relationship between the NZCC’s price benchmarking results for food and
 non-alcoholic beverages and measured ROACE, which is consistent with high prices
 being due to high costs (and thus not resulting in excess returns) and/or a problem with
 either the ROACE or price benchmarking analysis (section 2.1.3.1).
 ii. Independent analysis by Armillary Capital of ROCE for New Zealand firms, which shows
 wide variation in ROCE as well as ROCE in excess of a reasonable WACC estimate for
 firms that would be considered to be operating in competitive markets (section 2.1.3.2).
 iii. The NZCC’s sample of comparators firms also displays a very large range for ROACE
 (section 2.1.3.3).

2.1.1. ROACE is heavily influenced by asset values and the
 depreciation profile
11. Overseas competition agencies have been cautious in the use of ROACE for competition analysis,
 as meaningful results rely on being able to ascribe an economically meaningful value to the
 capital base and the measured ROACE depends heavily on the depreciation profile used. For
 example:
 a. The UK Competition Commission’s (predecessor to the Competition Markets Authority
 (CMA))7 2013 Guidelines for market investigations state:8,9
 Whatever measure of profitability is used, the calculation of profitability for the purposes of
 competition analysis is often not straightforward because of the need to obtain an appropriate value
 for capital employed, as described below. In industries with a relatively low level of tangible assets,
 such as service and knowledge-based industries, the book value of capital employed may bear little
 relationship to the economic value because of the presence of significant intangibles. In some cases,
 the replacement cost of assets may be different from historical costs due to the length of time elapsed
 and changes in asset prices and efficient technologies over time.

 Similarly, a return on capital approach, whether return on equity or return on capital employed
 (ROCE), requires an economically meaningful value for the capital base which may not accord with
 the value ascribed in the financial records.

 b. Similarly, the ACCC decided that it could not draw “significant conclusions” from its return
 on funds employed (“ROFE”) analysis in its 2008 supermarkets inquiry, stating (page 111,
 emphasis added):10,11

7
 The UK Competition Commission was abolished in 2014 to merge with the Office of Fair Trading in a new body, the
 Competition Markets Authority.
8
 UK Competition Commission, Guidelines for market investigations: Their role, procedures, assessment and remedies –
 Annex: Market characteristics and outcomes, April 2013, para.12-13, available at:
 https://assets.publishing.service.gov.uk/government/uploads/system/uploads/attachment_data/file/284390/cc3_revised.pdf.
9
 We understand that the UKCC guidelines have been adopted by the CMA.
10
 ACCC (2008), Report of the ACCC inquiry into the competitiveness of retail prices for standard groceries, July 2008,
 pg.111, from: https://www.accc.gov.au/system/files/Grocery%20inquiry%20report%20-%20July%202008.pdf
11
 ROFE is similar to ROCE. The ACCC did not calculate ROFE but used values from Woolworths’ and Coles’ public
 annual reports. At the time of the market study, Woolworths Australia defined funds employed as “net assets excluding net
 tax balances, provision for dividends and net debt, and assets and liabilities as a result of hedging per AASB 139 Financial
 Instruments: Recognition and Measurement.” See:
 https://www.woolworthsgroup.com.au/icms_docs/183555_Annual_Report_2008.pdf

© NERA Economic Consulting 3
The NZCC’s ROACE analysis has overstated WWNZ’s
 profitability

 The ACCC agrees that care is needed when interpreting ROFE as it is heavily influenced by the value
 of the underlying assets and the extent of depreciation. Given this, the ACCC considers that
 significant conclusions cannot be drawn from ROFE.

12. The NZCC states at [C42] that it is not clear why the ACCC and UK competition regulator did
 not use ROACE as a measure of profitability in later studies of the grocery sector: 12
 The more recent UK and ACCC studies did not state why they had not used ROACE and TIRR for
 their profitability assessment. We are not aware why this was the case.

13. However, in 2008 the ACCC stated:13
 Both MSCs provided the ACCC with confidential calculations that they submitted demonstrated
 much lower ROFE—after adjusting for factors such as leasing and depreciation—of around 15
 per cent to 20 per cent for 2006–07. The ACCC agrees that care is needed when interpreting
 ROFE as it is heavily influenced by the value of the underlying assets and the extent of
 depreciation. Given this, the ACCC considers that significant conclusions cannot be drawn from
 ROFE.

14. This suggests that the ACCC considered ROFE to be unreliable in that process, in response to the
 submissions from Coles and Woolworths Australia (later cited by the NZCC at [C49]) that ROFE
 would be inflated due to Woolworths having heavily depreciated assets and Coles leasing a lot of
 its buildings. Likewise, as we discuss in this report, both of these issues (depreciation and
 leasing) mean ROACE is likely inflating WWNZ’s returns.
15. There are also potential issues with using ROACE in industries that are ”asset light” like retail.14
 These “asset light” companies invest in intangible assets like human capital, R&D and brand
 value, the effectiveness of which can drive profits in current and future periods, but the assets may
 not be recognised for accounting purposes.15 This may mean that the numerator of the ROACE
 calculation increases, without recognising the capital employed in the denominator, increasing
 ROACE. We return to the issue of brands in Section 2.4. A similar point holds for companies
 that lease, rather than own their assets, since this will similarly make them more “asset light”.
16. The NZCC discusses the conditions needed for using ROACE at [C39-40] of the draft report, and
 the drawbacks of using ROACE at [C48-C49].16 However, [C50] of the draft report states that the
 adjustments the NZCC made to book values are sufficient to reflect economic costs, even if not

12
 NZCC (2021), Market study into the retail grocery sector – Draft report, 29 July 2021, para C42.
13
 ACCC (2008), Report of the ACCC inquiry into the competitiveness of retail prices for standard groceries, July 2008,
 pg.111, from: https://www.accc.gov.au/system/files/Grocery%20inquiry%20report%20-%20July%202008.pdf
14
 Oxera (2014), Something for nothing? Returns in low-asset industries, March 2014, pg.1.
15
 Oxera (2014), Something for nothing? Returns in low-asset industries, March 2014:
 “One source of such additional liabilities is where companies invest in ‘intangible assets’, such as brand value,
 R&D or customer acquisition. These investments may not meet the accounting criteria for recognition on the
 balance sheet, but they are very similar in nature to tangible assets. Investment is made today in the expectation of
 making a return tomorrow. Therefore, today, investors will expect returns on investments from previous years.
 This can be addressed by ‘capitalising’ certain operating costs—for example:
 - training costs could be capitalised into knowledge assets;
 - R&D costs could be capitalised into IP assets;
 - marketing costs could be capitalised into brand-value assets.
 While they are not ‘assets’ for accounting purposes, these liabilities and assets are otherwise very similar to those
 for an asset-intensive business—profits in current and future periods will be driven by the level and effectiveness
 of investments made in prior periods.
16
 NZCC (2021), Market study into the retail grocery sector – Draft report, 29 July 2021, para C48-C49.

© NERA Economic Consulting 4
The NZCC’s ROACE analysis has overstated WWNZ’s
 profitability

 precise, and that the results are unlikely to be materially impacted by measurement errors in these
 adjustments.17
17. For the reasons discussed below, we disagree.

2.1.2. Illustrative example showing that depreciated assets will have
 ROACE > WACC even when there are no excess returns
18. To illustrate the depreciation point, we present a simple example of an asset that earns no
 economic rents over its life (i.e., NPV=0 and therefore the cashflows cover the cost of capital and
 no more). Consider an asset with the following characteristics:
 a. Initial cost = $100
 b. WACC = 6.1 percent
 c. Economic life = 10 years
 d. Annual cash flow = $13.59 (being the amount that sets NPV = 0 over the 10-year life)
 e. Straight line depreciation = $10 per year
19. A comparison of the annual ROACE vs WACC is set out in Figure 7 below. We have also
 overlaid the average ROACE calculated over the first five years, the middle five years and the
 final five years of the asset’s life. This figure illustrates that, even when there are no excess
 returns:
 a. ROACE rarely equals WACC;
 b. ROACE will generally be above WACC in the later part of the asset’s life; and
 c. Calculated ROACE gets extremely high when the assets are heavily depreciated.
 Figure 7: Illustrative comparison of annual ROACE vs WACC over the life of a single
 depreciable asset that earns no excess returns

 Source: NERA analysis.
 Note: The y-axis has been truncated and does not show the ROACE of 72 percent in the final year of the asset’s life.

17
 NZCC (2021), Market study into the retail grocery sector – Draft report, 29 July 2021, para C50.

© NERA Economic Consulting 5
The NZCC’s ROACE analysis has overstated WWNZ’s
 profitability

20. Thus, for heavily depreciated assets, ROACE is likely to provide little informative value as to
 whether an asset is earning excess returns. Specifically, the simple example in Figure 7
 demonstrates that once an asset is 40 percent of the way through its life,18 ROCE will be greater
 than WACC.

21. This simple analysis ignores the fact that firms have both depreciable and non-depreciable assets.
 However, introducing a non-depreciable asset does not change the finding, as it is how
 depreciated the depreciable assets are (as opposed to total assets) that drives whether ROACE >
 WACC.
22. To illustrate this more concretely, we have modified the above simple example to include both a
 depreciable and non-depreciable asset, in proportion to WWNZ’s depreciable and non-
 depreciable assets. Specifically, we can divide the WWNZ balance sheet figures used by the
 NZCC in its ROACE calculation (i.e., excluding goodwill and intangibles) into depreciable19 and
 non-depreciable assets.20 The data in Table 1 below is based on data provided by WWNZ and
 shows averages over 2015-2019.
 Table 1: WWNZ total assets: depreciable vs non-depreciable (2015 – 2019 averages)

 Asset type Undepreciated Proportion of % depreciated
 value ($m) total assets
 (undepreciated)
 Non-current fixed 1,660 63% 62%
 assets
 Current assets 681 25% 0%*
 Land 310 12% 4%**
 Source: NERA analysis of WWNZ data. * Current assets are not depreciated. **We understand from WWNZ that land
 consists of ‘Development Properties’ with no depreciation, and ‘Freehold Properties’ with some depreciation. Freehold
 is the majority and is depreciated very slowly (between 25-50 years). Note: numbers have been rounded.

23. Thus, on average over the period 2015-2019 the undepreciated historic cost of WWNZ’s
 depreciable assets was $1.66b and the cost of its non-depreciable assets was $990m. Redoing the
 analysis underlying Figure 7 using these values for the depreciable and non-depreciable assets
 yields Figure 8. In this figure we have also netted off WWNZ’s average current liabilities over
 the period when determining the capital employed. This demonstrates the inclusion of the non-
 depreciable assets (netting off current liabilities) does not change the point at which ROACE >
 WACC, but it does scale the ROACE down after the tipping point such that the difference
 between ROACE and WACC is not as drastic. This is intuitive – if the issue is caused by
 depreciation, having fewer depreciable assets mitigates the problem.21

18
 I.e. 4/10 years.
19
 Being Leasehold improvements, Plant & Equipment and Software.
20
 Being freehold and development properties.
21
 Specifically, if the only asset was non-depreciable, then ROACE = WACC and the ROACE line is flat across time. When
 there is both a depreciable and non-depreciable asset, the flat line and curve are added together. So adding a non-
 depreciable asset pulls the curve back towards the flat line, but does not change where the ROACE line crosses the WACC
 line.

© NERA Economic Consulting 6
The NZCC’s ROACE analysis has overstated WWNZ’s
 profitability

 Figure 8: Illustrative calculation of ROACE vs WACC for firm with depreciable and
 non-depreciable assets in the same proportions as WWNZ, that earns no excess
 returns

 Source: NERA analysis.

24. In the case of WWNZ, Table 1 above shows its depreciable assets were on average 62 percent
 depreciated over the period 2015–2019, being the period the NZCC is focused on for ROACE.
 Our simple model demonstrates that once depreciable assets are more than 40 percent depreciated,
 ROACE will be greater than WACC. This suggests at least some of the excess returns the NZCC
 is finding are an artefact of the impact that depreciation has on ROACE.
25. In addition, this illustrates that the NZCC’s comparison of ROACE between firms is problematic,
 as the differences the NZCC finds could be at least partly explained by differing depreciation
 profiles. For example, the NZCC’s methodology would find a high ROACE for a firm with old
 assets and low ROACE for a firm with new assets, even if both firms had the same pricing and
 assets.

2.1.3. Empirical analysis suggesting ROACE is an unreliable measure
 for inferring excess returns in the present case
26. The difficulties with using ROACE are further illustrated by:
 a. The lack of a relationship between the NZCC’s price level benchmarking and it’s
 international ROACE benchmarking.
 b. The variation of ROCEs calculated by Armillary, e.g., consistently high ROCEs in industries
 we would expect to be competitive.
 c. Variability in ROACE across NZCC’s own sample.

© NERA Economic Consulting 7
The NZCC’s ROACE analysis has overstated WWNZ’s
 profitability

2.1.3.1. No relationship between price level indices and ROACE
27. There is no clear link between the results of the NZCC’s ROACE and food price level index
 analyses. If a higher ROACE indicated that grocery companies were earning excess profits, we
 might expect to observe a positive correlation between the ROACE of grocery retailers and the
 food price level index in the countries they are based in.
28. Figure 9 shows the 2015–2019 average ROACE for comparator companies in the NZCC sample,
 and the 2017 OECD ‘Food and non-alcoholic beverages’ price level index of the country the
 company is based in. There is no statistically significant correlation between ROACE and the
 food price level index.22 This could be because:
 a. Price levels are not actually related to profit (which would make sense if prices vary due to
 different cost drivers); and/or
 b. One or both of the ROACE or price index measures are problematic (i.e., there should be a
 positive relationship but there is not one found).
 Figure 9: No statistically significant correlation between average ROACE (2015–2019)
 and the OECD food and non-alcoholic beverages price level index (2017) for
 comparator companies

 Source: NERA analysis, NZCC WWNZ ROACE and Margins Model, OECD.Stat, 2017 PPP Benchmark results, Table
 1.11: Price level indices (OECD=100).

2.1.3.2. The ROCEs calculated by Armillary show that industries we would
 expect to be competitive have consistently high ROCEs
29. Armillary Private Capital regularly calculates ROCE for 114 New Zealand companies and Crown
 Entities as a measure of business effectiveness and capital efficiency. There is a wide range of

22
 I.e., the correlation between the series is not significantly different from zero. The correlation between the two series is
 0.028, but this is not significant as the p-value is 0.88.

© NERA Economic Consulting 8
The NZCC’s ROACE analysis has overstated WWNZ’s
 profitability

 ROCEs for these companies, even when looking at the average over three years (from -1,134
 percent to 165 percent).23
30. In the Armillary analysis, retail companies we might expect to face significant competitive
 pressure have consistently high ROCEs,24 Briscoes Group (44.3 percent), Hallenstein Glasson
 (67.9 percent), Kathmandu (18.7 percent), Michael Hill (18.2 percent), and The Warehouse Group
 (16.1 percent).25 Additionally, the ‘Consumer Products and Services’ sector has the highest 2019
 median ROCE out of all the sectors in the analysis.

2.1.3.3. There is variability in ROACEs across the NZCC’s own sample of
 comparator companies
31. There is a wide range and variation in the 2015–2019 average ROACE for the companies in the
 comparator sample used by NZCC, as shown in Figure 10 (we explain the derivation of the
 WWNZ (leased assets + brand) bar in section 2.3 below). Additionally, a majority of the
 comparator companies have a ROACE well above the WACC range used by NZCC for groceries
 in New Zealand, while some have a ROACE below the NZCC’s WACC.26 While the WACC for
 the international companies is likely to be different, this suggests that either:
 a. Most international grocery companies are making excess returns; or
 b. ROACE in excess of WACC is not a reliable indicator of excess returns.
 Figure 10: WWNZ and comparator company ROACE (average 2015–2019)

 Source: NERA analysis, NZCC WWNZ ROACE Model.
 Note: The ‘WWNZ (leased assets + brand)’ value has been adjusted to include leased assets and brand assets (see section
 2.3) where the other values have not, so they may not be directly comparable.

23
 Armillary Private Capital (2020), Return on Capital Employed – Review of 2019 Returns, 2020.
24
 Three-year average ROCE.
25
 Armillary Private Capital (2020), Return on Capital Employed – Review of 2019 Returns, 2020.
26
 Out of the 30 comparator companies, nine have a ROACE below the NZCC WACC range, two have a ROACE within the
 range and 19 have an ROACE above the range.

© NERA Economic Consulting 9
The NZCC’s ROACE analysis has overstated WWNZ’s
 profitability

2.2. The ROACE calculation is very sensitive to the
 treatment of goodwill
32. By far and away the largest single item on the balance sheet of WWNZ is goodwill. For example,
 for FY19 goodwill accounted for $2.3b out of total assets of $4.0b.27 Even more starkly, when
 Woolworths acquired the New Zealand business of Foodland in 2005 (what is now WWNZ),
 Woolworths paid $2.5b for a business with a net book value of $300m.28 This resulted in a
 goodwill balancing figure of $2.2b.
33. As a result, the NZCC’s ROACE calculation is very sensitive to the treatment of goodwill. The
 NZCC therefore needs to be very cautious before attributing the entirety of the goodwill to a
 competition issue. Figure 11 below demonstrates this sensitivity, showing that the calculated
 return for WWNZ goes from 6.4 percent to 24.2 percent simply by excluding goodwill. The
 NZCC then makes an adjustment to account for the market value of land and buildings, which
 reduces this number to 21.6 percent. The NZCC then conducts a sensitivity by adding back
 unaccounted for goodwill of $300m, which reduces the ROACE to 16.5 percent. As we set out
 shortly, this sensitivity still materially understates the value of WWNZ’s assets.
 Figure 11: Cumulative impact on ROACE of goodwill compared to NZCC adjustments
 (2015–2019)

 Source: NERA analysis, NZCC WWNZ ROACE Model

27
 For FY20 goodwill accounted for $2.3b out of total assets of $5.4b. The bulk of the increase in total assets between FY19
 and FY20 was because of a change in the treatment of leases under IFRS 16, as we discuss in section 2.3 of this report.
 But goodwill remains by far and away the largest single item on the balance sheet.
28
 Restated in accordance with IFRS 3.

© NERA Economic Consulting 10
The NZCC’s ROACE analysis has overstated WWNZ’s
 profitability

34. As the NZCC acknowledges, the 6.4 percent is the return that WWNZ’s owners are receiving, as
 the goodwill represents the amount they paid for the business.29 Therefore, there is gap of almost
 18 percentage points between the return shareholders are earning and the ostensible return the
 assets are generating.
35. To illustrate that the NZCC needs to be cautious assuming all goodwill is market power rents, two
 recent data points in the grocery sector are informative:
 a. Amazon acquisition of Whole Foods: Out of the USD 13.2b that Amazon paid for Whole
 Foods in 2017, USD 9b (68 percent) was accounted for as goodwill.30 Prior to the
 acquisition, Whole Foods had been reported as “struggling in an intensely competitive
 environment”.31 We have reviewed various news articles about the acquisition, and have not
 seen any evidence or claim that Whole Foods was operating in markets that were not
 workably competitive. Rather the discussion has been about synergies and growth
 opportunities for Amazon.
 b. Morrisons sale to private equity: Morrison Supermarkets, the fourth largest supermarket
 chain in the UK, has been subject to a private equity bidding war in the first half of 2021.32
 The current leading offer is worth GBP 7b,33 which is GBP 2.8b higher than Morrison’s 2021
 net asset book value of GBP 4.2b.34 Being the fourth player in the market makes it unlikely
 that this premium reflects an expectation that Morrisons is earning market power rents.
 Rather news articles about the acquisition generally attribute this premium on acquisition
 price to Morrisons property portfolio and deals with Amazon to supply Amazon Prime
 members.35
36. In its draft report, the NZCC rejected all but one of WWNZ’s arguments for including goodwill in
 the asset base, accepting arguments around market value but rejecting points related to
 depreciation, leases and synergies.36
37. Regarding depreciation, the valuation should be the depreciated replacement cost of the assets in
 question, which is essentially the position the NZCC sets out. However, this rests on the
 depreciation being used reflecting economic depreciation (i.e., the change in the market value of
 assets) rather than accounting depreciation. As we set out in section 2.1.2 above, even with the
 correct depreciation allowance, the calculated ROACE varies materially year to year and will
 exceed WACC when the assets are heavily depreciated, even if no rents are being earned.
38. Regarding leases, we discuss this issue at length in section 2.3 below.

29
 NZCC (2021), Market study into the retail grocery sector – Draft report, 29 July 2021, para C157.
30
 Securities and Exchange Commission, "Amazon.com, Inc. Form 10-K for Fiscal Year Ended December 31, 2017."
 EDGAR, 2017. Available at https://www.sec.gov/Archives/edgar/data/0001018724/000101872418000005/amzn-
 20171231x10k.htm.
31
 Whole Foods: A Year To Forget, Forbes, 7 November 2016. Available at:
 https://www.forbes.com/sites/gurufocus/2016/11/07/whole-foods-a-year-to-forget/?sh=55c7fbcb62de
32
 Jack Barnett, Morrisons takeover could trigger breakup, analysts warn, City A.M., 13 July 2021. Available at:
 https://www.cityam.com/morrisons-takeover-could-trigger-breakup-analysts-warn/
33
 UK’s Morrisons Agrees To CD&R’s $9.54B Takeover Offer, Competition Policy International, 19 August 2021. Available
 at: https://www.competitionpolicyinternational.com/uks-morrisons-agrees-to-cdrs-9-54b-takeover-offer/
34
 Wm Morrison Supermarkets PLC Annual Report and Financial Statements 2020/21.
 James Davey and Kate Holton, Analysis: Property, cash and Amazon: Why buyout firms are battling to buy UK’s
35

 Morrisons, Reuters, 7 July 2021. Available at: https://www.reuters.com/business/retail-consumer/property-cash-amazon-
 why-buyout-firms-are-battling-buy-uks-morrisons-2021-07-06/
36
 NZCC (2021), Market study into the retail grocery sector – Draft report, 29 July 2021, para C157.

© NERA Economic Consulting 11
The NZCC’s ROACE analysis has overstated WWNZ’s
 profitability

39. Regarding synergies, the NZCC argues that synergies are a not a cost incurred in providing
 grocery services37 and that in a workably competitive market synergies would be passed through
 over time.38 This does not, however, mean that the NZCC is right to ignore synergies in its
 profitability analysis. By excluding synergies, the NZCC is implicitly assuming that the entire
 amount of goodwill is market power rents. At the other end of the spectrum, the NZCC could
 either capitalise the value of synergies in goodwill or remove the synergies from the firm’s net
 cashflows (e.g., increase opex by the annual synergy amount). If the NZCC is concerned that
 synergies should be passed through over time, it should at least recognise them for a time (i.e.,
 somewhere in between the two extremes).
40. Our point regarding goodwill is that when goodwill is such a large proportion of the asset base, it
 is not appropriate to assume it is largely market power rents, particularly given the grocery
 transaction examples cited above where there was significant goodwill in situations where the
 output markets appear competitive.

2.3. Excluding leased assets from capital employed
 understates the assets being used to provide grocery
 services
2.3.1. Introduction
41. Prior to IFRS 16 being introduced in 2020, the accounting treatment of a lease depended on
 whether it was characterised as a “capital” or “operating” lease, with the former being recorded on
 the balance sheet and the latter not. Under IFRS 16, all (material) leases are now treated as being
 on-balance sheet as an asset (the asset being the right to use the asset for the period of the lease)
 and a liability (the liability being the requirement to pay future rents).39
42. Most of WWNZ’s stores are leased, and this has also historically been the case, including when
 the business was owned by Foodland. As a result, there is a material volume of assets that prior
 to FY20 were not recognised as assets in WWNZ’s accounts. For example, in FY20 the lease
 asset on WWNZ’s balance sheet is $1.1b, which is approximately 24 percent of WWNZ’s assets
 (or 46 percent if goodwill is excluded, as the NZCC argues is appropriate). Leased assets thus
 comprise a substantial proportion of the assets used to provide grocery services by WWNZ. As
 we describe in this section, the NZCC has substantially underestimated the assets employed to
 provide grocery services by not including leased assets in the asset base for its ROACE
 calculations. Indeed, the UK CMA has specifically recognised that ROACE calculations can be
 distorted where firms choose to lease a material proportion of their assets and these assets do not
 appear on the balance sheet.40
43. The NZCC states its approach to assessing economic profitability is an economic one [3.14]:

37
 NZCC (2021), Market study into the retail grocery sector – Draft report, 29 July 2021, para C157.4.
38
 NZCC (2021), Market study into the retail grocery sector – Draft report, 29 July 2021, para C157.5.
39
 New Zealand External Reporting Board (EXAB), New Zealand Equivalent to International Financial Reporting Standard
 16 Leases (NZ IFRS 16), February 2016. Available at: https://www.xrb.govt.nz/accounting-standards/for-profit-entities/nz-
 ifrs-16/
40
 The CMA noted the following in the profitability methodology appendix of the funerals market investigation, which was
 produced prior to IFRS 16 when operating leases did not appears on the balance sheet:
 ROCE percentages can sometimes be distorted, for example where firms choose to lease a material portion of
 their assets, and these leases are classified as operating leases for the purposes of financial reporting.
 CMA (2020), Funerals Market Investigation: Final report - Appendix Q:Profitability Methodology, para 30(a), 18
 December 2020, available at: https://www.gov.uk/cma-cases/funerals-market-study

© NERA Economic Consulting 12
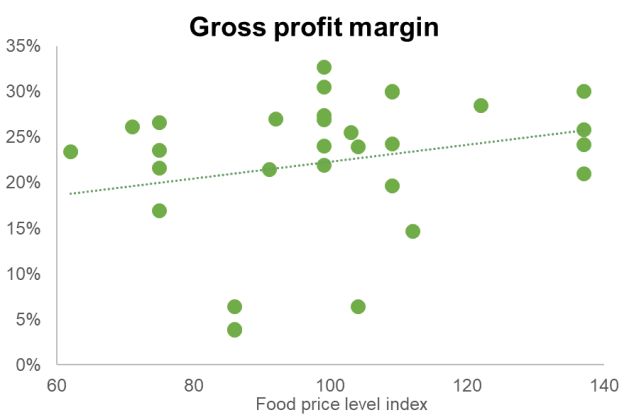
The NZCC’s ROACE analysis has overstated WWNZ’s
 profitability

 Economic profit is calculated using the economic costs of the resources used in the business and is
 benchmarked against the opportunity cost of investing the assets (or capital) employed elsewhere. This
 differs to an accounting concept of profit, which is aimed more at estimating financial surplus in a
 period and uses accounting conventions such as for non-cash expenses
44. We agree that economic profitability is the appropriate lens to apply for a competition assessment.
 However, it has been misapplied by the NZCC with respect to leased assets. The NZCC
 characterises the argument to include leases as being an accounting issue brought about by the
 recent change in accounting standards that require leases to be capitalised and included as assets.
 Given the NZCC’s focus is economic profit, it therefore considers no adjustment is required.
 Specifically, at [C76], the NZCC states:
 However, we do not consider including the leases in total assets employed is appropriate when
 assessing economic profit:
 These changes arise from changes in the accounting standards. As noted, we are only interested in
 the economic value of assets and not accounting standards.
 Given the value of the lease asset will always be closely matched by the value of the liability, the
 two tend to cancel each other out.
 These accounting changes did not come into effect until the 2020 year. This is outside of the time
 period in which we are examining profitability
45. As we set out in the rest of this section, the NZCC’s premise for not capitalising leased assets is
 flawed. Specifically, including leased assets in the asset base provides a better reflection of
 economic value of the assets being deployed to provide grocery services.

2.3.2. An economic approach to assessing profit would include the
 value of leased assets
46. As noted above, the NZCC claims that the issue of including leases in the asset base only arises
 due to a change in accounting standards and that the NZCC is only interested in the economic
 value of assets. This contrasts with the NZCC’s position during the fuel inquiry, where it noted
 the following:41
 We agree there is an arguable case for including the present value of the lease payments within capital
 employed although it does not seem to be an adjustment which BP Plc or the other fuel firms typically
 make.
47. The economic question the NZCC is asking itself is whether the assets being used to provide
 groceries are earning excess returns. Leasing in economic terms is an alternative method of
 financing the purchase of an asset. In this sense a lease is similar in economic effect to taking on
 debt to buy an asset, and indeed would be economically equivalent if the lease covered the entire
 life of an asset.
48. These assets are being deployed to provide groceries, but are not counted as part of the capital
 deployed under the NZCC’s methodology. How firms choose to finance their activities should
 not alter the NZCC’s findings of whether the assets are generating excess returns.
49. By not capitalising leases, decisions on how businesses finance themselves will alter the measure
 of returns - businesses that choose to lease assets rather than own them will show higher returns
 under the NZCC’s approach than businesses that own their own assets. This has implications for
 the NZCC’s assessment of returns in market studies, as it will be more likely to find excess
 returns in industries where leasing is common practice.
50. The NZCC also appears to imply that including leased assets will not impact the returns
 calculation materially as a matching liability is created which closely matches the value of the
41
 NZCC (2019), Market study into the retail fuel sector - Final report, 5 December 2019, para C234.5.

© NERA Economic Consulting 13
The NZCC’s ROACE analysis has overstated WWNZ’s
 profitability

 asset. It is correct that a liability is created. However, this liability does not offset the increased
 asset base in the ROACE calculation. This can be demonstrated by examining the NZCC’s
 ROACE calculation.42

51. This shows that only current liabilities43 are subtracted from total assets. Lease obligations that
 are due outside the current year are non-current liabilities, which are not subtracted from total
 assets to derive capital employed.44 This is essentially recognition that non-current liabilities
 (which include debt finance and long-term lease obligations) are a form of finance and thus
 should not be netted off when assessing the assets that have been employed by a firm.45
52. When IFRS 16 was introduced, the International Accounting Standards Board (IASB) produced a
 number of numerical examples demonstrating that ROACE is lower (under IFRS 16) for firms
 with leased assets. The analysis gives examples for a hypothetical airline, retailer and
 distributor.46 The impact is largest for the retailer (11.5 percent down to 10.2 percent),47 given
 retailers lease a large proportion of their retail space using leases that were off balance sheet prior
 to IFRS 16. The retail example has obvious parallels with the current situation.

2.3.3. The accounting standards were changed to more accurately
 reflect the economic value of a firm’s assets
53. The previous accounting standards undervalued, from an economic perspective, the assets
 employed when there is significant leasing of assets. The change in accounting standard means
 accounting values more accurately reflect economic value. This is essentially the justification the
 IASB gave for changing the accounting standard:48
 IFRS 16 will result in a more faithful representation of a company’s assets and liabilities and greater
 transparency about the company’s financial leverage and capital employed
 And: 49
 The IASB concluded that recognising assets and liabilities in essence for all leases provides a more
 faithful representation of the financial position of a company and greater transparency about the

42
 NZCC (2021), Market study into the retail grocery sector – Draft report, 29 July 2021, para C46.
43
 Being those that are due within 12 months. See: New Zealand External Reporting Board (EXAB), New Zealand
 Equivalent to International Accounting Standard 1 Presentation of Financial Statements (NZ IAS 1), November 2007,
 para.61&71. Available at: https://www.xrb.govt.nz/accounting-standards/for-profit-entities/nz-ias-1/
44
 The lease liability is part of current and non-current financial liabilities, depending on the timing of lease payments. See
 See ISAB (2016), p 42 and NZ IAS 1, para.71. Based on the NZCC’s formula, which adds back interest bearing current
 liabilities, we have assumed the current proportion of the lease liability does not affect capital employed, as it would net
 out by being subtracted as part of current liabilities and then added back as an interest bearing liability, given an interest
 expense is recognized for leases under IFRS 16.
45
 International Accounting Standards Board, IFRS 16 Leases – Effects Analysis, January 2016 (“ISAB (2016)”), p 27.
46
 See ISAB (2016).
47
 ISAB (2016), p 94.
48
 ISAB (2016), p 5.
49
 ISAB (2016), p 22.

© NERA Economic Consulting 14
The NZCC’s ROACE analysis has overstated WWNZ’s
 profitability

 company’s financial leverage and capital employed. This is expected to enable investors and analysts
 to better assess the financial position and financial performance of a company
54. The IASB further noted that the previous accounting standard (IAS 17) did not provide a
 complete picture of the assets (emphasis added):50
 Applying IAS 17, most leases were not reported on a lessee’s balance sheet. Consequently, a lessee did
 not provide a complete picture of:
 (a) the assets it controlled and used in its operations; and
 (b) the lease payments that, economically, it could not avoid.
55. A key benefit cited by IASB of including leased assets was that it would avoid the need for
 investors and analysts to make adjustments to financial statements to account for off balance sheet
 leases. Indeed, prior to 2015 Moody’s credit rating methodology made adjustments to the
 financial statements that essentially assumed that the entity had taken on debt to buy the asset.51
56. IFRS 16 in some sense therefore simply enshrined the adjustments that investors and analysts
 were already making to obtain a more complete view of the economic value of the assets (and
 liabilities) of firms.

2.3.4. Accounting for leased assets in the ROACE calculation has a
 material impact
57. There are two possible approaches to estimate the impact of leases on ROACE:
 a. Include the midpoint amount of goodwill that related to leases ($605m, from a range of
 $530m–$680m),52 but otherwise do not alter the ROACE calculation; or
 b. Use the annual lease payment to calculate a proxy ROACE calculation where the leased
 assets are capitalised.
58. The former approach gives a range of ROACE over 2015–2019 of 15.8 percent to 10.7 percent
 with an average of 13.3 percent compared to the NZCC’s estimate of 21.6 percent, a reduction of
 8.3 percentage points. We note this approach is only a proxy and would materially understate the
 value of leases today, which currently stand at $1.1b.
59. Regarding the latter approach, we have undertaken an illustrative calculation of WWNZ’s
 ROACE when leased assets are capitalised and included in the asset base. To do this, we have
 taken WWNZ’s actual lease expense for the years 2010–2019 and made a simple adjustment to
 include the leased assets in capital employed:53
 a. The lease expense is multiplied by 6.2 to obtain the lease asset value, where 6.2 is the lower
 bound lease multiple that WWNZ submitted should be used in its proposed goodwill

50
 ISAB (2016), p 22.
51
 In 2015 Moody’s changed methodology to one that has a similar in outcome to IFRS16 in that recognizes while leases are
 a form of finance, they can provide more flexibility than taking on debt and buying an asset. Thus the lease asset and
 liability would have a slightly different value compared to an assumption that the firm has borrowed and bought the asset.
 See ISAB (2016), p 25.
52
 See NZCC (2021), Market study into the retail grocery sector – Draft report, 29 July 2021, para C156.2
53
 The methodology for these adjustments generally follows NZ IFRS 16 for the initial measurement of lease assets and
 liabilities, and the methodology used by Moody’s to account for off balance sheet leases prior to IFRS 16. See: Moody’s
 (2015), Cross-Sector Rating Methodology: Financial Statement Adjustments in the Analysis of Non-Financial
 Corporations, June 2015. Available at: https://www.moodys.com/researchdocumentcontentpage.aspx?docid=PBC_181430

© NERA Economic Consulting 15
You can also read