UK Broadband Impact Study - Impact Report
←
→
Page content transcription
If your browser does not render page correctly, please read the page content below
UK Broadband Impact Study
               Impact Report
                 November 2013
UK Broadband Impact Study
                                                                                                            Impact Report

Contents

Foreword ............................................................................................................................ 1

Executive Summary .......................................................................................................... 2
1. Introduction ................................................................................................................... 6

2. Economic impacts ...................................................................................................... 11

3. Social impacts ............................................................................................................. 32
4. Environmental impacts .............................................................................................. 41

Annex A: List of model inputs/assumptions .............................................................. A-1

Contact:             David Mack-Smith                         Tel:     0131 243 0723         email:     dmacksmith@sqw.co.uk

                     Director, SQW

                                                                                                                www.sqw.co.uk
UK Broadband Impact Study
Impact Report
Foreword
There can be few areas of modern life which are not touched somehow by broadband
connectivity – whether it’s supporting how we work, how we learn, how we
communicate with friends and family, or how we entertain ourselves.
But how much will we benefit from improvements in broadband performance? And
what return will we see from the substantial public funds going into upgrading the
UK’s broadband infrastructure?
This report, commissioned by the Department for Culture, Media & Sport, addresses
these questions by assessing the economic, social and environmental impacts for the
UK from faster broadband, and from publicly funded intervention.
While recognising that there are still gaps in the empirical evidence base, and that
the future is inherently uncertain, the study’s projections are the outputs from a
rigorous and detailed analysis which draws on the best data currently available. Our
report has relevance for decision-making in a variety of policy areas, at national and
local levels. We hope you find it interesting and useful.
Chris Green
CEO, SQW Group
1UK Broadband Impact Study
Impact Report
Executive Summary
With the need to stimulate strong and sustainable growth and to ensure that the UK
can succeed in the global economy, it is vital to ensure that there is a good
understanding of the impacts of publicly funded interventions. Further improving
our understanding can inform future funding decisions and help maximise the value
for money of these investments.
Upgrading the UK’s broadband infrastructure is one area into which substantial
public funds are being invested. The Department for Culture, Media & Sport has
therefore initiated the first phase of the UK Broadband Impact Study, to build further
insights into the impacts of faster broadband. The study has been undertaken by a
consortium led by SQW, in partnership with Cambridge Econometrics and Dr
Pantelis Koutroumpis.
Central to this phase of the study has been the development of an integrated model
of the projected economic, social and environmental impacts associated with faster
broadband (i.e. increased broadband speeds since a baseline year of 2008), and of
those impacts attributable to the current set of publicly funded interventions to
improve broadband quality and coverage1. This has been informed by an extensive
literature review2, published in February 2013.
While acknowledging that there remain many uncertainties, the output from this
work is the most in-depth and rigorous forward-looking quantification of broadband
impacts developed to date in the UK.
Note that we do not, in this report, include any impacts associated with further
interventions resulting from the Government’s announcements3 in July 2013 on
extending superfast broadband to 95% of premises by 2017.
Economic impacts
Regarding the economic impacts, we estimate that the availability and take-up of
faster broadband speeds will add about £17 billion to the UK’s annual Gross Value
Added4 (GVA) by 2024. This level of uplift contributes an average of 0.07 percentage
points to real annual GVA growth over this period.
The GVA impacts attributable to the current set of publicly funded interventions rise
to about £6.3 billion p.a. by 2024, which is equivalent to an uplift of 0.03 percentage
points on the UK’s real annual GVA growth.
1Note that the scope of this study focuses on fixed broadband connectivity to business premises and homes. The
impacts associated with mobile broadband connectivity are not addressed here.
2
https://www.gov.uk/government/uploads/system/uploads/attachment_data/file/85961/UK_Broadband_Imp
act_Study_-_Literature_Review_-_Final_-_February_2013.pdf
3 http://www.broadbanduk.org/2013/07/30/dcms-publish-policy-paper-connectivity-content-and-
consumers-britains-digital-platform-for-growth/
4 Gross Value Added is a measure of economic output. It is closely linked to Gross Domestic Product, as follows:
GVA + taxes on products - subsidies on products = GDP
2UK Broadband Impact Study
Impact Report
Over our modelling period (to 2024), these interventions are projected to return
approximately £20 in net economic impact for every £1 of public investment.
This is an unusually high level of return for public funding, but we consider it to be
realistic, given that broadband is a General Purpose Technology which has an
increasingly critical role in the day-to-day operations of the majority of UK
businesses. The Government’s interventions are substantially improving the quality
of this technology across a significant proportion of the UK, which, in the long term,
will benefit hundreds of thousands of businesses, employing millions of people.
The bulk of this economic impact comes from improvements in the productivity of
broadband-using firms, as illustrated in the chart below, but there are also significant
benefits from safeguarding employment in areas which would otherwise be at an
unfair disadvantage, from productivity-enhancing time-savings for teleworkers, and
from increased participation in the labour force. The total net employment impacts
from faster broadband rise to about 56,000 jobs at the UK level by 2024, and about
20,000 jobs are attributable to the publicly funded intervention.
Figure 1: Total net annual GVA impact attributable to intervention – by type of impact (£
million, 2013 prices)
7,000
6,000
5,000
4,000
£ million
3,000
2,000
1,000
0
2009
2010
2011
2012
2013
2014
2015
2016
2017
2018
2019
2020
2021
2022
2023
2024
Increase in labour force participation Increase in teleworker productivity
Productivity growth of broadband-using enterprises Safeguarded enterprise employment
Source: UK Broadband Impact Model, SQW 2013
In addition (and excluded from the Benefit Cost Ratio cited above), the work involved
in constructing the subsidised networks, including multiplier effects, is expected to
account for a short-term total gross GVA impact of about £1.5 billion, with
approximately 35,000 job-years created or safeguarded over the period to 2016.
Social impacts
Beyond its economic impacts, broadband has, of course, become an integral part of
modern life, affecting various aspects of our day-to-day activities as individuals,
families and communities.
3UK Broadband Impact Study
Impact Report
The Government’s Universal Service Commitment for everyone to have access to at
least basic broadband (2Mbps+) will help to ensure that no areas are excluded from
the benefits of broadband and the internet.
However, as bandwidths available in urban areas have continued to advance rapidly,
there has been growing concern over the extent to which a new ‘digital divide’ is
emerging, to the disadvantage of those communities left with relatively poor levels of
broadband service.
Our analysis confirms that the interventions currently underway will have a material
impact on reducing the digital divide for both households and businesses.
In particular, the introduction of ‘FTTP on demand’ throughout BT’s FTTC footprint5
(which will be substantially increased through the Rural Programme intervention)
should have an important and sustained impact in putting the UK’s rural areas onto a
‘more level playing field’ as far as business connectivity is concerned.
For households, the current set of interventions goes a long way to addressing the
digital divide. However, as urban bandwidths continue to advance over time,
including through improvements in Virgin Media’s offerings and through new
entrant FTTP providers, households in the least densely populated areas could fall
further behind in relative terms.
This situation will be further addressed, however, following the Government’s
announcement in July 2013 to extend its target to 95% of premises having access to
superfast broadband by 2017, and to explore the measures needed to reach at least
99% by 2018.
Besides the digital divide issue, there are many other potential social impacts
associated with the availability and usage of faster broadband – as discussed in our
literature review. The complex and changing nature of the interactions between
people and technology mean that many of these social impacts are impossible to
forecast with any degree of confidence.
However, we have quantified some social impacts associated with changes in
teleworking. We estimate that the increase in teleworking facilitated by faster
broadband will save about 60 million hours of leisure time per annum in the UK by
2024 (of which about 10 million hours are attributable to publicly funded
intervention). By avoiding commuting costs, the additional teleworking enabled by
faster broadband will lead to total household savings rising to £270 million p.a. by
2024 (£45 million of which are attributable to intervention).
Environmental impacts
The availability and use of faster broadband will also have significant environmental
impacts. We estimate that, by 2024, it will save a total of:
5FTTP=Fibre to the Premises; FTTC=Fibre to the Cabinet. Note that ‘FTTP on demand’ is a service which will be
offered in FTTC-enabled areas. Its pricing differs from that of the mass market FTTP services offered in areas
enabled for FTTP.
4UK Broadband Impact Study
Impact Report
2.3 billion kms in annual commuting, predominantly in car usage, through
enabling increased telework for a proportion of the workforce. This is in the
order of 2% of the current total annual UK commuting distance.
5.3 billion kms in annual business travel, predominantly in car usage,
through the increased use of video and online collaboration tools by
broadband-using firms. This is in the order of 9% of the current total annual
UK business travel distance.
1 billion kWh of electricity usage p.a., through broadband-using firms
shifting part of their server capacity onto (more energy-efficient) public
cloud platforms.
Allowing for rebound effects (in particular, teleworkers needing to heat their homes
in the winter), we estimate that faster broadband will account for about 1.6 million
tonnes of carbon dioxide equivalent (CO2e) savings per annum, by 2024. This is
equivalent to about 0.3% of the UK’s current greenhouse gas emissions. Of these
CO2e savings, publicly funded intervention in faster broadband will account for
approximately 0.4 million tonnes p.a. by 2024.
5UK Broadband Impact Study
Impact Report
1. Introduction
Context
In recognition of broadband’s role as a key enabler for the nation’s socio-economic
development, the Government intends to establish world-class connectivity
throughout the UK.
To help achieve this goal, Broadband Delivery UK (BDUK) has put in place a number
of initiatives to improve broadband quality and coverage, in areas where there is an
insufficient case for operators to do so on a commercial basis, and to stimulate take-
up. These include the Rural Programme, the Rural Community Broadband Fund, and
the Urban Broadband Fund.
Including matched funding from local authorities, devolved administrations and
European sources as well as central government funds, these interventions represent
a very substantial public investment in improving the UK’s broadband infrastructure:
£1.6 billion of public funds have been committed to date6.
The UK Broadband Impact Study
With the need to stimulate strong and sustainable economic growth, it is vital to
ensure that there is a good understanding of the impacts of publicly funded
broadband interventions, in order to inform future funding decisions and to help
maximise the value for money of these investments.
The Department for Culture, Media & Sport (DCMS) therefore initiated the UK
Broadband Impact Study in November 2012, commissioning a consortium led by
SQW (with Cambridge Econometrics and Dr Pantelis Koutroumpis) to undertake the
first phase of the work.
Our study has developed an integrated model of the projected economic, social and
environmental impacts associated with faster broadband7 (i.e. increased broadband
speeds since the baseline year of 2008), and with publicly funded intervention in
improving broadband quality and coverage. This has been informed by an extensive
review of the available literature, the report of which8 was published in February
2013.
The model
As well as drawing on findings reported in the academic literature, the model
developed for this study has been informed by a review undertaken by Cambridge
6See DCMS. 2013. “Connectivity, Content and Consumers: Britain’s digital platform for growth”
7Note that the impacts of mobile broadband, and of BDUK’s Mobile Infrastructure Project are not within the
scope of this study.
8
https://www.gov.uk/government/uploads/system/uploads/attachment_data/file/85961/UK_Broadband_Imp
act_Study_-_Literature_Review_-_Final_-_February_2013.pdf
6UK Broadband Impact Study
Impact Report
Econometrics of broadband impact studies previously carried out for local
authorities and devolved administrations across the UK. The design of our model has
sought to expand on the best aspects of these previous approaches, while excluding
some mooted routes to impact which as yet appear to be too speculative, or
unsupported by the available evidence, in the study team’s opinion. We consider the
resulting analysis to be the most in-depth and rigorous forward-looking
quantification of broadband impacts developed to date in the UK – while recognising
the uncertainties inherent in this task.
Our model covers the period from 2008 to 2024 inclusive9. Impacts are estimated for
three different domains:
economic (in terms of net employment and net Gross Value Added impacts).
social (in terms of digital divide measures, and value to households from
teleworking)
environmental (in terms of net carbon dioxide equivalent - CO2e – emissions
saved).
For each of these, there are two types of impact:
the impact attributable to faster broadband speeds being available since the
baseline year, 2008
the impact attributable to the public sector interventions currently
underway on broadband (via the Rural Programme, Rural Community
Broadband Fund, and the Urban Broadband Fund).
Understanding the spatial aspects of broadband has been critical for our study:
broadband speeds vary by location, and the profile of broadband users also vary by
geography (in particular, in terms of the distribution of different sizes/sectors of
businesses). The choice of geographic unit for our analysis has therefore been
important. Too large a unit would obscure important differences through ‘averaging
out’ effects, while too small a unit would become unmanageable.
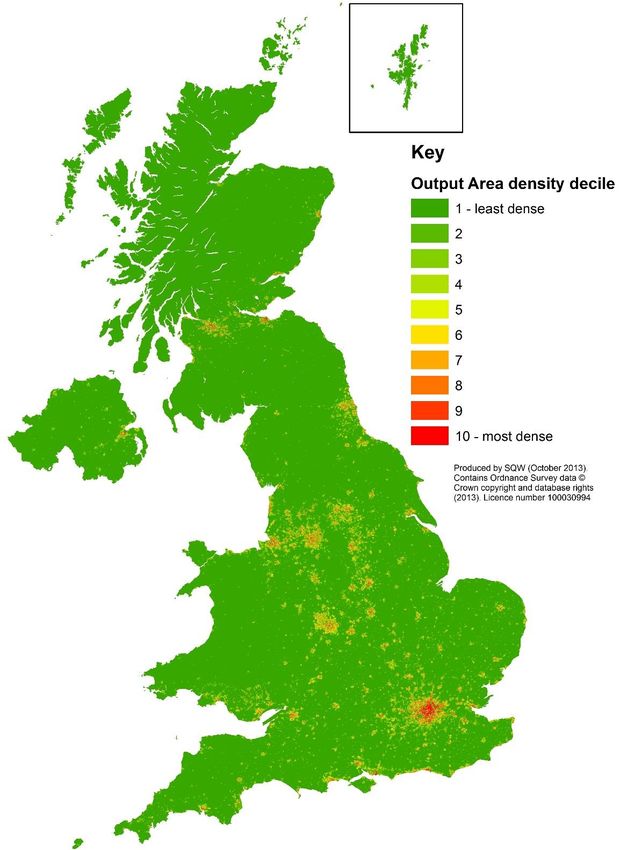
The approach chosen was to divide the UK into ten ‘density deciles’, ranging from the
10% of Census output areas10 with the fewest premises per square kilometre (sq
km), to the 10% of Census output areas with the most premises per sq km. Both
residential and business premises are included in this calculation. In broad terms,
this is designed to align with the commercial drivers for broadband roll-out:
operators tend to provide upgraded services to the most densely populated areas
first, where they have the lowest unit costs, and to the least densely populated areas
last, where they have the highest unit costs. This therefore allows us to analyse
9 2008 was chosen as the baseline year, as superfast broadband services first became available in the UK at the
end of that year, with the launch of Virgin Media’s 50Mbps service.
10 There are about 220,000 output areas in the UK. They are designed to cover roughly similar populations, and
therefore vary in area: from less than 0.001 sq km in some city neighbourhoods to 200 sq km + in the most
rural areas.
7UK Broadband Impact Study
Impact Report
geographic differences in broadband speed, and so understand the geographic
differences in impacts.
These density deciles are illustrated in the map below, which shows the least dense
areas in dark green, and the densest areas in red. While it is striking that the least
dense decile covers the vast majority of the UK’s land mass, it should be remembered
that it only accounts for about 10% of premises.
Figure 1-1: Map of the UK by the ‘density deciles’ of Census Output Areas (1= the 10% of
UK Output Areas with fewest premises per sq km, in dark green)
Source: SQW analysis
8UK Broadband Impact Study
Impact Report
Links from speeds to impacts
The underlying hypothesis for our model is that speed matters: faster broadband will
enable businesses and individuals to change the way they do things. Moreover, the
last decade has seen significant improvements in the broadband speeds available in
the UK, and we envisage that this trend will continue throughout our modelling
period – driven by competition between operators, technological improvements in
the capabilities and costs of network equipment, and by the adoption of increasingly
bandwidth-hungry applications, notwithstanding improvements in data compression
techniques.
In order to capture the effect of continuing improvements in broadband speed over
time, we have incorporated explicit links between the projected broadband speeds
available, the projected speeds used, and their projected net impacts. For some
impacts, it is the relative broadband speed (i.e. the speed available in an area
compared with the national average) that is the key driver, rather than the absolute
speed.
Given that upstream speeds are important, as well as downstream speeds, (e.g. for
cloud computing and video applications), we have reflected this in the model by
combining the two into a notional ‘total speed’.
Inputs and assumptions
A list of the model’s inputs and assumptions is provided in Annex A. Each of these
has been calibrated using the best information currently available, and the rationale
and/or source for each input/assumption has been set out within the model.
It is recognised, however, that there are currently considerable uncertainties
inherent in many of the assumptions. For the purposes of this study, we have used
what we consider to be conservative assumptions in these cases, and the model has
been designed so that such inputs can be updated as and when better information
becomes available.
Displacement and multipliers
Impacts for direct beneficiaries of faster broadband can have knock-on effects in the
wider economy. Where appropriate, the model therefore includes assumptions on
‘displacement’ and ‘multiplier’ effects, in calculating the net economic impacts for the
UK:
Displacement captures the effect of increased growth in directly affected
businesses being at the expense, to some extent, of lower growth for their
competitors elsewhere in the UK.
Multipliers capture the effect of increased growth in directly affected
businesses leading to indirect benefits (in their supply chains), and to
‘induced’ benefits (though their employees spending wages in the economy).
9UK Broadband Impact Study
Impact Report
Monte Carlo simulation
We have incorporated Monte Carlo simulation functionality in the model, in order to
explore the probability distributions of inputs and outputs. Model
inputs/assumptions to which Monte Carlo distributions have been applied are
highlighted in bold in Annex A.
Testing
The model has been developed by SQW, with advice from Dr Koutroumpis on certain
assumptions, and subjected to independent testing by Cambridge Econometrics, to
verify its correct working, logical consistency, usability, and fitness for purpose.
This report
Our report takes each domain in turn: economic impacts (section 2), social impacts
(section 3) and environmental impacts (section 4). Not all potential impacts have
been quantified in our model, and where appropriate we briefly discuss other types
of impacts in qualitative terms.
Unless otherwise specified, all £ values are in 2013 prices.
10UK Broadband Impact Study
Impact Report
2. Economic impacts
Routes to economic impact
The key modelled There are various mechanisms through which faster broadband, and publicly funded
routes to economic
impact are:
investment into faster broadband, can lead to economic impacts for the UK. As an
productivity growth infrastructure investment, broadband network deployment produces spillover
of broadband-using effects to all sectors of the national economy. The adoption of faster broadband by
enterprises;
safeguarding of local firms stimulates further investment in wider Information and Communications
enterprise Technology (ICT) systems and applications taking advantage of the improved
employment;
improved teleworker connectivity, and results in business process restructuring, more informed decision
productivity; and making, and productivity gains. Faster broadband also helps to support the creation
increased labour
force participation
of new businesses, and the easier access to market information helps to reduce
barriers to entry – though this may be at the expense of the decline of more
traditional businesses in sectors which are disrupted by the new technology.
Continual improvements in broadband service offerings, for both business and
consumer markets, stimulate innovation in business models, and this serves to
improve overall productivity levels in the economy. Outsourcing of processes and
operations is made easier for small businesses, which helps them focus on improving
their core strengths while reducing operational costs.
The ‘routes to impact’ which we have modelled are as follows:
Productivity growth of broadband-using enterprises. It is now widely
accepted that the availability and adoption of affordable broadband plays an
important role in increasing productivity in national economies – through,
for example, supporting the development of new, more efficient, business
models, enabling business process re-engineering to improve the efficiency
and management of labour intensive jobs, and enabling increased
international trade and collaborative innovation. Our model includes
estimates of the average increase in the broadband speeds used by
businesses each year (by industry group, size band and density decile), and
the extent of the associated productivity benefits.
Safeguarding of local enterprise employment. Broadband – and faster
broadband in particular – has a complex relationship with employment
creation at a national level. There appears to be a ‘creative destruction’ effect
at work, in which employment growth may be suppressed to some extent by
improvements in business process efficiency (businesses doing more with
less), while the better connectivity also leads to employment growth
opportunities through new business models and emerging sectors. There is
more consensus in the literature, however, that the relative availability and
quality of broadband has a significant impact on employment growth at a
local level: areas with poor broadband lose out to areas with better
connectivity. Our model assumes that if there were a persistent and
widening digital divide, then this local effect would lead to adverse national
level impacts over time, as jobs lost or foregone in areas with poor
11UK Broadband Impact Study
Impact Report
broadband (which might, for example, also have advantages in other
respects, such as relatively low accommodation costs or labour costs) would
not be entirely replaced by jobs created in areas with good connectivity.
Publicly funded intervention, to reduce the digital divide, can therefore help
safeguard net employment and the associated GVA at the UK level, as well as
at local levels.
Teleworker productivity. As levels of connectivity at home improve, this
will tend to encourage higher levels of working from home – the majority of
which will be people working a few days per month from home, rather than
teleworking full-time. While some have argued that employees can be
inherently more productive when working at home, our model takes a
relatively conservative view, assuming that a certain proportion of the time
saved by not commuting on a telework-day is spent on work: i.e. adding to
the employee’s productive hours per day, rather than making those hours
more efficient.
Labour force participation. The ability to work from home, using improved
levels of connectivity, also reduces the barriers to employment for certain
parts of the working age population. In particular, we have assumed that a
proportion of carers (i.e. people who are economically inactive, because they
are looking after the home or family members) would be willing and able to
take up part-time employment based at home, and that the prevalence of this
will increase as levels of home connectivity improve over time. Similarly, we
have assumed that a proportion of unemployed disabled people would find it
easier to find and retain suitable work if this were based at their own homes
(levels of unemployment for disabled people have historically been
persistently significantly higher than those for the workforce as a whole) –
and again, that the prevalence of this will increase as levels of home
connectivity improve over time.
Network construction Network construction impacts. The investment of public funds into faster
impacts have been
calculated, but are broadband infrastructure, together with the leveraged private sector
not included in our investment, itself creates (or safeguards) economic activity in the relevant
value for money
assessment
telcos and their supply chains in the construction phase: e.g. in
manufacturing the required additional equipment, undertaking civil
engineering for new ducts, installing new fibre cable and cabinets etc. Our
model generates estimates for the gross employment and GVA effects
associated with this activity – though we have excluded this in our
assessment of the value for money of the intervention, as we have assumed
that the public funds could otherwise be used for other construction projects
(i.e. there would be 100% ‘deadweight’ on the construction impacts).
We have not Our focus is on the net Gross Value Added impact for the UK – i.e. how much higher
assumed any
impacts on public
the UK’s GVA may be, as a result of faster broadband, and as a result of publicly
sector GVA, nor funded intervention. We have therefore excluded the following from our analysis:
included any
consumer surplus Changes in the GVA associated with the public sector itself (which would
largely consist of the employment costs associated with public sector
12UK Broadband Impact Study
Impact Report
employees). Public sector GVA will be constrained by national budgets for
public expenditure, and we have not assumed that the advent of faster
broadband will lead to an increase in public expenditure in the foreseeable
future, given the need for deficit reduction (this is not to say that faster
broadband will have no productivity benefits for the public sector; it will, in
terms of improved service delivery, and being able to do more with less).
Any measures of ‘consumer surplus’. Some studies have estimated the
consumer surplus associated with faster broadband (that is, the aggregated
difference between what consumers would be willing to pay for faster
broadband and its market price). While this is a valid theoretical approach (if
problematic for forward-looking studies, given the rapid changes in quality
and price), consumer surplus makes no contribution to the UK’s GVA, and we
have therefore not included it in our economic impact assessment.
Economic impacts for the UK of faster broadband
First we report our findings on the economic impacts for the UK of faster broadband:
i.e. the impacts attributable to the availability and use of speeds faster11 than those
available in our baseline year of 2008, over the period 2009 to 2024.
Productivity of broadband-using firms
In estimating the productivity impacts of faster broadband, we have taken into
account the following considerations:
The distribution of businesses varies by geography. We have used data
for 2008 provided by the Office for National Statistics (ONS), on the count of
private sector ‘local units’ and employment for each of six broad industry
groups12, in four size bands13, at detailed levels of geography14, and derived
estimates of the associated counts and employment for each of our density
deciles.
Not all businesses will be using (mass market) broadband for their
primary connectivity. Our study is focused on the impacts of mass market
broadband services – i.e. ‘affordable broadband’ for SMEs and households.
More expensive business connectivity services – such as traditional leased
lines, and the newer Ethernet leased lines – are not included in our analysis.
Hence only a proportion of each size band’s businesses are assumed to be
11 Note that this uses the ‘with intervention’ scenario
12 The six broad industry groupings, using SIC2007 sections, are: A (Agriculture, forestry and
fishing); B,D&E (Mining and quarrying; Electricity, gas, steam and air conditioning supply; Water supply;
sewerage, waste management and remediation activities); C&F (Manufacturing; Construction); G,H&I
(Wholesale and retail trade, repair of motor vehicles and motor cycles; Transport and storage; Accommodation
and food service activities); J,K,L,M&N (Information and communication; Financial and insurance activities;
Real estate activities; Professional, scientific and technical activities; Administrative and support service
activities); P,Q,R&S (Education; Human health and social work activities; Arts, entertainment and recreation;
Other service activities)
13 Employment levels of: 1 to 9; 10 to 49; 50 to 199; and 200+
14 Middle-layer Super Output Area in England & Wales, Super Output Area in Northern Ireland, and Datazone in
Scotland
13UK Broadband Impact Study
Impact Report
‘broadband-using’ (a much lower proportion for large businesses than for
micro businesses).
The broadband speeds available to businesses vary by geography, and
will continue to change over time. We have analysed postcode-level data
provided by BDUK (based on information provided by operators) on the
current coverage of different technologies, and developed our own estimates
of the additional coverage through intervention. This has been combined
with projections as to how the availability and speeds of various
technologies may continue to increase over time, in order to derive estimates
of the coverage and speeds available to businesses, by density decile, and by
year over the modelling period. See Figure 3-4 in the next section for the
resulting modelled speeds available to businesses by density decile.
There are lags associated with businesses taking up the newly available
speeds. It takes time for increases in speed to be taken up across the
business base, hence the average used speeds will be considerably lower
than the maximum available speeds; we have assumed lags dependent on the
size of business – up to ten years for each year’s increase in available speed
to diffuse, in the case of the smallest firms (employing 1 to 9 people).
There are further lags associated with businesses realising productivity
impacts from their improved connectivity. An improvement in a firm’s
connectivity does not lead to an immediate step-change in productivity. It
takes time to implement process changes – potentially involving other
complementary investments in systems and training – in order to realise the
productivity benefits. We have assumed that it takes three years for the
productivity shock associated with each year’s increase in used speed to be
fully realised.
The productivity impacts of increased speeds are, as yet, highly
uncertain. Our model uses a curve describing the average productivity
shock associated with varying levels of in-year speed increase, ranging from
0% (at a speed increase of 0%) up towards a defined maximum towards
which the curve asymptotes. The shape of the curve is principally driven by
an assumption on the impact of a doubling of speed, for which our central
estimate is 0.3% (i.e. an increase of 100% in the used speed in a year will
lead to a 0.3% uplift in productivity, over the following three year period; the
incremental benefits of greater speed increases progressively decline until
the impact curve ‘saturates’). As superfast broadband has only been
introduced relatively recently, evidence of the relationship between
broadband speed and productivity has yet to be fully addressed in the
academic literature. However, we have drawn on some recent research
findings that help approach the issue from a different angle. Using quality-
adjusted deflators for telecommunications equipment prices, researchers
from Imperial College and the Bank of England estimated the recent impact
of telecommunications on UK productivity growth through capital deepening
14UK Broadband Impact Study
Impact Report
and spillovers15. By applying our own estimates of the time taken for
broadband speeds to double, and of the share for broadband connectivity of
this overall impact of telecommunications, we have derived the above
estimate of the productivity impact associated with a doubling of speeds. It
also aligns (if we assume no significant net employment effect) with research
by Chalmers University of Technology16, which found that a doubling of
speed is associated with a 0.3 percentage point increase in GDP growth,
using a macroeconomic framework for OECD countries. As this is a
particularly important - but uncertain - assumption in our model, we have
applied a Monte Carlo probability distribution (using a triangular
distribution ranging from 0.19% to 0.44%), such that the effects of this
uncertainty are reflected in the outputs from the Monte Carlo simulations.
The productivity impacts of increased speeds will vary by sector. The
productivity performance of some sectors is much more dependent on ICT,
including connectivity, than that of others. We have used estimates from
Cambridge Econometrics of the average GVA per employee, as of 2008, in
each of our six broad industry groups, and varied the above average
productivity effects depending on their relative ICT intensity, based on
information from the EU KLEMS database on the consumption of ICT fixed
capital vs the total consumption of fixed capital in the year 2007, by sector.
The results of our analysis of the enterprise productivity impacts attributable to
faster broadband are illustrated in Figure 2-1 and Figure 2-2 below, showing the
breakdown by industry group, and by size of firm respectively.
Annual enterprise Overall, we estimate that the availability and exploitation of faster broadband will
productivity impacts
rise to £14 billion by
lead to a net annual GVA impact of about £14 billion by 2024, through enhancing the
2024 productivity of broadband-using firms. The largest shares of this are for the JKLM&N
industry group17 (which is the most ICT-intensive), and for the 1 to 9 employment
size band (which is the most dependent on this mass market broadband
connectivity).
15 Goodridge, Peter, Jonathan Haskel, and Gavin Wallis. 2013. “The ‘C’ in ICT : Communications Capital,
Spillovers and UK Growth.”
16 Rohman, Ibrahim Kholilul, and Erik Bohlin. 2012. “Does Broadband Speed Really Matter for Driving Economic
Growth? Investigating OECD Countries.”
17 Information and communication; Financial and insurance activities; Real estate activities; Professional,
scientific and technical activities; and Administrative and support service activities
15UK Broadband Impact Study
Impact Report
Figure 2-1: Net annual GVA impact from productivity growth for broadband-using firms,
attributable to faster speeds since 2008 – by industry groups18
16,000
14,000
12,000
10,000
£ million
8,000
6,000
4,000
2,000
0
2009
2010
2011
2012
2013
2014
2015
2016
2017
2018
2019
2020
2021
2022
2023
2024
A BDE CF GHI JKLMN PQRS
Source: UK Broadband Impact Model, SQW 2013.
Figure 2-2: Net annual GVA impact from productivity growth for broadband-using firms,
attributable to faster speeds since 2008 – by size of firm (employment)
16,000
14,000
12,000
10,000
£ million
8,000
6,000
4,000
2,000
0
2009
2010
2011
2012
2013
2014
2015
2016
2017
2018
2019
2020
2021
2022
2023
2024
1 to 9 10 to 49 50 to 199 200+
Source: UK Broadband Impact Model, SQW 2013
18Key: A (Agriculture, forestry and fishing); B,D&E (Mining and quarrying; Electricity, gas, steam and air
conditioning supply; Water supply; sewerage, waste management and remediation activities); C&F
(Manufacturing; Construction); G,H&I (Wholesale and retail trade, repair of motor vehicles and motor cycles;
Transport and storage; Accommodation and food service activities); J,K,L,M&N (Information and
communication; Financial and insurance activities; Real estate activities; Professional, scientific and technical
activities; Administrative and support service activities); P,Q,R&S (Education; Human health and social work
activities; Arts, entertainment and recreation; Other service activities)
16UK Broadband Impact Study
Impact Report
Teleworker productivity
We have assumed that teleworker productivity impacts are additional to the
enterprise-level productivity impacts estimated above, because the teleworker
impacts will accrue to firms which are not ‘broadband-using’ (e.g. large corporates
with teleworking employees) as well as those firms using mass market broadband.
Our analysis combines assumptions and data on the following:
The proportion of employed people who are ‘telework-eligible’ varying by
Standard Occupational Classification (averaging 48% of all employed
people); the distribution of occupations by density decile, using census data;
and estimates of the proportion of telework-eligible employees who do
telework to some extent, by year – rising from 40% in 2008 to 72% in 2024.
Of these, only the proportion employed in the private sector are assumed to
contribute to a net GVA effect.
A curve estimating the relationship between days per year teleworked and
the average used household speed (including a saturation level), and
estimates of the relative propensity to telework by density decile, derived
from an analysis of census data on those working mainly at or from home.
The average duration of a two-way commute, by density decile, using data
from the census and from the National Travel Survey (44 to 78 minutes); the
proportion of saved time used for work (we have assumed 60%, based on a
previous Cisco survey); and the average GVA per hour worked.
Displacement and multiplier assumptions.
Annual teleworker As shown in Figure 2-3, the net GVA impact from the teleworker productivity effect
productivity impacts
reach £1.8 billion by
rises to £1.8 billion p.a. by 2024. Roughly half is from teleworkers living in the three
2024 least dense deciles – which have above-average proportions of telework-eligible
employees, where people have the longest average commutes, and where there is the
highest propensity to telework.
17UK Broadband Impact Study
Impact Report
Figure 2-3: Net annual GVA impact from increased teleworker productivity, attributable
to faster speeds since 2008 – by density decile of their home area (1=least dense)
2,000
1,800
1,600
1,400
1,200
£ million
1,000
800
600
400
200
0
2009
2010
2011
2012
2013
2014
2015
2016
2017
2018
2019
2020
2021
2022
2023
2024
1 2 3 4 5 6 7 8 9 10
Source: UK Broadband Impact Model, SQW 2013
Labour force participation
We assume that improved home connectivity will help to expand the UK’s labour
capacity, through increased participation of carers and disabled people. Our
estimates combine data and assumptions on the following:
The numbers of working age people who are economically inactive due to
looking after the home or family members, by density decile; the proportion
of these who would like a job; and proportion of these who would be
telework-eligible.
The number of unemployed disabled people, by density decile, and the
proportion of these who would be telework eligible.
Curves estimating the proportions of telework-eligible carers and
unemployed disabled people gaining home-based employment, as functions
of the average used household speed (including saturation levels).
GVA per additional worker (assumed to be full-time for disabled people, and
part-time for carers).
Displacement and multiplier assumptions.
Annual impacts from The resulting net GVA impacts from increased labour force participation rise to
increased labour
force participation
about £1.4 billion p.a. by 2024 (Figure 2-4). In this case, there are more impacts for
rise to £1.4 billion by denser areas than for the less dense areas – partly due to the distribution of potential
2024
beneficiaries (e.g. in 2008 there were more than twice as many unemployed disabled
people in density decile 10 than in decile 1), and partly due to the higher speeds
available in urban areas.
18UK Broadband Impact Study
Impact Report
Figure 2-4: Net annual GVA impact from increased participation of carers and disabled
people, attributable to faster speeds since 2008 – by density decile of their home area
(1=least dense)
1,600
1,400
1,200
1,000
£ million
800
600
400
200
0
2009
2010
2011
2012
2013
2014
2015
2016
2017
2018
2019
2020
2021
2022
2023
2024
1 2 3 4 5 6 7 8 9 10
Source: UK Broadband Impact Model, SQW 2013
Total economic impacts
Total annual net
GVA impacts rise to In total then, we estimate that the net annual GVA impacts for the UK, attributable to
£17 billion by 2024. faster broadband speeds since 2008, will rise to about £17 billion by 2024 (Figure
2-5). Of this, approximately £4.6 billion will accrue to ‘rural’ areas (where ‘rural’
means those Census Output Areas not flagged as being in towns and cities with
resident populations of more than 10,000, which accounts for about 22% of UK
premises).
This is equivalent to To put this into context, the UK’s total GVA in 2008 was £1.44 trillion in 2013 prices
a contribution of
0.074 percentage
(£1.29 trillion in 2008 prices). So this level of uplift would correspond to an average
points to the UK’s contribution from faster broadband of about 0.074 percentage points (pp) to real
real annual GVA annual GVA growth over the period 2009 to 2024 (cf the current Office of Budget
growth over the
period Responsibility forecast of real GDP growth rising to 2.8% p.a. by 2017). Given that
broadband is a General Purpose Technology which has an increasingly critical role in
the day-to-day operations of the majority of UK businesses, this estimated level of
uplift does not seem unreasonable.
19UK Broadband Impact Study
Impact Report
Figure 2-5: Total net annual GVA impact, attributable to faster speeds since 2008 – by
type of impact
20,000
18,000
16,000
14,000
12,000
10,000
£ million
8,000
6,000
4,000
2,000
0
2009
2010
2011
2012
2013
2014
2015
2016
2017
2018
2019
2020
2021
2022
2023
2024
Increase in labour force participation
Increase in teleworker productivity
Productivity growth of broadband-using enterprises
Source: UK Broadband Impact Model, SQW 2013
There are, however, many uncertainties inherent in the assumptions which combine
to generate this estimate. We have assigned probability distributions to the
assumptions which we consider to be most uncertain, with ranges around our ‘most
likely’ estimate for each19.
The resulting range of values for the net annual GVA impact in 2024 is illustrated in
the chart below, from a Monte Carlo simulation using 10,000 trials, 90% of which
return values between £14 billion and £23 billion (equivalent to a contribution to
real annual GVA growth over the period of between 0.060pp and 0.099pp).
19For simplicity, and to avoid spurious accuracy, we have applied triangular distributions, rising from 0%
probability at the lower bound to a peak probability at the most likely value, then falling again to 0% probability
at the upper bound.
20UK Broadband Impact Study
Impact Report
Figure 2-6: Monte Carlo distribution for the net annual GVA impact (£ billion) in the year
2024, attributable to faster speeds since 2008 (10,000 trial simulation)
1600
1400
1200
1000
Number of trials
800
600
400
200
0
0 5 10 15 20 25 30 35 40 45 50
Net annual GVA impact in 2024 (£ billion)
Source: UK Broadband Impact Model, SQW 2013
Net employment The total net employment impacts rise to about 56,000 jobs by 2024 – consisting of
impacts rise to about
54,000 jobs by 2024
40,000 from the participation of carers, and 16,000 from (otherwise unemployed)
disabled people. As illustrated in the Monte Carlo chart below, there is a relatively
high degree of uncertainty around this employment impact estimate – with 90% of
the trials returning results between 30,000 and 80,000 jobs.
Figure 2-7: Monte Carlo distribution of the net employment impact by the year 2024,
attributable to faster speeds since 2008 (10,000 trial simulation)
600
500
Number of trials
400
300
200
100
0
0 10 20 30 40 50 60 70 80 90 100
Net employment impact by 2024 (thousands of jobs)
Source: UK Broadband Impact Model, SQW 2013
21UK Broadband Impact Study
Impact Report
Economic impacts of public sector intervention
In order to assess the economic impacts attributable to public sector intervention, our
model includes estimates of the ‘with intervention’ and ‘without intervention’
scenarios. The economic impact associated with intervention is simply the difference
between the two net GVA impact time series.
The with-intervention The with-intervention scenario incorporates:
scenario includes
the current Rural
additional coverage of primarily FTTC-based services through the current
Programme, RCBF
and UBF initiatives Rural Programme (including the pre-BDUK projects in Northern Ireland and
Cornwall) – and the associated availability of ‘FTTP on demand’ across BT’s
FTTC footprint from 2014 (which we have assumed will be affordable for
businesses, though not for households)
additional coverage of faster broadband services through the Rural
Community Broadband Fund; in the absence of information yet being
available on the specific implementations, we have assumed20 a mix of FTTC
and FTTP for these projects, covering additional premises – predominantly
in the least dense deciles
an acceleration in the business take-up of higher speeds, through the Urban
Broadband Fund’s voucher scheme, which we have assumed will reach about
35,000 businesses over the period 2013 to 2015 in urban areas.
Note that we do not, in this report, include any impacts associated with further
interventions resulting from the Government’s announcements21 in July 2013 on
extending superfast broadband to 95% of premises by 2017, and exploring the
measures needed to reach at least 99% by 2018.
Safeguarding of local enterprise employment
Without intervention, we assume that the least densely populated areas of the UK
would increasingly suffer significant losses of enterprises and employment, as a
result of businesses having broadband connectivity which falls further and further
behind that available to competitors in urban areas (in the UK and overseas). While a
majority of these lost jobs would probably be displaced into the UK’s urban areas
(through business re-locations, or through urban competitors growing faster at the
expense of their rural competitors), a proportion would not – bearing in mind that
the rural locations may have other factors contributing to business competitiveness
such as lower accommodation costs, and/or lower labour costs, and remembering
that small businesses are increasingly accessing global markets through e-commerce,
in which they are competing more with overseas firms than with UK firms.
20 We have had to make some assumption on the mix of RCBF technologies for modelling purposes. This is not
intended to be a prediction of the outcomes of the projects’ procurement decisions.
21 http://www.broadbanduk.org/2013/07/30/dcms-publish-policy-paper-connectivity-content-and-
consumers-britains-digital-platform-for-growth/
22UK Broadband Impact Study
Impact Report
Hence, by mitigating the digital divide in the geographic coverage of faster
broadband, public sector intervention has an economic impact through safeguarding
employment, and the associated GVA, that would otherwise be lost to the UK.
In developing estimates of these impacts, our model uses a concept of ‘Relative
Broadband Quality’ (RBQ), which is the indicative speed available in each decile
divided by the national average22. The densely populated areas of the UK typically
therefore have an RBQ of greater than 1.0, while the least dense deciles typically
have an RBQ of less than 1.0, though the values change over time.
We have constructed curves which estimate the annual growth of enterprises and
employment in an area as a function of Relative Broadband Quality in that year. The
shapes of these curves have been informed by an analysis of the differences between
the years 2008 and 2012 in the number of business sites and employment in each
density decile, using data from ONS. This analysis found no convincing growth trends
across density deciles for 10+ employment size bands, but there was a modest
positive trend for higher growth with increasing density for the count of 1 to 9
employment firms23. Adjusting for the proportion of this trend that can be attributed
to changes in RBQ24, our curve for the 1 to 9 employment size band results in annual
growth rates of, for example, -0.05% at an RBQ of 0.5, and +0.03% at an RBQ of 1.5.
The curves for 10+ employment size bands have been ‘zeroed out’, as no clear
relationship was observed in the historic data. That is, the safeguarding employment
impact is effectively only assumed to be relevant to the 1 to 9 employment size band.
By 2024, net annual The net annual GVA impact from this effect, attributable to intervention, is estimated
GVA impacts
attributable to
to rise to about £0.8 billion by 2024. As shown in Figure 2-8, the benefits to the least
intervention include: dense areas are offset to some extent by modest negative net impacts for the most
£0.8 billion from dense areas (as the cities, in the absence of the Government’s interventions, would
safeguarding local
enterprise have otherwise grown at the expense of the less connected rural areas).
employment…
22 For these impacts, it is the speed available to businesses (rather than to households) which is used. ‘The
‘national average’ is taken to be the mean of the speeds available in the 5 th and 6th density deciles.
23 For this size band, between 2008 and 2012, growth in the count of local units was -1.9% in decile 1, vs +1% in
decile 10, corresponding to annual growth rates of -0.5% and +0.2%.
24 Using the R-squared value of 0.25 found for the correlation between local unit count growth and RBQ, for this
size band
23UK Broadband Impact Study
Impact Report
Figure 2-8: Net annual GVA impact from safeguarded employment in local enterprises,
attributable to intervention – by density decile
1,000
800
600
£ million
400
200
0
-200
2009
2010
2011
2012
2013
2014
2015
2016
2017
2018
2019
2020
2021
2022
2023
2024
1 2 3 4 5 6 7 8 9 10
Source: UK Broadband Impact Model, SQW 2013
Productivity growth of broadband-using firms
…£5 billion from Comparing the two scenarios, we find that about £5 billion in net annual GVA
productivity growth
for broadband-using
impacts are attributable to intervention by 2024. As with the overall impacts of
firms… faster broadband, the largest contributions to this come from the JKLM&N industry
group25 (Figure 2-9) and the 1 to 9 employment band (Figure 2-10).
Figure 2-9: Net annual GVA impact from productivity growth for broadband-using firms,
attributable to intervention – by industry groups
6,000
5,000
4,000
£ million
3,000
2,000
1,000
0
2009
2010
2011
2012
2013
2014
2015
2016
2017
2018
2019
2020
2021
2022
2023
2024
A BDE CF GHI JKLMN PQRS
Source: UK Broadband Impact Model, SQW 2013
25Information and communication; Financial and insurance activities; Real estate activities; Professional,
scientific and technical activities; and Administrative and support service activities
24UK Broadband Impact Study
Impact Report
Figure 2-10: Net annual GVA impact from productivity growth for broadband-using firms,
attributable to intervention – by size of firm (employment)
6,000
5,000
4,000
£ million
3,000
2,000
1,000
0
2009
2010
2011
2012
2013
2014
2015
2016
2017
2018
2019
2020
2021
2022
2023
2024
1 to 9 10 to 49 50 to 199 200+
Source: UK Broadband Impact Model, SQW 2013
Teleworker productivity
…£0.3 billion from The net annual GVA impacts attributable to intervention from improved teleworker
improved teleworker
productivity…
productivity reach almost £0.3 billion by 2024 (Figure 2-11), with the bulk of these
impacts in the three least dense deciles of the UK (where there are most teleworkers,
and where the bulk of the intervention investment is focused).
Figure 2-11: Net annual GVA impact from increased teleworker productivity, attributable
to intervention – by density decile of their home area (1=least dense)
350
300
250
200
£ million
150
100
50
0
2009
2010
2011
2012
2013
2014
2015
2016
2017
2018
2019
2020
2021
2022
2023
2024
1 2 3 4 5 6 7 8 9 10
Source: UK Broadband Impact Model, SQW 2013
25UK Broadband Impact Study
Impact Report
Labour force participation
…and £0.2 billion Net annual GVA impacts attributable to intervention from improved participation of
from increased
labour force
carers and disabled people reach almost £0.2 billion by 2024 (Figure 2-11). This
participation equates to about 5,000 additional carers and about 1,900 additional disabled people
gaining employment through telework, who would not have been able to do so in the
absence of the Government’s intervention in faster broadband.
Figure 2-12: Net annual GVA impact from increased participation of carers and disabled
people, attributable to intervention – by density decile of their home area (1=least dense)
250
200
150
£ million
100
50
0
2009
2010
2011
2012
2013
2014
2015
2016
2017
2018
2019
2020
2021
2022
2023
2024
1 2 3 4 5 6 7 8 9 10
Source: UK Broadband Impact Model, SQW 2013
Network construction impacts
Drawing on data provided by BDUK, we calculate that the total capital expenditure –
including both public and private sector funding – associated with the current set of
interventions will amount to approximately £1.7 billion. This is spread over the
period 2009 to 2016, with the expenditures up to 2012 predominantly associated
with the pre-BDUK projects in Northern Ireland and Cornwall.
Network construction Assuming a type 2 employment effect26 of 20 job-years per £1 million of investment,
accounts for 35,000
job-years…
this suggests that the network construction accounts for a total of about 35,000 job-
years in the UK economy over the 2009 to 2016 period, peaking at about 11,000 jobs
in 2014.
…and the gross Using a type 2 ‘GVA effect’27 of 0.9, we estimate that the gross GVA impact will total
annual GVA impacts
peak at about £0.5
about £1.5 billion over the period, with the annual impact peaking at about £0.5
billion in 2014 billion in 2014, as shown in Figure 2-13.
26 This is informed by OffPAT guidance from 2009. Type 2’ captures both the indirect effects associated with the
supply chain, and the induced effects associated with employees spending their wages in the economy.
27 This uses the value from the Scottish Input-Output tables for specialised construction in 2009. ‘A GVA effect of
0.9 means that each £1m of additional expenditure results in £0.9m in GVA.
26You can also read