Monitoring of the atmospheric ozone layer and natural ultraviolet radiation
←
→
Page content transcription
If your browser does not render page correctly, please read the page content below
Monitoring of the
atmospheric ozone layer and
 natural ultraviolet radiation
                                           Annual Report 2020
   Tove M. Svendby1), Georg H. Hansen1), Are Bäcklund1), Anne-Cathrine
                          Nilsen1), Dorothea Schulze1), Bjørn Johnsen2)
                       1) NILU – Norwegian Institute for Air Research, Norway
              2) DSA Norwegian Radiation and Nuclear Safety Authority, Norway

                                      NILU report 18/2021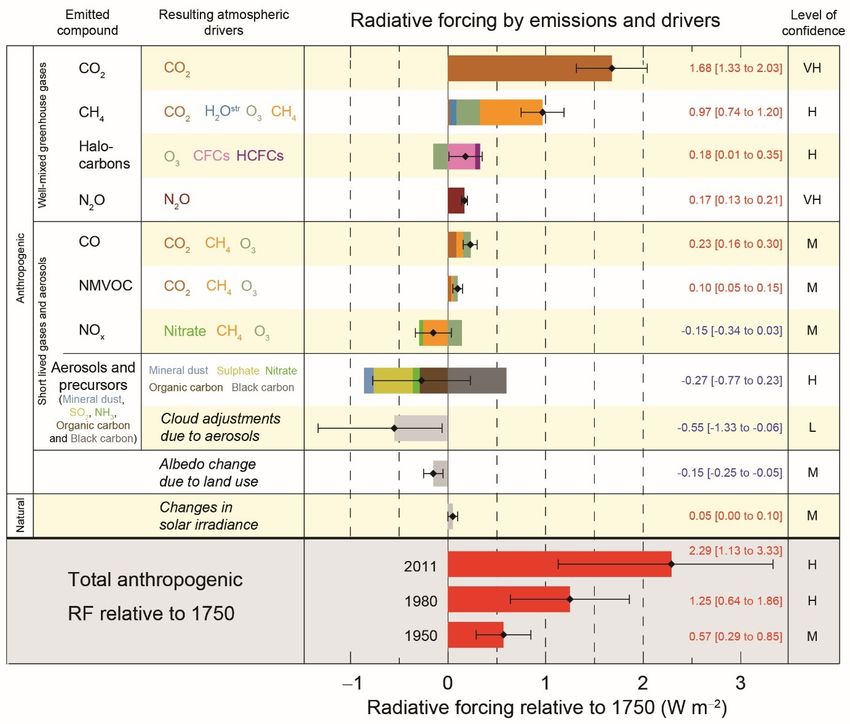
CLASSIFICATION:
NILU report 18/2021 ISBN: 978-82-425-3051-6
ISSN: 2464-3327
Norwegian Environment Agency A – Unclassified (open report)
M-2091 | 2021
DATE SIGNATURE OF RESPONSIBLE PERSON NUMBER OF PAGES
02-09-2021 Ole-Anders Braathen, Deputy director 43
TITLE PROJECT LEADER
Monitoring of the atmospheric ozone layer and natural ultraviolet radiation Wenche Aas
Annual Report 2020
NILU PROJECT NO.
Proj.no. O-113007/O-113008
AUTHOR(S)
QUALITY CONTROLLER
Tove M. Svendby, Georg H. Hansen, Are Bäcklund, Anne-Cathrine Nilsen, Dorothea
Schulze, Bjørn Johnsen (DSA) Kjetil Tørseth
REPORT PREPARED FOR CONTRACT REF.
Norwegian Environment Agency Contract no. 17078061
Contact person: Preben Danielsen
ABSTRACT
This report summarizes the results from the Norwegian monitoring programme on stratospheric ozone and UV radiation
measurements. The ozone layer has been measured at three locations since 1979: In Oslo/Kjeller, Tromsø/Andøya and
Ny-Ålesund. The UV measurements started in 1995. The results show that there was a significant decrease in stratospheric
ozone above Norway between 1979 and 1997. After that, the ozone layer stabilized at a level ~2% below pre-1980 level.
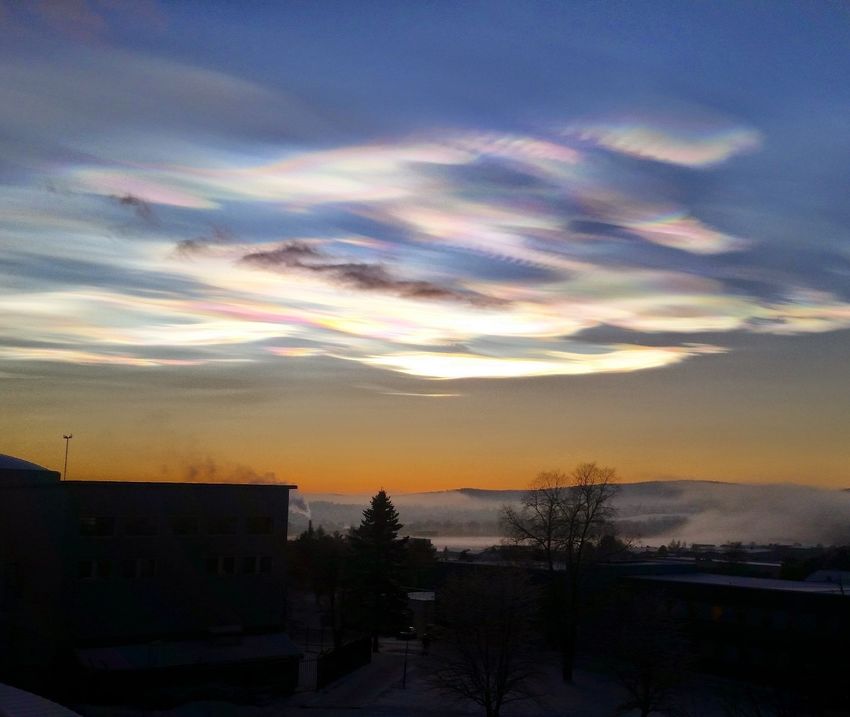
2020 was characterized by a strong, cold, and persistent Arctic stratospheric vortex, leading to extensive formation of Polar
Stratospheric Clouds (PSCs, mother-of-pearl clouds) and chemical ozone destruction with very low ozone values and high
UV levels in the exposed regions in the spring.
NORWEGIAN TITLE
Overvåking av ozonlaget og naturlig ultrafiolett stråling: Årsrapport 2020.
KEYWORDS
Stratospheric ozone UV radiation Measurements and Montreal protocol
Stratosfærisk ozon UV-stråling observations Montreal-protokollen
Målinger og observasjoner
ABSTRACT (in Norwegian)
Denne rapporten presenterer resultatene fra det norske måleprogrammet for totalozon og UV-stråling. Ozonlaget har blitt
målt ved tre stasjoner siden 1979: i Oslo/Kjeller, Tromsø/Andøya og Ny-Ålesund. UV-målinger startet i 1995. Resultatene
viser at det var en signifikant ozonreduksjon over Norge i perioden 1979 til 1997. Deretter stanset reduksjonen og
ozonverdiene stabiliserte seg på et nivå ~2% lavere enn verdiene før 1980. Mest karakteristisk for 2020 var en kraftig og
vedvarende arktisk stratosfærisk vortex og mye perlemorskyer (PSC-er) vinteren og våren 2020, noe som førte til sterk
ozonnedbryting, svært lave ozonverdier og høye UV-nivåer i de berørte områdene.
PUBLICATION TYPE: Digital document (pdf) COVER PICTURE: Kjetil Tørseth, 2011
© NILU – Norwegian Institute for Air Research
Citation: Svendby, T.M., Hansen, G.H., Bäcklund, A., Nilsen, A.C., Schulze, D., Johnsen, B. (2021). Monitoring of
the atmospheric ozone layer and natural ultraviolet radiation. Annual Report 2020. (NILU report 18/2021;
Norwegian Environment Agency M-2091|2021). Kjeller: NILU.
NILU’s ISO Certifications: NS-EN ISO 9001 and NS-EN ISO 14001. NILU’s Accreditation: NS-EN ISO/IEC 17025.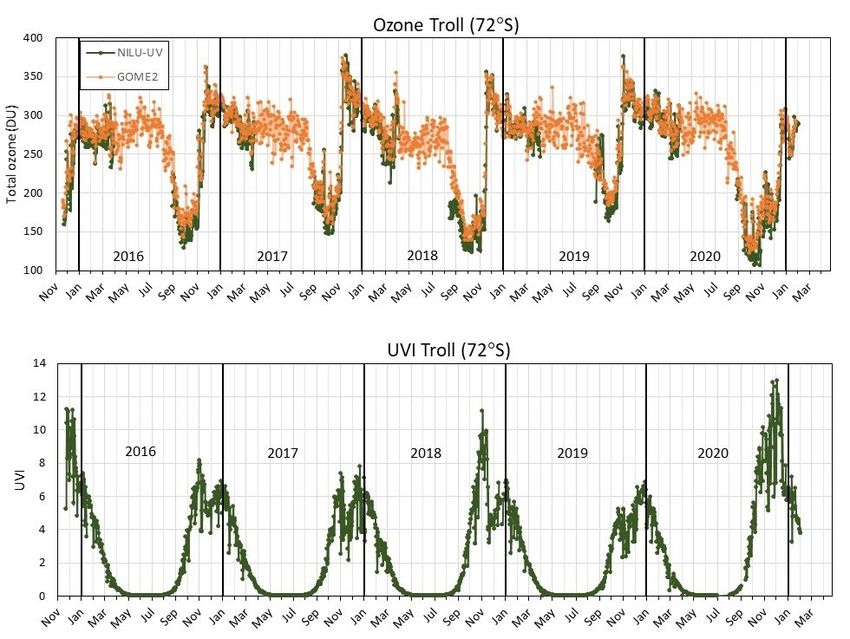
NILU report 18/2021

                                                             Contents

Summary ............................................................................................................................ 4
1     Norwegian ozone measurements in 2020...................................................................... 7
      1.1 Total ozone at Kjeller ..................................................................................................... 7
      1.2 Total ozone at Andøya ................................................................................................... 9
      1.3 Total ozone in Ny-Ålesund ........................................................................................... 11
2     Ozone measurements and trends 1979-2020 .............................................................. 14
      2.1 Background: WMO/UNEP reports ............................................................................... 14
      2.2 Trends for Oslo 1979-2020 .......................................................................................... 14
      2.3 Trends for Andøya/Tromsø 1979-2020 ....................................................................... 17
      2.4 Trends for Ny-Ålesund 1979-2020 ............................................................................... 18
      2.5 The overall Norwegian ozone situation in 2020 .......................................................... 20
      2.6 Ozone and UV measurements at Troll ......................................................................... 24
3     Satellite observations of total ozone ........................................................................... 26
      3.1 Satellite total ozone observations 1979-2020 ............................................................. 26
4     The IPCC assessment reports: Climate and Ozone interactions..................................... 30
5     UV measurements...................................................................................................... 33
      5.1 UV measurements in 2020........................................................................................... 33
      5.2 Annual UV doses 1995-2020 ........................................................................................ 37
6     Appendix: Instrument description............................................................................... 39
7     References ................................................................................................................. 41

                                                                       3
NILU report 18/2021
Summary
This report summarises activities and results from the ozone and UV monitoring programme in 2020.
It includes total ozone trend analyses for the period 1979-2020 and UV measurements in Oslo/Kjeller,
at Andøya and in Ny-Ålesund for the period 1995-2020. The report also gives an overview of total
ozone measurements and UV data from the Troll Station in Antarctica, which started up in 2007. The
Antarctic activity is funded by the Norwegian Ministry of Climate and Environment.
MAIN CONCLUSIONS FROM THE MONITORING PROGRAMME 2020
• The polar stratospheric vortex established record-early in late 2019, giving rise to
exceptionally low ozone values in the northern polar region in winter/spring 2020.
• In Ny-Ålesund, the average total ozone value for February to April was around 100 DU below
the long-term mean value (~400 DU).
• Ozone “mini holes” with values down to 210 DU were recorded at Kjeller in January 2020
• At all Norwegian monitoring stations, a significant stratospheric ozone decrease was recorded
for the period 1979-1997. For the period 1998-2020 there are no significant trends in the
ozone layer above Norway.
• The annual integrated UV dose at Andøya in 2020 was the highest ever registered. This was
mainly caused by many cloudless days and relatively low ozone values during spring and
summer. At Kjeller and in Ny-Ålesund, the annual integrated UV doses were more modest.
• Meteorological variability has a large impact on ozone and UV and can give considerable year-
to-year variations
Total ozone
The total ozone column over the northern polar regions were exceptionally low in winter and spring
of 2020. The average total ozone value for February to April 2020 was ~100 DU below the mean of
measurements between 1979 and 2019 (~400 DU), the lowest value measured since the start of
satellite measurements in 1979. The low total ozone values were caused by an exceptionally strong,
cold, and persistent stratospheric polar vortex, which provided ideal conditions for Polar Stratospheric
Cloud (PSC) formation. The PSCs (mother-of-pearl clouds) were visible all over Norway large parts of
the winter 2020.
In addition, the polar vortex was exceptionally stable and did not break up until the first half of May,
which has occurred only twice before since the start of pan-Arctic observations by satellites in 1979 (it
occurred also in 1997 and 2011). In the area of the vortex, air masses were cut off from ozone supply
from lower latitudes, thus causing reduced total ozone. With the extensive PSC-formation, an
additional photochemical chlorofluorocarbon (CFC)-induced ozone loss occurred within the vortex. In
the altitude range of 16-19 km, the ozone concentration was reduced by up to 95% for several weeks,
giving total ozone values 30-40% below normal in Ny-Ålesund and a larger Arctic region.
In the winter of 2019/20, there were also episodes of ozone mini-holes at Andøya and in the Oslo area.
Most pronounced was an episode on 25/26 January, caused by advection of lower-latitude airmasses
with a high tropopause and accordingly very low ozone concentrations in the upper troposphere,
replacing ozone-rich lower stratosphere air. The total ozone values at Kjeller were down to 210 DU
during this period, which is about 38% below the long-term average value for January. This was the
lowest ozone value recorded at Kjeller in 2020.
4NILU report 18/2021
Because of atmospheric circulation, the ozone layer above Norway is normally thickest in late winter
and spring, whereas the lowest values occur in October/November. However, due to the special
ozone/stratosphere situation in spring 2020, the lowest annual ozone values at Andøya and Ny-
Ålesund were measured in April. Minimum ozone values of 233 DU and 249 DU were measured on 5
and 6 April at Andøya and Ny-Ålesund, respectively. These values are 43% and 42% below the long-
term April means for these sites.
The monitoring programme and trend analyses show that minimum ozone levels over Norway were
reached in the mid-1990s. During the period 1979-1997, the annual average ozone layer above Oslo
and Andøya decreased by - 5.7%/decade and as much as -8.1%/decade during spring. For Ny-Ålesund,
the decrease was even larger: - 6.9%/decade for annual means and -11.2%/decade during the spring
months. Since 1998 no further ozone decrease has been observed at any of the three Norwegian sites,
and the ozone layer has stabilized at a level ~2% below the pre-1980 level (i.e. the reference level,
before the ozone depleting substances had significant influence on stratospheric ozone destruction).
UV measurements
The highest UV index (UVI) in Oslo/Kjeller in 2020 was 6.8, measured on 29 June. Such an UVI is not
very unusual in Southern Norway during sunny days in late June and early July and people with a typical
Nordic skin type can get sunburnt after ~20 minutes if no sun protection is used. At Andøya, the highest
UV index in 2020 was 5.9 observed on 16 June, whereas the highest UVI in Ny-Ålesund, 3.2, was
observed on 11 July. These values are typical for low and high Arctic latitudes, respectively.
In 2020, the yearly integrated UV dose at Andøya was 266.2 kJ/m2, which is the highest dose registered
since the start in 1995. This was caused by relatively low ozone values and a summer with many sunny
days. Contrary to Andøya, the integrated UV doses at Kjeller and in Ny-Ålesund were modest in 2020.
Oslo/Kjeller had an annual dose of 352.6 kJ/m2, which is the 5th lowest value registered. Ny-Ålesund
had an annual integrated dose of 212.4 kJ/m2, which is the 13th highest observation and 7% lower than
the maximum value from 2009.
Ozone Depleting Substances (ODSs)
During the 1980s and 1990s the amount of stratospheric ozone decreased dramatically. The main
reason for this decrease was anthropogenic release of ozone depleting substances (ODSs), especially
chlorofluorocarbons (CFCs). In 1987, a number of countries signed The Montreal Protocol, with the
aim of phasing out and stopping the release of ODSs. This international treaty has later been revised
several times, and the effective regulations have reduced the use and emissions of ODSs significantly.
The total amount of ODSs in the stratosphere reached a maximum in the late 1990s. Since then the
concentrations have declined slowly for most compounds and are now approximately 15% below the
maximum 20 years ago.
Today we can see signs of ozone recovery, but it is still crucial to follow the development of the ozone
layer in order to verify that the Montreal Protocol and its amendments work as expected. A recovery
of the stratospheric ozone layer depends on a sustained reduction of CFC-11, which is the most
important ODS and contributes one quarter of all chlorine reaching the stratosphere. Monitoring
results and studies have shown that the rate of decline of atmospheric CFC-11 concentrations slowed
down by about 50% after 2012, largely attributed to illegal production of CFC-11 from Eastern China,
strongly inconsistent with the Montreal Protocol agreement. However, recent studies show that these
regional emissions of CFC-11 have substantially declined from 2017 to 2019, and global CFC-11
emissions in 2019 are now back to pre-2013 levels. Other possible origins of the unexpected slower
rate of decline of atmospheric CFC-11 concentrations still have to be investigated. This demonstrates
the importance of maintaining good monitoring networks, both to detect possible changes related to
ODSs, but also to detect possible effects of climate change on the ozone layer.
5NILU report 18/2021
Coupling of stratospheric ozone and climate
The expected future recovery of stratospheric ozone might be affected by climate change. An increase
in greenhouse gases will warm the troposphere and cool the stratosphere, and in general a decrease
in stratospheric temperature will slow down the gas-phase ozone destruction reactions, leading to less
depletion and higher ozone column. However, there is a possible exception in the polar regions where
lower stratospheric temperatures lead to more favourable conditions for the formation of Polar
Stratospheric Clouds (PSCs). Furthermore, climate change may alter the strength of the stratospheric
circulation and with it the distribution of ozone in the stratosphere. According to recent analyses from
Scientific Assessment of Ozone Depletion: 2018 (WMO, 2018), Northern Hemisphere total ozone is
expected to return to 1980 abundances in the 2030s, Southern Hemisphere mid-latitude ozone to
return around mid-century, whereas the Antarctic ozone hole is expected to gradually close and return
to 1980 values in the 2060s. These projections are based on full compliance with the Montreal Protocol
and the baseline estimate of the future evolution of GHGs. However, there is a very complex coupling
between stratospheric ozone and climate drivers, and the net effect of increased N2O and CH4 on total
ozone is uncertain.
The national monitoring programme
To follow up the Montreal Protocol, the Norwegian Environment Agency established the programme
“Monitoring of the atmospheric ozone layer” in 1990. NILU - Norwegian Institute for Air Research has
been responsible for the operation and maintenance of the monitoring programme. Three sites are
included in the programme: Oslo/Kjeller (60N), Andøya (69N) and Ny-Ålesund (79N). In late
June 2019, the ozone and UV monitoring instruments at Blindern, Oslo, were moved to NILU (Kjeller)
to ensure a continuation of the measurements.
The present report belongs to a series of four annual reports covering national monitoring of
atmospheric composition in the Norwegian rural background environment. The other three reports
focus on monitoring of 1) particulate and gaseous phase of inorganic constituents, particulate
carbonaceous matter, ground level ozone and particulate matter, 2) persistent organic pollutants and
heavy metals, and 3) greenhouse gases and aerosol properties. The latter report (Myhre et al., 2020)
includes monitoring and analysis of ozone depleting substances (ODSs), an activity closely related to
the total ozone and UV monitoring programme presented in this report.
Summary of total ozone and UV key results:
Ozone Oslo Andøya Ny-Ålesund
Annual total ozone trend 1979-1996, -5.7 (±2.0) -5.7 (±2.0) -6.9 (±2.2)
%/decade
Annual total ozone trend 1997-2020, 0.3 (±1.4) -0.1 (±1.4) -0.5 (±2.0)
%/decade
UV
Annual UV dose 2020, kJ/m2 (rank*) 352.6 (22) 266.2 (1) 200.6 (13)
*“Rank” indicates how high the UV dose was in 2020 compared to other years. UV has been measured since 1995/1996.
6NILU report 18/2021
Monitoring of the atmospheric ozone layer and natural
ultraviolet radiation
Annual Report 2020
1 Norwegian ozone measurements in 2020
Total ozone is measured on a daily basis at Kjeller (60N), at Andøya (69N) and in Ny-Ålesund (79N).
The daily ground-based ozone measurements at Blindern (Oslo) started in 1978, but in June 2019 the
instruments were moved to NILU, Kjeller, to secure a continuation of the measurements. Modern
ground-based ozone observations have been performed at Andøya/Tromsø and in Ny-Ålesund since
1990. The ozone measurements are retrieved from Brewer spectrophotometers in Oslo/Kjeller and at
Andøya, whereas a SAOZ (Systeme d'Analyse par Observation Zenitale) instrument is the standard
ozone instrument in Ny-Ålesund together with a Brewer instrument operated by the Institute of Polar
Sciences, National Research Council of Italy. At all the three Norwegian sites GUV (Ground-based
UltraViolet) filter radiometers are installed and can fill in ozone data gaps on days without Brewer and
SAOZ measurements (see Appendix for more details). In addition to the ground-based measurements
we also analyse total ozone data from various satellites to get a more complete description and
understanding of the ozone situation in Norway and the Arctic region. The total ozone values,
frequently denoted as ozone layer thickness, is expressed in terms of Dobson Units (DU1)
In the following sections results from the ground-based total ozone measurements in Oslo/at Kjeller,
at Andøya and in Ny-Ålesund as well as from Troll Station, Antarctica, are described, while satellite
measurements from the Norwegian and Arctic sites are presented in Chapter 3.
1.1 Total ozone at Kjeller
Total ozone has been measured at Blindern, University of Oslo, for more than 40 years. Due to
retirement of key personnel at the Department of Physics, University of Oslo, it was decided to move
all the instruments to NILU, Kjeller, in the end of June 2019. The station at Kjeller is located ~18 km
east of Blindern, and it is believed that the ozone column above Oslo and Kjeller are more or less the
same. In Oslo/Kjeller total ozone is primarily recorded with the Brewer MKV Spectrophotometer
(B042). Figure 1a illustrates the daily total ozone values measured in 2020. The black curve shows the
daily measurements, whereas the red curve shows the long-term monthly mean values for the period
1979-1989 (frequently denoted as “normal” in the current report). The total ozone values in 2020 are
based on Brewer direct-sun (DS) measurements when available.
In 2020, direct-sun measurements were performed on 212 out of 366 days. During overcast days or
days where the minimum solar zenith angle was larger than 72, the ozone values were calculated with
the Brewer global irradiance (Brewer GI) method (Stamnes et al., 1991). The Brewer GI method was
used on 143 days. On days with missing Brewer measurements, total ozone will be retrieved from the
GUV-511 instrument which is located next to the Brewer. Altogether, GUV data were used to complete
the ozone time series on 8 days with missing Brewer data in 2020. A summary of instrument frequency
in the data set is given in Table 1. In total there were three days with missing data in 2020, all three
days related to bad weather conditions and correspondingly uncertain ozone values.
1
The Dobson unit (DU) is a unit of measurement of total-column ozone in the Earth's atmosphere. One Dobson
unit refers to a layer of gas that would be 0.01 mm thick under standard temperature and pressure. The ozone
layer in Norway normally varies between 240 and 550 DU, i.e. 2-6 mm, depending on the season. An ozone
value of less than 220 DU defines an “ozone hole”.
7NILU report 18/2021
Figure 1a: Daily total ozone values measured at Kjeller in 2020. The red curve shows the long-term
monthly mean values from Oslo 1979-1989.
Figure 1b: Monthly mean ozone values at Kjeller in 2020. The red curve shows the long-term monthly
mean values from 1979-1989.
Table 1: Overview of total ozone instruments at Kjeller and the number of days where the various
instruments were used in the 2020 time series
Priority Method Total days with
observations
1 Brewer instrument, direct sun measurements 212
2 Brewer instrument, global irradiance method 143
3 GUV-511 instrument 8
Missing days 3
8NILU report 18/2021
As seen from Figure 1a there are large day-to-day fluctuations in total ozone, particularly during winter
and spring. The rapid ozone variations are typically caused by stratospheric circulation and changes in
tropopause height. The lowest ozone values normally occur in October/November, but 2020 was a
special year with very low spring time ozone values. Also, an ozone mini-hole with total ozone down
to 210 DU was measured on 25 January. This is about 38% below the long-term mean for January. A
total ozone column below 220 DU is considered as an “ozone hole” and values down to 210 DU are
not often measured in the Oslo area.
The monthly mean total ozone values in 2020 are shown in Figure 1b (black line), compared to the
long-term monthly mean values for the period 1979-1989 (red line). As seen from the figure, the
monthly average ozone value in April was below normal, whereas the summer and fall values were
close to the long-term mean. Section 2.5 gives a broader discussion and interpretation of the ozone
situation in Norway in 2020.
1.2 Total ozone at Andøya
Total ozone measurements in Tromsø started back in 1935, which makes the Tromsø/Andøya time
series one of the longest in the world. At Andøya the total ozone values are based on Brewer direct-
sun (DS) measurements when available. For overcast days and days when the solar zenith angle is
larger than 80 (sun less than 10 above the horizon), the ozone values are based on the Brewer global
irradiance (GI) method. As in Oslo, a GUV instrument provides ozone data when the Brewer instrument
is out of order or Brewer measurements are inhibited by bad weather conditions. From about 1
December until 10 January, the sun is below the horizon, thus not allowing ozone measurements with
these instruments.
The Andøya Brewer instrument ran without major interruptions and problems in 2020. From 2015 to
2017 a significant instrumental drift was registered, which made it crucial with comprehensive post-
processing of all ozone data. However, the last three years the Brewer instrument has been fairly
stable. There have been some incidences with sudden software failure, probably related to a memory
issue, but nothing that caused long interruptions of the measurements.
The GUV instrument also ran without major problems in 2020. Since 2018 the GUV instrument at
Andøya has been experiencing problems with the communication between the detector and the PC,
resulting in occasional interruptions and shorter periods (several minutes) without data logging. The
reason for these interruptions is not clear. The problem has been less pronounced after a new PC was
installed in December 2020, but the problem is still not completely gone. Despite this trouble there
were no days with absent GUV measurements due to technical problems in 2020. However, on six days
total ozone values were not retrieved due to heavy clouds and large data uncertainty. In addition, total
ozone was not retrieved during the polar night period.
9NILU report 18/2021
Figure 2a: Daily total ozone values measured at ALOMAR, Andøya, in 2020 by the Brewer and GUV
instruments (black curve). The red line is the long-term monthly mean values from 1979-
1989.The dotted line represents GOME2 satellite measurements.
Figure 2b: Monthly mean total ozone values at Andøya in 2020 (black curve) compared to the long-
term monthly mean values for the period 1979-1989 (red curve).
Table 2 gives an overview of the different instruments and methods used at Andøya in 2020. Brewer
DS was available on 159 days (i.e. sunny days), whereas Brewer GI provided the daily ozone value on
70 days. In total, there were 12 days with missing Brewer data in 2020 related to technical issues. In
addition, GI total ozone data were not used if the number of daily ozone measurements was low
and/or the standard deviation was larger than 20 DU. On these days GUV total ozone data served as
replacements for Brewer data. The GUV instrument also works satisfactorily when the solar signal is
weak. This makes it possible to extend the time series and perform ozone measurements shortly
after/before the polar night season. In total, there were six days with missing ozone observations at
Andøya in 2020, all related to bad weather and ozone values with unacceptably high uncertainty.
Figure 2a shows daily ozone values from Andøya in 2019. The black curve illustrates the daily ozone
values, whereas the red curve shows the long-term monthly mean values for the years 1979-1989. In
addition, GOME2 satellite data are included for the polar night period (winter), shown as a dotted line
in Figure 2a. The lowest ozone values at Andøya normally occur in October and November, but in 2020
the minimum ozone value was measured on 6 April. This day the ozone value was as low as 233 DU,
which is 43% below the long-term April mean. This was related to the large Arctic ozone depletion in
spring 2020, as described in Section 2.5.
10NILU report 18/2021
Table 2: Overview of instruments and methods applied for retrieval of the total ozone at Andøya
in 2020.
Priority Method Total days with
observations
1 Brewer instrument, direct sun measurements 159
2 Brewer instrument, global irradiance method 70
3 GUV instrument 36
Missing days (except polar night period) 6
Monthly mean ozone values at Andøya in 2020 are shown in Figure 2b. For January, November, and
December (polar night) there are not sufficient data to calculate monthly means from the ground
based instruments. Comparison between the long-term mean and monthly mean ozone values in 2020
shows that the total ozone column was significantly below normal in February and April 2020.
1.3 Total ozone in Ny-Ålesund
Ny-Ålesund is located at a high northern latitude (79º N), which normally makes it more challenging to
obtain reliable ozone measurements due to weak solar radiation/large solar zenith angles, especially
during spring and fall. Whereas most ozone monitoring instruments are based on UV absorption
techniques, e.g. the Brewer and GUV instruments, the SAOZ instrument measuring total ozone in Ny-
Ålesund is based on radiation from the visible part of the solar spectrum. This requires a long pathway
through the atmosphere, and ozone retrievals can only made at solar zenith angles larger than ~85°.
In Ny-Ålesund, this excludes measurements between approximately 1 May and 15 August, as the sun
never settles below 5º elevation during this period.
NILU’s instrument in Ny-Ålesund is located at the observation platform of the Sverdrup Station of the
Norwegian Polar Institute. Measurements started in the fall 1990 and have continued until the present
time with a few exceptions (see Appendix).
In addition to the SAOZ instrument, a GUV-541 multi-filter radiometer is used for ozone measurements
when the UV radiation becomes stronger in the spring, summer and early fall. These measurements
give important contributions to the ozone time series from Ny-Ålesund. NILU has also access to data
from an Italian Brewer instrument set up at the Sverdrup station, which are valuable for the quality
assurance of the SAOZ and GUV ozone data. Unfortunately there were problems with B50 in 2019,
both with a broken power supply and heater (see appendix A). In 2020 the instrument ran without
major interruptions, but it was not possible to calibrate the instrument in 2020 due to travelling
restrictions under Covid-19. Therefore, the Brewer data from 2020 have higher uncertainty than
normal.
In early 2020 a new instrument monitoring both total ozone and NO2 was put into operation as part
of the SIOS-InfraNord project. The Pandora UV/visible spectrometer provides data for both the sun
and the moon as a light source, thus potentially providing data also during the polar night. Currently,
the instrument is still in a commissioning phase mode, but is envisaged to be in routine operation mode
from 2022. Data will be provided to the SIOS (Svalbard Integrated Arctic Earth Observing System) Data
Management System, but also be available for other projects.
11NILU report 18/2021
Both the SAOZ and GUV instrument worked satisfactorily the whole year. One out of 366 days GUV
measurements were missing due to power failures at the Sverdrup station. Also, total ozone was
absent one additional day due to heavy clouds and bad weather conditions.
Table 3 gives an overview of the different instruments and measurement methods used for the 2020
total ozone time series in Ny-Ålesund. No ground based ozone measurements were performed during
the polar night period.
Table 3: Overview of instruments and methods applied for retrieval of the total ozone in
Ny-Ålesund 2020.
Priority Method Total days with
observations
1 Brewer#50 instrument 75
2 SAOZ instrument 110
3 GUV instrument 58
Missing days (except polar night period) 2
Figure 3a shows daily ozone values from Ny-Ålesund in 2020. The black curve illustrates the daily ozone
values, whereas the red curve shows the long-term monthly mean values for the years 1979-1989,
calculated from TOMS (Total ozone Mapping Spectrometer) satellite data. Total ozone values during
winter (November to mid-February) are not achievable due to absence of sunlight, but similar to
Andøya, GOME2 satellite data have been used to indicate the ozone values for the polar night period,
shown by the dotted line in Figure 3a. Similar to Oslo and Andøya, the lowest ozone values in Ny-
Ålesund normally occur in October and November. However, 2020 was a very special year with a strong
and persistent polar vortex and large spring time ozone depletion (see section 2.5). The lowest ozone
value in 2020 was 249 DU, measured on 5 April 2020. This is 42% below the long-term mean for April.
Figure 3a: Daily total ozone values measured in Ny-Ålesund in 2020 by the SAOZ, Brewer, and GUV
instruments (black curve). The red line is the long-term monthly mean values from 1979 -
1989. The dotted line represents GOME2 satellite measurements.
Monthly mean total ozone values in Ny-Ålesund 2020 are shown in Figure 3b. Comparison between
the 2020 values and the long-term 1979-1989 monthly means also demonstrate the extremely low
12NILU report 18/2021
ozone values in winter and spring 2020. The ozone values remained relatively low until the end of
summer. However, in September a persistent ozone ridge was located over Svalbard for a couple of
weeks, which resulted in a monthly mean total ozone value significantly above normal.
Figure 3b: Monthly mean total ozone values for 2020 (black curve) compared to the long-term
monthly mean values for the period 1979-1989 (red curve).
13NILU report 18/2021
2 Ozone measurements and trends 1979-2020
2.1 Background: WMO/UNEP reports
Since the early 1990s, the World Meteorological Organisation (WMO) and United Nations Environment
Programme (UNEP) have regularly published assessment reports of ozone depletion. The last report,
“Scientific Assessment of Ozone Depletion: 2018”, was published in October 2018 (WMO, 2018). The
report summarizes the current knowledge and status of the ozone layer, ozone recovery, UV changes,
and development of relevant trace gases (e.g. halocarbons, chlorine and bromine) in the atmosphere.
The report concludes that the actions taken under the Montreal Protocol have led to decreases in the
atmospheric abundance of ozone-depleting substances (ODSs). By 2016, the chlorine entering the
stratosphere from ODSs has declined by 12% from the 1993 peak value. Total bromine has decreased
by 15% since 1998.
Earlier measurements showed that total column ozone declined over most of the globe during the
1980s and early 1990s. The 2018 assessment report concludes that the global (60°S-60°N) total column
ozone has remained relatively unchanged since 1997, remaining roughly 2% below the 1964-1980
average. However, the upper stratospheric ozone has increased by 1-3%/decade since 2000. Climate
models suggest that this increase can be explained by comparable contributions from declining ODS
abundances and upper stratospheric cooling caused by carbon dioxide increases.
According to the 2018 Ozone Assessment, it is likely that total column ozone will recover toward the
1980 benchmark levels over most of the globe under full compliance with the Montreal Protocol.
Northern Hemisphere total ozone is expected to return to 1980 abundances in the 2030s, Southern
Hemisphere mid-latitudes ozone around mid-century, whereas the Antarctic ozone hole is expected
to gradually close and return to 1980 values in the 2060s.
The 2018 assessment report also emphasizes that changes in CO2, N2O, and CH4 will have an increasing
influence on the ozone layer as ODS concentrations decline. These gases impact both chemical cycles
and stratospheric circulation. This is described in more detail in Chapter 4. Studies of long-term ozone
trends, presented in the next sections, are essential in the assessment of possible ozone recovery and
for gaining more information about atmospheric processes.
As mentioned above, stratospheric ODS concentrations have started to decline. The most important
ODS is CFC-11, which contributes one quarter of all chlorine reaching the stratosphere. A recovery of
the stratospheric ozone layer depends on a sustained reduction of CFC-11. The rate of decline of
atmospheric CFC-11 concentrations was constant from 2002 to 2012. However, after 2012 the rate of
decline slowed down by about 50% (Montzka et al., 2018). The same pattern was also evident from
the CFC-11 measurements performed at the Zeppelin observatory. This was explained by an increase
in CFC-11 emissions caused by unreported new production in China (Rigby et al., 2019), strongly
inconsistent with the Montreal Protocol agreement to phase out global CFC production by 2010. A
recent study from Park et al. (2021) indicates that the CFC-11 emissions in eastern China returned to
pre-2013 levels in 2019, which probably avoided a substantial delay in the ozone layer recovery.
2.2 Trends for Oslo 1979-2020
Total ozone measurements using the Dobson spectrophotometer (No. 56) were performed on a
regular basis in Oslo from 1978 to 1998. The complete set of Dobson total ozone values from Oslo is
available at The World Ozone Data Centre, WOUDC (https://woudc.org/data.php). Since the summer
of 1990, Brewer instrument no. 42 has been in operation. The entire set of Brewer DS measurements
from Oslo is also available at WOUDC.
14NILU report 18/2021
At the end of June 2019 the Brewer instrument no. 42 was moved from Blindern in Oslo to NILU, Kjeller,
~18 km east of Blindern. The stratospheric ozone climatology above Blindern and Kjeller are more or
less the same, and the move of the instrument is believed to have no significant impact on the total
ozone values and trend calculations.
Figure 4a shows the variations in monthly mean ozone values in Oslo/Kjeller for the period 1979 to
2020. The large seasonal variations are typical for stations at high latitudes. This is a dynamic
phenomenon and can be explained by the springtime transport of ozone from the source regions in
the stratosphere above the equator.
In order to make ozone trend analyses for the period 1979 – 2020 we have removed the seasonal
variations by subtracting the long-term monthly mean ozone values from the data series, shown in
Figure 4b. Next, we have divided the time series into two periods: 1) 1978-1997, and 2) 1998-2020. For
the first time period, the ozone measurements were entirely derived from the Dobson instrument and
reflect a time period when a gradual decline in stratospheric ozone was observed at most mid and high
latitude stations. The second period is based on Brewer measurements, with inclusion of some GUV
measurements. For the two time periods, simple linear regression lines has been applied to the data
to derive trends in the ozone layer above Oslo/Kjeller. The results are summarized in Table 4. The
numbers in the table represent seasonal and annual percentage changes in total ozone (per decade)
for the two time periods. The numbers in parenthesis give the uncertainty (1) in percent/decade. A
trend larger than 2 is considered as significant. In winter and spring, the ozone variability is relatively
large and the corresponding ozone trend must be large in order to be classified as statistically
significant.
Figure 4a: Time series of monthly mean total ozone in Oslo and at Kjeller 1979-2020. The green line
represents measurements performed with the Dobson instrument, whereas the orange
line represents Brewer measurements.
2
Sigma () represents a confidence interval. The 1 interval means that it is 68.3% certain that the trend is between
calculated trend ± 1 value. The 2 value represents a 95.4% confidence interval.
15NILU report 18/2021
Figure 4b: Variation in total ozone over Oslo/Kjeller for the period 1979–2020 after the seasonal
variations have been removed. The green line represents measurements performed with
the Dobson instrument, whereas the orange line represents Brewer measurements. Trend
lines are marked as black lines.
The second column in Table 4 indicates that a large ozone decrease occurred during the 1980s and first
half of the 1990s. In the period 1979-1997 there was a significant decline in total ozone for all seasons.
For the winter and spring, the decrease was as large as -6.0 %/decade and -8.0 %/decade, respectively.
The negative ozone trend was less evident for the summer, but nevertheless it was significant at a 2
level.
For the period 1998-2020 the picture is different. There are substantial year-to-year fluctuations and
it is hard to draw definite conclusions about trends. Still, the regression analysis gives a good indication
of the status of the ozone layer for recent years. As seen from the last column in Table 4, there is a
statistical significant ozone increase of 1.9%/decade for the fall period September to November. For
all other seasons the changes in total ozone are relatively small and close to zero. The annual ozone
trend from 1998 to 2020 is 0.3% /decade.
Table 4: Percentage changes in total ozone (per decade) for Oslo for the period 1.1.1979 to
31.12.2020. The numbers in parenthesis represent the uncertainty (1). Data from the
Dobson, Brewer and GUV instruments have been used in this study. A trend larger than 2
is considered as significant.
Season Trend (%/decade) 1979-1997 Trend (%/decade) 1998-2020
Winter (Dec – Feb) -6.0 (2.3) 0.6 (1.6)
Spring (Mar – May) -8.0 (1.3) 0.0 (1.2)
Summer (Jun – Aug) -3.4 (1.0) -0.3 (0.7)
Fall (Sep – Nov) -4.2 (1.0) 1.9 (0.8)
Annual (Jan – Dec): -5.7 (1.0) 0.3 (0.7)
16NILU report 18/2021
2.3 Trends for Andøya/Tromsø 1979-2020
Total ozone monitoring started in Tromsø back in 1935 and measurements were performed on a
routine basis until 1972. In 1985 the old Dobson instrument no. 14 was put into operation again, but
unfortunately the instrument was not properly inter-compared with other Dobson instruments until
1990.
An automated Brewer instrument (B104) was installed in Tromsø in 1994 and operated at this site until
fall 1999, in parallel with Dobson no.14. In 2000, the Brewer instrument was moved to Andøya,
approximately 130 km West-southwest of Tromsø, while Dobson observations were terminated.
Studies have shown that the ozone climatology is very similar at the two locations (Høiskar et al., 2001),
and the two datasets are considered equally representative for the ozone values at 70 in the
European/ Atlantic Arctic. Thus, for trend study purposes the Tromsø/Andøya total ozone time series
can be considered as one series.
To avoid periods of missing data and possible influences of missing inter-comparison, and to make the
total ozone time series as homogeneous as possible, total ozone values from the satellite instrument
TOMS (onboard the Nimbus 7 satellite) have been used for the period 1979-1994.
Figure 5a shows the variation in the monthly mean ozone values at Andøya from 1979 to 2020. The
variations in total ozone, after removing the seasonal cycle, are shown in Figure 5b together with the
annual trends. November – February months are not included in the trend analysis due to lack of data
and uncertainties in ozone retrieval during the period with low solar elevation. This includes removal
of, e.g., the ozone peak value in February 2010 and the low ozone values in early February 2018. Simple
linear regression lines have been fitted to the data in Figure 5b. Similar to the Oslo site we have divided
the ozone time series into two periods: 1) 1979-1997, and 2) 1998-2020. The results of the trend
analyses are summarized in Table 5. Comparison of Figure 4b and Figure 5b shows that the trend
patterns at Andøya have many similarities to the Oslo trend pattern.
As for Oslo, the ozone layer above Andøya declined significantly from 1979 to 1997. This decline was
evident for all seasons. The negative trend for the spring season was -8.1%/decade, whereas the
negative trend for the summer months was -2.9%/decade. The yearly trend in total ozone was -
5.7%/decade. For the second period from 1998 to 2020, no significant trends have been found, except
September-October. For these two months total ozone has increased by 2.5%/decade. For the other
seasons, the ozone trends are essentially zero. The annual ozone trend from 1998 to 2019 is -
0.1%/decade.
Table 5: Percentage changes in total ozone (per decade) at Andøya for the periods a) 1979-1997,
and 2) 1998- 2020. The numbers in parenthesis give the uncertainty (1 ). A trend larger
than 2 is considered significant.
Season Trend (%/decade) 1979-1997 Trend (%/decade) 1998-2020
Spring (Mar – May) -8.1 (1.5) -0.8 (1.2)
Summer (Jun – Aug) -2.9 (0.9) -0.7 (0.7)
Fall (Sep – Oct) -4.9 (1.3) 2.5 (0.8)
Annual (Mar – Oct) -5.7 (1.0) -0.1 (0.7)
17NILU report 18/2021
Figure 5a: Time series of monthly mean total ozone at Andøya/Tromsø 1979–2020. The green line
represents total ozone from Tromsø, whereas the orange line represents measurements at
Andøya.
Figure 5b: Variations in total ozone at Andøya for the period 1979–2020 after the seasonal variations
are removed. Only data for the months March–October are included. The green line
represents total ozone from Tromsø, whereas the orange line represents measurements at
Andøya. The trends are marked as black lines.
2.4 Trends for Ny-Ålesund 1979-2020
The first Arctic ozone measurements started in Svalbard in 1950, when a recalibrated and upgraded
Dobson instrument (D8) was sent to Longyearbyen, and Søren H.H. Larsen was the first person who
performed ozone measurements in Polar regions (Henriksen and Svendby, 1997). Larsen studied the
annual ozone cycle, and his measurements were of great importance when Gordon M.B. Dobson and
his co-workers started ozone observations in Antarctica (Halley Bay) some years later.
Regular Dobson ozone measurements were performed at Longyearbyen until 1966. The data series
from 1950 to 1962 has been reanalyzed and published by Vogler et al. (2006). In 1966, the Dobson
instrument was moved to Ny-Ålesund and measurements continued until 1968. As in Tromsø,
measurements were discontinued after technical failures and they didn’t resumed until August 1984,
now again in Longyearbyen. The measurements continued until 1993, but unfortunately without
18NILU report 18/2021
appropriate quality assurance and calibration. In 1994, the instrument was once again moved to Ny-
Ålesund and operations taken over by the Norwegian Polar Institute. There they continued – with
interruptions – until fall 2005. A major reason for the final termination of the Dobson measurements
was the requirement of a substantial amount of manual operation. In parallel with the Dobson
instrument, the more automatic SAOZ and GUV instruments were put into operation in Ny-Ålesund in
1991 and 1995, respectively. Since 2014 we have also had access to Italian Brewer measurements.
The ozone measurements presented in Figure 6a and Figure 6b are based on a combination of Dobson,
Brewer, SAOZ, GUV and satellite measurements. For the years 1979 to 1991 the monthly mean ozone
values are entirely based on TOMS Nimbus 7 and Meteor-3 overpass data. For the last 29 years, only
ground-based measurements have been used to calculate the mean values: Dobson and Brewer data
are included when available, SAOZ data are the next priority, whereas GUV data are used when no
other ground-based measurements are available. Due to the optimal operation mode of the SAOZ
instrument around 90° solar zenith angle, the period of performing acceptable ozone measurements
is almost as long in Ny-Ålesund as at Andøya, although the site is 10° further north.
As seen from Figure 6b and Table 6, the trend pattern in Ny-Ålesund is similar to the Oslo and Andøya
trend patterns. A massive ozone decline was observed from 1979 to 1997, especially during winter and
spring. The negative trend for the spring season was as large as -11.2%/decade, whereas the negative
trend for the summer months was “only” -2.6%/decade. The annual trend in total ozone was -
6.9%/decade during this early period. For the second period 1998-2020 no significant trends have been
observed. The trend for fall is 0.9%/decade, whereas a negative trend of -0.9%/decade is found for the
summer months. The annual trend for the period 1998-2020 is -0.5%/decade. This is a reduction of
0.8%/decade from last year, strongly influenced by the low 2020 total ozone values. Figure 6b also
shows that a slightly positive trend for the last two decades is reduced because of the occasional years
with a strong polar vortex and substantial ozone depletion (2005, 2011, 2014, 2016, 2020).
Figure 6a: Time series of monthly mean total ozone at Ny-Ålesund 1979–2020. The green line
represents total ozone data from satellite, whereas the orange line represents
measurements from ground-based instruments.
19NILU report 18/2021
Figure 6b: Variations in total ozone at Ny-Ålesund for the period 1979–2020. Only data for the
months March–October are included. The green line represents total ozone data from
satellite, whereas the orange line represents measurements from ground-based
instruments. Trends for the two periods are marked as black lines.
Table 6: Percentage changes in total ozone (per decade) in Ny-Ålesund for the periods a) 1979-
1997, and 2) 1998- 2020. The numbers in parenthesis give the uncertainty (1). A trend
larger than 2 is considered significant.
Season Trend (%/decade) 1979-1997 Trend (%/decade) 1998-2019
Spring (Mar – May) -11.2 (1.8) -0.8 (1.9)
Summer (Jun – Aug) -2.6 (1.3) -0.9 (0.7)
Fall (Sep – Oct) -3.7 (1.9) 0.9 (1.3)
Annual (Mar – Oct) -6.9 (1.1) -0.5 (1.0)
2.5 The overall Norwegian ozone situation in 2020
Total ozone columns over the northern polar regions were exceptionally low in winter and spring of
2020 (Lawrence et al., 2020). The average total ozone value for February to April 2020 was ~100 DU
below the mean of measurements between 1979 and 2019, and the lowest value since the start of
satellite measurements in 1979. The low total ozone values were caused by an exceptionally strong,
cold, and persistent stratospheric polar vortex, which provided ideal conditions for PSC formation and
chemical ozone destruction (Goutail et al., 2020; Grooß and Müller, 2020; Manney et al., 2020;
Wohltmann et al., 2020). In Ny-Ålesund, the average total ozone value for February to April was also
~100 DU below the long-term mean value.
The polar stratospheric vortex established record-early in late 2019 and from the end of November
until March it was cold enough to give rise to formation of polar stratospheric clouds which were visible
all over Norway during long periods of the winter. In addition, the vortex was exceptionally stable and
did not break up until the first half of May, which has occurred only twice before since the start of the
pan-Arctic observations by satellites in 1979 (1997, 2011). Due to limited planetary-wave activity the
vortex remained mostly at high latitudes. In the area of the vortex, air masses are cut off from ozone
supply from lower latitudes, thus causing reduced total ozone. With the extensive PSC formation that
20NILU report 18/2021
took place in winter 2019/2020, an additional photochemical ozone loss occurred within the vortex. In
the altitude range of 16-19 km ozone concentration was reduced by up to 95% for several weeks,
values which have never been observed outside Antarctica (Wohltmann et al. 2020). The upper panel
of Figure 7 shows an example of the ozone hole in spring 2020, with total ozone values 30-40% below
normal in Ny-Ålesund and a larger Arctic region.
In addition to the springtime Arctic “ozone hole”, which especially affected Ny-Ålesund and Andøya,
there were episodes of ozone mini-holes in Southern Scandinavia affecting Oslo and Andøya in January
2020. An episode from 25-26 January (lower panel of Figure 7) is an example of such a mini-hole that
is characteristic for high latitudes. It is caused by the advection of lower-latitude airmasses with a high
tropopause and accordingly very low ozone concentrations in the upper troposphere, replacing ozone-
rich lower stratosphere air. These events are transient and last only for a few days (e.g., Bojkov and
Balis, 2001). The total ozone values in Southern Norway were below 220 DU during this period.
Figure 7: Total ozone from WOUDC and Environment Canada: Total ozone deviation from normal 5
April 2020 (top) and total ozone 26 January 2020 (bottom), The maps are based on ground
based measurements and satellite observations (http://exp-
studies.tor.ec.gc.ca/e/ozone/Curr_allmap_g.htm)
21NILU report 18/2021
Table 7 summarizes the ozone situation for Norway in 2020 and gives the percentage difference
between the monthly mean total ozone values in 2020 and the long-term monthly mean values at the
three Norwegian sites. As seen from Table 7, 2020 was characterized by very low total ozone values in
Ny-Ålesund in the spring, and the values remained low until the end of August.
Table 7: Percentage difference between the monthly mean total ozone values in 2020 and the long-
term 1979-1989 average for Oslo/Kjeller, Andøya, and Ny-Ålesund.
Month Kjeller (%) Andøya (%) Ny-Ålesund (%)
January -4.2
February -4.0 -16.8 -21.5
March 1.1 0.7 -23.1
April -17.8 -24.5 -27.1
May -1.7 0.7 -2.8
June -6.1 -9.2 -3.6
July 1.9 0.1 -1.5
August -3.8 -3.1 -0.5
September -2.0 3.6 14.9
October 0.2 -3.1 1.5
November 2.3
December -10.5
Figure 8, Figure 9 and Figure 10 show the percentage difference between yearly mean total ozone and
the long-term yearly mean for the period 1979-1989. The low values in 1983 and 1992/1993 are partly
related to the eruption of the El Chichón volcano in Mexico in 1982 and the Mount Pinatubo volcano
at the Philippines in 1991.
Comparison of Figure 8, Figure 9 and Figure 10 shows that the ozone patterns at the three Norwegian
sites have several similarities. At all sites high ozone values were measured in the end of the 1970s and
in 2010, 2013 and 2015. Moreover, all sites had very low ozone values 1990-1997, in 2011 (roughly 6%
below the long-term mean), and in 2020. In 2020 the annual ozone means were 4.0%, 4.9%, and 7.2%
below the long-term means at Kjeller, Andøya, and Ny-Ålesund, respectively. In the winter/spring of
1997, 2011 and 2020 there was a very strong and persistent polar vortex. This is clearly reflected by
the low annual average total ozone values these years (Figure 10).
22NILU report 18/2021
Oslo
Figure 8: Percentage difference between yearly mean total ozone in Oslo and the long-term yearly
mean 1979-1989.
Andøya
Figure 9: Percentage difference between yearly mean total ozone at Andøya and the long-term
yearly mean1979-1989 for the months March-October.
Ny-Ålesund
Figure 10: Percentage difference between yearly mean total ozone in Ny-Ålesund and the long-term
yearly mean 1979-1989 for the months March-October.
23NILU report 18/2021
2.6 Ozone and UV measurements at Troll
In austral summer 2006/2007, NILU established an atmospheric monitoring station at the Norwegian
Troll Station (72°01’S, 2°32’E, 1270 m a.s.l.). During the first years of operation the atmospheric station
was located close to the main building of Troll, which caused frequent episodes of local pollution. In
January 2014, the atmospheric monitoring station was moved uphill and about 2 km further away,
virtually eliminating the local pollution problem.
The instrumentation includes a NILU-UV instrument, which is NILU’s own version of a six-channel
broadband filter radiometer for the measurement of UV and visible radiation, comparable to the GUV
filter instrument used in the Norwegian ozone and UV monitoring network. A detailed description of
the instrument is given in Høiskar et al. (2003). Measurements of the first year of operation were
published in Hansen et al. (2009). An analysis of total ozone measurements from Troll 2007-2018 has
been published recently (Sztipanov et al., 2020).
The ozone and UV measurements at the Troll Station are not part of the Norwegian ozone and UV
monitoring program, but are funded by the Norwegian Ministry of Climate and Environment. One of
the goals of these measurements is to compare the development at high Southern latitudes with the
situation in the Arctic. After 14 years of operation, the data set also gives valuable information about
the long-term stability of the instrument. Unfortunately, NILU-UV no. 015 suffered a major technical
failure in April/May 2015, and it had to be replaced with NILU-UV no. 005 in November 2015.
Figure 11: Upper panel: Total ozone from NILU-UV and GOME-2 from November 2015 to February
2021. Lower panel: UVI from NILU-UV 2015-2020
24NILU report 18/2021
Figure 11, upper panel, shows NILU-UV total ozone values from Troll (green) and total ozone values
from GOME-2 (orange) at the Sanae station close to Troll. As seen, the Troll ground-based and satellite
data are in good agreement.
In contrast to 2019, when unusual weather patterns in the upper atmosphere over Antarctica limited
ozone depletion in September and October and resulted in the smallest ozone hole observed since
19823, the Antarctic ozone hole in 2020 was strong and long-lasting. In fact, the lowest values recorded
were close to the all-time lows of the years 1990 and 2000, and during several days in November and
December the depletion was the most severe ever recorded at this station. The Antarctic polar vortex
did not break up until around 20 December 2020 (Copernicus, 2021). The NILU-UV measurements are
in good agreement with satellite observations, with minimum total ozone values close to 100 DU in
October and a final recovery of total ozone in late December.
The situation in 2020 clearly shows that stratospheric ozone hole formation in Antarctica remains an
environmental issue almost 40 years after its discovery and 30 years after the implementation of
international regulatory measures. The CFC load in the stratosphere is still high, and depending on the
meteorological conditions future ozone holes may remain severe for decades to come. However, the
timing of the recovery of the ozone hole will probably not be significantly affected by increases in GHG
concentrations. There are no substantial differences between Antarctic total ozone columns at the end
of this century for the various GHG scenarios (WMO, 2018).
The low total ozone values in the late austral spring season caused severe UV levels, with a UV index
of almost 13 at the Troll station on two occasions in late November and early December. This is an
extremely high UVI, similar to the values normally measured in tropical regions during summer.
3
https://www.nasa.gov/feature/goddard/2019/2019-ozone-hole-is-the-smallest-on-record-since-its-discovery
25You can also read