Tourism and Hospitality
in Santa Cruz County
←
→
Page content transcription
If your browser does not render page correctly, please read the page content below

Tourism and Hospitality in Santa Cruz County
Santa Cruz County Tourism and Hospitality Report
                                                                                               Santa Cruz Workforce Development Board

Table of Contents
Table of Contents ..............................................................................................................................i
List of Figures .................................................................................................................................. iii
List of Tables ................................................................................................................................... iv
Introduction .............................................................................................................................. 1
   Tourism Industry Definitions ...................................................................................................... 1
   Tourism Industry Segments ........................................................................................................ 2
Executive Summary ........................................................................................................................ 3
Conclusions and Recommendations ........................................................................... 5
   Santa Cruz County’s Tourism & Hospitality Economy ............................................................... 5
   Today’s Hospitality Workforce ................................................................................................... 5
   The Tourism Talent Pipeline ....................................................................................................... 5
   The Quality of Life Equation ....................................................................................................... 6
Santa Cruz County Tourism and Hospitality Study Region ............................. 7
Tourism and Hospitality Employment in Santa Cruz County.......................... 8
   Greater Hospitality Workforce Demographics and Diversity .................................................. 11
   Overall Greater Hospitality Employment Growth ................................................................... 13
   Employment by Sub-Industry ................................................................................................... 16
Education and Training in Santa Cruz County ..................................................... 23
   Regional Education and Training Opportunities ...................................................................... 23
   Cabrillo College ......................................................................................................................... 23
   The Santa Cruz County Office of Education (COE) Career Technical Education Partnership
   (CTEP) ........................................................................................................................................ 24
   California State University Monterey Bay (CSUMB) ................................................................ 25
   Santa Cruz Tourism and Hospitality Careers ............................................................................ 25
   Career Pathways ....................................................................................................................... 27
   Foundational Skills in Tourism and Hospitality ....................................................................... 33
Employer Survey .................................................................................................................. 35
   Profile of Respondents ............................................................................................................. 35
   Respondent Firms’ Preferences and Opinions ......................................................................... 39
   Hiring Difficulty and Practices .................................................................................................. 41
Economic Impact of Tourism in Santa Cruz County ......................................... 44
   Baseline Impact ......................................................................................................................... 44
   Economic Impact Forecast Scenarios ....................................................................................... 49

                                                                                                                                                         i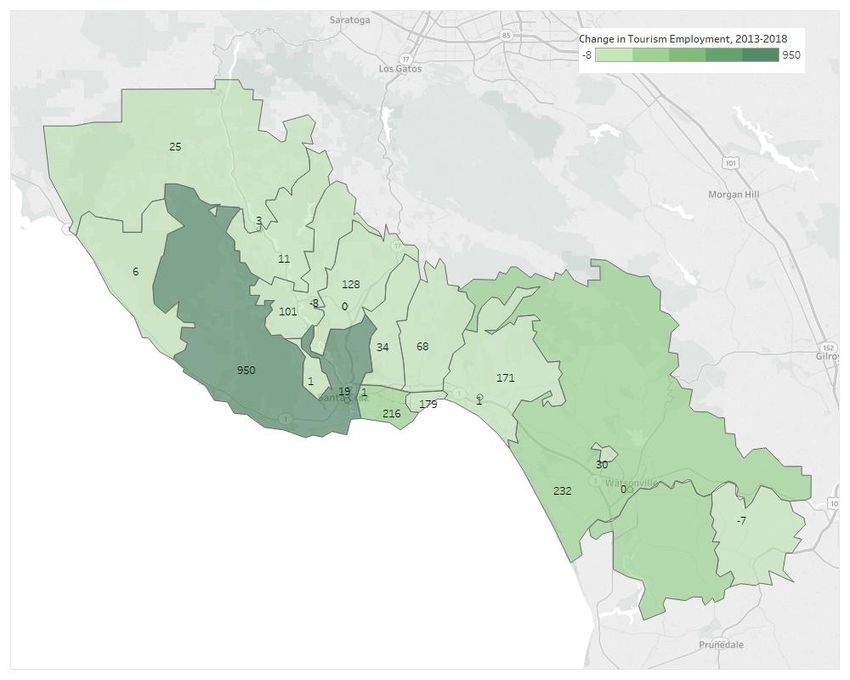
Santa Cruz County Tourism and Hospitality Report
                                                                                       Santa Cruz Workforce Development Board

Appendix A: Methodology................................................................................................ 52
   Quantitative Primary and Secondary Data Collection ............................................................. 52
   Qualitative Data Collection ...................................................................................................... 53
   IMPLAN Modeling and Analysis ............................................................................................... 53
Appendix B: Employer Survey Toplines ................................................................... 55

This WIOA Title I - financially assisted program or activity is an equal opportunity employer/program.
Auxiliary aids and services are available upon request to individuals with disabilities.

                                                                                                                                           ii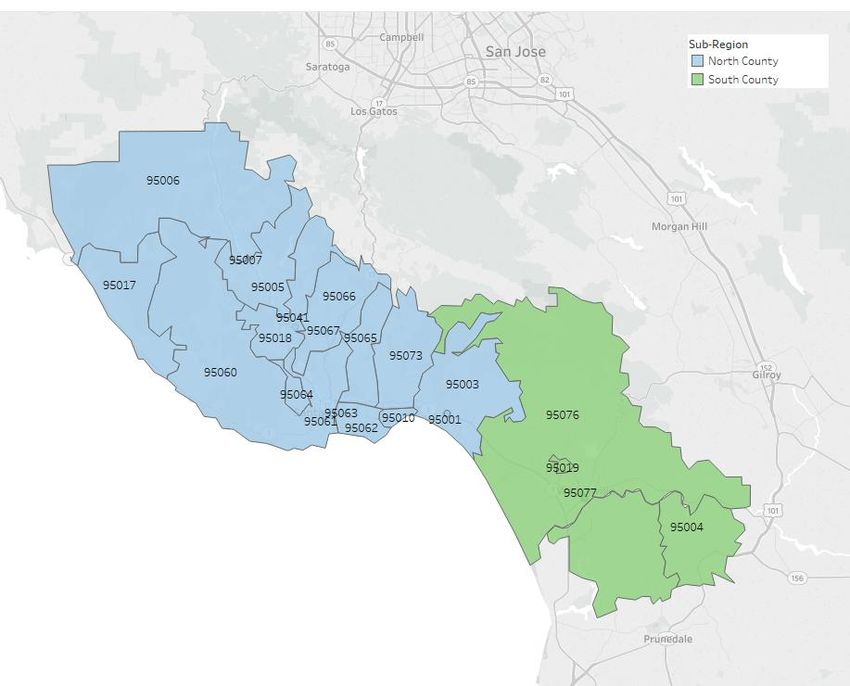
Santa Cruz County Tourism and Hospitality Report
                                                                                                Santa Cruz Workforce Development Board

List of Figures
Figure 1. Two Definitions of Employment in Santa Cruz County .................................................... 1
Figure 2. Greater Hospitality Share of all Jobs ................................................................................ 8
Figure 3. Portion of Greater Hospitality Jobs out of all Jobs ........................................................... 8
Figure 4. Greater Hospitality Employment by Sub-Industry ........................................................... 9
Figure 5. Visitor-Dependent Employment by Sub-Industry ............................................................ 9
Figure 6. Greater Hospitality Employment in Santa Cruz County by Zip Code, 2018.................... 10
Figure 7. Age Distributions of Greater Hospitality Employment ................................................... 11
Figure 8. Age Distributions of Employment in Santa Cruz County ................................................ 11
Figure 9. Santa Cruz County Employment by Race and Ethnicity ................................................. 12
Figure 10. Employment Growth Among Greater Hospitality Employment and the Overall
Regional Economy ......................................................................................................................... 13
Figure 11. Employment Growth Among Greater Hospitality and Overall Employment by Sub-
Region ............................................................................................................................................ 14
Figure 12. Change in Tourism Employment by Zip, 2013-2018..................................................... 15
Figure 13. Proportion of Workers by Sub-Industry and Region .................................................... 16
Figure 14. Proportion of Workers by Sub-Industry in Comparable Counties................................ 17
Figure 15. Greater Hospitality Sales by Sub-Sector, 2018 ............................................................. 19
Figure 16. Greater Hospitality Sub-Industries ............................................................................... 22
Figure 17. Industries of survey respondents ................................................................................. 35
Figure 18. Change in number of employees at Santa Cruz County location(s) over past three
years .............................................................................................................................................. 36
Figure 19. Share of respondents whose business employs temporary and/or seasonal workers 36
Figure 20. Origins of Visitors ......................................................................................................... 37
Figure 21. Sub-industries’ Geographic Origin of Primary Customers............................................ 38
Figure 22. Opinion on Santa Cruz County as a place to do Business............................................. 39
Figure 23. Opinion on Business Climate for Tourism and Hospitality in Santa Cruz County......... 39
Figure 24. Santa Cruz County as a Place to do Business by Hiring Difficulty................................. 40
Figure 25. Importance and Satisfaction with Services and Events ................................................ 40
Figure 26. Importance and Satisfaction with Talent Needs .......................................................... 41
Figure 27. Reasons for Entry-Level Position Hiring Difficulty ........................................................ 42
Figure 28. Reasons for Non-Entry-Level Position Hiring Difficulty ................................................ 42
Figure 29. At Least Some Interest in Potential Programs and Opportunities ............................... 43
Figure 30. How Often Respondents Promote from Within ........................................................... 43
Figure 31. Ten Sectors with the Greatest Increase in Employment due to Indirect Effects ......... 46

                                                                                                                                                          iii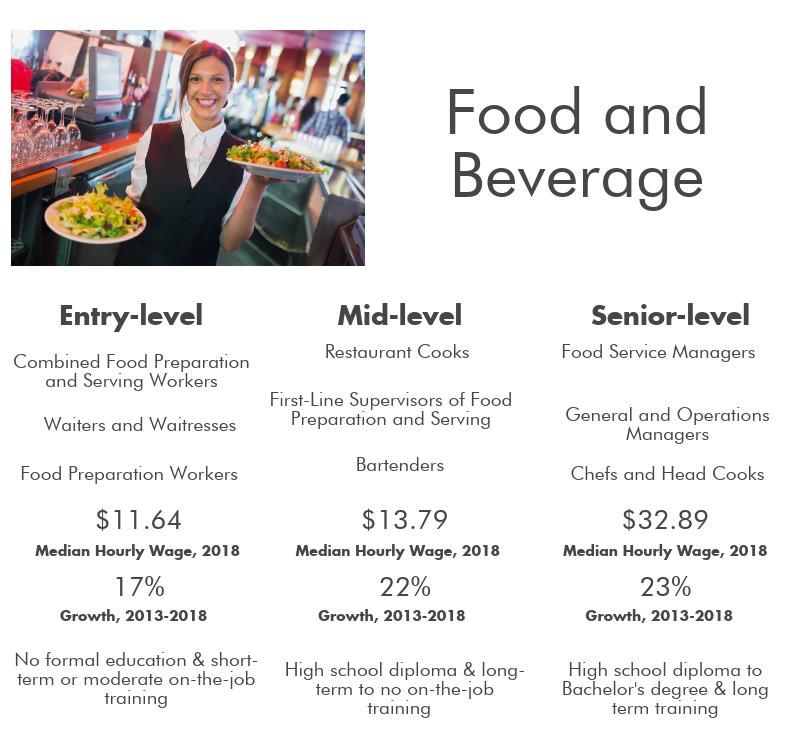
Santa Cruz County Tourism and Hospitality Report
                                                                                    Santa Cruz Workforce Development Board

Figure 32. Ten Sectors with the Greatest Increase in Employment due to Induced Effects ......... 46
Figure 33. Ten Sectors with the Greatest Increase in Employment due to Indirect Effects ......... 48
Figure 34. Ten Sectors with the Greatest Increase in Employment due to Induced Effects ......... 48

List of Tables
Table 1. Greater Hospitality Employment Growth, 2013-2018 .................................................... 13
Table 2. Employment by Sector in Santa Cruz County .................................................................. 18
Table 3. Employment Growth, Average Wages, and Job Quality by Tourism Sector ................... 21
Table 4. Top 15 Tourism Occupations in Santa Cruz County ......................................................... 25
Table 5. Importance of Entry-Level Tourism and Hospitality Abilities .......................................... 33
Table 6. Importance of Entry-Level Tourism and Hospitality Knowledge Attributes .................... 34
Table 7. Importance of Entry-Level Tourism and Hospitality Skills ............................................... 34
Table 8. Total Economic Impact of Greater Hospitality Employment in Santa Cruz County ........ 45
Table 9. Impact of Tourism-related Employment on Taxes .......................................................... 45
Table 10. Total Economic Impact of Tourism-related Employment in Santa Cruz County ........... 47
Table 11. Impact of Tourism-related Employment on Taxes ........................................................ 47
Table 12. Economic Impact of Maintained Growth in Santa Cruz County through 2021 ............. 49
Table 13. Impact of Maintained Growth Scenario on Taxes ......................................................... 50
Table 14. Economic Impact of Recession in Santa Cruz County through 2021 ............................. 50
Table 15. Impact of Recession on Taxes ........................................................................................ 50
Table 16. Economic Impact of Optimal Growth Scenario in Santa Cruz County through 2021 .... 51
Table 17. Impact of Optimal Growth Scenario on Taxes ............................................................... 51
Table 18. Overview of Survey Methodology ................................................................................. 52
Table 19. Industry Definitions and Percent of Exported Sales ...................................................... 53

                                                                                                                                     iv
Santa Cruz County Tourism and Hospitality Report
                                                                          Santa Cruz Workforce Development Board

Introduction
BW Research, in partnership with the Santa Cruz Workforce Development Board & Visit Santa Cruz
County, has developed a comprehensive profile of the Hospitality and Tourism industry in Santa Cruz
County (County includes all of the local cities, Capitola, Santa Cruz, Scotts Valley, and Watsonville, as
well as unincorporated areas of the County). This research will allow stakeholders to better
understand the underlying drivers, trends, and conditions that shape and drive Hospitality and
Tourism activity countywide, as well as prepare educators and trainers for the evolving needs of
Tourism and Hospitality employers. Furthermore, this research serves to provide a quantitative
analysis of the economic impacts of the Tourism and Hospitality industry and provide insights into
how these impacts may change within the next three to five years.

Tourism Industry Definitions
Two definitions of employment in Tourism and Hospitality will be used throughout this report. These
two definitions allow for greater understanding and a more comprehensive perspective of the
Tourism and Hospitality industry countywide. The two definitions1 are as follow:

-      Greater Hospitality Industry: This includes all jobs in industries that are related to Tourism and
       Hospitality. Under this definition, all employment in restaurants, hotels, wineries, and other
       related hospitality industries are included.

-      Visitor-Dependent Tourism Industry: This definition only includes employment that is directly
       attributed to visitor expenditures and is therefore a sub-set of the greater hospitality industry
       (Figure 1). These jobs are determined through percentage of export sales2 by industry. Thus, if
       34% of full-service restaurant sales are exported (buyers from outside of Santa Cruz County), only
       34% of employment in full-service restaurants is counted under this definition.

                              Figure 1. Two Definitions of Employment in Santa Cruz County

1
    Definitions by NAICS are available in Appendix A.
2
    Export sales by industry extracted from Emsi 2019.2

                                                                                                                     1
Santa Cruz County Tourism and Hospitality Report
                                                                Santa Cruz Workforce Development Board

Tourism Industry Segments
The Tourism and Hospitality industry are made up of several industry segments. For this study, the
greater industry is delineated into the following seven industry segments:
    •   Accommodations and Lodging includes hotels and motels, casino hotels, bed-and-breakfast
        inns, RV parks and campgrounds, room and board houses, and all other traveler
        accommodations. The occupations in this sector providing the most jobs include maids and
        housekeeping, desk clerks, waiters and waitresses, general maintenance and repair workers,
        restaurant cooks, and dining room, cafeteria, and bartender helpers. This industry segment
        has 83 firms and 1,310 greater hospitality jobs countywide.
    •   Attractions includes sales and employment related to museums, historical sites, nature parks
        and other similar institutions, and amusement and theme parks. The occupations with the
        most jobs within this sector are amusement and recreation attendants, cashiers, food
        preparation and serving workers, counter attendants, and lifeguards and other recreational
        protective service workers. This industry segment has 9 firms with 1,243 greater hospitality
        jobs countywide.
    •   Food and Beverage Services includes food service contractors, caterers, drinking places
        (alcoholic beverages), full- and limited-service restaurants, cafeterias, and snack and non-
        alcoholic bars. Occupations with the greatest number of employees are combined food
        preparation and serving workers, waiters and waitresses, restaurant cooks, food preparation,
        and fast food cooks. This industry segment has 563 firms with 10,486 greater hospitality jobs
        countywide.
    •   Recreation and Entertainment includes marinas, recreational goods rental, sports teams and
        clubs, racetracks, other gambling industries, golf courses and country clubs, recreational and
        vacation camps, and all other amusement and recreation industries. The most employed
        occupations in the County include fitness trainers, amusement and recreation attendants,
        recreation workers, receptionists and information clerks, and landscaping and
        groundskeeping workers. This industry segment has 91 firms with 1,298 greater hospitality
        jobs countywide.
    •   Transportation includes businesses related to scenic and sightseeing land transportation,
        scenic and sightseeing water transportation, scenic and sightseeing other transportation, and
        the charter bus industry. The occupations with most jobs in this sector include reservation
        and transportation ticket agents, bus drivers, office clerks, bus and truck mechanics, and
        dispatchers. This industry segment has 122 firms with 132 greater hospitality jobs
        countywide.
    •   Visitor and Travel Services includes gift, novelty, and souvenir stores, art dealers, travel
        agencies, tour operators, and all other travel arrangement and reservation services. The
        occupations that are most employed are retail salespersons, self-enrichment education
        teachers, reservation and transportation ticket agents and clerks, and cashiers. This industry
        segment has 61 firms with 346 greater hospitality jobs countywide.
    •   Events and Conferences includes convention and visitors’ bureaus and convention and trade
        show organizers. This industry segment has 4 firms with less than 50 greater hospitality jobs
        countywide.

                                                                                                           2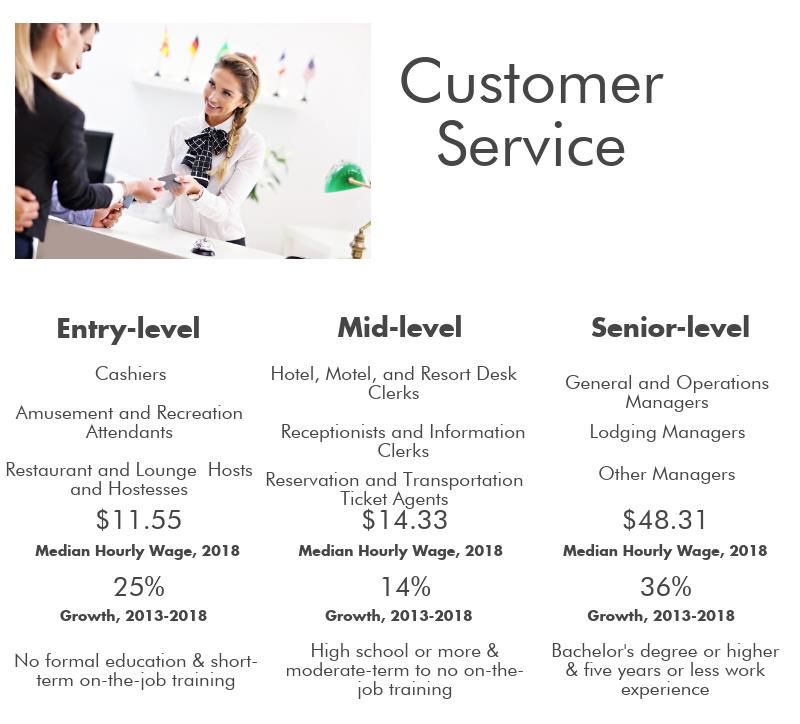
Santa Cruz County Tourism and Hospitality Report
                                                                          Santa Cruz Workforce Development Board

Executive Summary
The following section highlights some of the key findings and insights discussed throughout this
report.

Greater hospitality grew at a faster rate in Santa Cruz County than overall employment. While
overall employment countywide increased by 8% between 2013 and 2018, greater hospitality
employment increased by more than double that (17%) amount over the same time period. Greater
hospitality employment in North County grew faster (18%) than employment in South County (13%).

Greater hospitality employment accounts for a larger share of overall employment in Santa Cruz
County than state and national averages. When viewed in comparison to surrounding counties, the
County has a higher proportion of greater hospitality jobs than Santa Clara County or Monterey
County, though a lower proportion than San Luis Obispo and San Mateo counties. About 17% of all
jobs countywide are related to greater hospitality employment (based on economic impact analysis
which includes indirect and induced jobs).

Finding, recruiting, and retaining talent—at all levels of experience —are one of employers most
significant challenges for the greater hospitality industry. Two-thirds of employers stated they had
difficulty hiring entry-level applicants. High costs of living, entry-level wages, and traffic-filled
commutes make attracting and retaining talent a constant challenge. Subsequently, it is no surprise
that 31% of greater hospitality employees in the County are 24 years of age or younger. About 27%
of this younger workforce are between the ages of 14-18. The portion of workers 55 and older are
comparable to state averages.

Tourism employers have mixed feelings about the direction of Santa Cruz County as a place to do
business. About one-third (32%) felt that the County was getting better, 22% felt it was getting
worse, and 43% felt it was staying about the same. When these responses are tabulated by the level
of hiring difficulty an employer has, a trend is observable. Over two-thirds (68%) of respondents that
indicated the business climate for Tourism and Hospitality countywide was getting worse also stated
they were having great difficulty hiring, compared to only 39% of those that indicated the business
climate was getting better for Tourism and Hospitality, indicated great hiring difficulty. This suggests
hiring difficulty plays a meaningful role in the perception of the County’s business climate.

Greater hospitality employment in Santa Cruz County creates over 3,600 additional jobs
throughout the County. These jobs, created through indirect and induced effects,3 are most
commonly created in industries like real estate, restaurants, management of companies and
enterprises, independent artists, writers, and performers, and wholesale trade. Visitor-dependent
employment results in over 1,800 additional jobs throughout countywide.

3
    For definitions of indirect and induced effects, please see page 34

                                                                                                                     3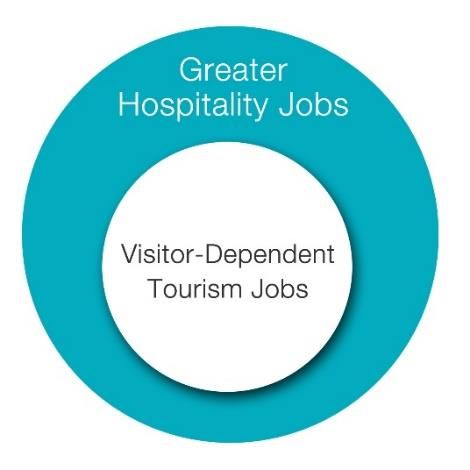
Santa Cruz County Tourism and Hospitality Report
                                                               Santa Cruz Workforce Development Board

The revenue generated through the County’s Transient Occupancy Tax (TOT) rose steadily from
2011 to 2018. Over this period, total County TOT revenue increased by 82%.4 The TOT rate increased
from 9.5% to 11% in July of 2013 which accounted for some of the increased revenue, but most can
be attributed to greater spending on lodging and property rentals, such as Airbnb. Employment in
the Accommodations and Lodging industry segment over this same time period only increased by
22%, considerably less than the large proportional increase in TOT revenue. This indicates our
employment and economic impact figures are undercounting the employment and economic impact
that is found in the online rental market, directly tied to visitor expenditures.

Santa Cruz County’s high cost of housing is hampering the Tourism and Hospitality sector as it
works to find and retain valuable employees. Housing programs and other alternatives have been
developed in other parts of the country and can increase the availability of low or moderate-income
housing to expand the local workforce. Communities such as Martha’s Vineyard in Massachusetts
have created a non-profit organization (Island Housing Trust) that is working with community
partners to create and sustain permanently affordable housing solutions for the local workforce. To
learn more about the Island Housing Trust, please visit http://www.ihtmv.org/about/. The practice of
employer-assisted housing has even attracted the attention of the Federal Reserve Bank, which
highlighted the types of employer-assisted housing programs in its newsletter, which can be viewed
here: https://www.bostonfed.org/-/media/Documents/necdac/EmployerAssistedHousing.pdf.

4
    Santa Cruz County Treasurer-Tax Collector

                                                                                                          4
Santa Cruz County Tourism and Hospitality Report
Santa Cruz Workforce Development Board
Conclusions and Recommendations
BW Research offers the following conclusions and recommendations based on the findings from this
study;
Santa Cruz County’s Tourism & Hospitality Economy
The Tourism and Hospitality sector in Santa Cruz plays a foundation role in the Countywide economy.
One out of every six jobs in the County is directly or indirectly tied to the sector. On average, every
month the sector generates as much economic impact as one and half Comic-cons, or 18 comic-cons
in a single year. The Tourism and Hospitality sector not only creates jobs and brings in revenue from
outside the region, the sector also provides valuable opportunities for local entrepreneurs (see “A
Santa Cruz County Case Study: The Aspromonte’s - A Santa Cruz Family” on page 11) as well as
students and job-seekers looking to develop new skills and enter occupational career pathways
(see the sector’s Occupational Career Pathways on pages 26-30). Lastly, the sector plays an
important part in defining and improving the region’s quality of life (see Quality of Life Equation, in
this section).
Today’s Hospitality Workforce
There were several valuable themes we learned from talking to Santa Cruz County employers in the
Tourism and Hospitality sector, but none more pronounced than the current challenge of finding,
retaining, and developing qualified entry-level workers. Over 85% of Tourism and Hospitality
businesses that responded to our employer survey indicated either some difficulty (39%) or great
difficulty (48%) finding qualified entry-level job applicants, and a similar percentage (88%) indicated
that the ability to retain valued employees over time was “very important”. These figures indicate
that an entry-level workforce shortage for Tourism and Hospitality in the County is not something on
the horizon but is here today and is likely having an impact on the sector. It is also important to note
that the workforce shortage in Tourism and Hospitality is likely to have a domino effect on other
industries such as real estate, retail, and finance as younger, developing talent often acquire and
expand their workforce environment skills while employed in an entry-level position in the Tourism
and Hospitality sector.
The Tourism Talent Pipeline
As the section above describes there are several workforce challenges facing the Tourism and
Hospitality industry, namely recruiting and developing skilled talent that will continue to be available
to employers in the County. The following workforce development strategies are meant to support
both students and jobseekers in the region as well as Tourism and Hospitality businesses;
1. Develop and promote the occupational career pathways that are often found in the
Tourism and Hospitality sector and connected to other industry clusters. This will include
the workplace skills that are often developed in the industry and can be connected to other
industry sectors, such as F.I.R.E. (Finance, Insurance, Banking, & Real Estate), Business
Services and Retail. (See pages 26 – 32 for more information on sector skills and relevant
career pathways.)
5Santa Cruz County Tourism and Hospitality Report
Santa Cruz Workforce Development Board
2. Expand connections with local high schools, colleges and universities to better
communicate the employment opportunities for students in the Tourism and Hospitality
sector. The communications should be geared towards highlighting some of the skills
students can gain from employment in these occupations (i.e. communication, customer
service, management, etc.) as well as the entry into different career pathways. Potential
employees should also be made aware of the perks for employment (i.e. providing free
Boardwalk wristbands for employees, etc.). Potential partnerships with schools should be
explored to create work-study programs or potentially offer credits for certain courses
and/or programs.
3. Examine opportunities to support small businesses and entrepreneurship in Santa Cruz
County’s Tourism and Hospitality sector. This could include branding and marketing
investments in the region, supporting the expansion or improvement of local recreation
resources, and/or identifying and supporting events and conferences that improve the image
and opportunities for the sector.
The Quality of Life Equation
Ultimately, like any foundational industry cluster within a region, the Tourism and Hospitality
industry not only provides important economic benefits for the region; it helps define and is
intertwined into the quality of life equation for the community. In Santa Cruz County, the natural
recreational resources, the food and beverage firms, the lodging and accommodation facilities, as
well as local attractions such as the Boardwalk and the wharf all play a central role in defining and
supporting the County’s high quality of life. This relationship is also true in the other direction. The
region’s overall quality of life has a considerable impact on the health and vitality of the County’s
Tourism and Hospitality sector. Issues such as homelessness, traffic, transportation, and the high
cost of living are already impacting the industry and help explain the entry-level workforce shortage
that was discussed earlier in this section.
6Santa Cruz County Tourism and Hospitality Report
Santa Cruz Workforce Development Board
Santa Cruz County Tourism and Hospitality Study
Region
NORTH SOUTH
Aptos, Ben Lomond, Boulder Creek, Brookdale, Capitola,
Davenport, Felton, Mount Hermon, Santa Cruz, Scotts
Valley, Soquel Aromas, Freedom, Watsonville
95001, 95003, 95005, 95006, 95007, 95010, 95017, 95004, 95019, 95076, 95077
95018, 95041, 95060, 95061, 95062, 95063, 95064,
95065, 95066, 95067, 95073
7Santa Cruz County Tourism and Hospitality Report
Santa Cruz Workforce Development Board
Tourism and Hospitality Employment in Santa Cruz
County
Greater hospitality employment accounts for a larger portion of jobs in the County than in California
or the United States. Nearly 14% of jobs countywide can be categorized as greater hospitality related
employment, while only about 12% and 11% of all jobs in California and the United States,
respectively, can be classified as such (Figure 2).
Figure 2. Greater Hospitality Share of all Jobs5
14.0% 13.6%
11.8% 11.4%
12.0%
10.0%
8.0%
6.0%
4.0%
2.0%
0.0%
Santa Cruz County California United States
Greater hospitality employment countywide is moderately concentrated compared to other nearby
counties. More than 15% of employment in San Luis Obispo and San Mateo counties is in greater
hospitality. The County has a larger proportion of greater hospitality employment than Monterey
County and Santa Clara County, where greater hospitality accounts for 13% and 10% of all
employment, respectively.
Figure 3. Portion of Greater Hospitality Jobs out of all Jobs6
San Luis Obispo County 15.8%
San Mateo County 15.2%
Santa Cruz County 13.6%
Monterey County 12.8%
Santa Clara County 9.6%
0.0% 5.0% 10.0% 15.0% 20.0%
5
Emsi 2019.2 QCEW and Non-QCEW
6
Emsi 2019.2 QCEW and Non-QCEW
8Santa Cruz County Tourism and Hospitality Report
Santa Cruz Workforce Development Board
There are 14,833 greater hospitality jobs countywide. Food and beverage services account for the
greatest number of jobs in the region, with over two-thirds of greater hospitality employment.
Accommodations and lodging, attractions, and recreation and entertainment each employ over
1,200 individuals countywide (Figure 4).
Figure 4. Greater Hospitality Employment by Sub-Industry7
132
1 1,310 1,243 10,486 1,298
346
0 2,000 4,000 6,000 8,000 10,000 12,000 14,000 16,000
Accommodations and Lodging Attractions Events and Conferences
Food and Beverage Services Recreation and Entertainment Transportation
Visitor and Travel Services
Food and beverage services are also the largest source of visitor-dependent tourism employment,
accounting for just over half (54%) of all industry jobs. Accommodations and lodging, and attractions,
respectively the second and third-largest sub-industries, account for a combined 34% of visitor-
dependent employment (Figure 5).
Figure 5. Visitor-Dependent Employment by Sub-Industry8
122
1,296 1,243 4,014 417
342
0 1,000 2,000 3,000 4,000 5,000 6,000 7,000 8,000
Accommodations and Lodging Attractions Events and Conferences
Food and Beverage Services Recreation and Entertainment Transportation
Visitor and Travel Services
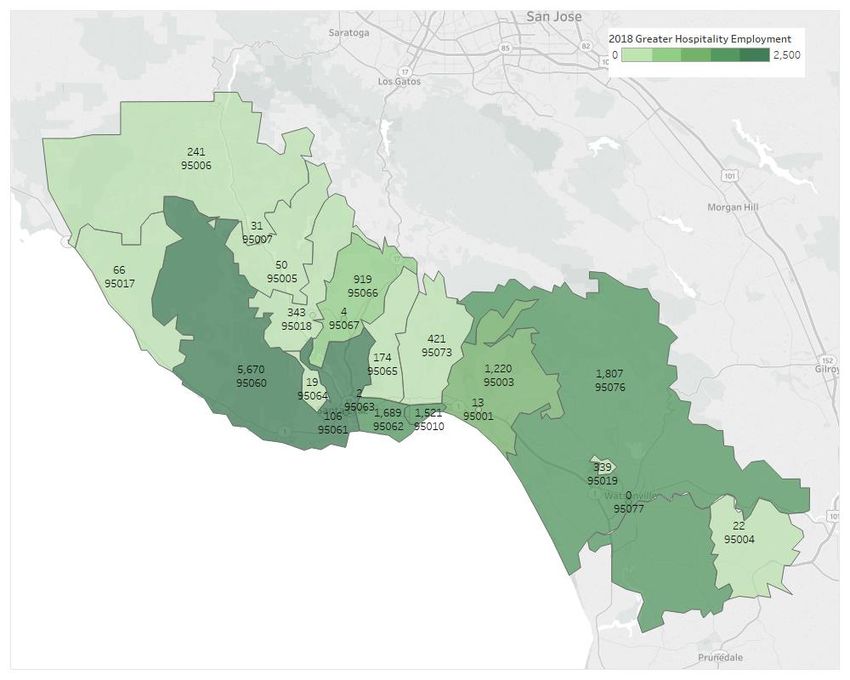
The zip code 95060, which includes a portion of the City of Santa Cruz, Pasatiempo, and Bonny Doon,
has more than 5,600 greater hospitality jobs. The zip code 95076 (near Watsonville), 95062 (including
7
Emsi 2019.2 QCEW and Non-QCEW
8
Emsi 2019.2 QCEW and Non-QCEW
9Santa Cruz County Tourism and Hospitality Report
Santa Cruz Workforce Development Board
portions of the City of Santa Cruz, Live Oak, and Capitola), and 95010 (Capitola) each have more than
1,500 greater hospitality jobs (Figure 6).
Figure 6. Greater Hospitality Employment in Santa Cruz County by Zip Code9, 2018
9
Emsi 2019.2 QCEW and Non-QCEW
10Santa Cruz County Tourism and Hospitality Report
Santa Cruz Workforce Development Board
Greater Hospitality Workforce Demographics and Diversity
Demographics and diversity among those working in greater hospitality roles countywide are
comparable to those found across California. Females make up 51% of the greater hospitality
workforce, while females account for 50% of greater hospitality employment in all of California. The
County’s greater hospitality workforce has a higher percentage of workers who are between the ages
of 14 and 24, compared to California’s greater hospitality workforce (Figure 7). In the County, the
greater hospitality workforce is also notably younger than the overall workforce. While 31% of
greater hospitality workers are 24 years of age or younger, only 14% of the overall workforce falls
under this age bracket (Figure 8).
Figure 7. Age Distributions of Greater Hospitality Employment10
35% 31%
30% 26%
24% 25%
25%
20% 16% 17% 15%
15% 13%
9% 11%
10% 7% 6%
5%
0%
Ages 14-24 Ages 25-34 Ages 35-44 Ages 45-54 Ages 55-64 Ages 65 or Older
Santa Cruz County Greater Hospitality California Greater Hospitality
Figure 8. Age Distributions of Employment in Santa Cruz County11
35% 31%
30%
24% 23%
25% 20% 20%
20% 16% 16%
14% 13%
15%
9%
10% 7% 7%
5%
0%
Ages 14-24 Ages 25-34 Ages 35-44 Ages 45-54 Ages 55-64 Ages 65 or Older
Santa Cruz County Greater Hospitality Santa Cruz County Overall Workforce
10
Emsi 2019.2 QCEW and Non-QCEW
11
Emsi 2019.2 QCEW and Non-QCEW
11Santa Cruz County Tourism and Hospitality Report
Santa Cruz Workforce Development Board
In regards to race and ethnicity, the County’s greater hospitality workforce is proportionally similar to
the County’s overall workforce (Figure 9) and is providing employment opportunities for individuals
across race and ethnicity.
Figure 9. Santa Cruz County Employment by Race and Ethnicity12
60% 50.7%
50% 49.4%
40% 35.1%
35.0%
30%
20%
7.9%9.1%
10% 3.0%3.5% 0.4%0.3% 0.3%0.3% 2.7%2.4%
0%
Hispanic or White Black or African American Indian Asian Native Hawaiian Two or More
Latino American or Alaska Native or Other Pacific Races
Islander
Santa Cruz County Greater Hospitality Santa Cruz County Overall
A Santa Cruz County Case Study: The Aspromonte’s - A Santa Cruz Family
In 1960 Joe and Elena Aspromonte arrived in Santa Cruz. They managed a small motel while Joe
labored in a factory and Elena waitressed. They pulled their savings together to buy the Sea Beach
Motel across from the Boardwalk. They added on to it and then sold it. They then built and sold two
more inns by the Boardwalk and then built the Islander on Ocean Street. At that point, Joe tragically
passed away; he was only 40. Elena persevered and built a second hotel on Ocean Street, the
Continental. She succeeded despite having to navigate a business and construction world dominated
by men and in a language that was not her own. She had emigrated from Italy in her late teens.
Elena then found the second love of her life, Dennis Wall, and together they continued to build and
operate hotels—18 in all —across Northern and Central California, favoring local contractors and
artisans when possible. Elena Aspromonte passed away in early 2019 and is survived by her sons Dan,
Bill, and Mark. The family currently operates two award-winning hotels in Capitola, a Marriott Fairfield
and Best Western, and Best Westerns in Watsonville and Angels Camp. The Aspromonte’s are proud of
their commitment to and their contributions for the local community.
12
Emsi 2019.2 QCEW and Non-QCEW
12Santa Cruz County Tourism and Hospitality Report
Santa Cruz Workforce Development Board
Overall Greater Hospitality Employment Growth
Between 2013 and 2018, greater hospitality employment, in both the County and in California,
outpaced the employment growth rates of the overall economies of their respective regions. While
California’s overall employment outpaced the County’s overall employment rate by more than three
percentage-points, one percentage-point separates the greater hospitality employment growth rates
of the two regions (Figure 10).
Figure 10. Employment Growth Among Greater Hospitality Employment and the Overall Regional Economy13
20.0%
18.3%
17.2%
15.0%
11.6%
10.0%
8.3%
5.0%
0.0%
2013 2014 2015 2016 2017 2018
Santa Cruz County - Greater Hospitality California - Greater Hospitality
Santa Cruz County - Overall California - Overall
Greater hospitality employment countywide grew at a faster rate than the neighboring Counties of
San Luis Obispo, Monterey, and San Mateo. Only greater hospitality employment in Santa Clara
County increased at a greater rate, driven by strong growth in full- and limited-service restaurants
(Table 1).
Table 1. Greater Hospitality Employment Growth, 2013-201814
18.5% Santa Clara County
17.2% Santa Cruz County
16.4% San Luis Obispo County
13.2% Monterey County
10.4% San Mateo County
13
Emsi 2019.2 QCEW and Non-QCEW
14
Emsi 2019.2 QCEW and Non-QCEW
13Santa Cruz County Tourism and Hospitality Report
Santa Cruz Workforce Development Board
Greater hospitality employment in the sub-regions of the County each grew more than overall
employment in their respective regions. Greater hospitality employment in the North County sub-
region increased by seven percentage-points more than overall employment in the sub-region. The
variation was even greater in the South County sub-region; greater hospitality employment increased
by 10-percentage points more than overall employment in the sub-region (Figure 11). This
discrepancy can largely be accounted for through two phenomena. First, employment in North
County was aided by strong employment growth on the Boardwalk and other amusement locations,
such as Mystery Spot. Second, greater hospitality employment was the primary driver of overall
employment growth in South County; about 30% of all employment growth in South County between
2013-2018 was driven by gains in the greater hospitality industry.
Figure 11. Employment Growth Among Greater Hospitality and Overall Employment by Sub-Region15
20.0%
17.9%
15.0%
13.3%
10.0% 10.2%
5.0%
3.2%
0.0%
2013 2014 2015 2016 2017 2018
-5.0%
SC North County - Greater Hospitality SC South County - Greater Hospitality
SC North County - Overall SC South County - Overall
15
Emsi 2019.2 QCEW and Non-QCEW
14Santa Cruz County Tourism and Hospitality Report
Santa Cruz Workforce Development Board
Tourism jobs have increased in greatest numbers near 95060 (covering portions of the City of Santa
Cruz) and the southern and coastal portions of the County, such as 95076 (near Watsonville) and
95062 (within the City of Santa Cruz and portions of Live Oak). The latter two zip codes saw an
increase of over 200 greater hospitality employees between 2013-2018, and tourism jobs in 95060
increased by 950 jobs (Figure 12). Most of this employment growth was in full-service restaurants,
snack and nonalcoholic beverage bars, and drinking places. The zip code 95060 also saw an increase
of about 200 more jobs in amusement and theme parks (primarily the Boardwalk).
Figure 12. Change in Tourism Employment by Zip, 2013-201816
16
Emsi 2019.2 QCEW and Non-QCEW
15Santa Cruz County Tourism and Hospitality Report
Santa Cruz Workforce Development Board
Employment by Sub-Industry
Comparing the proportions of employment across the sub-categories within greater hospitality
provides insight into how the County’s Tourism and Hospitality industry differs from that of the state
and nation. The County has a notably higher percentage of employment within the attractions sub-
industry and relatively lower percentages of those working in accommodations and lodging,
recreation and entertainment, and transportation (Figure 13).
Figure 13. Proportion of Workers by Sub-Industry and Region
3.0%
Visitor and Travel Services 2.8%
2.3%
3.1%
Transportation 3.2%
0.9%
11.3%
Recreation and Entertainment 11.1%
8.7%
68.0%
Food and Beverage Services 67.6%
70.7%
0.4%
Events and Conferences 0.4%
0.1%
2.1%
Attractions 3.0%
8.4%
12.2%
Accommodations and Lodging 11.9%
8.8%
0.0% 10.0% 20.0% 30.0% 40.0% 50.0% 60.0% 70.0% 80.0%
US California Santa Cruz
A glimpse at the proportions of sub-industry employment in neighboring counties reveals similar
trends. Again, the County stands out in its high portion of employment in the attractions sub-
industry, most of which can be attributed to the Boardwalk. The County also has a relatively low
proportion of those working in accommodations and lodging (Figure 14). The County seems to be
most similar to Santa Clara County in regard to Tourism and Hospitality employment by sub-
industries. Relatively high proportions of food and beverage services seem to correlate with recent
strong overall greater hospitality growth; Santa Clara and Santa Cruz counties had the two largest
employment growth rates of all comparison counties.
16Santa Cruz County Tourism and Hospitality Report
Santa Cruz Workforce Development Board
Figure 14. Proportion of Workers by Sub-Industry in Comparable Counties
3.2%
3.4%
Visitor and Travel Services 1.7%
1.7%
2.3%
0.9%
21.6%
Transportation 1.2%
1.2%
0.9%
11.9%
9.2%
Recreation and Entertainment 7.3%
8.3%
8.7%
72.4%
52.5%
Food and Beverage Services 56.3%
66.6%
70.7%
0.3%
0.9%
Events and Conferences 0.4%
0.0%
0.1%
2.3%
0.2%
Attractions 2.5%
0.3%
8.4%
9.0%
12.1%
Accommodations and Lodging 30.6%
21.8%
8.8%
0.0% 10.0% 20.0% 30.0% 40.0% 50.0% 60.0% 70.0% 80.0%
Santa Clara County San Mateo County Monterey County San Luis Obispo County Santa Cruz County
Table 2 highlights number of greater hospitality and visitor-dependent jobs, total establishments
related to this employment, 2018 visitor-dependent sales, and the average annual earnings of each
industry sector. Food and beverage services accounted for about 39% of all visitor-dependent sales in
2018 while accounting for about 54% of the jobs in the region. The events and conferences sub-
industry is the only sub-industry to offer average annual earnings above $40,000 per year (Table 2).
Ultimately, the industry’s generally entry-level wages combined with the County’s relatively high cost
of living are creating an increasing gap between workers and employers.
17Santa Cruz County Tourism and Hospitality Report
Santa Cruz Workforce Development Board
Table 2. Employment by Sector in Santa Cruz County17
GREATER TOTAL VISITOR- 2018 VISITOR-
TOURISM INDUSTRY AVERAGE ANNUAL
HOSPITALITY ESTABLISHMENTS DEPENDENT DEPENDENT
SECTORS 18 EARNINGS
JOBS JOBS SALES19
Attractions 1,243 9 1,243 $107,410,152 $30,044
Accommodations/Lodging 1,310 83 1,296 $196,123,135 $33,741
Events and Conferences 18 4 18 $10,068,614 $54,700
Food and Beverage Services 10,486 563 4,014 $284,155,391 $25,689
Recreation and
1,298 91 417 $49,633,571 $23,443
Entertainment
Transportation 132 8 122 $20,267,412 $39,182
Visitor/Travel Services 346 61 342 $53,611,168 $27,852
TOTAL 14,833 819 7,452 $721,269,443 $28,700
Attractions includes sales and employment related to museums, historical sites, zoos and botanical gardens,
nature parks and other similar institutions, and amusement and theme parks. In 2018, total visitor-dependent
sales for this sector were over $107 million and accounted for about 27% of all visitor-dependent sales. The
occupations with the most jobs within this sector are amusement and recreation attendants, cashiers, food
preparation and serving workers, counter attendants, and lifeguards and other recreational protective service
workers.
Accommodations and Lodging includes hotels and motels, casino hotels, bed-and-breakfast inns, RV parks and
campgrounds, rooming and boarding houses, and all other traveler accommodations. Total visitor-dependent
sales were about $196 million. Hotels and motels are the main drivers of growth and employment in this
subsector. The occupations in this sector providing the most jobs include maids and housekeeping cleaners,
hotel, motel and resort desk clerks, waiters and waitresses, general maintenance and repair workers, restaurant
cooks, and dining room, cafeteria, and bartender helpers.
Food and Beverage Services includes food service contractors, caterers, drinking paces (alcoholic beverages),
full- and limited-service restaurants, cafeterias, and snack and non-alcoholic bars. Total visitor-dependent sales
in the food and beverage services sector about $284 million or 39% of the total visitor-dependent sales in 2018.
Since 2013, industries like full-service restaurants, snack and nonalcoholic beverage bars, and food service
contractors have experienced the greatest growth in employment. Occupations with the greatest number of
employees are combined food preparation and serving workers, waiters and waitresses, restaurant cooks, food
preparation, and fast food cooks.
Recreation and Entertainment includes marinas, recreational goods rental, sports teams and clubs, racetracks,
casinos, other gambling industries, golf courses and country clubs, recreational and vacation camps, and all other
amusement and recreation industries. Total visitor-dependent sales within this sector were about $49 million in
17
EMSI 2019.2 QCEW and Non-QCEW
18
DataUSA.com
19
Calculated as the share of total sales that are exports.
18Santa Cruz County Tourism and Hospitality Report
Santa Cruz Workforce Development Board
2018, or 7% of all visitor-dependent sales. The most employed occupations in the County include fitness trainers,
amusement and recreation attendants, recreation workers, receptionists and information clerks, and
landscaping and groundskeeping workers.
Transportation includes businesses related to scenic and sightseeing land transportation, scenic and sightseeing
water transportation, scenic and sightseeing other transportation, and the charter bus industry. Total visitor
dependent sales in the transportation sector were $20.2 million in 2018, or 3% of total visitor-dependent sales.
The occupations with most jobs in this sector include reservation and transportation ticket agents, bus drivers,
office clerks, bus and truck mechanics, and dispatchers.
Visitor and Travel Services includes gift, novelty, and souvenir stores, art dealers, travel agencies, tour operators,
and all other travel arrangement and reservation services. Visitor-dependent sales in this sector were over $53.6
million. The occupations that are most employed are retail salespersons, self-enrichment education teachers,
reservation and transportation ticket agents and clerks, and cashiers.
Events and Conferences includes convention and visitors’ bureaus and convention and trade show organizers.
Total visitor-dependent sales for 2018 were $10 million, or 1.4% of visitor-dependent sales.
Food and beverage services accounted for about 60% of all greater hospitality sales in the County in
2018. Accommodations and lodging accounted for about 14% (Figure 15) and recreation and
entertainment accounted for just under 11% of greater hospitality sales. In comparison, food and
beverage services accounted for about 56% of greater hospitality sales in Santa Clara County, and
accommodation and lodging accounted for about 13%. Given that these proportions are relatively
close in line with one another and that both Counties had the highest employment growth rates of
the comparison regions, it suggests that the proportions of employment and revenues of each sub-
sector are in relatively strong states.
Figure 15. Greater Hospitality Sales by Sub-Sector, 2018
2.5% 4.0% Accommodations and
Lodging
14.4%
Attractions
10.8%
7.9% Events and Conferences
0.7%
Food and Beverage Services
Recreation and
59.6% Entertainment
Transportation
19Santa Cruz County Tourism and Hospitality Report
Santa Cruz Workforce Development Board
The following occupational segmentation technique delineates most occupations into one of three
tiers, based on their average wages and skill requirements. They are broadly defined as follows:
Tier 1 Occupations Tier 2 Occupations Tier 3 Occupations
are typically the highest- are typically the middle-skill, are typically the lowest-
paying, highest-skilled middle-wage occupations. In paying, lowest-skilled
occupations in the economy. 2018, the median annual occupations that have
In 2018, the median annual wage for Tier 2 occupations historically provided the
wage for Tier 1 occupations in Santa Cruz County was largest portion of
in Santa Cruz County was approximately $51,088 a employment in the region. In
approximately $89,031 per year. This occupational 2018, the median annual
year. This occupational category includes positions wage for Tier 3 occupations
category includes positions such as technicians, teachers, in Santa Cruz County was
such as managers (e.g., Chief office and administrative approximately $33,215 a
Executives and Sales positions (e.g., Accounting year. These occupations
Managers), professional Clerks and Secretaries), and include positions such as
positions (e.g., Lawyers and manufacturing, operations, security guards, food service
Physicians) and highly skilled and production positions and retail positions, building
technology occupations, (e.g., Assemblers, and grounds cleaning
such as scientists, engineers, Electricians, and Machinists). positions (e.g., Janitors), and
computer programmers, and personal care positions (e.g.,
software developers. Home Health Aides and Child
Care Workers).
20Santa Cruz County Tourism and Hospitality Report
Santa Cruz Workforce Development Board
Each of these sectors varies in terms of structure and organization, occupational staffing patterns,
job growth, job quality, and average wages. Transportation, recreation and entertainment, and
visitor and travel services provide the highest concentrations of tier 2 and tier 1 employment, which
generally offer higher wages (Table 3). In comparison, only one out of every 20 (5%) food and
beverage jobs are tier 1 or tier 2.
Table 3. Employment Growth, Average Wages, and Job Quality by Tourism Sector20 21
GREATER
HOSPITALITY AVERAGE % TIER 1 % TIER 2 % TIER 3
EMPLOYMENT WAGE 2018 OCCUPATIONS OCCUPATIONS OCCUPATIONS
GROWTH 2013-2018
Accommodation and 12% $33,741 6.2% 13.3% 80.5%
Lodging
Recreation and 19% $23,443 7.6% 20.2% 72.2%
Entertainment
Food and Beverage 17% $25,689 2.7% 1.9% 95.3%
Visitor & Travel Services -5% $27,852 8.8% 18.6% 72.6%
Attractions 28% $30,044 8.5% 16.2% 75.3%
Events and Conferences 27% $54,700 N/A N/A N/A
Transportation 130% $39,182 5.9% 43.9% 50.2%
OVERALL 33% $28,700 4.1% 6.4% 89.5%
20
Emsi 2019.2 QCEW and Non-QCEW
21
Insufficient employment in Events and Conferences to determine occupational tiers
21Santa Cruz County Tourism and Hospitality Report
Santa Cruz Workforce Development Board
With exception of transportation, events and conferences, and visitor and travel services, most sub-
industries are clustered in the range of 10-30% growth and annual earnings between $20,000 and
$35,000 (Figure 16). These four sub-industries also account about 97% of greater hospitality
employment countywide. Four out of seven sub-sectors in Santa Clara County grew at rates greater
than those in Santa Cruz County, though nearly all of these rates were within five percentage-points
of each other. Conversely, employment in Santa Clara attractions and transportation increased at
slower rates than the sub-sectors in Santa Cruz County. This means that, while growth rates differed
slightly between the two counties due to their different underlying composition, Santa Cruz saw
strong growth that is relatively comparable to the counties that have experienced the strongest
growth in Tourism and Hospitality.
Figure 16. Greater Hospitality Sub-Industries
$55,000
Events and
Conferences
$50,000
$45,000
Average Annual Earnings
$40,000
Accommodations and
Lodging Transportation
$35,000
Attractions
Visitor and Travel
$30,000 Services
Food and Beverage
$25,000 Services
Recreation and
$20,000 Entertainment
-10% 10% 30% 50% 70% 90% 110% 130%
Employment Growth 2013-2018
*Bubble size is relational to the number of employees within greater hospitality
22Santa Cruz County Tourism and Hospitality Report
Santa Cruz Workforce Development Board
Education and Training in Santa Cruz County
Regional Education and Training Opportunities
Talent attraction and retention are among the most substantial challenges Tourism and Hospitality
employers in the County face. Our survey of employers revealed that their satisfaction with their
ability to retain valued employees, ability to recruit workers that have strong customer service skills,
and satisfaction with local education and training institutions was relatively low (Figure 26).
Regarding entry-level applicants, two-thirds of employers reported there were too few applicants
and nearly four-in-ten stated applicants did not have appropriate skills (Figure 27). Among non-entry
level roles, 37% of employers cited a lack of relevant industry skills and 31% cited a lack of
management skills as reasons for hiring difficulty. Another 31% selected a free-response answer, of
which a majority cited high or unaffordable salary expectations (Figure 28).
These findings illustrate that quality and quantity of talent among Tourism and Hospitality employers
countywide is a widespread struggle. Education and career pathways are one way which quantity
and quality of talent can be improved. Tourism and Hospitality education in the County reaches a
wide range of ages; students interested in the field can take industry-specific courses starting in
junior high and continue all the way through a college-level education. Many programs feature
partnerships with local businesses and offer hands-on experience in the kitchen, dining room, or
front desk. Increased partnerships with these institutions and programs will help generate increases
in quality and quantity of applicants, however, in a region where competition for talent is strong, the
more potential talent pipelines, the better. This following section highlights some regional education
and training centers in and around Santa Cruz County.
Cabrillo College
Cabrillo Colleges offers a specialization in Culinary Arts and Hospitality (CAHM), which seeks to
prepare students for a range of potential careers within culinary arts and hospitality. This
specialization is offered through four different programs: cooking, wine, baking, and food services
management. Along with offering an associate degree in culinary arts and hospitality management,
Cabrillo College offers eight different certificates in skills ranging from baking to catering to wine
tasting room management. In total, the program takes 18 months to complete and about 83% of
program graduates received jobs upon completion.22
22
Cabrillo College
23Santa Cruz County Tourism and Hospitality Report
Santa Cruz Workforce Development Board
The Santa Cruz County Office of Education (COE) Career Technical Education Partnership
(CTEP)
The Santa Cruz COE offers two levels of culinary arts courses. The first is an entry-level course that
prepares students for entry level roles by covering topics such as menu planning, safety and
sanitation, use of commercial equipment, and understanding and managing establishments with
different food-styles. The second course offered builds upon the first, though introduces more
advanced and
complex concepts.
The Santa Cruz
Tourism and Hospitality Career Development Education
Office of Education
has also created a Early exposure to the culinary and hospitality industries can help spark
career technical lasting interest and passion in the field. The Santa Cruz County Office of
education Education currently offers a number of programs aimed at junior high and
partnership with high school level students. One such program, which attracts high
Seaside Company to schoolers from across Santa Cruz County, is taught at “The Food Lounge”, a
private business owned by Chef Andrea Mollenauer. The SC County Office
offer a course in
of Education has even developed a culinary program for incarcerated men
hospitality. The
and women in Santa Cruz County. All told, these programs attract about
course will cover 200 students from across the County.
everything from
food service to In late Summer of 2019, a new SC County Office of Education program will
human resources to start. The program—a collaboration with the Seaside Company and the
Santa Cruz Beach Boardwalk—will introduce 20-25 students to food
finance and business
service, marketing, human resources, maintenance, safety, security, and
relevant to
other related topics. This program also provides students with a paid role
hospitality careers. one Saturday every month as well as a bracelet for the Boardwalk.
Along with offering
relevant experience,
the course offers Ultimately, these courses offer more than introductory lessons on cooking
paid employment and safety. As Mark Hodges, Senior Director of the Career Technical
one Saturday per Education Partnership, said “The exposure that students get is invaluable.
month and free They often work several professional events for organizations within the
Boardwalk community and gain real-world experience. They learn how to dress for
wristbands for success, sit in on business negotiations, earn a few dollars while they learn,
participants and and make connections with industry leaders.” While some education
consists of rote learning and textbooks, these programs offer exciting, real-
their families.
world opportunities for growth and learning.
24You can also read