Capital Regional District Housing Needs Assessment - District of North Saanich - November 2020
←
→
Page content transcription
If your browser does not render page correctly, please read the page content below
Capital Regional District
  Housing Needs Assessment

  District of North Saanich

November 2020
i
North Saanich Housing Profile
This profile summarizes the findings of the District of North Saanich Housing Needs Report which was completed as
part of a joint Housing Needs Report project for 11 CRD communities. It fulfills the Housing Needs Reports
requirements outlined in the Local Government Act, Part 14, Division 22. All data is this profile is from Statistics
Canada unless otherwise indicated.
Households
Overview
There were 4,630 households in North Saanich in 2016
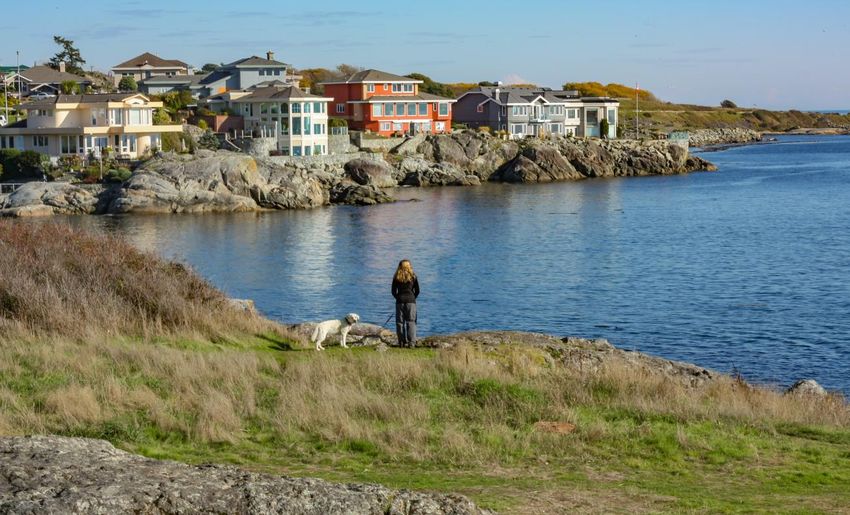
The District of North Saanich is located at the
with an average household size of 2.4 persons, which is
northernmost tip of the Saanich Peninsula, within
slightly larger than the regional average of 2.2 persons
the traditional territory of the Pauquachin,
per household. North Saanich has a much higher
Tseycum, Tsartlip, Tsawout, and Malahat Nations
proportion of two-person households and a much
and Cowichan Tribes. North Saanich is 37.3 square
smaller proportion of one-person households compared
kilometres with a 2016 population of 11,249
to the region. Two-person households were 51% of all
residents. Home to Swartz Bay Terminal and the
households in the District in 2016. Households without
Victoria International Airport, North Saanich
children are much more common in North Saanich,
offers easy access to the mainland and represents
while individuals living alone are less common.
an important employment centre for the region.
The surrounding coastlines and green, spacious Income
landscape create a distinctly rural feel. North The 2015 median income in North Saanich was
Saanich is a popular regional destination for $102,364, which was approximately 47% higher
hiking, cycling, and horseback riding in its network than the CRD median income. There are large
of parks and trails. differences in household incomes in North Saanich
for households who rent and households with
single incomes. Renter households reported
Population and Age
incomes that were less than half that of owner
The population of North Saanich grew by 426
incomes ($55,208 versus $111,375). Lone parent
residents, or 3.9%, between 2006 and 2016, a
and non-census family households reported much
slower rate of growth compared to the CRD as a
lower incomes compared to other household
whole which grew by 11.1%. In 2016, the median
types, although they remained higher compared to
age was 56.2, much higher than the CRD at 45.5. In
the regional averages.
North Saanich, there has been a rapid increase in
the proportion of older households over the past
Current Housing Stock
three census counts, with larger proportions of
North Saanich’s housing stock is made up of
adults aged 55 and older compared to the CRD
primarily single detached houses. While recent
average in 2016.
building permits suggest a trend towards more
Population projections suggest North Saanich could multi-family forms, the single-family home remains
experience more rapid population growth in the future, the dominant dwelling type in North Saanich, with
primarily driven by growth in residents aged 75 to 84. most having three or more bedrooms (78%).
i
i

Homeownership                                                         AVERAGE 2019 SALES PRICES
(Statistics Canada, BC Assessment, and Victoria
Real Estate Board)
87% of households in North Saanich own their home. Over the
past 15 years, ownership prices have risen for all housing types,
with the most rapid increases occurring since 2015 (see right):

Based on these prices, the average single-detached
home is unaffordable for median incomes of all
household types, despite this being the most common
type of home in the District. A household would require
a very high annual income to be able to affordably
purchase a home.                                                    Anticipated Housing Demand
                                                                    If North Saanich continues growing in a similar
Rental Affordability                                                manner as the past, the community will see an
(Statistics Canada and Canada Mortgage Housing Corporation)         additional 516 households form between 2016 and
13% of households in North Saanich rent their                       2025, and another 361 between 2025 and
home. Data on the primary rental market in North                    2038.Projections suggest that 843 of new
Saanich is extremely limited; the latest data is from               households formed between 2016 and 2038, or
2004 when there were eight units. Most renters                      96%, will be owners, while 33, or 4%, will be
are likely relying on the secondary rental market                   renters.
which is less secure than the primary rental
market. Rent in the secondary rental market is                      It is important to note that this is based on 2016
largely driven by housing prices which have risen                   proportions of owners and renters. In reality, the
substantially.                                                      number of renter households has been increasing
                                                                    more quickly than the number of owner
At the same time, the number of rental households                   households, so there is likely to be more growth in
is growing more quickly compared to owner                           renter households than the projections suggest.
households: between 2006 and 2016, the number
                                                                    PROJECTED HOUSING UNITS NEEDED
of renter households increased by 31% between
2006 and 2016, compared to just 6% for owner                                         2016-2020     2020-2025     2025-2038
households.                                                                  Total      273            243           361
                                                                      Rental units       11             3            19
The low number of smaller housing units such as                        Ownership
apartments, studios, one- and two-bedrooms                                              262            240           843
                                                                           units
suggest it may be challenging for households                           Studio or 1
relying on a single income, like individuals living                                     129            119           181
                                                                         Bedroom
alone and lone parents, to find suitable and                           2 Bedroom        120            106           139
affordable rental housing. Lone parent, single                        3+ Bedroom         24            18            41
person, and senior households have some of the
highest rates of Core Housing Need in the District
(i.e., are living in housing that is inadequate,
unsuitable, and/or currently unaffordable, and
unable to afford the median rent of alternative
local housing).

                                                                                                                             i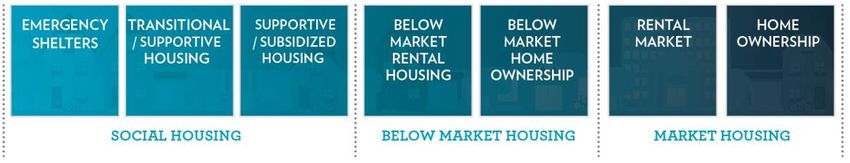
Capital Regional District Housing Needs Report | District of North Saanich                                                         ii

    Key Areas of Local Need

    Affordable Housing                                                       Rental vacancy rates are low across the region
    The cost of owning a home in North Saanich, like                         without enough supply coming onto the market
    the CRD in general, has risen significantly in recent                    fast enough to meet demands. Between 2016 and
    years. Average prices in North Saanich are some of                       2038, projections based on 2016 proportions of
    the highest in the region. Affordability gap                             owners and renters suggest that 33 new renter
    analyses showed that ownership of a single-                              households will form in North Saanich. In reality,
    detached home is out of reach for most                                   the number of renter households has been
    households making the median income, even                                increasing more quickly than the number of owner
    couples with children who tend to make higher                            households, so there is likely to be more growth in
    incomes than other household types. While data                           renter households than the projections indicate.
    on the rental market is limited, data for the                            High demand and low vacancy contribute to
    Victoria Census Metropolitan Area secondary                              increasing rental costs and can push renter
    rental market and stakeholder engagement                                 households out of the community.
    suggests that rents have risen alongside housing
    prices, as owners seek to offset mortgage costs by                       Housing for People with Disabilities
                                                                             Incidence of Core Housing Need is higher among
    renting units on the secondary market.
                                                                             households with someone with a disability. This
    Projections estimate that the number of households in                    may be due to reduced incomes, difficulty
    Core Housing need may grow to 195 owner households                       accessing appropriate housing, or other factors.
    and 110 renter households by 2038. These households                      For individuals with disabilities who are unable to
    may be looking for options that are more affordable                      work, the provincial housing supplement of $375
    than single-detached homes and non-market supports
                                                                             (for an individual) is extremely low and limits
    Rental Housing                                                           access to housing options. As of 2020, there were 7
    There is a need for more rental housing options                          households with disabilities on BC Housing’s
    across the CRD. While there is limited data on the                       waitlist seeking non-market housing in North
    rental market in North Saanich, the number of                            Saanich.
    renter households is growing more quickly
    compared to the number of owner households.
    Stakeholders reported that there is an overall lack
    of rental units on the Peninsula, especially smaller
    units suited for smaller household types like
    workers or seniors.
Capital Regional District Housing Needs Report | District of North Saanich ii
Housing for Seniors household income. While owning a townhouse
North Saanich is experiencing a significant aging may be affordable options for couples with
trend with the median age growing from 50.8 in children, there is limited supply and the market is
2006 to 56.2 in 2016. The median age is noticeably competitive for suitable units. Homeownership of
higher than the median for the CRD as a whole, all housing types is far out of reach for lone parent
which was 45.5. Aging in place is a priority for families making the median income. For families in
many households and this can look different the rental market, stakeholders reported a lack of
depending on the individual and their needs. Some affordable, family-sized rental units and a need for
need supportive housing or housing suited to their options like apartments and townhouses, which
downsizing and accessibility needs. Stakeholders could be more affordable for young families buying
identified this as a key area of need throughout the their first home and families moving to the
Saanich Peninsula and reported there are long Peninsula for employment.
existing waitlists.
Between 2016 and 2038, projections suggest the
Between 2016 and 2025, projections suggest there number of new couple-with-children households
could be 256 households newly led by seniors, as will fluctuate, while 37 new lone parent family
residents age into the 65+ age groups. The number households could form. It will be important to plan
of households aged 75+ is also projected to for the needs of these households, as the
increase, by approximately 405. Between 2025 and availability and affordability of housing in a
2038, growth is also projected to be concentrated community can impact the ability and desire of
within households aged 75+. Most of these households to stay. This can contribute to an aging
households are likely to be individuals living alone population trend as younger households without
or couples without children. It will be important to equity struggle to gain a foothold in the
plan for the needs of these households, as a lack of community. As of 2020, there were 7 families on
appropriate housing can push people to live in BC Housing’s waitlist seeking non-market housing
housing without the accessibility or health in North Saanich.
supports they need.
Homelessness
As of 2020, there were 10 seniors were on BC There has been an increase in individuals
Housing’s waitlist seeking non-market seniors experiencing homelessness across CRD
housing in North Saanich. communities in recent years. The March 11, 2020
point-in-Time count identified a minimum of 1,523
Housing for Families individuals experiencing homelessness in the
Family-sized housing in North Saanich is
region. There were at least 350 individuals who
increasingly out of reach for families with children.
were emergency sheltered and 743 who were
The single detached home is out of reach for
provisionally accommodated in transitional
couples with children making the median
housing.Capital Regional District Housing Needs Report | District of North Saanich ii
TABLE OF CONTENTS
1.0 Introduction ................................................................................................................................................................... 1
1.1 Overview .................................................................................................................................................................... 1
1.2 Housing Need Report Requirements ......................................................................................................................... 4
1.3 Data Limitations ......................................................................................................................................................... 5
2.0 Community Profile ........................................................................................................................................................ 6
2.1 Population .................................................................................................................................................................. 6
2.2 Age ............................................................................................................................................................................. 7
2.3 Mobility ...................................................................................................................................................................... 8
2.4 Households ................................................................................................................................................................ 8
2.5 Economy .................................................................................................................................................................. 10
2.6 Household Median Income ...................................................................................................................................... 11
2.7 Summary .................................................................................................................................................................. 15
3.0 Housing Profile ............................................................................................................................................................. 16
3.1 Overview of Housing Stock ...................................................................................................................................... 16
3.1.1 Housing Units ................................................................................................................................................... 16
3.1.2 Condition of Housing ....................................................................................................................................... 17
3.1.3 Recent Changes in Housing Stock .................................................................................................................... 19
3.1.4 Tenure .............................................................................................................................................................. 20
3.1.5 Households and Structure Type ....................................................................................................................... 21
3.2 Trends in Homeownership Market .......................................................................................................................... 25
3.2.1 Homeownership Affordability Gap Analysis .................................................................................................... 25
3.3 Trends in Rental Market .......................................................................................................................................... 27
3.3.1 Primary Rental ................................................................................................................................................. 27
3.3.2 Rental Housing Affordability Gap Analysis ....................................................................................................... 28
3.3.3 Secondary Rental Market Trends..................................................................................................................... 28
3.3.4 Short-Term Rental Market ............................................................................................................................... 30
3.4 Non-Market Housing ............................................................................................................................................... 31
3.4.1 BC Housing Waitlist for Non-Market Housing.................................................................................................. 32
3.5 Homelessness .......................................................................................................................................................... 32
3.6 Student Housing....................................................................................................................................................... 33
3.7 Housing Indicators ................................................................................................................................................... 33
3.8 Core Housing Need .................................................................................................................................................. 34
3.8.1 Extreme Core Housing Need ............................................................................................................................ 35
3.8.2 Household Characteristics by Core Housing Need ........................................................................................... 36
3.9 Summary .................................................................................................................................................................. 38
4.0 Projections .................................................................................................................................................................. 41
4.1 Methodology ........................................................................................................................................................... 41
4.2 Limitations ............................................................................................................................................................... 42
4.3 Population Growth................................................................................................................................................... 42Capital Regional District Housing Needs Report | District of North Saanich iii
4.4 Age Projections ........................................................................................................................................................ 43
4.5 Household Projections ............................................................................................................................................. 44
4.5.1 Projected Households by Tenure ..................................................................................................................... 44
4.5.2 Projected Households by Household Family Type ........................................................................................... 45
4.5.3 Projected Households by Age of Primary Household Maintainer ................................................................... 45
4.5.4 Projected Households in Core Housing Need .................................................................................................. 46
4.5.5 Projected Households by Bedroom Type Needs.............................................................................................. 48
4.6 Summary .................................................................................................................................................................. 49
5.0 Community Engagement Findings .............................................................................................................................. 51
5.1 Regional Findings ..................................................................................................................................................... 51
5.1.1 Housing Challenges .......................................................................................................................................... 51
5.1.2 Barriers and Challenges in Developing and Operating Housing ...................................................................... 53
5.1.3 Opportunity Areas ........................................................................................................................................... 53
5.2 Findings for the Saanich Peninsula .......................................................................................................................... 54
6.0 COVID-19 Implications ................................................................................................................................................ 56
6.1 Preliminary Economic Impacts ................................................................................................................................. 56
6.2 Stakeholder Perspectives ......................................................................................................................................... 57
7.0 Summary of Key Areas of Local Need .......................................................................................................................... 58
7.1 Number of Units Needed by Unit Size ..................................................................................................................... 58
7.2 Statements of Key Areas of Local Need ................................................................................................................... 58
7.2.1 Affordable Housing .......................................................................................................................................... 58
7.2.2 Rental Housing ................................................................................................................................................. 59
7.2.3 Housing for People with Disabilities ................................................................................................................ 60
7.2.4 Housing for Seniors .......................................................................................................................................... 60
7.2.5 Housing for Families......................................................................................................................................... 60
7.2.6 Homelessness .................................................................................................................................................. 61
Appendices
Appendix A Glossary
Appendix B Summary Form
This report is prepared for the sole use of Capital Regional District. No representations of any kind are made by Urban Matters Ltd. or its
employees to any party with whom Urban Matters CCC Ltd. does not have a contract. © 2020 URBAN MATTERS CCC.Capital Regional District Housing Needs Report | District of North Saanich iv
Table of Figures
Figure 1 Housing Continuum ..................................................................................................................................................... 1
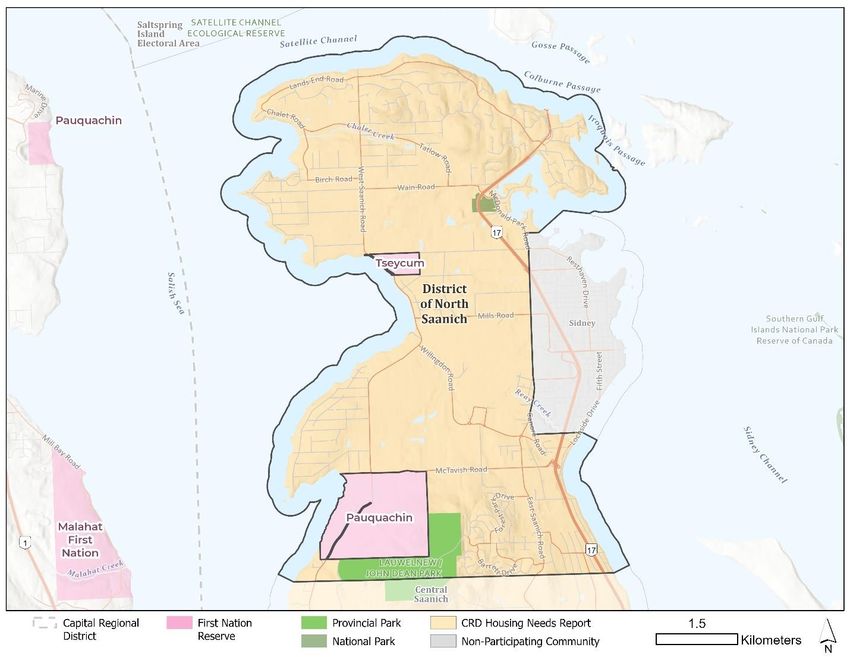
Figure 2 Map of North Saanich .................................................................................................................................................. 2
Figure 3 Absolute Population Change in North Saanich and CRD, 2006 to 2016 ...................................................................... 6
Figure 4 Relative Population Change in North Saanich and CRD, 2006 to 2016 ........................................................................ 6
Figure 5 Age Distribution in North Saanich, 2006 to 2016 ........................................................................................................ 7
Figure 6 One-Year Ago Mobility Status in North Saanich, CRD, and BC .................................................................................... 8
Figure 7 Households by Size in North Saanich, 2016 ................................................................................................................. 9
Figure 8 Households by Household Type in North Saanich, 2016 ............................................................................................. 9
Figure 9 Age of Primary Household Maintainer by Tenure, 2016 ........................................................................................... 10
Figure 10 Labour Participation Rate and Unemployment Rate in North Saanich and the CRD, 2006 to 2016 ....................... 11
Figure 11 Median Before-Tax Household Income in North Saanich and the CRD, 2006 to 2016 ............................................ 12
Figure 12 Median Total Household Income in North Saanich and CRD by Household Type, 2016 ......................................... 13
Figure 13 Median Before-Tax Private Household Income by Tenure in North Saanich and CRD, 2006 to 2016 ..................... 14
Figure 14 Income Distribution by Tenure in North Saanich and CRD, 2016 ............................................................................ 14
Figure 15 Dwellings by Structure Type in North Saanich and CRD, 2016 ................................................................................ 17
Figure 16 Dwelling Condition by Tenure, 2016 ........................................................................................................................ 17
Figure 17 Dwellings by Period of Construction in North Saanich and CRD, 2016 .................................................................... 18
Figure 18 Dwellings by Period of Construction and Structural Type in North Saanich, 2016 .................................................. 18
Figure 19 Building Permits Issued Annually by Dwelling Type in North Saanich, 2015 to 2019 .............................................. 19
Figure 20 Households by Tenure in North Saanich, 2006 to 2016 .......................................................................................... 20
Figure 21 Structure Type by Tenure in North Saanich, 2016 ................................................................................................... 21
Figure 22 Tenure by Structure Type in North Saanich, 2016 ................................................................................................... 21
Figure 23 Dwellings by Unit Size and Tenure in North Saanich, 2016 ..................................................................................... 22
Figure 24 Households by Structure Type and Family Type in North Saanich, 2016 ................................................................ 23
Figure 25 Households by Structure Type and Household Size in North Saanich, 2016 ........................................................... 24
Figure 26 Average Home Sale Prices for Single-Family Dwellings in North Saanich, 2005 to 2019 ......................................... 25
Figure 27 Average Rents for Secondary Market Units in Victoria CMA, Excluding Condominiums, 2008 to 2016 ................. 28
Figure 28 Average Rents for Rented Condominiums in Victoria CMA, 2008 to 2019.............................................................. 29
Figure 29 Number of Short-Term Rentals Per Yearly Quarter, 2017-2020 .............................................................................. 30
Figure 30 Short-term Rentals by Number of Bedrooms, May 19, 2020 .................................................................................. 31
Figure 31 Private Households Below Housing Standards by Tenure in North Saanich, 2016 .................................................. 34
Figure 32 Private Households in Core Housing Need, Comparison of Geographies, 2016 ...................................................... 35
Figure 33 Private Households in Core Housing Need in North Saanich, CRD, and BC, 2006-2016 .......................................... 35
Figure 34 Private Households in Core Housing Need in North Saanich and CRD, 2016 .......................................................... 36
Figure 35 Private Households in Core Housing Need by Tenure in North Saanich, 2016 ........................................................ 36
Figure 36 Estimated and Projected Population, 2001 to 2025 ................................................................................................ 43Capital Regional District Housing Needs Report | District of North Saanich v
Table of Tables
Table 1 Affordability Gap Analysis for Owners in North Saanich............................................................................................. 27
Table 2 BC Housing Subsidized Units, 2019* ........................................................................................................................... 32
Table 3 Households on BC Housing Waitlist for Non-Market Housing in North Saanich, March 2020 ................................... 32
Table 4 Public Post-Secondary Institutions in Capital Region District, Number of Beds and Full Time Equivalent
Students, 2018/2019 ............................................................................................................................................................... 33
Table 5 Household Characteristics by Tenure and Core Housing Need, 2016 ......................................................................... 38
Table 6 Projected Population and Population Growth, 2016-2038 ......................................................................................... 43
Table 7 Projected Population Change by Age, 2016-2038....................................................................................................... 44
Table 8 Median and Average Age, 2016-2038 ......................................................................................................................... 44
Table 9 Projected Households and Household Growth, 2016-2038........................................................................................ 44
Table 10 Projected Household Change by Tenure, 2016-2038 ............................................................................................... 45
Table 11 Projected Household Change by Household Family Type, 2016-2038 ..................................................................... 45
Table 12 Projected Household Change by Age of Primary Household Maintainer, 2016-2038 .............................................. 46
Table 13 Projected Households in Core Housing Need, High and Low Growth Scenarios, 2016-2038 ................................... 47
Table 14 Projected Households in Core Housing Need by Tenure (High Growth Scenario), 2016-2038 ................................ 47
Table 15 Assumed Distribution of Household Family Types by Bedroom Need ..................................................................... 48
Table 16 Projected Additional Household Needs by Bedroom Type, 2016-2020 .................................................................... 48
Table 17 Projected Additional Household Needs by Bedroom Type, 2020-2025 .................................................................... 48
Table 18 Projected Additional Household Needs by Bedroom Type, 2025 - 2038 .................................................................. 49
Table 19 Projected Housing Units in North Saanich, 2016-2038 ............................................................................................. 581
1.0
1.0 Introduction
Spanning the southern tip of Vancouver Island and the southern Gulf Islands,
as of 2016, the Capital Regional District (CRD) serves more than 383,000 people
spread throughout 13 municipalities and three electoral areas. The CRD includes a variety
of urban and rural communities, big and small. It is a desirable place to live, with many walkable
neighbourhoods and access to nature and numerous amenities. Many communities within the CRD are
experiencing pressure on their housing systems, with high property values and rental rates and low rental
vacancy. While recent months have seen some softening in the housing market for some communities,
there continues to be a pressing need to understand housing needs across the housing continuum, now
and into the future, related to affordability, accessibility, types of units, support structures and services,
and more (Figure 1).
FIGURE 1 HOUSING CONTINUUM
Communities in the CRD are not unique in facing housing challenges. Across BC, a housing affordability
crisis has emerged due to high demand for housing from a growing population, low interest rates, and the
attractiveness of housing as an investment. Increasingly, the cost of renting and owning is creating
unprecedented financial burdens for households.
In 2019, the Government of BC introduced changes to the Local Government Act, Part 14, Division 22
requiring municipalities and regional districts to complete Housing Needs Reports to help better
understand current and future housing needs and incorporate these into local plans and policies. Each
local government must complete their first report by 2022 with updates every five years thereafter. The
Union of British Columbia Municipalities (UBCM) is providing funding for local governments to support the
completion of the first round of reports. The CRD was awarded funding through this program and retained
Urban Matters to complete Housing Needs Reports for 11 constituent communities, including the District
of North Saanich. Separate reports have been prepared for each participating community, which are
based on local context while also providing a regional lens.
1.1 Overview
The District of North Saanich is a rural-residential community located at the northernmost tip of the
Saanich Peninsula. With Swartz Bay Terminal and the Victoria International Airport within its boundaries,
North Saanich offers easy access to the mainland and beyond and represents an important employment
centre for the region. There is close access to services in the adjacent Town of Sidney and with the more
urban City of Victoria approximately 25 kilometers down the highway. At the same time, the District is
1Capital Regional District Housing Needs Report | District of North Saanich 2
surrounded by coastlines on three sides and has a rolling, green, spacious landscape, creating a distinctly
rural feel. It is a popular regional destination for hiking, cycling, and horseback riding in its network of
parks and trails.
In 2016, 92% of houses in the District were single family homes, with or without secondary suites. Like
other communities in the CRD and across the province, North Saanich is experiencing increasing pressures
on its housing market. Single family homes comprise 92% of the District’s housing and are priced out of
reach for typical households. The population of North Saanich had a median age of 56.2 in 2016, much
higher than the regional average of 45.5. As the population grows and ages, affordability and changing
demographics are shifting the types of housing that can support local needs. Although there has been
some more development of multi-family housing forms in recent years to meet these needs, the
overwhelming majority of housing remains single family.
FIGURE 2 MAP OF NORTH SAANICH
The District’s current Official Community Plan (OCP) was adopted in 2007. The OCP contains residential
policies that recognize a need for seniors and affordable family housing, while also focusing on retaining
the character of current neighbourhoods. Certain areas are designated for multi-family affordable housing
development (i.e., affordable housing, seniors’ housing, rental housing, and special needs housing), while
multi-family housing is discouraged in other areas of the District. Other policies reflect a strong
commitment to preserve the agricultural land base and agricultural activities. The OCP also contains
reference to an Affordable Housing Strategy and Policy (Section 6.12), which more specifically addresses
housing concerns such as the need for seniors’ housing, the provision of affordable housing, secondary
suites, and special needs housing within designated areas.Capital Regional District Housing Needs Report | District of North Saanich 3
The District is currently in the process of updating its OCP, and this report contains information intended
to support such updates, including information about the current population and demographics,
population trends, the economy, and housing, including affordability issues. This information is intended
to support the development of high-level planning documents, such as an OCP, and as well as baseline
evidence for specific sections, such as an update to the Affordable Housing Strategy and Policy section.
In 2007, the District also completed a Housing Needs Assessment, which was used to inform their 2008
Housing Strategy. The Needs Assessment observed that while most existing residents were adequately
housed relative to their incomes, the lack of housing diversity made housing difficult to access for many
workers and for existing residents who are aging. In response, the Strategy presents recommendations
with a goal of gradually broadening the range of housing choices in North Saanich while retaining existing
character.
In 2013 the District created a Housing Strategy Implementation Plan, intended to help implement
recommendations from the Housing Strategy for guiding the development of multi-unit housing, medium-
density multi-unit housing, and low-density smaller lot detached homes.
In 2017, the District released a discussion paper on housing affordability to inform deliberations about the
areas designated for multi-family affordable housing in the OCP: Area 1 (McTavish) and Area 2 (Tsehum).
A need for more seniors’ and low-income family housing was identified. As a result of the discussion
paper, North Saanich Council resolved that all new development proposals in Areas 1 and 2 “would be
restricted to those which exclusively provide affordable housing through recognized affordable housing
providers.” Council also directed staff to proceed with a new Affordable Housing Strategy and Policy.
The 2018 Affordable Housing Strategy and Policy identifies an affordable housing gap for low-income
families and seniors in North Saanich and identifies a strategic approach to addressing this gap using policy
and regulatory tools and procedural changes. Policy suggestions focus on facilitating development of
affordable housing in designated areas and encouraging more diverse housing options in other areas
through OCP policies and tools such as tax exemptions, housing agreements, amenity contributions, and
regional collaboration. There are also recommendations related to the zoning bylaw and fast-tracking the
development process for affordable projects.Capital Regional District Housing Needs Report | District of North Saanich 4
1.2 Housing Need Report Requirements
Housing Needs Reports regulations require the collection of approximately 50 different data indicators
about past and current population, households, income and economy, and housing stock, as well as
projected population, households, and housing stock.1 Most of this data is made available by the
Government of BC through their data catalogue. All 50 data indicators, along with supplemental data,
were collected as part of this project. This report includes most but not all indicators, focusing on those
that provide insight into the housing system and excluding those that are not directly relevant. Some data
indicators have not yet been made available and are noted as such (e.g., historical BC Assessment data).
Data is collected from a number of sources, including:
Statistics Canada 2006, 2011, and 2016 Censuses and 2011 National Household Survey, via:
→ Data available online through Census profiles and data tables
→ Custom Housing Needs Report data provided by the Ministry of Municipal Affairs and Housing
(MAH)
Canada Mortgage and Housing Corporation (CMHC)
BC Housing
BC Assessment
Victoria Real Estate Board
BC Stats
AirDNA
District of North Saanich
This document fulfills Housing Needs Report requirements for North Saanich, providing information on
housing needs across the housing continuum, including an estimate of the number and size of housing
units required to address existing demand and future growth over the next five years. This report is
intended to be used by the District, the CRD, and other stakeholders to inform the planning and
development of housing, through local plans, policies, and the management of development. It is also a
public document intended to support decision-making around housing and provide information to
stakeholders to help improve local understanding of housing needs.
This report provides an overview of housing needs based on analysis of this quantitative data from these
sources, as well as qualitative data from engagement. This data is used to identify housing units required
currently and over the next five years, number of households in core housing need, and statements about
key areas of local need, in fulfilment of Housing Needs Reports regulations.2
1
https://www2.gov.bc.ca/assets/gov/housing-and-tenancy/tools-for-government/uploads/
summaryhnrrequirements_apr17_2019.pdf
2
https://www2.gov.bc.ca/gov/content/housing-tenancy/local-governments-and-housing/policy-and-planning-tools-for-
housing/housing-needs-reportsCapital Regional District Housing Needs Report | District of North Saanich 5
1.3 Data Limitations
There are limitations to the data used in this report. Significant limitations that may affect interpretation
of the data presented in this report are described here.
Different Census Datasets
This report refers to both the standard Census Profile from Statistics Canada and a custom data set that
was prepared by Statistics Canada for the purpose of Housing Needs Reports. This data provides some
information not available in the Census Profiles. However, it is based on a 25% sample. It also differs
slightly from the Census Profiles as it only reports on private households and excludes those living in
institutions or any form of collective dwelling. Both the Census Profiles and custom data sets are used and
are referenced.
Age of Data
The most recent national census was completed in 2016 and is now several years old. While it provides
important demographic and housing information, it does not capture more recent trends. Other, more
recent sources of data are used where possible and quantitative data is supplemented with stakeholder
engagement which provides insight into emerging trends. The next national census is scheduled for 2021
and results will begin to become available in 2022.
2011 National Household Survey
The 2011 National Household Survey (NHS) was voluntary and had a much lower response rate than the
mandatory long-form census. Because of this, data from the 2011 NHS is of a lower quality than census
data. In particular, this adversely impacted income data, and any comparisons between Census income
data and NHS income should be viewed with caution; overall income trends between 2006 and 2016 are
therefore a more reliable indicator of future income direction than 5-year trends.
Projections
The projections contained in this report offer possible scenarios and should be used with caution. In
reality, local conditions like population, immigration patterns, decisions on growth and density, and
market forces impact the nature of the projections. Wherever possible, the projections should be
informed by an understanding of the context within North Saanich and the CRD.
Covid-19
The statistical data reported in this document was collected prior to Covid-19 and may not entirely reflect
current housing trends. The data reported should be considered together with Section 6 Covid-19
Implications. The findings in the concluding chapters consider both available data, desk research on Covid-
19 implications on the housing system, and what was heard from stakeholders during engagement about
the on-the-ground implications.6
2.0
2.0 Community Profile
The demographic and economic context of a community shape its housing needs. Age and stage of life,
household type and size, income, and employment all directly affect the type of housing units, sizes, and
tenures needed. This section provides an overview of these factors, using a combination of data from the
Statistics Canada Census Profiles and data tables and custom data prepared for Housing Needs Reports.
2.1 Population
Between 2006 and 2016, North Saanich grew by 3.9%, from 10,823 to 11,249 residents (Figure 3). This was
slower growth than the region as a whole, where the population increased by 11.1%. Growth in North
Saanich occurred at a slowing rate over this period, while it accelerated in the CRD (Figure 4). As of 2016,
FIGURE 3 ABSOLUTE POPULATION CHANGE IN NORTH SAANICH AND CRD, 2006 TO 2016
500,000
383,360
400,000 345,164 359,991
Population
300,000
200,000
100,000
10,823 11,089 11,249
0
2006 2011 2016
North Saanich - Population CRD - Population
Source: Statistics Canada Census Program, Census Profiles 2006, 2011, 2016
FIGURE 4 RELATIVE POPULATION CHANGE IN NORTH SAANICH AND CRD, 2006 TO 2016
10.0%
8.0% 6.5%
Population
6.0%
6.0% 4.3%
3.7%
4.0% 2.5%
1.4%
2.0%
0.0%
2006 2011 2016
CRD - Change from Previous Census North Saanich - Change from Previous Census
Source: Statistics Canada Census Program, Census Profiles 2006, 2011, 2016
6Capital Regional District Housing Needs Report | District of North Saanich 7
2.2 Age
Many Canadian communities are experiencing an aging trend. In North Saanich, this trend is particularly
marked with a rapid increase in the proportion of older households over the past three census counts.
Between 2006 and 2016, the median age in North Saanich increased from 50.8 to 56.2. The median age in
North Saanich is noticeably higher than the CRD, where the median age was 45.5 in 2016.
Between 2006 and 2016, the proportion of adults 65 and over increased from 22% to 32% of the
population. For comparison, 21% of CRD residents were 65 and over in 2016. While the proportion of
adults 25 to 34 in North Saanich increased slightly over this period, most age groups under 65 decreased
as a proportion of the whole population. The largest decrease was in the proportion of adults 45 to 54,
indicating that, over time, those in that age group have gotten older or left and are not being replaced at
the same rate from younger demographics aging in the community or moving into North Saanich.
FIGURE 5 AGE DISTRIBUTION IN NORTH SAANICH, 2006 TO 2016
100% 2% 3% 3% 3%
8% 8% 9% 6%
90%
12% 85 and over
12% 15%
80% 20% 75 to 84
70% 20% 15%
65 to 74
23%
60% 21% 14% 55 to 64
50% 19%
16% 45 to 54
13% 12%
40%
10% 35 to 44
30% 8% 8% 13%
5% 6% 25 to 34
6%
20% 11% 11%
10% 10% 15 to 24
10%
13% 11% 11% 13% 0 to 14
0%
2006 2011 2016 CRD 2016
Source: Statistics Canada Census Program, Custom Data Organization for BC Ministry of Municipal Affairs and HousingCapital Regional District Housing Needs Report | District of North Saanich 8
2.3 Mobility
In 2016, 530 North Saanich residents, or 5% of the population, had moved to the community in the
previous year, compared to 7% in both CRD and BC (Figure 6). Most of these movers were intraprovincial
migrants, meaning they moved to North Saanich from elsewhere in BC. Compared to the CRD overall,
North Saanich received a higher proportion of intraprovincial migrants and a lower proportion of external
migrants coming from outside of Canada directly into the District.
FIGURE 6 ONE-YEAR AGO MOBILITY STATUS IN NORTH SAANICH, CRD, AND BC
80% 365
69%
70%
59%
60% 54%
50%
40%
120 30%
30% 23% 22%
19%
20% 40 16%
8%
10%
0%
Intraprovincial migrants (elsewhere in Interprovincial migrants (another External migrants (outside of Canada)
BC) province)
North Saanich CRD BC
Source: Statistics Canada Census Program, Census Profiles 2016
2.4 Households
Between 2006 and 2016, the number of households in North Saanich grew from 4,275 to 4,630, an
increase of 8.3%. The rate of growth in households is much higher than population growth, indicating that
households may be getting smaller. This is reflected in the average household size. In 2016, the average
household size in North Saanich was 2.4, compared to 2.2 in the CRD. Household size has decreased
slightly over the past three census periods – in 2006, it was 2.5.
Consistent with these trends, the majority of households in North Saanich in 2016 were one- or two-
person households (Figure 7). Compared to the region, there was a much high proportion of two-person
households and much smaller proportion of one-person households.Capital Regional District Housing Needs Report | District of North Saanich 9
FIGURE 7 HOUSEHOLDS BY SIZE IN NORTH SAANICH, 2016
60% 2,340
51%
50%
38%
40%
33%
30%
815
18% 625 575
20% 13% 13% 12% 275
10%
10% 6% 5%
0%
1 person 2 person 3 person 4 person 5 or more person
North Saanich CRD
Source: Statistics Canada Census Program, Census Profiles 2016
Figure 8 shows the proportion of households by household type. Compared to the CRD, North Saanich had
a higher proportion of couples without children (48% of all households) (Figure 8). There is also a much
lower proportion of non-census family households (i.e., individuals living alone or with roommates)
compared to the region (20% compared to 39%). This suggests a higher prevalence of older couple
households in North Saanich, who may have adult children now living on their own.
FIGURE 8 HOUSEHOLDS BY HOUSEHOLD TYPE IN NORTH SAANICH, 2016
60% 2,215
48%
50%
40% 1,390
33%
30% 30% 29%
30% 815
18%
20%
110 100 6%
10%
2% 2% 2%
0%
Without children With children One-person Two-or-more person
One-census-family households Multiple-census- Non-census-family households
family households
North Saanich CRD
Source: Statistics Canada Census Program, Census Profiles 2016
Figure 9 illustrates how tenure changes across age groups by showing the ages of primary household
maintainers for owner and renter households. Primary household maintainer refers to the person leading
a household. The census allows two to be identified per household and the data is based on the first entry.Capital Regional District Housing Needs Report | District of North Saanich 10
Generally, homeownership rates increase with age, peaking between 55 and 64 before declining. As
individuals get older, they are more likely to live with family or in collective housing forms. In North
Saanich, very few households are headed by the youngest age groups. Households headed by someone
aged 54 or under are far more likely to rent than own, and homeownership is concentrated among
household maintainers that are 55 and over.
FIGURE 9 AGE OF PRIMARY HOUSEHOLD MAINTAINER BY TENURE, 2016
30% 1,085 155 1,135
135 27% 27% 28%
25% 24%
20% 85 605
80 585
14% 15% 15% 14%
15% 60
11%
10% 270 240
120
7% 20 6% 25
10 4% 4%
5% 15 2% 3%
0%
0%
15 to 24 25 to 34 35 to 44 45 to 54 55 to 64 65 to 74 75 to 84 85 and over
Owner Renter
Source: Statistics Canada Census Program, Census 2016
2.5 Economy
In 2016, the top five industries for work for North Saanich residents were health care and social assistance
(13%); professional, scientific, and technical services (11%); public administration (11%); retail trade
(10%); and educational services (7%).
Between 2006 and 2016, the participation rate in North Saanich decreased at a slightly faster rate than
the region, likely reflecting an aging demographic and a higher proportion of retired residents. This aligns
with the data for primary maintainer ages, household composition, and median ages, which suggest that
most households in North Saanich are couples who are in or approaching retirement.
Over this period, the unemployment rate also increased, in line with regional trends.Capital Regional District Housing Needs Report | District of North Saanich 11
FIGURE 10 LABOUR PARTICIPATION RATE AND UNEMPLOYMENT RATE IN NORTH SAANICH AND THE CRD, 2006 TO
2016
100%
90%
80%
70% 65.6% 65.0% 63.7%
59.3% 56.3%
60% 55.1%
50%
40%
30%
20%
10% 2.4% 4.2% 3.5% 6.0% 4.6% 5.5%
0%
2006 2011 2016 2006 2011 2016
Participation rate Unemployment rate
North Saanich CRD
Source: Statistics Canada Census Program, Custom Data Organization for BC Ministry of Municipal Affairs and Housing
2.6 Household Median Income
Note that the custom data set provided for the purposes of Housing Needs Reports is adjusted for
2015 Constant Dollars and may differ from the typical census Profiles.
The median before-tax household income in North Saanich was noticeably higher compared to the CRD in
both 2006 and 2016. Although it grew more slowly between 2006 and 2016 compared to the CRD (6.1%
versus 11.2%), it remained 47% higher in North Saanich in 2016 (Figure 11).Capital Regional District Housing Needs Report | District of North Saanich 12
FIGURE 11 MEDIAN BEFORE-TAX HOUSEHOLD INCOME IN NORTH SAANICH AND THE CRD, 2006 TO 2016
$160,000
$140,000
$120,000
$102,364
$96,480
$100,000
$80,000 $69,642
$62,639
$60,000
$40,000
$20,000
$0
2006 2016
North Saanich CRD
Source: Statistics Canada Census Program, Custom Data Organization for BC Ministry of Municipal Affairs and Housing
Median household incomes differ by household type. Median incomes were higher in North Saanich than
the region across all family types (Figure 12). Other-census family households3 and couples with children
reported the highest median household incomes, while single income earners such as non-census-family
households (individuals living alone or with roommates) and lone-parent households had the lowest
median incomes (Figure 12). Households with single income earners often have lower median incomes
than households with two or more incomes.
3
Households which include at least one family and additional persons. For example, “other family” could
refer to a family living with one or more persons who are related to one or more of the members of the
family, or a family living with one or more additional persons who are unrelated to the family members.Capital Regional District Housing Needs Report | District of North Saanich 13
FIGURE 12 MEDIAN TOTAL HOUSEHOLD INCOME IN NORTH SAANICH AND CRD BY HOUSEHOLD TYPE, 2016
$160,000 $157,696
$141,653
$140,000
$124,507
$115,851
$120,000
$105,165
$100,000 $87,368
$80,000 $74,837
$64,805 $60,800
$60,000 $50,776 $51,243
$40,127
$40,000
$20,000
$0
North Saanich CRD
Source: Statistics Canada Census Program, Data Table 98-400-X2016099
The median renter household income in a community is often much lower than the median owner
household income. In North Saanich, the median renter household income was approximately half of the
median owner household income (Figure 13). The median income of renter households in North Saanich
increased considerably (31.3%) between 2006 and 2016. Over the same period, the median income of
renter households in the CRD increased by 13.5%.Capital Regional District Housing Needs Report | District of North Saanich 14
FIGURE 13 MEDIAN BEFORE-TAX PRIVATE HOUSEHOLD INCOME BY TENURE IN NORTH SAANICH AND CRD, 2006 TO
2016
$160,000
$140,000 +7.1%
$120,000 $101,615 $111,375
$103,989 +11.7%
$100,000 $83,365 $88,704
$79,401
$80,000 +31.1%
+13.5%
$55,208
$60,000 $44,363
$42,027 $42,860 $39,099 $41,938
$40,000
$20,000
$0
Owner Renter Owner Renter
North Saanich CRD
2006 2011 2016
Source: Statistics Canada Census Program, Custom Data Organization for BC Ministry of Municipal Affairs and Housing
Compared to the CRD, North Saanich had a higher proportion of owner households falling into the highest
brackets (making $150,000 or more) (Figure 14). In North Saanich, 31% of owner households fell into this
group, compared to 19% for the region. Renters in North Saanich also fell into higher income brackets
compared to the region; there were smaller proportions falling within the lowest income brackets and a
higher proportion making $125,000 to $149,999.
FIGURE 14 INCOME DISTRIBUTION BY TENURE IN NORTH SAANICH AND CRD, 2016
2% 15%
$200,000 and over 1% 8%
2% 16%
$150,000 to $199,999 2% 11%
8% 11%
$125,000 to $149,999 3% 10%
6% 14%
$100,000 to $124,999 6% 13%
9% 12%
$80,000 to $99,999 9% 13%
15% 13%
$60,000 to $79,999 14% 14%
21% 9%
$40,000 to $59,999 20% 14%
22% 7%
$20,000 to $39,999 25% 11%
18% 2%
Under $20,000 20% 5%
North Saanich Renters North Saanich Owners CRD Renters CRD Owners
Source: Statistics Canada Census Program, Custom Data Organization for BC Ministry of Municipal Affairs and HousingYou can also read