Langford Housing Needs Assessment - OCTOBER 2020
←
→
Page content transcription
If your browser does not render page correctly, please read the page content below
Langford Housing
Needs Assessment

     O C TO B E R 2 02 0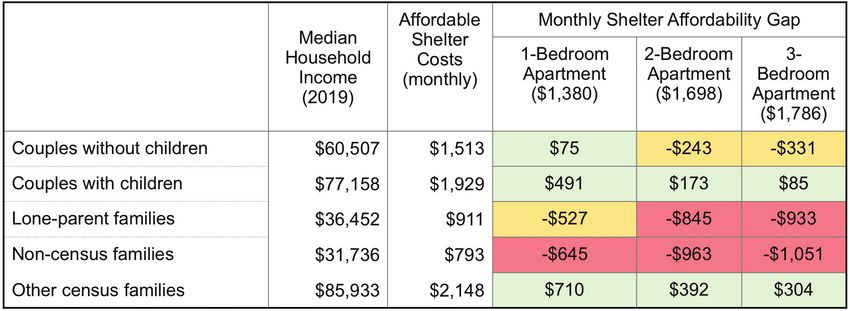
table of contents

1: Introduction                          6   4: Projections                                     48

    Overview                             8       Methodology                                    49

    Housing Needs Report Requirements    9       Limitations                                    50

    Data Limitations                    10       Population Growth                              50

2: Community Profile                    11       Age Projections                                 51

    Population                          12       Household Projections                          52

    Age                                 13       Summary                                        54

    Mobility                            13   5: Community Engagement Findings                   55

    Households                          14       Regional Findings                              56

    Economy                             15       Findings for West Shore Communities            59

    Household Median Income             16       Additional Findings for Langford               60

    Summary                             18   6: COVID-19 Implications                            61

3: Housing Profile                      19       Preliminary Economic Impacts                   62

    Overview of Housing Stock           20       Stakeholder Perspectives                       63

    Trends in Homeownership Market      29   7: Summary of Key Areas of Local Need              64

    Trends in Rental Market             32       Number of Units Needed by Unit Size in Langford 65

    Non-Market Housing                  38       Statements of Key Areas of Local Need
                                                 in the Capital Regional District               65
    Homelessness                        39
                                             8: Glossary                                        67
    Student Housing                     39
                                             Appendix A: Provincial Summary Form                70
    Housing Indicators                  40

    Core Housing Need                   41

    Extreme Core Housing Need           43

    Summary                             46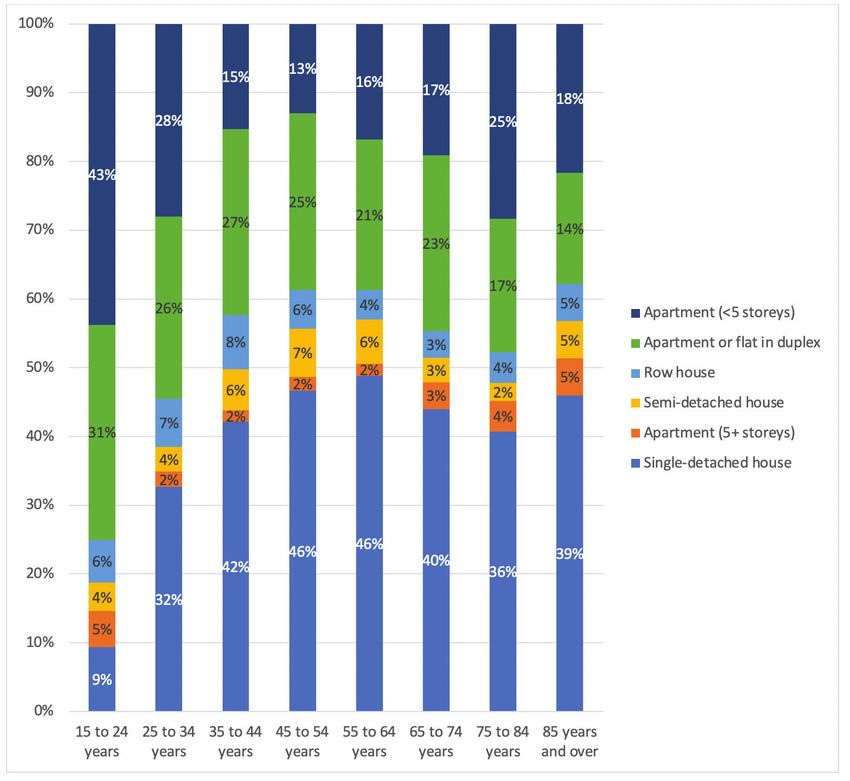
langford housing profile

This profile summarizes the findings of the City of Langford Housing Needs Report
which was completed as part of a joint Housing Needs Report project for 11 CRD
communities. It fulfills the Housing Needs Reports requirements outlined in the Local
Government Act, Part 14, Division 22. All data in this profile is from Statistics Canada
unless otherwise indicated.

Overview
The City of Langford covers an area of 39.94 square
kilometres with a population of 35,394 residents as of
the last census in 2016. While Langford makes up 9% of
the CRD’s population, it was one of the fastest growing
communities in the Capital Regional District between
2006 and 2016. Langford has a vibrant economic
community and a variety of recreational opportunities.

Population and Age
The population of Langford grew by a striking 57.4%
between 2006 and 2016, a much faster rate of growth
compared to the CRD as a whole (11.1%). In 2016,
the median age was 38.3, which was comparatively
younger than the CRD at 45.5. There were slightly
higher proportions of children and seniors in Langford
compared to the CRD average. Projections suggest
                                                            Income
Langford could experience more rapid population             The 2015 median income in Langford was $80,159,
growth in the future, driven by growth across all aged      which was approximately 15% higher than the CRD
groups and primarily in youth (under 14 years) and          median income. There are differences in household
adults age 34 to 44.                                        incomes in Langford for households who rent and
                                                            households with single incomes. Renter households
Households                                                  reported incomes that were less than owner incomes
                                                            ($53,459 versus $93,858). Lone parent and non-census
There were 14,180 households in 2016 with an average
                                                            family households reported much lower incomes
household size of 2.5 persons, which is slightly
                                                            compared to other household types.
larger than the regional average of 2.2 persons
per household. There are more larger households
in Langford compared to the CRD, with 39% of
                                                            Current Housing Stock
households having three or more people. Households          A large portion of the housing stock in Langford is
with children are more common in Langford, while            newer (52% built in 2001 to 2016) and there are more
individuals living alone are less common.                   diverse structural types than the CRD average. Recent
                                                            building permits suggest a trend towards more multi-
                                                            family forms, and single-detached dwellings with or
                                                            without suites remains the predominant structural type
                                                            as of 2016.

Capital Regional District Housing Needs Assessment | 2020
                                                                                                               3
                                                                                                             PAGE 3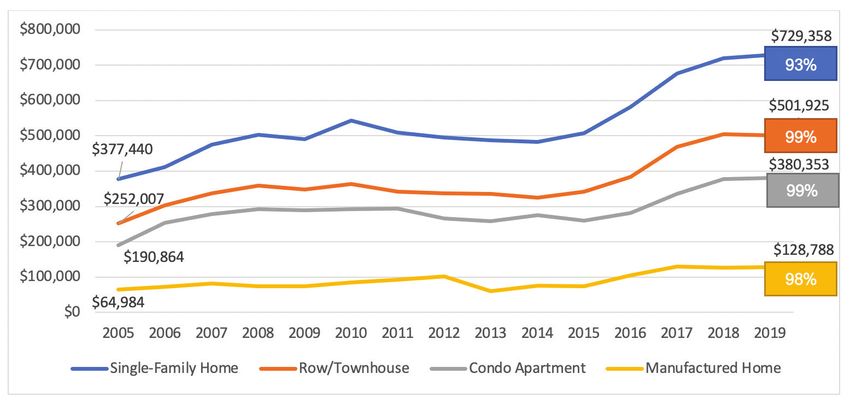
Homeownership                                                 Anticipated Housing Demand
(Statistics Canada, BC Assessment, and Victoria)
                                                              If Langford continues growing in a similar manner as
70% of households in Langford own their home. Over            the past, the community will see an additional 4,467
the past 15 years, ownership prices have risen for all        households form between 2016 and 2025. New
housing types, with prices nearly doubling between            households are projected to be 28% renters and
2005 and 2019. The average 2019 sales prices                  72% owners.
reported by the Victoria Real Estate Board were:

Single Detached Dwelling: $729,358                                                      2016-2020     2020-2025
Townhouse:$501,925
Apartment: $380,353                                                         Total             1,692          2,775

Based on these prices, the average single-detached                     Studio or 1
                                                                                               556            869
home is unaffordable for median incomes of most                         Bedroom
household types, while apartments are affordable for                  2 Bedroom                629           1,021
couples without children, couples with children, and
other census families. A household would require                     3+ Bedroom                507            886
an annual income of approximately $140,500 for the
shelter costs for a single-detached dwelling to be
affordable (e.g. spending less than 30% of before-tax
household income).

Rental Affordability
(Statistics Canada and Canada Mortgage Housing Corporation)

Thirty percent (30%) of households in Langford rent
their home. Langford has seen low vacancy and rising
rental costs over the past 15 years, however, there
has been high development activity of new primary
rental market units starting from 2015. At the same
time, renter households grew faster than owner
households; there were 2,515 new renter households
formed between 2006 and 2016 (an increase of 140%)
compared to 2,985 new owner households (43%). In
2016, there were enough primary rental market units
(1,319 units as reported by CMHC) for just 13% of renter
households, indicating that most renters are relying on
the secondary market.

Both primary and secondary market rents have risen in
recent years. The median rent in the primary market was
$1,455 in 2019, which would require an annual income
of approximately $58,000 for rent to be affordable
(e.g. less than 30% of before-tax household income).

Renter households relying on a single income likely
struggle to find affordable and suitable housing in
Langford. Renter households led by lone parents
and seniors (65+) are the households most likely to
be in Core Housing Need in the City (i.e., living in
housing that is inadequate, unsuitable, and/or currently
unaffordable, and unable to afford the median rent of
alternative local housing).

Capital Regional District Housing Needs Assessment | 2020
                                                                                                                4
                                                                                                              PAGE 4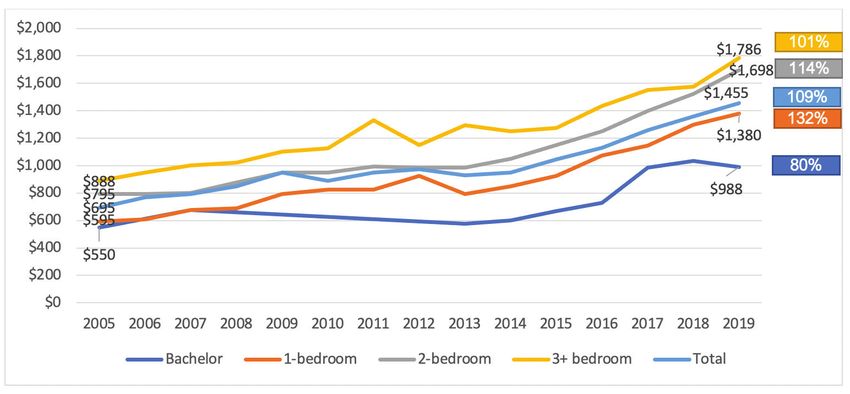
key areas of local need

Affordable Housing                                      Housing for Seniors
The cost of renting and owning in Langford, like        Langford is a relatively young community,
the CRD in general, has risen significantly in recent   compared to the CRD. The median age has held
years. The affordability gap analyses showed that       steady from 38.0 to 38.3 between 2006 and 2016.
ownership of a single-detached home is out of           However, aging in place is generally a priority for
reach for most households making the median             communities and this can look different depending
income, even couples with children who tend             on the individual household and their needs. Some
to make higher incomes than other household             need supportive housing, which was identified as
types. The purpose-built rental market is still         a key area of need by regional stakeholders. As
relatively affordable for households with more          of 2020, 66 seniors were on BC Housing’s waitlist
than one income, but larger-sized units are on the      seeking non-market seniors housing in Langford.
affordability threshold for couples with children
and are unaffordable for individuals living alone       Housing for Families
and most lone parents.                                  Family-sized housing in Langford is more
                                                        affordable compared to core area communities in
Rental Housing                                          the CRD, however, single-detached dwellings are
There is a need for more rental housing options         becoming increasingly out of reach for families
across the CRD. While there has been growth             with children. The affordability gap analysis
in the stock of purpose-built rental housing, the       showed that the cost of a single-detached home is
number of renter households in Langford has also        out of reach for couples with children making the
increased between 2006 and 2016. As of 2019,            median household income, and far out of reach
the rental vacancy rate was 1.5%, far lower than        for lone-parent families. For those in the rental
what is considered to be healthy (between 3% and        market, there may be a limited supply of larger and
5%). High demand and low vacancy contribute             affordable units. As of 2020, there are 102 families
to increasing rental costs and can push renter          on BC Housing’s waitlist seeking non-market
households out of the community.                        housing in Langford.

Housing for People with Disabilities                    Homelessness
Incidence of Core Housing Need is higher among          There has been an increase in individuals
households with someone with a disability.              experiencing homelessness across CRD
This may be due to reduced incomes, difficulty          communities in recent years. The March 11, 2020
accessing appropriate housing or other factors.         point-in-Time count identified a minimum of 1,523
For individuals with disabilities who are unable to     individuals experiencing homelessness in the
work, the provincial housing supplement of $375         region. There were at least 350 individuals who
(for an individual) is extremely low and limits         were emergency sheltered and 743 who were
access to housing options. As of 2020, there            provisionally accommodated in transitional housing.
are 34 households with people with disabilities
on BC Housing’s waitlist seeking non-market
housing in Langford.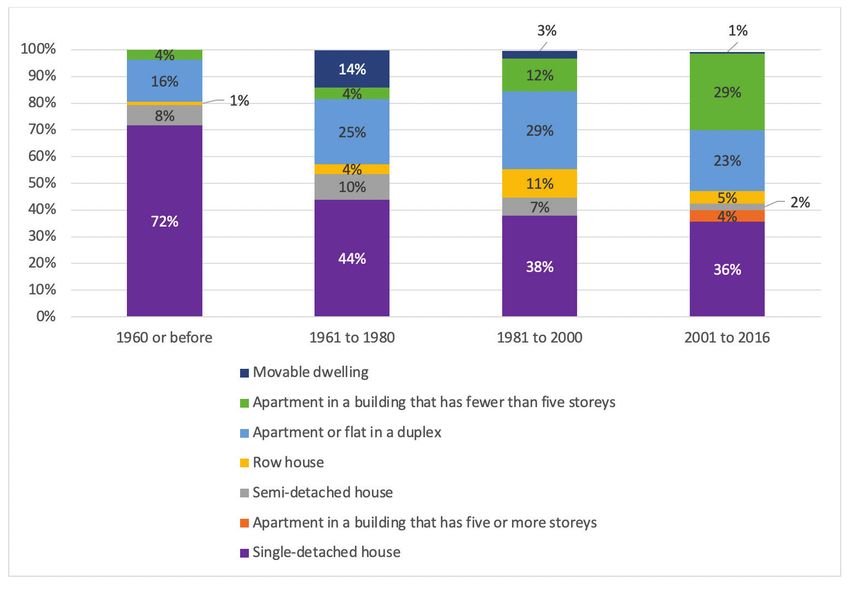
1

introduction
Note that throughout this document, some technical terms are used when referring to
statistical data. There is a glossary at the end of this document with relevant definitions
and links for further information.
Spanning the southern tip of Vancouver Island and the southern Gulf Islands, as of 2016,
the Capital Regional District (CRD) serves more than 383,000 people spread throughout
13 municipalities and three electoral areas. The CRD includes a variety of urban and rural
communities, big and small.

It is a desirable place to live, with many walkable             In 2019, the Government of BC introduced changes
neighbourhoods and access to nature and numerous                to the Local Government Act, Part 14, Division 22
amenities. Many communities within the CRD are                  requiring municipalities and regional districts to
experiencing pressure on their housing systems,                 complete Housing Needs Reports to help better
with high property values and rental rates and low              understand current and future housing needs and
rental vacancy. While recent months have seen some              incorporate these into local plans and policies. Each
softening in the housing market for some communities,           local government must complete their first report by
there continues to be a pressing need to understand             2022, with updates every five years thereafter. The
housing needs across the housing continuum, now                 Union of British Columbia Municipalities (UBCM) is
and into the future, related to affordability, accessibility,   providing funding for local governments to support the
types of units, support structures and services, and            completion of the first round of reports. The CRD was
more (Figure 1).                                                awarded funding through this program and retained
                                                                Urban Matters to complete Housing Needs Reports
Communities in the CRD are not unique in facing                 for 11 constituent communities, including the City of
housing challenges. Across BC, a housing affordability          Langford. Separate reports have been prepared for
crisis has emerged due to high demand for housing               each participating community, which are based on local
from a growing population, low interest rates, and              context while also providing a regional lens.
the attractiveness of housing as an investment.
Increasingly, the cost of renting and owning is creating
unprecedented financial burdens for households.

Figure 1 – Housing Continuum

Capital Regional District Housing Needs Assessment | 2020
                                                                                                                   7
                                                                                                                PAGE 7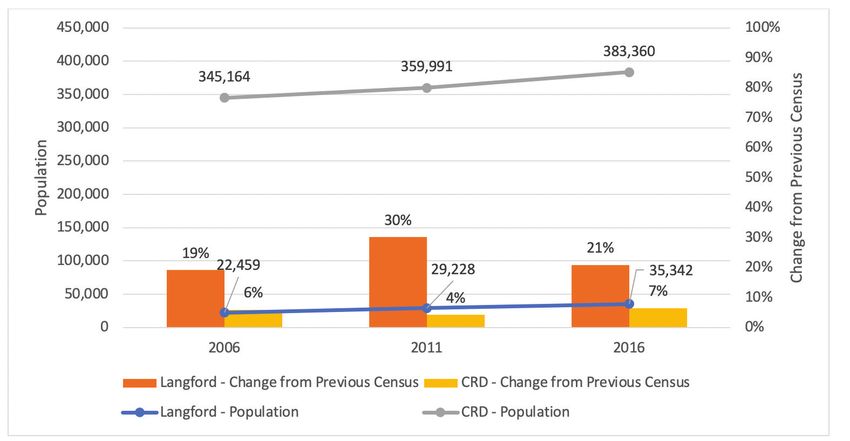
1.1 Overview
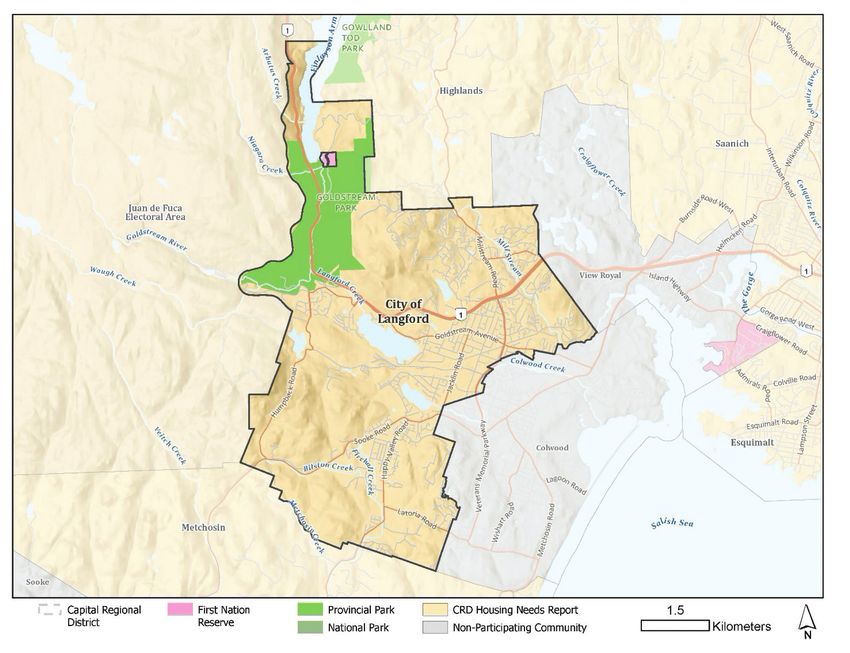
Located within the Greater Victoria Area, the City of Langford covers an area of 39.94
square kilometres with a population of 35,342 residents as of the last census in 2016.
While Langford makes up 9% of the CRD’s population, it was one of the fastest growing
communities in the Capital Regional District between 2006 and 2016. Langford has a
vibrant economic community and a variety of recreational opportunities.
As of 2016, approximately 40% of dwellings in The City of Langford’s Official Community Plan
the community were single family homes with or (2008) (OCP) includes policies around preserving and
without secondary suites. Due to its rapid population increasing the stock of affordable housing, facilitating
growth and regional housing pressures, Langford is a range of housing types along the housing continuum,
experiencing high development activities in both the and setting targets for family and ground-oriented
homeownership and rental market, as well as increasing housing in high-density development projects. The
housing costs. The City is one of the only communities OCP also sets out provisions of housing for specific
across the CRD projected to see population growth groups, including special needs housing and aging
across all age groups. This demand combined with in place strategies for seniors. The City administers
rising housing prices is driving residential development an Affordable Housing Reserve Fund and density
to shift in recent years towards building primary rental bonusing strategies for delivering affordable housing.
units and more multi-family units.
Figure 2 – City of Langford Community Map
Capital Regional District Housing Needs Assessment | 2020
8
PAGE 8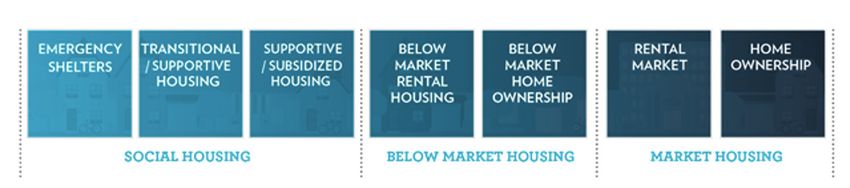
1.2 Housing Needs Report Requirements
Housing Needs Reports regulations require the collection of approximately 50 different
data indicators about past and current population, households, income and economy,
and housing stock1, as well as projected population, households, and housing stock.
Most of this data is made available by the Government of BC through their data
catalogue. Data is collected from a number of sources, including:
• Statistics Canada 2006, 2011, and 2016 Censuses This document fulfills Housing Needs Report
and 2011 National Household Survey, via: requirements for the City of Langford, providing
information on housing needs across the housing
Data available online through Census profiles continuum, including an estimate of the number and
and data tables size of housing units required to address existing
Custom Housing Needs Report data provided demand and future growth over the next five years.
by the Ministry of Municipal Affairs and This report is intended to be used by the City, the CRD,
Housing (MAH) and other stakeholders to inform the planning and
development of housing, through local plans, policies,
• Canada Mortgage and Housing Corporation
and the management of development. It is also a public
(CMHC)
document intended to support decision-making around
• BC Housing housing and provide information to stakeholders to
help improve local understanding of housing needs.
• BC Assessment
This report provides an overview of housing needs
• Victoria Real Estate Board
based on analysis of this quantitative data from these
• BC Stats sources, as well as qualitative data from engagement.
This data is used to identify housing units required
• AirDNA currently and over the next five years, number of
households in core housing need, and statements
• City of Langford
about key areas of local need, in fulfilment of Housing
Needs Reports regulations. 2
1
https://www2.gov.bc.ca/assets/gov/housing-and-tenancy/tools-for-government/uploads/ summaryhnrrequirements_apr17_2019.pdf
2
https://www2.gov.bc.ca/gov/content/housing-tenancy/local-governments-and-housing/policy-and-planning-tools-for-housing/
9
housing-needs-reports
Capital Regional District Housing Needs Assessment | 2020 PAGE 9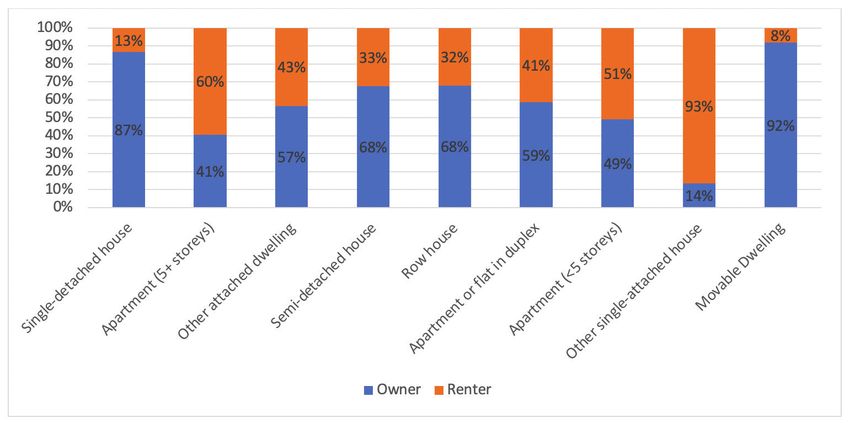
1.3 Data Limitations
There are limitations to the data used in this report. Significant limitations that may affect
interpretation of the data presented in this report are described here.

Different Census Datasets                                   Projections
This report refers to both the standard Census Profile      The projections contained in this report offer possible
from Statistics Canada and a custom data set that           scenarios and should be used with caution. In reality,
was prepared by Statistics Canada for the purpose           local conditions like population, immigration patterns,
of Housing Needs Reports. This data provides some           decisions on growth and density, and market forces
information not available in the Census Profiles.           impact the nature of the projections. Wherever possible,
However, it is based on a 25% sample. It also differs       the projections should be informed by an understanding
slightly from the Census Profiles as it only reports        of the context within Langford and the CRD.
on private households and excludes those living in
institutions or any form of collective dwelling. Both the   COVID-19
Census Profiles and custom data sets are used and
                                                            The statistical data reported in this document was
are referenced.
                                                            collected prior to COVID-19 and may not entirely reflect
                                                            current housing trends. The data reported should
Age of Data                                                 be considered together with Section 6 COVID-19
The most recent national census was completed in            Implications. The findings in the concluding chapters
2016 and is now several years old. While it provides        consider both available data, desk research on
important demographic and housing information, it           COVID-19 implications on the housing system, and
does not capture more recent trends. Other, more            what was heard from stakeholders during engagement
recent sources of data are used where possible and          about the on-the-ground implications.
quantitative data is supplemented with stakeholder
engagement which provides insight into emerging
trends. The next national census is scheduled for 2021
and results will begin to become available in 2022.

2011 National Household Survey
The 2011 National Household Survey (NHS) was
voluntary and had a much lower response rate than
the mandatory long-form census. Because of this, data
from the 2011 NHS is of a lower quality than census
data. In particular, this adversely impacted income
data, and any comparisons between Census income
data and NHS income should be viewed with caution;
overall income trends between 2006 and 2016 are
therefore a more reliable indicator of future income
direction than 5-year trends.

Capital Regional District Housing Needs Assessment | 2020
                                                                                                           10PAGE 10
2 community profile
The demographic and economic context of a community shape its housing needs. Age
and stage of life, household type and size, income, and employment all directly affect
the type of housing units, sizes, and tenures needed. This section provides an overview
of these factors, using a combination of data from the Statistics Canada Census Profiles
and data tables and custom data prepared for Housing Needs Reports.

2.1 Population
Between 2006 and 2016, Langford grew by a striking             steady across all three Census years, with the fastest
57.4%, from 22,459 to 35,342 residents. This was               growth occurring between the 2006 to 2011 period
much faster growth than the CRD, which grew by 11.1%           (30%). As of 2016, Langford residents made up 9% of
during the same period. Langford’s pace of growth was          the CRD’s population.

Figure 3 – Population Change in Langford and CRD, 2006 to 2016

Source: Statistics Canada Census Program, Census Profiles 2006, 2011, 2016

Capital Regional District Housing Needs Assessment | 2020
                                                                                                              12PAGE 12
2.2 Age
From 2006 to 2016, the median age in Langford rose The age distribution in Langford was fairly stable
from 38.0 to 38.3, which is relatively young and stable between 2006 and 2016, with a slight decline in the
compared to provincial trends. The median age in the proportion of residents aged 25 to 54 and a slight
CRD in 2016 was older, at 45.5. increase in the proportion of residents age 55 to 74
(Figure 4). Langford has a similar age distribution as
the CRD as a whole, except for a smaller proportion of
seniors (age 65 and over).
Figure 4 – Age Distribution in Langford, 2006-2016
Source: Statistics Canada Census Program, Census Profiles 2006, 2011, 2016
2.3 Mobility
In 2016, 6% of Langford residents had moved to the migrants (people who moved from another province),
community in the previous year, compared to 7% in and 14% were external migrants (people who moved
both CRD and BC (Figure 5). Of those who moved into from outside of Canada). Compared to the CRD,
the City, 56% were intraprovincial migrants (people who Langford attracted a similar proportion of individuals
moved from elsewhere in BC), 30% were interprovincial who moved from outside of Canada.
Figure 5 – 1-Year Ago Mobility Status in Langford, CRD and BC, 2016
13
Source: Statistics Canada Census Program, Census Profiles 2016
Capital Regional District Housing Needs Assessment | 2020 PAGE 132.4 Households
Between 2006 and 2016, the number of households in In 2016, 61% of households in Langford are one or
Langford grew by 63% from 8,685 to 14,180. The average two person households, compared to 71% of CRD
household size for Langford was 2.5 in 2016, decreasing households (Figure 6). However, Langford had higher
from 2.6 in 2006. The average household size in proportions of larger household sizes (e.g. three
Langford is slightly larger compared to the CRD at 2.2. persons or more) than the CRD, suggesting a higher
prevalence of families in Langford than the CRD.
Figure 6 – Households by Size in Langford, 2016
Source: Statistics Canada Census Program, Census Profiles 2016
Figure 7 shows the proportions of households by household type. Langford had a much higher proportion of family
households with children than the CRD, and a lower proportion of one-person non-census-family households.
Figure 7 – Households by Household Type in Langford and CRD, 2016
Source: Statistics Canada Census Program, Census Profiles 2016
Capital Regional District Housing Needs Assessment | 2020
14PAGE 14Figure 8 shows the ages of primary household their house than to rent (1,370 owner versus 1,175
maintainers by tenure, to illustrate how tenure changed renter households). Langford is a relatively affordable
across age groups in 2016. Primary household community compared to other areas in the CRD,
maintainer refers to the person leading a household. which attracts younger families to the area. The high
The census allows two to be identified per household proportion of homeownership rates in the younger
and the data is based on the first entry. age cohorts indicate that younger families are more
likely to own than rent in Langford in 2016. The rate of
In the City, the highest proportion of renter households homeownership peaks at households with a primary
are led by an individual in the 25 to 34 age group. maintainer of age 45 to 64 before decreasing.
However, this age group is also more likely to own
Figure 8 – Age of Primary Household Maintainer by Tenure, 2016
Source: Statistics Canada Census Program, Census 2016
2.5 Economy
In 2016, the top five industries of work for Langford Between 2006 and 2016, Langford and the CRD as a
residents were public administration (15%), health whole saw a slight decrease in the labour participation
care and social assistance (13%), retail trade (13%), rate and an increase in the unemployment rate (Figure
construction (9%), and accommodation and food 9). In 2016, the participation rate was slightly higher
services (8%). than the region at 72.3% and the unemployment rate
was similar to the region at 5.3%.
Figure 9 – Labour Participation Rate and Unemployment Rate in Langford and CRD, 2006 to 2016
15
Source: Statistics Canada Census Program, Custom Data Organization for BC Ministry of Municipal Affairs and Housing
Capital Regional District Housing Needs Assessment | 2020 PAGE 152.6 Household Median Income
Note that the custom data set provided for the purposes of Housing Needs Reports is adjusted for 2015
Constant Dollars and may differ from the typical census Profiles. The Census reports household income from
the year previous to the Census (e.g. the 2016 Census represents 2015 household incomes).
Between 2006 and 2016, the median before-tax private household income grew by 5.5% in Langford, compared
to 11.2% across the CRD (Figure 10). In 2016, the median income in Langford was $80,159 – $10,517 higher than the
CRD median income of $69,642 (Figure 10).
Figure 10 – Median Before-Tax Private Household Income in Langford and CRD, 2006 to 2016
Source: Statistics Canada Census Program, Custom Data Organization for BC Ministry of Municipal Affairs and Housing
Median household income differs by household type. Households with single income earners often have lower
median incomes than households with two or more incomes. Female lone parents and non-census-families
(typically individuals living alone) have much lower median household incomes than other family types (Figure 11).
Figure 11 – Median Total Household Income in Langford and CRD
16
Source: Statistics Canada Census Program, Data Table 98-400-X2016099
Capital Regional District Housing Needs Assessment | 2020 PAGE 16The median renter household income in a community is often much lower than the median owner household
income. In Langford, the median renter household income in 2016 was 57% of median owner household income
(Figure 12).
Figure 12 – Median Before-Tax Private Household Income by Tenure in Langford and CRD, 2006 to 2016
Source: Statistics Canada Census Program, Custom Data Organization for BC Ministry of Municipal Affairs and Housing
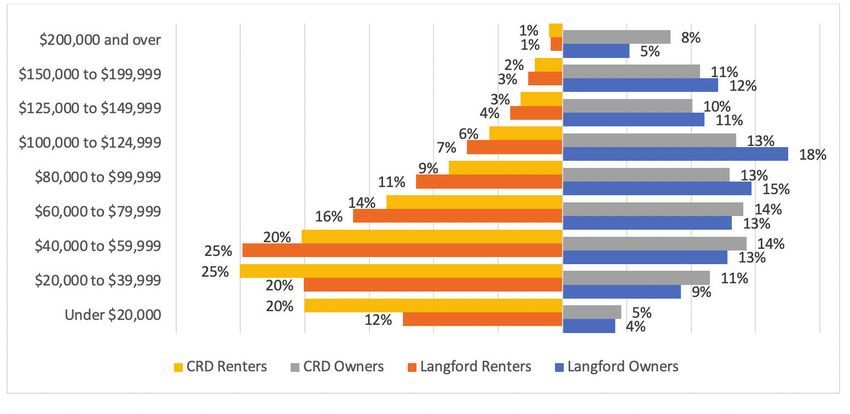
Langford has a higher proportion of households in higher income brackets than the CRD, among both owners and
renters (Figure 13).
Figure 13 – Income Distribution by Tenure in Langford and CRD, 2016
Source: Statistics Canada Census Program, Custom Data Organization for BC Ministry of Municipal Affairs and Housing
Capital Regional District Housing Needs Assessment | 2020
17 PAGE 172.7 Summary
• Between 2006 and 2016, Langford grew by 57.4% health care and social assistance (13%), retail trade
from 22,459 to 35,342 residents, while CRD grew (13%), construction (9%), and accommodation and
by 11.1% over the same period. food services (8%). Challenges finding housing can
affect the ability to attract and retain employees,
• Between 2015 and 2016, 56% of new individuals especially as housing costs increase more quickly
moving to Langford were from other parts of BC, than incomes.
30% were from other parts of Canada, and 14%
were from other countries. Compared to CRD as • Langford had higher incomes compared to the
a whole, Langford attracted a similar proportion of region over the past three census counts. In
international migrants. 2016, renter households reported incomes that
were 57% of owner household incomes ($53,459
• While rising median ages are a national trend, versus $93,858). Households with single incomes,
Langford’s median age stayed relatively stable over especially female lone parent households and non-
the last three Census years. The median age rose census-families (typically individuals living alone)
from 38.0 in 2006 to 38.3 in 2016 and is lower than reported significantly lower incomes compared to
CRD’s 45.5 other household types.
• Langford has a similar age distribution as the CRD
as a whole, except for a smaller proportion of
seniors (age 65 and over). There were also higher
proportions of three-person or more households in
Langford compared to the CRD (39% versus 28%,
respectively).
• The top five industries employing Langford
residents in 2016 were public administration (15%),
Capital Regional District Housing Needs Assessment | 2020
18PAGE 183 housing profile
This section provides an overview of community housing stock (dwelling type, size,
and age), market and non-market housing trends, and indicators of housing need. The
content in this section forms the basis of the statements about key areas of local need
provided in Section 7.

This section uses data from the following sources:               Household Survey; CMHC Rental Market Survey; BC
2006, 2011, and 2016 Statistics Canada data from                 Assessment data; BC Housing, Co-operative Housing
the Census Profiles and data tables and custom data              Federation of BC, and AirDNA.
prepared for Housing Needs Reports; 2011 National

3.1 Overview of Housing Stock
3.1.1 Housing Units
As of 2016, there were 14,180 dwellings in Langford.             houses with secondary suites. Usually, half of the
The City had a slightly lower proportion of single-              units recorded as apartments or flats in a duplex
detached houses, but a higher proportion of                      (approximately 1,702) are assumed to be single-
apartments in a flat or duplex compared to the region.           detached houses with secondary suites, while the other
Apartment or flat in duplex refers to single-detached            half are the suites themselves.

Figure 14 – Dwellings by Structure Type in Langford and CRD, 2016

Source: Statistics Canada Census Program, Census Profiles 2016

Capital Regional District Housing Needs Assessment | 2020
                                                                                                            20 PAGE 20
3.1.2 Condition of Housing
In 2016, dwelling conditions were similar between renter and owner households (Figure 15), with most dwellings
requiring regular maintenance only (78% of all dwellings). There were 18% requiring minor repairs and 4% require
major repairs.
Figure 15 – Dwelling Condition by Tenure, 20163
Source: Statistics Canada, Census 2016, Table 98-400-X2016222.
Compared to CRD, dwellings in Langford are newer, with more than half of the housing stock built in recent years,
between 2001 to 2016 (Figure 16).
Figure 16 – Dwellings by Period of Construction in Langford and CRD, 2016
Source: Statistics Canada Census Program, Census Profiles 2016
Note that for some census data, errors and / or random rounding can result in numbers that do not add up to their totals and percentages that
3
do not add up to 100%. Random rounding means that each individual value is randomly rounded up or down to a multiple of 5 or 10, and sub-
totals are independently rounded. These discrepancies are especially common when looking at aggregations with different variables, such as
21
tenure and condition.
Capital Regional District Housing Needs Assessment | 2020 PAGE 21Figure 17 shows that single-detached houses are the that has five or more storeys, apartment in a build that
predominant structural type of housing built in each has fewer than five storeys, row houses, and semi-
period of construction. In terms of proportional growth, detached over time.
there has been an increase of apartments in a building
Figure 17 – Dwellings by Period of Construction and Structural Type in Langford, 2016
Note: Not shown on this graph are other single-attached homes (~50 units)
Source: Statistics Canada Census Program, Census Profiles 2016
Capital Regional District Housing Needs Assessment | 2020
22 PAGE 223.1.3 Recent Changes in Housing Stock
Between 2015 and 2019, 72.5% of additional dwelling of this housing form. In particular, financial support for
units in Langford were apartments, 17.5% were single- purpose-built through CMHC programs and overall
family dwellings, 9.3% were townhomes, and 1.0% were favorable lending rates from mainstream financial
duplexes (Figure 18). The proportion of single-family institutions due to low interest rates may have also
houses and townhouses represent a small portion contributed to this trend.
of housing that is built each year, indicating that the
demand is strong for apartments, and that favorable Note that this data considers net new homes and
financial conditions are supporting the development accounts for demolitions.
Figure 18 – Net Building Permits Issued Annually by Dwelling Type in Langford, 2015 to 2019
Source: CRD Building Permit Data*
* The CRD uses Statistics Canada’s structure type classifications. “Apartments” includes dwelling units found in a wide range of structures, such
as duplexes, triplexes, row duplexes, low and high rise apartments, secondary suites in single-detached homes, and dwelling units over or at
the rear of a store or other non-residential structures
In this case, the CRD category of “duplexes” refers to the Statistics Canada definition of semi-detached houses. These are dwellings attached
side by side (or back to back) to each other, but not to any other dwelling or structure (except its own garage or shed).
Capital Regional District Housing Needs Assessment | 2020
23 PAGE 233.1.4 Tenure
Langford has seen the proportion of owner households of 2,515 households, proportionally growing from 21%
decline significantly over the past three census periods, to 30% during the same period. For comparison, in
from 79% of all households in 2006 to 70% in 2016. 2016, 63% of CRD residents were homeowners and
Renter households have seen a large absolute growth 37% were renters.
Figure 19 – Households by Tenure in Langford, 2006 to 2016
Source: Statistics Canada Census Program, Custom Data Organization for BC Ministry of Municipal Affairs and Housing
In 2016, 300 households, or 7% of renter households, reported that they lived in subsidized housing. There is
reported that they live in subsidized housing4. This is a no data available for 2006.
slight increase from 2011 when 295 households, or 11%,
4
Subsidized housing includes rent supplements like those provided by BC Housing, which support households renting in the private market. It
can also include rent geared to income, social housing, public housing, government-assisted housing, and non-profit housing. More detailed
information on non-market housing in the City is provided in Section 3.4.
Capital Regional District Housing Needs Assessment | 2020
24 PAGE 243.5.1 Households and Structure Types
Among owner households in Langford, the most 20). Renter households occupy a larger proportion of
common structure types are single-detached houses apartments or flat in duplex and apartments less than
(50% of owner households), followed by homes with five storeys (64% of renter households), with the next
secondary suites (apartment or flat in duplex) and most common dwelling type being single-detached
low-rise apartments (fewer than five storeys) (Figure houses (18%).
Figure 20 – Structure Type by Tenure in Langford, 2016
Source: Statistics Canada, 2016 Census of Population, Statistics Canada Catalogue no. 98-400-X2016227
Data from 2016 suggests that most ground-oriented a building taller than five storeys are more likely to
homes (e.g. single-detached house, semi-detached be occupied by renter households (60%), followed by
house, row house, movable dwellings) in Langford apartments in a building with five storeys or less (51%).
were occupied by owner households. Apartments in
Figure 21 – Tenure by Structure Type in Langford, 2016
25
Source: Statistics Canada, 2016 Census of Population, Statistics Canada Catalogue no. 98-400-X2016227
Capital Regional District Housing Needs Assessment | 2020 PAGE 25In 2016, 60% of dwellings in Langford were three to only 21% of rented dwellings were this size. Most
bedrooms or more (Figure 22). Most dwellings with rented dwellings had two bedrooms or fewer (70%).
three bedrooms or more were owned (40%), compared
Figure 22 – Dwellings by Unit Size and Tenure in Langford, 2016
Source: Statistics Canada, Census 2016, Data Table 98-400-X2016227
Figure 23, Figure 24, and Figure 25 show the types of families and couples without children are far more likely
households, sizes of households, and ages of primary to live in multi-family dwellings. About half (53% to 54%)
household maintainers living in different structure of all households with 4 persons or more live in single-
types. Due to the large proportion of single-detached detached houses, while households with 3 persons or
dwelling in the City, they are often the dominant less are more likely to live in other types of housing
structure type. (Figure 24). Finally, a higher proportion of households
led by primary household maintainers 65 years or older
Among couples with children and other families, the and 15 to 24 years live in apartments in buildings taller
single-detached house is the dominant structure type than 5 storeys (Figure 25).
(Figure 23). Lone parent households, non-census-
Capital Regional District Housing Needs Assessment | 2020
26 PAGE 26Figure 23 – Households by Structure Type and Family Type in Langford, 2016
Source: Statistics Canada, 2016 Census of Population, Statistics Canada Catalogue no. 98-400-X2016227
Figure 24 – Households by Structure Type and Household Size in Langford, 2016
27
Source: Statistics Canada, 2016 Census of Population, Statistics Canada Catalogue no. 98-400-X2016220
Capital Regional District Housing Needs Assessment | 2020 PAGE 27Figure 25 – Households by Structure Type and Primary Maintainer Age in Langford, 2016
Capital Regional District Housing Needs Assessment | 2020
28
PAGE 283.2 Trends in Homeownership Market
Average home sale prices have grown, with price increases accelerating after 2015
(Figure 26). Prices for all dwellings types in Langford have almost doubled since 2005.
The average sales prices, however, do not take into includes the common attributes of typical houses in a
consideration the age and size of houses or any given area. For Langford, the October 2019 MLS® HPI
houses with extremely low or extremely high prices benchmark sales price for a single-detached house
that may not be representative of the market overall. In was $649,200 which is slightly lower than the 2019
comparison, the Multiple Listing Service® (MLS) Home average sales price of $729,358.
Price Index (HPI) uses an analysis methodology that
Figure 26 – Average Home Sale Prices in Langford, 2005 to 2019
Source: Victoria Real Estate Board
Capital Regional District Housing Needs Assessment | 2020
29 PAGE 293.2.1 Homeownership Affordability Gaps Analysis
An affordability gaps analysis was prepared to assess Table 1 shows there are significant gaps for most
gaps between shelter costs and household incomes. household types in affording single-detached homes,
This provides insight into whether households are the most common type of home in the City, except
spending an unaffordable amount of monthly income on for other census families. Other census families often
shelter costs. Affordability is defined as spending less have higher incomes compared to other family types
than 30% of gross household income on shelter costs. because they can include multi-generational or other
family living arrangements with multiple incomes.
For ownership housing, shelter costs are primarily Couples with children making the median income
driven by the cost of mortgage payments, but also would need to spend approximately 32% of their
include other monthly expenses like property tax, monthly income on shelter costs; while couples without
utilities, home insurance, municipal services charges, children would need to spend 41%.
and strata fees (see Glossary). The analysis is based
on 2019 average sales prices and 2019 October MLS® Townhouses, at the average 2019 sales price, were
HPI benchmark sales prices5 from the Victoria Real affordable for couples with children earning the
Estate Board and median total before-tax household median household income. Apartments could be an
incomes from the 2016 census. Since these household affordable option for couples without children earning
incomes reflect 2015 incomes and have likely grown the median household income. They could also be an
since then, for the purposes of comparing with 2019 affordable option for couples with children and other
housing costs, incomes were adjusted to 2019 using census families, but there may be limited stock of
the average annual percentage increase between units with enough bedrooms to be suitable for these
2006 to 2016. Incomes were also adjusted to reflect household types.
the higher median income of owner households
relative to renter households based on the difference Homeownership is likely out of reach for single-income
between owner household median income and overall households like lone-parent and non-census families;
median income for 2016. these household types would need to spend close
to 50% or more of their monthly income to be able to
To calculate total monthly shelter costs, several afford any one of the housing types.
assumptions were made: mortgage payments are
based on a down payment of 10% with 2.54% interest
on a 3-year fixed-rate term, and a total of $533 to
$789 (depending on the housing type) for property tax,
utilities, home insurance, municipal services charges,
and strata fees (where applicable).
The values highlighted in green, orange, and red are
the difference between what is affordable for each
household type and shelter costs per month. Green
cells indicate the household is spending less than
30% of monthly household income on shelter costs;
orange indicates they are spending 30 – 49%, and red
indicates they are spending 50% or more.6
5
The MLS® HPI benchmark prices take into consideration a set of housing features that can be compared year-to-year, and exclude extremely
low or extremely high prices that may not be representative of the market overall. The HPI is considered to be a more accurate measure of
housing price trends.
6
Statistics Canada considers households spending 30% or more of total before-tax household income to be living in unaffordable housing. This
may include households in Core Housing Need. Households spending 50% or more of total before-tax household income may be in Extreme
Core Housing Need. These indicators are described in more detail in Sections 3.7 and 3.8.
Capital Regional District Housing Needs Assessment | 2020
30 PAGE 30Table 1 – Affordability Gap Analysis for Owners in Langford, Average Sales Prices, 2019
Table 2 – Affordability Gap Analysis for Owners in Langford, Benchmark Sales Prices, 2019
Sources: Statistics Canada, 2016 Census. CMHC 2019 Rental Housing Survey
*Shelter costs for renters include the rent and the costs of electricity, heat, and water.
Capital Regional District Housing Needs Assessment | 2020
31
PAGE 313.3 Trends in Rental Market
The rental market can be divided into primary rental and secondary rental. The primary
rental market consists of purpose-built rental buildings with multiple units while the
secondary rental market consists of rented homes, secondary suites, individually rented
condominium units, and other dwellings that were not built as exclusively rental properties.
3.3.1 Primary Rental
Despite CMHC surveying 1,319 purpose-built rental As described in Section 3.1.4, the City has seen an
units in Langford in 2019, the City of Langford has increase in the proportion of renter households since
documented 2,498 occupied purpose-built rental 2006. In 2016, there were 4,310 renter households
units within the municipality, and an additional 1,630 in the City and 565 primary market rental units (as
under construction. This discrepancy is likely due to reported by CMHC), suggesting that only an estimated
a lag between newly constructed units and CMHC’s 13% of renter households were served by the primary
ability to capture them in the annual Rental Market market at that time. The proportion served by the
Survey, but highlights a limitation in using CMHC rental primary rental market could be higher according to the
figures, as they may not capture the complete picture City of Langford’s record of units. From 2016 to 2019,
of rental housing costs and vacancy rates. The rest of 754 new rental units have been added and it is unclear
this subsection focuses on the 1,319 units reported by whether this has kept up with renter household growth.
CMHC as it provides the most detailed data on rents This number does not include supportive housing or
and vacancy rates. assisted living units (e.g. seniors housing) which is
captured separately.
Between 2005 and 2019, there was a significant
increase in the number of primary rental market units The median rent for primary rental market units in
in Langford (Figure 27). The overall stock increased by Langford increased between 2005 and 2019 according
751% or 1,164 units over this period. In terms of growth, to CMHC (Figure 28). The increase in cost of rent was
1-bedroom units grew the fastest (1448% or 449 units) at a slightly faster rate than seen in the homeownership
and 2-bedroom units had the most absolute growth market, likely due to the addition of new primary rental
(695% or 535 units). In 2019, only 8% of primary rental units coming onto the market during this same period.
units were bachelor units, and 9% were 3+ bedroom
units. The remaining 83% consisted of 1-bedroom and
2-bedroom units.
Figure 27 – Primary Rental Market Units in Langford, 2005-2019
32
Source: CMHC Rental Market Survey
Capital Regional District Housing Needs Assessment | 2020 PAGE 32Figure 28 – Median Rent in the Primary Rental Market in Langford, 2005-2019
Source: CMHC Rental Market Survey
Although Langford has had fluctuating rental vacancy However, in Langford the rental market appears to
rates since 2005 to 2019, it has always stayed at 3% or adjust as demand gets high (e.g. near 0% vacancy),
below. As of October 2019, the overall rental vacancy perhaps due to new units coming onto the market.
rate for Langford was 1.5%. A low vacancy rate often A healthy vacancy rate is generally considered to be
indicates significant rental demand and can result in between 3% and 5%.
excessive competition for available rental units and
upward pressure of prices, making it especially difficult
for vulnerable populations to find safe, suitable, and
affordable rental housing options.
Figure 29 – Primary Rental Market Vacancy Rate in Langford, 2005 to 2019
Source: CMHC Rental Market Survey
Capital Regional District Housing Needs Assessment | 2020
33 PAGE 33In Canada, renter households who are looking to a downpayment and eligibility for financing without
enter the homeownership market may encounter external support (e.g. parents or family) to help. The
barriers related to affording a house. While there is affordability gap analysis below further highlights one
no data available specific to Langford, the common example of the housing unaffordability challenges
set of barriers experienced by renter households encountered by renter households earning the
are generally related to saving for a sufficient size of median household.
3.3.2 Rental Housing Affordability Gaps Analysis
To assess affordability gaps for renters in the primary adjusted to reflect the lower median income of renter
market in Langford, a rental housing affordability gaps households relative to owner households based on the
analysis was conducted. Similar to the affordability difference between owner household median income
gap analysis for owners, this analysis is based on and overall median income for 2016.
median total before-tax household incomes from the
2016 census, adjusted for 2020 based on historical In addition to the median rents listed in the table, this
growth rates and further adjusted for renter household analysis includes $58 per month for utilities and tenant
incomes. Renter households typically make far insurance in shelter costs.
less than owner households. In Langford, median
household income for renter households is 67% the The values highlighted in green, orange, and red are
median household income for the community as a the difference between what is affordable for each
whole. This adjustment helps to avoid underestimating household type and shelter costs per month. Green
the gap renters face in the rental market. cells indicate the household is spending less than
30% of monthly household income on shelter costs;
The rents used in this analysis are 2019 median rental orange indicates they are spending 30 – 49%, and red
rates for primary rental units from CMHC’s Rental indicates they are spending 50% or more.7
Housing Survey and median total before-tax household
incomes from the 2016 census. While this analysis There are significant gaps for single-income
helps to better understand affordability gaps for households, like lone-parent families and non-census
renters, there were enough primary rental market units families. Although there are no affordability gaps for
for only 31% of renter households in 2016, suggesting couples with children and other census families making
that 69% of renters in the City are likely residing in the estimated median renter household incomes, it is
secondary rental market units. CMHC does not provide important to remember that half of households of this
secondary rental market data for Langford. type living in the City will make less than the median
household income.
Since these household incomes reflect 2015 incomes
and have likely grown since then, for the purposes of
comparing with 2019 housing costs, incomes were
adjusted to 2019 using the average annual percentage
increase between 2006 to 2016. Incomes were also
7
Statistics Canada considers households spending 30% or more of total before-tax household income to be living in unaffordable housing. This
may include houses in Core Housing Need. Households spending 50% or more of total before-tax households income may be in Extreme Core
Housing Need. These indicators are described in more detail in Sections 3.7 and 3.8.
Capital Regional District Housing Needs Assessment | 2020
34 PAGE 34Couples without children include older couples whose Non-census families, most commonly, individuals
children have left home. These couples may be living living alone, and lone-parent families who are earning
on a single income or, if retired, on fixed income from the median household income for their household
pension and investments. These households are type would be unable to afford any suitable units at
close to the affordability threshold for 2-bedroom and the median rental rates. Lone-parent families require
3-bedroom units; however, they are also more likely to a minimum of two bedrooms to suitably house their
own a home and benefit from rising market prices when children.
downsizing, offering more financial resources to put
towards housing.
Table 3 – Affordability Gap Analysis for Renters in Langford
Sources: Statistics Canada, 2016 Census. CMHC 2019 Rental Housing Survey.
*Shelter costs for owner households include, where applicable, mortgage payments, property taxes and condominium fees,
along with the costs of electricity, heat, water, and other municipal services.
3.3.3 Secondary Rental Market Trends
Secondary rental refers to both secondary suites CMHC provides data for the secondary rental market for
as well as other types of units that are rented by the Victoria Census Metropolitan Area, which includes
the property owner, including single-family homes, most CRD communities, except Salt Spring Island and
apartment condominiums, and townhomes. In 2016, the western portion of Juan de Fuca. This data is of
there were 4,310 renter households in the City and much lower quality than the data for the primary rental
565 primary market rental units, suggesting that 87% market.
of renter households were served by the secondary
rental market.
According to the City’s records, there are 4,694 legal
secondary suites in Langford.
Capital Regional District Housing Needs Assessment | 2020
35 PAGE 35Between 2008 and 2016 (the years for which data is 30). The available data indicates that, as of 2016, the
available), average rents for rented single-detached average rent of an accessory suite did not see major
homes grew by 40%, a significant increase but not changes since 2008.
as large as seen in the primary rental market (Figure
Figure 30 – Average Rents for Secondary Market Units in Victoria CMA, Excluding Condominiums, 2008 to 2016
Note that there are some data gaps and that some of the data is of poor quality. 2016 is the latest year for which there is data.
Source: CMHC, 2019.
The data for rented condominiums shows a steady increase in average rents but there are significant data gaps
(Figure 31).
Figure 31 – Average Rents for Rented Condominiums in Victoria CMA, 2008 to 2019
Note that there are significant data gaps and that some of the data is of poor quality.
Source: CMHC, 2019.
Capital Regional District Housing Needs Assessment | 2020
36 PAGE 363.3.4 Short-Term Rental Market 8
On May 18, 2020, a scan of AirDNA data on short-term shared room. AirDNA also provides data on previous
rentals was completed. It found 188 short-term rentals quarters. Since 2017, the number of short-term rentals
listed for Langford at that time. Of these active rental in Langford has doubled to 276 units in the first quarter
listings in Langford, 83% were for the entire home, 16% of 2020.
were for private rooms in a home, and 1% was for a
Figure 32 – Number of Short-Term Rentals Per Year Quarterly, 2017-2020
Source: AirDNA, 2020.
When looking at unit size, 73% of active rentals on May 18, 2020 were smaller units (i.e., studio, one-bedroom, or
two-bedroom) (Figure 33).
Figure 33 – Short-Term Rentals by Number of Bedrooms, May 18, 2020
Source: AirDNA, 2020.
As of August 2020, AirDNA reported an occupancy travelled in March due to social distancing measures
rate of 65% in Langford, down from the 89% occupancy and travel restrictions. This indicates that the
rate in August 2019. It is likely the COVID-19 restrictions coronavirus pandemic and social distancing measures
on travel have impacted the short-term rental market have had some impact on the short-term rental market,
and that some owners are removing their units from at least in the immediate term.
listings, at least temporarily, while far few people
8
Data for the short-term rental market is accessed through the publicly available information on AirDNA.co. The date of data collection is
noted in the text and may be different from other reports completed through the CRD Housing Needs Report project.
Capital Regional District Housing Needs Assessment | 2020
37 PAGE 373.4 Non-Market Housing
As of March 2019, there are a total of 847 non-market supports. Most of these units are for families and
units where BC Housing has a financial relationship seniors, and some of these units are dedicated for
(Table 4). This may include subsidized units, shelter persons with disabilities.
beds, rent supplements, or other non-market
Table 4 – BC Housing Subsidized Units, 2019*
*The data includes non-market housing units where BC Housing has a financial relationship. There may be other non-market
housing units in the community. **Includes both homeless housed in housing with supports and homeless rent supplements.
Source: BC Housing Research and Planning Department, 2020.
As of 2019, Langford has 21 co-operative housing units The City administers an affordable home ownership
that are registered with the Co-operative Housing program supplying 8 condominiums and 39 single-
Federation of BC (CHFBC). As cooperative housing family dwellings, which are available for sales prices
units tend to have more bedrooms, they are an well below market rate.
important source of affordable housing for families with
children. In addition to the 21 units registered with the
CHFBC, the Sooke Lake Modular Home Co-operative
located in Langford also provides 94 modular houses.
Table 5 – Cooperative Housing Units in Langford, 2019
Source: Co-operative Housing Federation of BC, 2020.
3.4.1 BC Housing Waitlist for Non-Market Housing
As of March 2020, there were a total of 212 households other waitlists of housing providers that are unaffiliated
on BC Housing’s Housing registry for non-market with BC Housing and should not be considered
housing in Langford. This list does not consider any comprehensive.
Table 6 – Households on BC Housing Waitlist for Non-Market Housing in Langford, March 2020
Source: BC Housing, March 2020
Capital Regional District Housing Needs Assessment | 2020
38 PAGE 383.5 Homelessness
It is estimated there was a minimum of 1,523 individuals who experienced homelessness
across the CRD on March 11, 2020. The Point-in-Time (PiT) count identified at least 350
individuals who were emergency sheltered, 743 who were provisionally accommodated
in transitional housing and institutions, and 145 individuals who were couch-surfing.
There were at least 270 individuals who were unsheltered and a minimum of 15
individuals who stayed in unknown locations.
As the PiT count was taken during the start of the It is important to note that although these counts provide
COVID-19 pandemic, some individuals may have made valuable data and can suggest trends, they face several
decisions regarding staying outdoors or attending PiT challenges. PiT counts are widely understood to under-
count-related events. Compared to the 2018 PiT count, represent actual numbers of individuals experiencing
there was an increase in unsheltered homelessness homelessness, as they only capture individuals who are
which may be due to the fear of COVID-19 spreading accessing shelters and/or who are out on the street,
in confined spaces. Furthermore, since the March 11, available for interviews during the count. Individuals
2020 count, recent initiatives to increase the number of who are not interviewed during the day of the count are
shelter beds (e.g. repurposing hotel rooms as shelters) not counted. These counts are also recognized to be
will have shifted the number of individuals who are inadequate at capturing hidden homelessness, such as
sheltered or unsheltered. couch surfing, living in cars or boats, and other forms of
housing vulnerability.
3.6 Student Housing
While there are no post-secondary institutions located in the City of Langford, there are
three nearby: University of Victoria and Camosun College are located in the District of
Saanich and Royal Roads University is located in the City of Colwood. Data from all three
post secondary institutions is provided below, because students attending all three may
be looking for housing throughout surrounding CRD communities.
As of the 2018/2019 school year, there were a total of Royal Roads University both saw declines of 8.3% and
24,965 full-time equivalent enrolments at these three 1.6%, respectively. Despite declines at Camosun and
post secondary institutions (Table 7). The University Royal Roads, growth at the larger University of Victoria
of Victoria is the only post secondary institution with and plans to expand student housing suggest that
student housing, with 2,625 beds. The University has there is a need for more student housing in the region.
plans to expand student housing on campus in the near
future. Students attending Camosun College and Royal Table 7 – Public Post-Secondary Institutions in Capital
Region District, Number of Beds and Full Time Equivalent
Roads University, as well as students who are not able Students, 2018/2019
to access housing at the University of Victoria may be
looking for housing in Langford. Many students look
for affordable rental housing, such as studio or one-
bedroom units, including secondary suites.
Between the 2008/2009 and 2018/2019 school Source: Ministry of Advanced Education, Skills and Training
years, the University of Victoria’s full-time equivalent
enrollments grew by 6.5%, while Camosun College and
Capital Regional District Housing Needs Assessment | 2020
39 PAGE 39You can also read


