LOST CITY MITCHELL'S PLAIN - BACKYARDING MATTERS Enabling People, Place and Policy - Development Action Group
←
→
Page content transcription
If your browser does not render page correctly, please read the page content below
Neighbourhood Profile

      LOST CITY
MITCHELL’S PLAIN

      BACKYARDING MATTERS
   Enabling People, Place and Policy

                                12/2020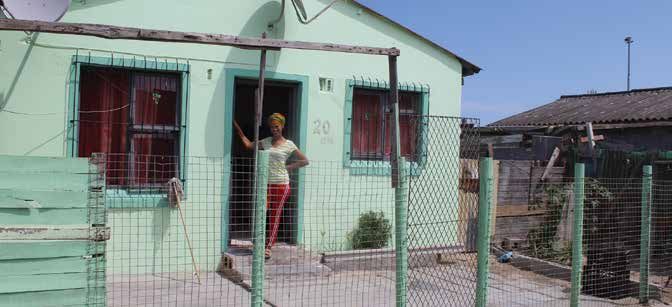
table of CONTENTS

04   1. Executive Summary
                                                45             8. About the
                                                                  Neighbourhood

05
                                                                8.1.    Perception of the
     2. Introduction                                           		       Neighbourhood
        2.1.   Project Background                               8.2.    Push & Pull Factors
        2.2.   Project Objectives                               8.3.    Commuting
        2.3.   Project Methodology                              8.4.    Services
        2.4.   Project Narrative
        2.5.
        2.6.
               Safeguarding
               About the Neighbourhood
               Profile
                                                53             9. Rental Structures
                                                                   9.1. Density & Infrastructure

08   3. Participatory Data Collection
       3.1. Data Collection
                                                57             10. About the Informal
                                                                   Rental Market
       3.2. Fieldwork sample survey in                             10.1. Rent
     		     Lost City, Mitchells Plain                             10.2. Market

11   4. About Lost City
        - Contextual Analysis                   59             11. Salient Findings

                                                61
        4.1. Historical Context & Development                  12. References
        4.2. Spatial Context & Urban Fabric
        4.3. Social and Economic Context

16   5. Landlords
        5.1.   Landlord Tenure
        5.2.   Landlord Demographic Profiles
        5.3.   Landlord Economic Status
        5.4.   Typical Landlord

29   6. Tenants
        6.1.   Tenant Tenure
        6.2.   Tenant Demographic Profiles
        6.3.   Tenant Economic Status           This document is produced as part of the project
        6.4.   Typical Tenant                   Backyard Matters: Enabling People, Place and
                                                Policy. Backyard Matters is a partnership project

40
                                                initiative between Development Action Group
     7. About the Social Nature                 (DAG), Isandla Institute and Violence Prevention
        of the Yard                             through Urban Upgrading (VPUU). The project is
                                                aimed at strengthening the backyard rental market
        7.1.   The Yard                         and contributing towards well-managed, quality
        7.2.   Tenant / Landlord Relationship   rental stock that provides affordable, dignified
        7.3.   Rental Agreement                 and safe housing solutions. Backyard Matters is
        7.4.   Social Cohesion                  funded by Comic Relief.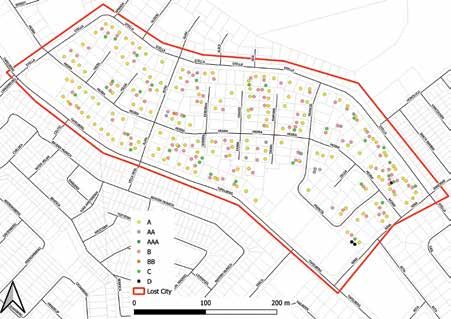
list of TABLES
10   [1] Sample sizes by tenure type     31   [25] Effective tenant marital    47   [48] Push and pull factors
                                              status                                (out of all households)
13   [2] Description of all erven uses
     in enumeration area (City of Cape   32   [26] Age range of tenants        48   [49] Most common commuting
     Town, 2020)                                                                    locations & times *excl.
                                         32   [27] Average effective tenant         students/learners
                                              and tenant household age
15   [3] Age Distribution of residents
                                                                               49   [50] Access to electricity
     Source: Stats SA
                                         32   [28] Tenant primary household
                                              language                         50   [51] Households which
16   [4] Landlord types                                                             selected access to electricity
     (Scheba & Turok, 2020:10-15)
                                         33   [29] Tenant nationality               as a priority for area
                                                                                    improvement
17   [5] Landlord households by          33   [30] Tenant household size
     tenure type
                                         34   [31] Effective tenant highest    50   [52] Households not paying
                                                                                    for electricity
19   [6] Landlord length & tenure             education level achieved
                                                                               50   [53] Household average
20   [7] Effective landlord gender       35   [32] Effective tenant                 monthly expenditure on
                                              employment status                     electricity
20   [8] Effective landlord marital
     status by gender                    36   [33] Tenant household
                                                                               51   [54] Water supply access
                                              members’ employment status
21   [9] Age range of landlords                                                51   [55] Households not paying
                                         36   [34] Tenant household income          for water
21   [10] Average effective landlord
     and landlord household age          37   [35] Tenant household sources    51   [56] Household average
                                              of income                             monthly expenditure on water
21   [11] Landlord primary
                                         37   [36] Tenant household            51   [57] Household which selected
     household language
                                              members receiving grants              access to water as a priority for
                                                                                    area improvement
21   [12] Nationality of effective
                                         38   [37] Average household
     landlords                                expenses by tenure type          52   [58] Access to sanitation
                                                                                    services
22   [13] Landlord household size        41   [38] Tenant households reason
                                              for moving to Lost City          52   [59] Access to sanitation
22   [14] Effective landlord highest                                                services
     education achieved                  42   [39] Payment method for rent
                                              or bond                          52   [60] Households not paying for
24   [15] Effective landlord                                                        sanitation
     employment status                   42   [40] Number of households
                                                                               52   [61] Household average
                                              with a signed rental agreement
25   [16] Landlord household                                                        monthly expenditure on
     residents’ employment status        42   [41] Quality of relationship          sanitation
                                              between tenants and landlords
25   [17] Landlord household income                                            53   [62] Households which
                                         43   [42] Perception of the                selected access to toilets as a
26   [18] Landlord household                  stability of the relationship         priority for area improvement
     sources of Income
                                         44   [43] Agreement that people       53   [63] Comparison of structure
26   [19] Effective landlord and              generally help each other out         type and building materials
     landlord household disabilities
                                         44   [44] Trust in other households   55   [64] Responsibility for
                                                                                    maintenance of structures
27   [20] Landlord household grants           on the yard

27   [21] Average household              45   [45] Top changes households      57   [65] Average monthly rental
                                              would like to see in the area         paid by tenant households
     expenses by tenure type

                                         46                                    57   [66] Spread of rent
30   [22] Tenant households by                [46] Perceptions of safety at
     tenure type                              home and in the area during      58   [67] How tenants discovered
                                              either the day or night               the property by tenure type
30   [23] Tenant length of tenure
                                         46   [47] Perceptions of main         58   [68] Ease in finding affordable
31   [24] Effective tenant gender             crimes out of households              rental opportunities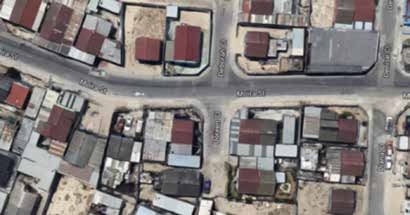
list of FIGURES

09   Figure 1
     Boundary of enumeration area
                                         14   Figure 6
                                              Bird’s-eye view of backyards in
     Source: Enumeration Survey               Lost City
                                              Source: Google Maps

11   Figure 2
     Location of Lost City, circled in
                                         54   Figure 7
     the City of Cape Town                    Typical main house structures,
     (Stamen, 2020)                           one instance with an extended
                                              structure.

12   Figure 3
     Social facilities and
                                         55   Figure 8
     transport infrastructure                 Typical backyard structures
     (City of Cape Town, 2020)                made of timber panels, with
                                              examples of metal, brick and
                                              cement structures

13   Figure 4
     Zoning scheme
     (City of Cape Town, 2020)

14   Figure 5
     A typical streetscape
     (Google Maps, 2020)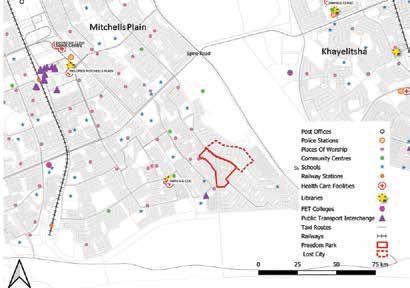
Neighbourhood Profile / Lost City, Mitchells Plain / Executive Summary   04

EXECUTIVE SUMMARY
The backyard sector is widely        The key findings from this survey           month. Main house tenants
recognised as a critical and         are as follows:                             pay slightly more - around
growing component of housing                                                     R1100 per month. 67% of all
provision in South African           232 of the residential erven in             tenant households pay their rent
cities. However, an absence          the Lost City enumeration area              in cash and less than 15% of both
of data, particularly at the         were surveyed and altogether                tenant and landlord households
neighbourhood level, has meant       838 residents were interviewed.             say that they have a formal
that the nature of backyarding       In general, the survey discovered           written rental agreement.
is not well understood. As           multiple forms of tenure and
such, there is a lack of public      high degree of fluidity between             There is a trio of related factors
policy offering guidance and         landlords and tenants. This can             which help to understand why
programmatic responses.              be attributed to extended family            households (both tenants and
                                     relationships where, for example,           landlords) choose to live in Lost
Within this context, the             several household members of                City. They want to be closer to
Backyard Matters project             landlords reside as backyard                family and find affordable rental
aims to contribute towards an        tenants etc.                                housing. Push factors are primary
improved understanding and the                                                   economic, households would
identification of interventions      Most landlord households have               move to improve their livelihoods
which enhance and foster this        been living in Lost City for a fair         through better employment.
particular under-estimated and       amount of time. Most moved to
neglected housing sector.            Lost City in the 1990s. Landlord            These observations hold true
                                     households can range from one to            for Lost City where, across the
Backyard Matters is a 42-month       ten people, though most household           board, the main house secures
project funded by Comic Relief,      are between three and four people           refuse, water, sanitation and
which brings together the            and the overall average is closer           electricity from the municipality
Development Action Group             to four people. Amongst effective           and provides these services in turn
[DAG], Violence Prevention           landlords themselves, nearly 75%            to the backyarders. Very few, if
through Urban Upgrading [VPUU],      are unemployed or looking for               any, backyarders access services
and the Isandla Institute. The       work. Most households have a                independently. The majority of
main objectives of the project       combined income of somewhere                households (mostly landlord and
related to improving access for      between R800 and R7,500 per                 main house tenants) are living in
affordable rental housing stock,     month with 60% of households                the main house on the property
improve the quality of rental        earning between R1,500 and                  which is almost always made
stock through technical support      R7,500 per month.                           of brick and cement. 33% of
and develop new forms of                                                         backyard structures are made out
collective bargaining.               Much like landlord households,              of wood. However, in Lost City, a
                                     tenant households only really               fair number of other structures are
In order to improve the              began arriving in Lost City in              also made from brick and cement.
understanding of the backyard        the 1990s. Whereas landlord                 The remainder are largely informal
rental market, DAG and VPUU          households averaged four                    structures made of metal or wood.
conducted primary data collection    members, tenant households are,             There were no significant examples
in eight neighborhoods: Lost City    on average around three people.             of entrepreneurial landlords or
and Freedom Park (in Tafelsig,       Roughly the same number of                  boarding houses.
Mitchells Plain), Maitland           tenants are employed, or self-
Garden Village, Palm Park (in        employed compared those who                 This document, along with the
Eerste River), Lotus Park, Ilitha    are unemployed or looking for work          seven other neighbourhood
Park, Kensington, and Manenberg.     (around 45% in both cases)                  profiles will inform further
The primary data is distilled into                                               synthesis and understanding
these neighbourhood profiles         The average rent for tenant                 of the backyarding sector.
and supplemented by focus            households in Lost City (who
group discussions.                   do pay rent) is around R850 per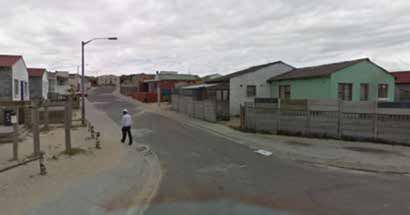
05   Neighbourhood Profile / Lost City, Mitchells Plain / Introduction

INTRODUCTION

Project Background

The backyard sector is                    Within this context, the Backyard Matters project aims to contribute
widely recognised as                      towards an improved understanding and the identification of
                                          interventions which enhance and foster this particular under-estimated
a critical and growing                    and neglected housing sector.
component of housing
provision in South                        Backyard Matters is a 42-month project funded by Comic Relief, which
African cities. However,                  brings together the Development Action Group [DAG], Violence Prevention
                                          through Urban Upgrading [VPUU], and the Isandla Institute.
an absence of data,
particularly at the                       The following insights and arguments motivate for the project:
neighbourhood level,
has meant that the                        • The backyard rental market is a rapidly growing accommodation option
                                            for an increasing number of people, especially in South African cities.
nature of backyarding                     • There is a lack of data and understanding of the nature and dynamics
is not well understood.                     of backyard rental markets in different cities and neighbourhoods.
As such, there is a                       • There is no clear definition of backyarding or backyard dwellings to
lack of public policy                       guide policy and programmatic responses.
                                          • Government responses to backyarding have been untargeted
offering guidance                           and ad-hoc.
and programmatic                          • New actors have emerged that are likely to shape backyard
responses.                                  rental markets.

                                          Project Objectives
                                          • Better access to reliable information and well managed, quality rental
                                            housing stock.
                                          • Improved rental housing stock through technical support, development
                                            guidelines and formalisation.
                                          • New and innovative collective bargaining models are tested
                                            and adopted.
Neighbourhood Profile / Lost City, Mitchells Plain / Introduction 06
Project Methodology
To gain a deeper understanding Village, Palm Park (in Eerste as a provider of affordable,
of the community-owned River), Lotus Park, Ilitha Park, flexible and dignified housing
solution that is the backyard Kensington, and Manenberg. The options. As such, the project
rental sector, the primary focus data collected has been compiled will engage in literature, policy
of the project in the first year into a series of neighbourhood review and convene stakeholder
[October 2019 - September specific sample profiles directly engagements, including
2020] is on data collection informing a synthesis paper, meetings of the local community
and analysis, through sample which will seek to distil a of practice of Cape Town
surveys and focus group provisional typology of backyard based-NGOs. Lastly, the project
discussions in eight selected rental markets in Cape Town. will initiate engagements with
neighbourhoods across the landlords and tenants in selected
Cape Town metropolitan area. The project will also focus on neighbourhoods, to review and
research and engagement strengthen opportunities for
The eight identified case studies, processes aimed at collective bargaining in a move
with different socio-spatial understanding potential policy towards a robust and affordable
conditions, are Lost City and levers and programmatic backyard rental sector.
Freedom Park (in Tafelsig, interventions to strengthen
Mitchells Plain), Maitland Garden the backyard rental sector
Project Narrative
To comprehensively unpack What is and could be people’s Quality of Life within the
the backyard sector, a series backyarding phenomenon is the underpinning question
of relevant themes have
of this research, simultaneously mapping the status quo
been identified and organised
into a coherent research
and exploring the potential.
policy framework, namely
the project narrative. In this light, the project narrative includes the following themes:
Each of these themes explores Tenant and landlord profiles | tenant-landlord relationships |
how to measure a dimension of renting household profile | cost of living | market | support |
the backyarding phenomenon, neighbourhood [context/area] | properties | structures | basic-
testing various indicators services | design/planning | policy/legislation
through targeted questions,
which may [or may not] find The project intends to test the research methodology, together
their answers in the literature with the Project Narrative as a precursor of a more in-depth –
review, sample surveys, Backyarding Index.
qualitative interviews and or
focus group discussions.07 Neighbourhood Profile / Lost City, Mitchells Plain / Introduction
Safeguarding About the
Partners have adopted a
Neighbourhood Profile
safeguarding strategy that
aims to protect all stakeholders
taking part in the project from Within the Backyard Matters project, this
harm during data collection report aims to provide a deeper understanding
and analysis; as well as any of the informal rental sector within a specific
meetings and forums that are
neighbourhood context.
organised. This has been
tailored to address specific risks
in each community through As part of a set of eight reports illustrating and
local safety plans. analysing the data collected within the selected
neighbourhoods, this report focuses on the informal
All participants in surveys will rental sector in Freedom Park, Mitchells Plain.
be informed about the purpose
However, it is important to note that this study
of the project and how the
data will be used and consent explores a way of inquiry through sample surveys,
will be obtained. Data will be rather than mapping each neighbourhood in
anonymised so that the identity its entirety.
of participants is protected and
used for research purposes only. Firstly, this report illustrates the neighbourhood
context, and it provides a summary of some of the
The COVID-19 pandemic and the
declaration of a State of Disaster key demographic, social, economic, and housing
in South Africa required specific trends. Secondly, it maps the informal rental sector
safety measures to be put into within that specific neighbourhood.
place to comply with the law,
prevent spread of the virus and To identify targeted responses and policy
protect staff, fieldworkers and
recommendations, it is necessary to explore
residents from being infected as
well as managing distress and the informal rental sector within different
the fears of all involved. neighbourhood contexts, and drawing from the
nuances emerging from the different socio-spatial
conditions.
In this light, the synthesis paper interrogated
and compared the informal rental sector within
different contexts, drawing from the various
neighbour-specific sample surveys.Neighbourhood Profile / Lost City, Mitchells Plain / Participatory Data Collection 08
PARTICIPATORY DATA
COLLECTION
Data Consultation and training
Collection • Local leadership and/or organisations were identified and engaged to
secure buy-in for the field work.
• Preliminary focus group discussions were conducted with residents
This neighbourhood
and potential local fieldworkers with the intention of providing
profile is based on information about the project and gaining an initial understanding of
a participatory data how the backyard sector functions in each community.
collection process. • Local field workers were recruited by staff and community leaders,
screened for suitability and between 5 and 10 were then trained on the
purpose of the project and how to complete and troubleshoot the
surveys on the tablets. They were paid for this work.
Fieldwork sample surveys
• An extensive survey was designed to capture data on the main
research areas. The surveys were conducted before the covid-19
lockdown (09 to 13 March 2020).
• Before fieldwork began, the fieldworkers went door-to-door and a
community meeting was held to ensure that as many residents as
possible were aware that the enumeration was taking place and what
it was for. This preparation assisted greatly in helping to ensure the
actual enumeration went smoothly.
• Over a few days, field workers surveyed as many households in
the area as they could access. This included information about each
household living on the erf and additional information about each
person in the household.
• In general a central location was designated as a headquarters during the
process that could be used for daily briefing, queries and an assembly
point should any incident occur. Each day, target erf numbers were
identified and field workers conducted surveys in pairs and maintained
contact regarding their movement with supervisors via whatsapp.
• Particular concerns arose regarding gang activity. Field workers were
mostly drawn from the area and were able to navigate the
neighbourhood, but were advised to enter the nearest house to avoid09 Neighbourhood Profile / Lost City, Mitchells Plain / Participatory Data Collection
getting caught in crossfire. Vacant and dilapidated houses were gang
or drug activity were likely to be taking place were avoided. Yards were
checked for the presence of dogs.
• Where possible, permission was obtained from landlords before
entering backyards and speaking to tenants. Consent was obtained
and photos were taken of each house that was enumerated.
Data analysis
• The data collected was then cleaned and analysed.
• Key themes were identified and possible questions for focus group
discussions were identified.
Focus group discussions
• Focus group discussions were conducted with both tenant and
landlord households where participants gave consent to be contacted.
Fieldwork sample survey in Lost City,
Mitchells Plain
Boundary
Figure 1: Boundary of enumeration area. Source: Enumeration Survey.Neighbourhood Profile / Lost City, Mitchells Plain / Participatory Data Collection 10
The enumeration area covers most of what is north and west. The eastern boundary followed
known as Lost City in Mitchells Plain, in a band Nina Street.
following Tafelberg Road to the south and the back
boundary of the houses along Stella Road to the
Sample size
232 1892
of the 245 residential
erven in the enumeration residents surveyed:
area surveyed:
101 landlord households across
various tenure types with: tenants living in backyards 406
125 120 11 166
tenants living in the main house 42
effective
landlords
backyarder tenants living effective
households in rooms in the tenants1
members of landlord households 390
main house Exact breakdown of residents in the table below.
SAMPLE SIZE (IN VALUES)
Total households Effective landlord/tenant Total Residents
TENANT households
Main house tenants 11 14 42
Backyard owners 39 49 143
Backyard tenants 50 69 158
Backyard residents 31 34 105
Total 131 166 448
LANDLORD households
Landlord owners 90 111 334
Landlord tenants 9 10 42
Landlord residents 2 4 14
Backyard landlords 0 0 0
Total 101 125 390
Grand Total 232 291 838
Table 1: Sample sizes by tenure type.
1
The tenure types and definition of effective landlords/tenants are discussed in more detail in the landlord and tenant sections.11 Neighbourhood Profile / Lost City, Mitchells Plain / About Lost City - Contextual Analysis
ABOUT LOST CITY -
CONTEXTUAL ANALYSIS
Historical Context and Development
Location
Figure 2: Location of Lost City, circled, in the City of Cape Town (Stamen, 2020).
Lost City is located at the very far tip of Tafelsig, Mitchells Plain, about halfway
between Spine Road to the north and Baden Powell Drive to the south. Its mostly
surrounded by public housing and the veld which as historically separated
Mitchells Plain from Khayelitsha.
Historical development
Mitchells Plain was developed as a Coloured township by the apartheid
government as a response to the housing issues of the 1970s. The township
planning was laid out in terms of neighbourhood unit concepts with large open
spaces and localised public facilities influenced by the political ideologies of the
time and standards-based planning. According to the 2011 Census, MitchellsNeighbourhood Profile / Lost City, Mitchells Plain / About Lost City - Contextual Analysis 12
Plain’s population was 310,485, where the number The average household size was 4.80. Lost City
of households was 67,995. This results in an is a relatively new area within Tafelsig. The area
average household size of 4.57. is predominantly zoned SR1: Single Residential
dwelling with community zoned properties used for
Tafelsig is a sub-section situated in Mitchells Plain. social facilities. Residents in Lost City are housed in
The population of the 2011 Census of Tafelsig was formally developed private or subsidised units and
61,755 and the number of households was 12,861. backyard dwellings.
Spatial Context & Urban Fabric
Connectivity
The suburb sits at the
centre of the city, but
is peripherally located
in terms of economic
activity. For those who
work it is a commuter
or dormitory suburb.
Despite this, Lost City
is not near any major
railway lines and residents
would have to take taxis
to the nearest interchange.
Finding and attending
work is often difficult,
especially on low incomes.
Figure 3: Social facilities and transport infrastructure (City of Cape Town, 2020).
Social facilities
Public service are thinly spread out across the suburb. Lost City is located
in the south-east corner, fairly far from the local CBD. There are schools, a
clinic and two large community centres within walking distance.13 Neighbourhood Profile / Lost City, Mitchells Plain / About Lost City - Contextual Analysis
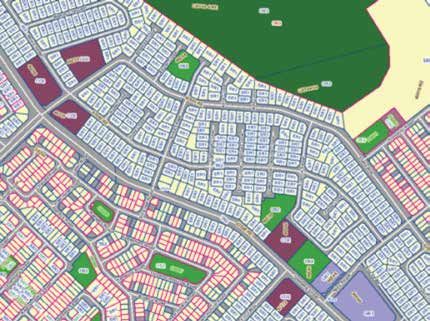
Land use and zoning
Figure 4: Zoning scheme (City of Cape Town, 2020).
Apart from the obvious exceptions such as the All of the residential erfs are zoned as Single
parks and school premises, which are zoned Residential 1
for community use, the remainder, are zoned as
residential. The surrounding land is zoned almost Single Residential 1 provides for,
entirely residential too, apart from the large buffer ‘… predominantly single-family dwelling
with Khayelitsha which remains undeveloped. houses… in low- to-medium-density residential
neighbourhoods [and] limited employment
Of the 245 erven in Lost City, 242 are and additional accommodation opportunities
primarily residential. are possible as primary or consent uses’
(City of Cape Town, 2015:108).
ERVEN Accordingly, the zoning scheme provides for up
to three dwellings on the same erf with a floor
Residential erven 242
factor of one. While it is possible to build up to the
Parks, fields and open space 2 boundary, a maximum floor coverage of 75% of
the erf is permissible. Second and third dwellings
Schools and Pre-Primaries
must be constructed in a style that is similar to
Churches and community facilities 1 the architecture of the main dwelling house and is
subject to certification that capacity is available on
245
the service networks (City of Cape Town, 2015:112).
Table 2: Description of all erven uses in enumeration area
(City of Cape Town, 2020).Neighbourhood Profile / Lost City, Mitchells Plain / About Lost City - Contextual Analysis 14
Clearly the majority
of households with
Urban fabric
backyard housing are not
compliant with the zoning Streetscape
scheme, which imagines
the construction of more
formal housing, primarily
because there are often
more than three dwellings
and the backyard
structures (made out of
wood and zinc) are rarely
constructed in a similar
architectural style.
In addition, apart
from providing for a
limited range of home
occupations including Figure 5: A typical streetscape (Google Maps, 2020).
hair salons, the zoning
scheme expressly forbids
commercial activity Growth in backyarding
such as workshops and
Where it not for extensive backyarding, Lost City might be considered a
spaza shops, which are
single dwelling suburb. It is almost uniformly single storey homes built to
ubiquitous in the area.
the front of fairly large erfs of around 200m2.
General Residential 1
The streets are tarred with little pavements, though the beach sand blows
primarily encourages,
everywhere and is rarely swept by the City Council.
‘…group housing, which is
a medium-density form of
residential development,
where attention is
given to aesthetics,
architectural form and the
inter-relationship between
different components
of the development’ (City
of Cape Town, 2015:116).
Clearly, this is ambitious
and the underlying zoning
doesn’t match the current
built form at all.
Figure 6: Bird’s-eye view of backyards in Lost City. Source: Google Maps.
2
A floor factor is used to calculate the maximum floor space of buildings permissible. It is the maximum floor space as a proportion of the net erf area. For
example, an erf 200m2 in size with a floor factor 1 may have up to 200m2 of floorspace across storeys subject to coverage and height limitations. High floor
factors can be used to encourage density in some land uses.15 Neighbourhood Profile / Lost City, Mitchells Plain / About Lost City - Contextual Analysis
Land values in Lost City:
City of Cape Town, 2018 R220,000
Social and Economic Context
Official census data from 2011 is only available at the subplace level for Lost City, which
includes the heart of the enumerated area between Stella Road and Tafelberg Road.
Gender and Age
Total population:
1,129 living in
228 households
50% split between
male & female
The population is distributed across age
groups and is largely youthful.
AGE DISTRIBUTION
0-9 10-19 20-29 30-39 40-49 50-59 60-69 70-79 80+
No. 269 198 282 92 141 113 18 9 3
% 24% 18% 25% 8% 13% 10% 2% 1% 0%
Table 3: Age distribution of all residents. Source: Stats SA.
Race and language
Nearly 97% of the population identifies as Coloured with less than 1% identifying
otherwise. The majority, around 64% speak Afrikaans as a first language, with 10%
speaking English and 6% speaking isiXhosa (Stats SA, 2011). This is not unexpected given
its history and such highly segregated neighbourhoods are not uncommon across the
City of Cape Town.
Employment and household income
±40% unemployed
people with: 10% discouraged or
unemployed people
The remainder are considered not economically active or employment is not applicable.Neighbourhood Profile / Lost City, Mitchells Plain / Landlords 16
LANDLORDS
Landlord
Tenure A landlord is defined as, ‘The person who occupies
the main house, controls access to the backyard unit
and services, and enters into a rental agreement with
Types of landlords in the backyard tenant… The landlord is not necessarily
the backyard sector the owner of the land and does not necessarily have legal
have not been formally authority to let the space in the back’ (Tshangana, 2014:8).
designated in public
policy, though there is
some convergence in Landlords have for the most part been categorised by the degree to which
the literature. the landlord is investing in and deriving an income from rental housing
and this is reflected in the formality of the relationship with tenants and
the typology of backyard structures.
LANDLORD TYPES
Investment Relationship Structure typology
Subsistence Landlords rent out parts of Tenants may be family or Backyard shacks made out
landlords their property to generate extended relations or others of timber and zinc or other
income for basic household known to the landlord. materials are erected to the
needs. Renting forms part of Most pay rent though not front, rear or side of the main
the household’s strategy to always. Rental agreements house. Limited access to
get by. Minimal investment are normally verbal and services, often in or from
on the part of landlord and relationships are managed the main house.
rental does not generate large informally.
surpluses. Tenants often
build their own structures on
landlord’s property.
Homeowner Landlords who are not Tenants are more One or two storey micro-flats
landlords necessarily reliant on independent and less reliant or rooms built from brick
the rental income for on the main house and and mortar are constructed
basic needs. They invest the relationship is more in the backyard, often with
surplus in upgrading the formal. They often have their shared facilities in the yard
infrastructure and rooms, own keys. The landlord either or en suite bathrooms. Some
often incrementally, and are lives on the property and include electricity in the room.
able to charge higher rents. manages the relationships Mostly constructed without
The intention is to increase or appoints someone. formal plans or technical
income to improve their know-how. Can result in units
quality of life. that are haphazardly built.17 Neighbourhood Profile / Lost City, Mitchells Plain / Landlords
LANDLORD TYPES
Investment Relationship Structure typology
Entrepreneurial Landlords who collect rent Landlord rarely lives on Boarding houses or larger
landlords as their main source of the premises and the double storey buildings. Often
income. Their intention is relationship is more clinical the main house has been
to expand and accumulate and ‘arms-length’ even demolished or completely
wealth and they are able though agreements may renovated to accommodate
to network and invest in still be verbal. multiple rooms with en suite
multiple properties, though or shared bathrooms and a
they may not have access to shared kitchen. Electricity
finance or technical skills. connection may be upgraded
and separate meters
installed, though the original
water and sewerage lines
are used.
Table 4: Landlord types (Scheba & Turok, 2020:10-15).
The most visible indicator of the nature of landlord households are renting backyard structures
landlording is the typology of backyard structures. on a subsistence basis, though the fair number
In Lost City, around 80% of backyarder households of brick and cement structures might indicate that
are living in timber, plastic or metal structures more and more landlords are investing in
with around 20% living in structures made of brick backyard structures.
and cement. It would appear that the majority of
Landlord tenure types
Through the consultations, survey development and analysis a number of different tenure types were
documented for landlords and tenants. These include:
LANDLORD HOUSEHOLDS TENURE TYPE
General Definition Common expression in Lost City
Landlord owners Most property owners in Lost City built their own home or
Landlord households which own the property and live in bought the property on the private property market.
the main house. They rent out rooms and/or structures
and space in the yard.
Landlord tenants A few landlord tenants in Lost City rent the main house.
Landlord households which rent the main house This might be a main tenant who sublets to others living
themselves and sublet rooms and/or structures and on the property, or more likely a number of households
space in the yard. who all rent rooms and backyard structures from
the owner.Neighbourhood Profile / Lost City, Mitchells Plain / Landlords 18
LANDLORD HOUSEHOLDS TENURE TYPE
General Definition Common expression in Lost City
Landlord residents Some landlord households may have inherited their
Landlord households which have some other kind of homes from parents or bought the property but never
tenure and rent out room and/or structure and space in transferred formal title. Others may be where the owner
the yard. is absent or a relative who isn’t interested in taking
occupation. This was not common in Lost City as most
tenure was strictly through ownership.
Backyard landlords Mostly in order to make extra income, but it may be that
Landlords who own and rent the main house and/or an elderly parent has moved out back to allow a child or
structure and space in the yard and live in a structure in relation to live in the main house.
the yard themselves.
There were no backyard landlords surveyed in Lost City.
All of the landlords who lived on the property were staying
in the main house.
Table 5: Landlord households by tenure type.
Landlord tenure types
• Where the landlord doesn’t live on the property
89% Landlord owners and rents the main house or rooms in the main
9% Landlord tenants house and structures in the backyard directly
and separately.
2% Landlord residents
In Lost City, 1% of landlord household members
(8 out of 838) consider themselves to be
99 landlord households were enumerated, of tenants. These are possibly ‘hidden’ tenants in
which the vast majority owned the main house. landlord households - most often boarders, adult
This makes sense in Lost City, where almost all singles, couples and elderly members of landlord
of the houses have been built or purchased on households who pay rent of some kind, but
the private property market. consider themselves to be part of the household
or extended household.
Only 4 landlord households rent the main house
themselves and sublet rooms and the yard to As it stands, where these were deemed to be
backyarders. None were living in the backyard separate households they were captured as
themselves. There is fairly consistent pattern here tenants, but where these were deemed to be part
of landlord households living in the main house of the landlord household they may be rendered
and renting rooms, yard space or backyard invisible. This in large part comes down to how
structures to tenants. respondents considered what a household is,
which is always a subjective determination. The
There are; however, a number of complexities and survey did not impose a standard on what might be
anomalies in tenure which were not well captured considered a household and so respondents were
by the survey and might require further research. able to determine themselves what constituted a
These may include: household. A more standardised assessment might
have revealed more separate households with more
• Single intergenerational households living in tenants or less households with more members
multiple structures on the property. contributing financially - depending on the measure.19 Neighbourhood Profile / Lost City, Mitchells Plain / Landlords
Length of tenure LENGTH OF TENURE
Most landlord households have been Owner Resident Tenant Total %
living in Lost City for a fair length 1950s/60s 2 2 1.98%
amount of time. Most moved to Lost
1970s
City in the 1990s, with the number
tapering off in the 2000s and 2010s. 1980s 5 5 4.95%
This may be because the landlord 1990s 69 1 2 72 71.29%
households were fairly stable and 2000s 7 1 3 11 10.89%
there is less churn in houses being
2010s 6 4 10 9.90%
sold; because there are now no new
open plots of land available to 2020s 1 1 0.99%
build housing.
Table 6: Landlord length of tenure.
When asked directly, only 46 out of 125 (around 37%) effective landlords stated that they had benefited from
a housing subsidy with the remainder indicating that they had not or did not respond.
Landlord Demographic Profiles
Landlord demographic profiles are determined by the economic and social history
of the area (Bank, 2007).
More recently it has been commonly assumed that landlords are mostly women:
‘In older township areas the landlords are often predominantly female, retired
or close to retirement age, low income and long-term urban residents. By enabling
home owners to become small-scale landlords, backyard rental thus creates
valuable entrepreneurial opportunities’ (Tshangana, 2014:6).
The survey did not ask specifically who the landlord may not represent how the relationship
effective landlord might be in each household is managed. This is most obvious in the case
and determining this is problematic and may where a multi-generational household lives
not necessarily have been accurate. For example: in rooms and backyard structures. Rent does
not necessarily accrue to any one individual but
• The landlord may not reside on the property payment is made in kind towards overall
at all, which makes it hard to capture their household costs or pooled.
demographic details in a house to house • It is also possible for rent to accrue to multiple
neighbourhood survey. households in a property who all consider
• Depending on the particular circumstances, the themselves to be landlords of sorts. For example,
idea that one or more particular individuals is theNeighbourhood Profile / Lost City, Mitchells Plain / Landlords 20
where a boarder pays towards
rent to a backyarder tenant.
Gender and marital status4
Gender in landlord households is roughly evenly split. Across
It would be easier to determine who
all 390 members, 50% identify as women (and girls) and 50%
the landlord is technically based on
identify as men (and boys).
whose name title formally resides in
through a title deed. However, many
When it comes to effective landlords, there are a few more
families have owned a home for
women than men. Around 52% of landlords are women
years, but do not have a title deed.
compared to 47% who are men.
Sometimes, title is held technically
one member of the household but,
in effect, the person who actually EFFECTIVE LANDLORD GENDER
manages the tenant relationship is
another member of the household Owner Resident Tenant Total %
and both or either may consider
Women 60 2 4 66 0.53%
themselves the landlords. This is
Men 51 2 6 59 0.41%
most obvious in the case of an
elderly parent who owns the property 111 4 10 125 100%
but is frail and to a large extent
leaves management of the property Table 7: Effective landlord gender.
to a grown child or other relation.
There is an interesting divergence between male and female
As a result, for this analysis we have
landlords when it comes to marital status. The majority of
deemed a household member to be
male landlords are married (around 70% of men are married);
the effective landlord where they are
whereas more female landlords are likely to be single, divorced
living in the main house, own the
or separated, or a widow (between 16 - 27% in each case).
land, and are considered to be the
head of the household. This is an
informed assumption and of course EFFECTIVE LANDLORD MARITAL STATUS BY GENDER
this may not always be the case and
as a result demographic profiling Women Men Total
in this report should be taken
Cohabiting / living together as partners 3 1 4
as indicative.
Civil partnerships 3 3 6
While there are 101 landlord Traditional / Customary 3 3 6
households, there are 125 effective Widow / Widower 11 1 12
landlords; in many households
Never Married 12 3 15
there were two members who
both considered themselves to be Divorced / Separated 16 6 22
joint-heads (often because they are Married 18 42 60
married, but not always). In these
66 59 125
instances we have included them
both as landlords.
Table 8: Effective landlord marital status by gender.
4
Respondents were provided with the opportunity to select additional gender identities.21 Neighbourhood Profile / Lost City, Mitchells Plain / Landlords
Age EFFECTIVE LANDLORD AGE RANGE
Owner Resident Tenant Total %
It might be tempting to determine an
average age for landlords in Lost City. 20-29 4 1 1 6 4.80%
30-39 16 1 3 20 16%
50-59 yrs 40-49
50-59
6
65 2
1
3
7
70
5.60%
56%
predominant landlord age 60-69 18 1 19 15.20%
70-79 2 1 3 2.40%
Table 9 demonstrates that ages
111 4 10 125 100%
range widely from landlords in their
20s through to landlords nearing 80.
Table 9: Age range of landlords.
The youngest landlord is 26 while the
oldest is 73.
LANDLORD / LANDLORD HOUSEHOLD AGE
The average age for all members Owner Resident Tenant Total
across landlord households is 34
Landlords 52 41 48 52
years old, which makes sense when
you factor in youth and children. Landlord
34 28 28 34
households
Language and Table 10: Average effective landlord and landlord household age.
nationality LANDLORD HOUSEHOLD PRIMARY LANGUAGE
Owner Resident Tenant Total
A slim majority (about 60%) of
landlord households speak Afrikaans 59 3 62
Afrikaans as a primary language English 31 2 6 39
with the remainder speaking
English, save for two households 90 2 9 101
who speak isiXhosa.
Table 11: Landlord primary household language.
The vast majority (about 96%) of
EFFECTIVE LANDLORD NATIONALITY
effective landlords are South African
citizens and this is the same for
Owner Resident Tenant Total %
households in general.
Non South
1 1 0.26%
African
It would seem then that Lost City
is fairly homogenous culturally. Permanent
4 2 6 1.54%
Resident
This is not surprising and correlates
with both the tenant households Prefer not to
5 1 1 7 1.79%
and the overall demographics of answer
the suburb and is almost certainly South African 324 11 41 376 96.41%
due to the fact that Lost City was
334 14 42 390 100%
historically a Coloured suburb
and has remained so.
Table 12: Nationality of effective landlords.Neighbourhood Profile / Lost City, Mitchells Plain / Landlords 22
Household size LANDLORD HOUSEHOLD SIZE
Household Size Owner Resident Tenant Total %
Landlord households can range from
one to ten people, though most 1 9 9 8.91%
household are between three and 2 16 16 15.84%
four people and the overall average
3 22 2 24 23.76%
is closer to four people. When you
consider that the average number 4 19 2 21 20.79%
of people staying on the property is 5 8 4 12 11.88%
around nine people, it becomes clear 6 10 1 11 10.89%
that there are many more people
7 4 1 1 6 5.94%
living on properties in backyarder
households than in landlord houses. 8 1 1 0.99%
In fact there are double as many. 9 1 1 0.99%
90 2 9 101 100%
Table 13: Landlord household size.
Education EFFECTIVE LANDLORD EDUCATION
Owner Resident Tenant Total
The level of formal education
amongst landlords is low and Don’t know 4 4
extremely variable. A good number None 4 4
(around 36%) only received
Grade 1 3 3
education at the primary school
level. Of the remainder, almost Grade 2 3 3
everyone left school during Grade 3 1 1 2
secondary school with only (about Grade 4 2 2
10%) finishing matric. Two landlords
Grade 5 8 8
(around 2%) went on to secure a
part or full tertiary qualification. Grade 6 9 9
Grade 7 13 2 15
Grade 8 15 1 16
Grade 9 11 1 12
Grade 10 22 2 2 26
Grade 11 6 1 7
Grade 12 9 3 12
Part / Full tertiary 2 2
111 4 10 125
Table 14: Effective Landlord highest education level achieved.23 Neighbourhood Profile / Lost City, Mitchells Plain / Landlords
EFFECTIVE LANDLORD EDUCATION
Owner Resident Tenant Total %
Completed Grade 7 13 2 15 12%
Did not complete primary 25 1 1 27 22%
Completed Grade 12 9 3 12 10%
Did not complete 54 3 4 61 49%
None 4 4 3%
Tertiary 2 2 2%
Don’t know 4 4 3%
111 4 10 125 100%
Don’t know
4%
Tertiary
2%
None
4%
40%
Did not complete 75%
49%
30%
Completed Grade 12
8%
10%
Did not complete primary 25%
23%
20%
Completed Grade 7
12%
Owner Resident TenantNeighbourhood Profile / Lost City, Mitchells Plain / Landlords 24
Landlord Economic Status
There is a perception that subsistence landlords are mostly unemployed and rely
on rent from backyarding to get by: ‘Renting out a room in the back or even making
enough space for a tenant to erect their own structure, can enable a vital income
stream for those who own a house but are simply unable to find formal employment’
(Tshangana, 2014:6).
This goes hand in hand with the idea that where a landlord is working, the rental
income becomes surplus and is available for investing in the backyard housing
- a necessary step towards becoming what Scheba and Turok (2020) called a
homeowner landlord.
Employment
Unemployment is very serious amongst all residents living in
landlord households. Amongst effective landlords themselves, around
half or 52% are unemployed or looking for work. While only around 25%
are employed or self-employed.
EFFECTIVE LANDLORD EMPLOYMENT
Owner Resident Tenant Total %
Looking for work 2 2 1.60%
Other 5 5 4%
Self-employed 6 6 4.80%
Home keeper 8 8 6.40%
Retired 13 2 15 12%
Employed 19 3 3 25 20%
Unemployed 58 1 5 64 51.20%
111 4 10 125 100%
Table 15: Effective landlord employment status.25 Neighbourhood Profile / Lost City, Mitchells Plain / Landlords
When school learners are excluded,
LANDLORD HOUSEHOLD RESIDENTS EMPLOYMENT
around 50% of household members
are unemployed or looking for work. Owner Resident Tenant Total %
Tertiary student 3 3 0.77%
Household income Self-employed 7 1 8 2.05%
and source Looking for work 10 10 2.56%
Home keeper 14 14 3.59%
Most households have a combined Pre-school 11 3 3 17 4.36%
income of somewhere between Retired 19 2 21 5.38%
R800 and R7,500 per month with
Other 22 4 26 6.67%
60% of households earning
between R1,500 and R7,500 per Employed 43 4 10 57 14.62%
month. This compares well with Learner at school 60 2 7 69 17.69%
income across the City of Cape Unemployed 145 5 15 165 42.31%
Town, where the average
household income is roughly 334 14 42 390 100%
R4,775 per month
(Stats SA, 2011). Table 16: Landlord household residents’ employment status.
What is noticeable is how many
LANDLORD HOUSEHOLD INCOME
households are relying on grants to
get by across the board. Owner Resident Tenant Total %
No income 3 3 3%
Rental is considered a part of income
in a fair amount of households. R1 - R400 6 6 6%
Overall, this might indicate that R401 - R800 7 7 7%
landlording does contribute towards
R801 - R1,500 11 1 1 13 13%
income for households where
landlords are unemployed, though it R1,501 - R3,500 30 2 32 32%
is not necessarily dominant or the R3,501 - R7,500 25 1 4 30 30%
only source of income. R7,501 - R15,000 7 2 9 9%
R15,001 - R22,000 1 1 1%
90 2 9 101 100%
Table 17: Landlord household income.Neighbourhood Profile / Lost City, Mitchells Plain / Landlords 26
HOUSEHOLD INCOME BY SOURCE
Salary/ Own
Rent Grants Other Total %
Job Business
No income 0 0 0 0 0 0 0%
R1 - R400 1 0 2 1 2 5 4.95%
R401 - R800 2 1 3 1 0 11 10.89%
R801 - R1,500 2 2 1 8 0 13 12.87%
R1,501 - R3,500 7 2 5 19 1 34 33.66%
R3,501 - R7,500 14 2 2 12 1 31 30.69%
R7,501 - R15,000 7 1 0 1 0 9 8.91%
R15,001 - R22,000 1 0 0 0 0 3 2.97%
34 8 13 42 4 101 100%
Table 18: Landlord household sources of income (more than one option can be selected).
It would seem that most landlord households don’t rely on one source of income, combining multiple
sources, including rental income, as a strategy in the context of generally low wages and a high cost of
living. Landlording is not necessarily a strategy to secure income in the absence of employment - it
is part and parcel of getting by.
Disabilities DISABILITY
and grants Household
Landlords Total
members
Disabilities Hearing difficulty 1 1 2
Mental difficulty 7 2 9
59 out of 390 (nearly 15%) people
living in landlord households Seeing difficulty 2 2 4
considered themselves to have Communication /
1 1
a disability with a few having speech difficulty
multiple disabilities. Many selected Walking difficulty 7 9 16
a variety of conditions that were not
Other 10 17 27
listed including: arthritis, asthma
and autism, amputations, chronic 28 31 59
illnesses, epilepsy, high blood
pressure and kidney failure. Table 19: Effective landlord and landlord household disabilities.27 Neighbourhood Profile / Lost City, Mitchells Plain / Landlords
Grants LANDLORD HOUSEHOLD GRANTS
A significant number of people Owner Resident Tenant Total
receive a grant of some form or
Care Dependency
another in landlord households. Grant
2 2
Altogether 159 out of 390
Child Support Grant 71 5 11 87
(around 40%) of people receive
grants with the majority Disability Grant 39 1 2 42
receiving a child support grant Foster Child Grant 2 2
or disability grant.
Older Person’s Grant 23 1 1 25
War Veteran’s Grant 1 1
138 7 14 159
Expenditure Table 20: Landlord household grants.
Subsistence landlords simply do not make enough income to maintain or improve
backyarder structures (Tshangana, 2014) (Scheba and Turok, 2020).
Of those households which did LANDLORD HOUSEHOLD EXPENSES
respond, the breakdown of average
expenditure is listed in table 21. Owner Resident Tenant Total %
As expected food and groceries Food & groceries 1242 1600 1583 1281 27%
takes up 27% or nearly a third
Electricity 445 625 271 435 9%
of all expenditure.
Water 184 150 155 182 4%
Landlord households pay Sanitation 118 150 77 116 2%
surprisingly low amounts towards Refuse 74 0 85 75 2%
rent or bond payment, which takes
Rent or bond 436 1200 992 508 11%
just over 10% of expenditure - about
the same that household members Transport 522 1050 897 581 12%
spend on transport (12%). Clothing 279 0 363 286 6%
Services such as electricity,
Education 150 0 150 150 3%
water, refuse, rates and sanitation
combined account for 21% of Cell phone,
100 175 127 105 2%
airtime & data
expenditure.
Maintenance 121 250 100 123 3%
Stated expenditure confirms that Medical expenses
220 0 600 274 6%
money spent on maintenance of & insurance
structures is negligible - accounting Municipal rates 169 0 0 169 4%
for only 3% of expenditure and Other expenses 399 300 520 412 9%
between R100 and R250 per month.
4460 5500 5919 4697 100%
Table 21: Average household expenses by tenure type.Neighbourhood Profile / Lost City, Mitchells Plain / Landlords 28
Landlord household income
R15,001 - R22,000 1%
R7,501 - R15,000 9%
R3,501 - R7,500 30%
R1,501 - R3,500 32%
R801 - R1,500 13%
R401 - R800 7%
R1 - R400 6%
No income 3%
Landlord household expenditure
Food and groceries 27%
Electricity 9%
Water 4%
Sanitation 2%
Refuse 2%
Rent or bond 11%
Transport 12%
Clothing 6%
Education 3%
Cell phone, airtime and data 2%
Maintenance 3%
Medical expenses & insurance 6%
Municipal rates 4%
Other expenses 9%
It is important to note that there is a discrepancy between reported income and expenditure. Essentially, what we want to
take from this is an indication of what the top three expenditure items are, rather than actual amounts.29 Neighbourhood Profile / Lost City, Mitchells Plain / Tenants
Typical Landlord
A typical landlord in Lost City is likely to be an Afrikaans speaking South African in their 50s but could be
a woman or a man. They almost certainly moved to the area in the 1990s. If they are a man they are likely
to be married, but if they are a woman they could equally be single, divorced or separated or widowed. They
live with three others in the household on average. They would have finished some years of secondary
school but are unlikely to have matriculated and are currently unemployed. Apart from rent, the household
may derive an income from wages and either a child support or a disability grant.
TENANTS
Tenant
Tenure In general, a backyard tenant is defined as, ‘A person
occupying a backyard residential unit under some type of
rental agreement with the main homeowner which may or
Types of tenants may not include monetary payment for the right to occupy
in the backyard the unit, and may or may not be set out in a formal written
sector have not been agreement’ (Tshangana, 2020:8).
comprehensively
designated in public
policy, nor in The survey recognised three forms of tenure for tenants living in
research to date. backyards, including an option for ‘none of the above’. Through the
enumeration and further verification, a fourth tenure type was
identified as common - tenants living in the main house. We describe
all four tenure types in table 22.
Altogether there were 131 tenant households enumerated. Only 11
households, or less than 10% were living as tenants in the main house.
Most tenants are either staying in structures provided by the landlord
(50 out of 131 or 38%) or own their own structures (39 out of 131 or 29%).
There is a surprisingly large number of tenants households living under
other tenure arrangements - 31 households in total.Neighbourhood Profile / Lost City, Mitchells Plain / Tenants 30
Tenant tenure types
TENANT HOUSEHOLDS TENURE TYPE
General Definition Common expression in Lost City
Backyard owners This is most often a timber wendy house, but can be
Tenant households which own their own structure and whatever materials they can afford. Tenants are unlikely
rent space in the yard from the landlord. to build in brick and cement on the landlord’s property,
but there are instances where family members might
pay for the materials for a more permanent backyard
structure. These are tenants who own their structure and
pay to rent space in the yard. If they ever move they can
take the structure with them.
Backyard tenants This can be a temporary structure or a more permanent
Tenant households which rent both the structure and the brick and cement structure.
space in the yard.
Table 22: Tenant households by tenure type.
Backyard residents There are a range of households living in yards who have
Households which live in a structure in the yard under unique tenure arrangements with the landlord and don’t
some other form tenure. generally pay rent. For example, the landlord may be
offering a household shelter on a charitable basis, or is
allowing a parent, child or other relation to live on their
property rent free.
Main house tenants Where the landlord lives in the main house these could
Tenants which rent a room or rooms in the main house rightly be considered boarders. In other instances, the
directly from the landlord. landlord isn’t living on the property and the whole main
house is rented to tenants households. These tenant
households generally occupy a room each, though some
may occupy more than one room.
Tenant tenure types
Length of tenure 30% Backyard owners
Much like landlord households, 38.1% Backyard tenants
tenant household only really began 23.6% Backyard residents
arriving in Lost City in the 1990s. 8.3% Main house tenants
There are one or two households
who dated their tenure earlier, but TENANT HOUSEHOLD LENGTH OF TENURE
these are unlikely to have lived in
Lost City itself as the area did not Main House
Owner Resident Tenant Total %
yet exist - they may have moved into Tenant
Mitchells Plain more generally.
Table 23: Tenant length of tenure.
1960s 1 1 0.76%
From the 1990s to present between 1970s
40 and 60 households moved
1980s 1 1 0.76%
into the area per decade amongst
enumerated households. The 1990s 9 13 15 6 43 32.82%
majority moved in the 2010s (within 2000s 5 2 5 1 13 9.92%
the past decade), but 57/131 have
2010s 22 13 27 4 66 50.38%
lived in the neighbourhood for about
2020s 2 2 3 7 5.34%
20 years.31 Neighbourhood Profile / Lost City, Mitchells Plain / Tenants
Tenant Demographic Profiles
Much like with landlord households, the survey did household. Though of course multiple people in a
not ask respondents to name the effective tenant. tenant households may be contributing towards
We have used the demographic profile of the head the rent or different people may be responsible at
of the tenant household and/or the person who different times depending on who may have work.
owns the structure in the yard. Some households deem two people to the joint
heads and in these instances we have included the
This is likely to be the person who is primarily details for both as effective tenants. Accordingly,
responsible for honouring the rental agreement, there were 189 effective tenants across 158 tenant
even where this is verbal, and paying rent for the households surveyed.
Gender and marital status
Female-headed households and single working-age men are common. Backyard
tenants may be small households of between 1 and 2 people (Tshangana, 2014:5).
Amongst tenants, a slightly
EFFECTIVE TENANT GENDER
majority identify as men
where they are the head of Main House
Owner Resident Tenant Total %
the household. Tenant
Women 25 12 25 7 69 41.57%
Over half of all tenants are
married, which is higher than Men 24 22 44 7 97 58.43%
the other areas enumerated 49 34 69 14 166 100%
by DAG: Maitland Garden
Village, Eerste River and Table 24: Effective tenant gender.
Freedom Park.
EFFECTIVE TENANT GENDER
Owner Resident Tenant Main House Tenant Total
Table 25: Effective tenant marital status.
Civil partnership 1 2 1 4
Widow / Widower 3 5 1 9
Traditional / Customary 4 1 3 2 10
Divorced / Separated 2 3 7 12
Cohabiting / living together as partners 3 4 7 1 15
Never married 5 3 13 21
Married 31 18 36 10 95
49 34 69 14 166You can also read