Harpenden Neighbourhood Plan Baseline Report - on behalf of Harpenden Town Council
←
→
Page content transcription
If your browser does not render page correctly, please read the page content below
Harpenden Neighbourhood Plan

Baseline Report
on behalf of Harpenden Town Council
May 2017
Harpenden Neighbourhood Plan

          Baseline Report

on behalf of Harpenden Town Council

            May 2017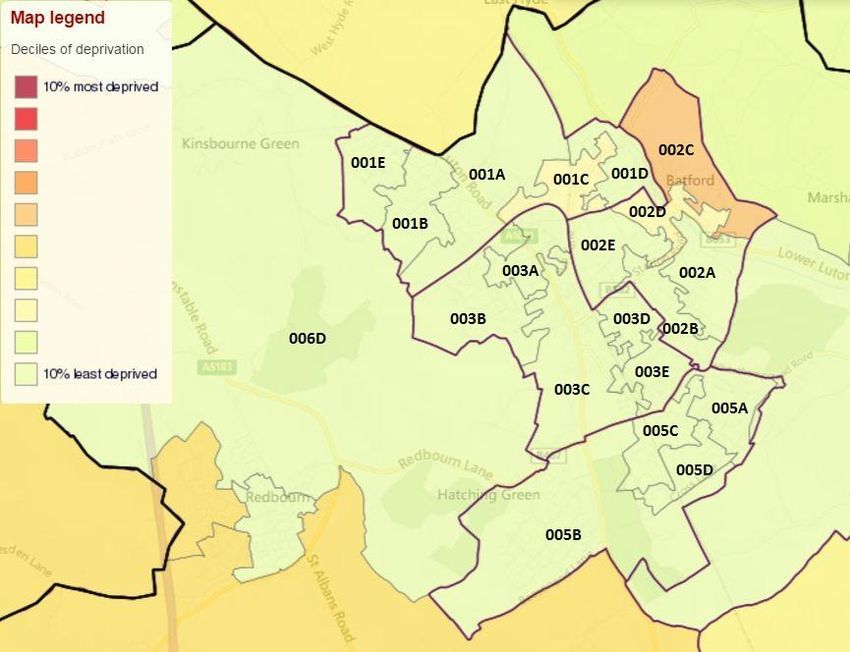
Harpenden Neighbourhood Plan Baseline Report for Harpenden Town Council

Contents

1.0     Purpose of the document .......................................................................................................... 5
2.0     Introduction to the HNP Area .................................................................................................... 7
3.0     Planning Policy Context ............................................................................................................ 9
4.0     Population and People ............................................................................................................ 14
5.0     Housing ................................................................................................................................... 19
6.0     Employment............................................................................................................................. 24
7.0     Retail ....................................................................................................................................... 28
8.0     Transport ................................................................................................................................. 33
9.0     Social Infrastructure and Community Facilities ....................................................................... 42
10.0    Natural Environment ................................................................................................................ 49
11.0    Heritage and Design ................................................................................................................ 52
12.0    Summary ................................................................................................................................. 57

                                                                                                                                                Page 4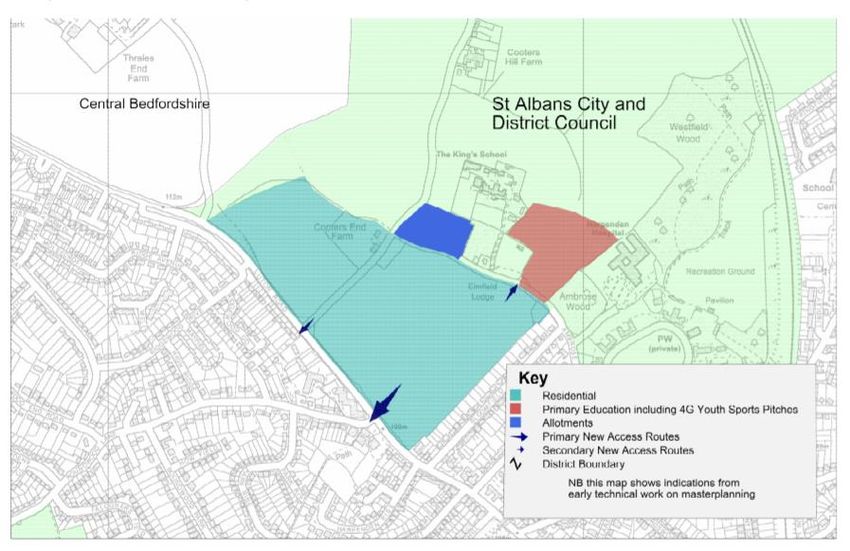
Harpenden Neighbourhood Plan Baseline Report for Harpenden Town Council

1.0     Purpose of the document

1.1     This Baseline Report identifies the key social, environmental and economic characteristics of
        the Harpenden Neighbourhood Plan (HNP) Area, providing a shared resource and reference
        point for all parties contributing to the preparation of the HNP. The Baseline Report is an
        evolving document, which may be reviewed in response to new evidence.

1.2     The Baseline Report brings together and summarises information from a range of
        background reports and evidence based studies. These primarily comprise documents
        produced by or for the local planning authority (LPA)1, St Albans City and District Council
        (SADC), to inform the preparation of its development plan documents. It also has regard to
        other reports and research undertaken by or for Hertfordshire County Council (HCC), the
        Hertfordshire Local Enterprise Partnership (HLEP) or directly by or for Harpenden Town
        Council (HTC). It also considers national statistics such as Census data.

1.3     A Neighbourhood Plan is a planning policy document that sets out a framework for
        development at a local scale, sitting below planning policy prepared by a LPA.
        Neighbourhood planning was introduced by the Localism Act, which came into force in 2011.
        Since its inception over 200 Neighbourhood Plans have been adopted.

1.4     Neighbourhood Plans give local people a greater say in the future of their communities by
        creating their own statutory planning policy, which dictates how development will take place
        in their neighbourhood for the foreseeable future. They must conform with strategic planning
        policy that ‘sits above’ them, at a national and LPA level.

1.5     Neighbourhood Plans are related to land use and development quality and do not have to
        power to allocate funds or make decisions outside of the remit of land use planning.

1.6     As the HNP develops, a key challenge will be the need to reflect the aspirations of local
        residents and stakeholders, while taking into account the requirements set nationally and by
        SADC.

1.7     Neighbourhood Plans do not have the power to prevent housing or employment growth when
        a need has been identified by the LPA. The HNP can either allocate sites to meet this need,
        or resolve to not allocate sites and leave the decision of where to accommodate growth to
        the LPA. The HNP can also contain policies that influence the type of development that

1SADC is regarded as the LPA for the purposes of this document, although HCC does have some
planning powers with regards to minerals and waste and its own applications for service
development such as schools, fire stations and new road infrastructure such as bypasses

                                                                                                 Page 5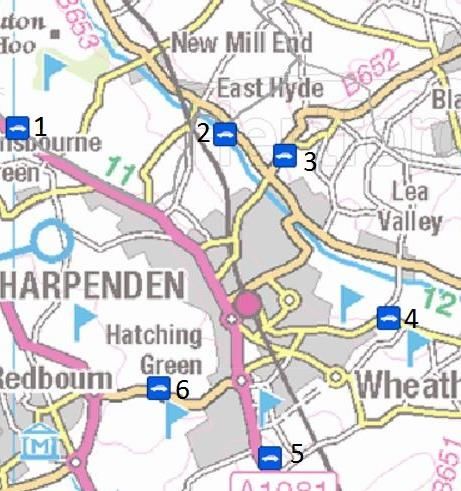
Harpenden Neighbourhood Plan Baseline Report for Harpenden Town Council
takes place in Harpenden, what it looks like and the mix of potential uses that are to be
included.
1.8 On 22 December 2015, SADC formally agreed the HNP Area boundary, which reflects the
combined boundaries of Harpenden Town Parish and Harpenden Rural Parish.
1.9 In December 2016, HTC appointed Nexus Planning to assist with the preparation of the
HNP.
1.10 Once a draft HNP is prepared, it will be submitted to SADC for review for compliance with its
strategic policies before an independent Planning Inspector examines it and, if approved, it
undergoes a Referendum. If the plan is supported by a majority of residents, it will be
adopted and form part of the SADC development plan for applications in the HNP boundary.
1.11 The remainder of the Baseline Report is set out as follows:
Section 2: Introduction to the HNP Area
Section 3: Planning Policy Context
Section 4: Population and People
Section 5: Housing
Section 6: Employment
Section 7: Retail
Section 8: Transport
Section 9: Social Infrastructure and Community Facilities
Section 10: Natural Environment
Section 11: Heritage and Design
Section 12: Summary
Page 6
Harpenden Neighbourhood Plan Baseline Report for Harpenden Town Council

2.0     Introduction to the HNP Area

        Location and role of the area

2.1     The HNP Area is located in Hertfordshire, south of the border with Bedfordshire. It is
        comprised of two parishes, which are Harpenden Town Parish, where most of the population
        reside, and Harpenden Rural Parish, which borders Harpenden Town to the west and north-
        west. The two parishes lie within the boundaries of SADC, however, closely relate to the
        boundaries of Central Bedfordshire, North Hertfordshire, Luton Borough and Dacorum LPAs.

2.2     Harpenden is a town with a historic core, reflecting its heritage as a small village for a
        number of centuries before its expansion in the late 19th Century. This core predominantly
        extends to each side of the High Street, which bisects the town, with a number of Listed
        Buildings on each side. Many of these were built in the 17th, 18th and 19th Centuries,
        however, there are some older buildings, dating back to the 15th and 16th Centuries. Much
        of the population of Harpenden live in the residential areas outside of the Town Centre,
        which were mostly developed during the 20th Century.

2.3     Harpenden Rural Parish is sparsely populated and is predominantly undeveloped, but
        includes Kinsbourne Green Common, a small hamlet.

2.4     Harpenden is near to a number of larger towns. It lies almost equidistant between Luton
        (north) and St Albans (south), around five miles from each. It is also close to Hemel
        Hempstead, Hitchin and Welwyn Garden City.

2.5     Harpenden is predominantly a commuter town, with a small number of employment sites for
        a town of its population size. A notable employment site is Rothamsted Research, founded
        in 1843, which is a world leading agricultural research establishment. The major destination
        for commuters is London, with regular City Thameslink trains from Harpenden Station taking
        around 30 minutes to London St Pancras Station and 40 minutes to Blackfriars Station.
        Harpenden is also located around five miles from London Luton Airport, which is around 20
        minutes by train, and is close to the M1, M25 and A1(M). People also commute out of
        Harpenden by car to destinations such as St Albans, Milton Keynes, Hatfield and Hemel
        Hempstead.

2.6     Public green spaces and trees are prominent throughout the town, particularly in its historic
        core, with Harpenden Common extending in to the High Street, plus Church Green and

                                                                                                     Page 7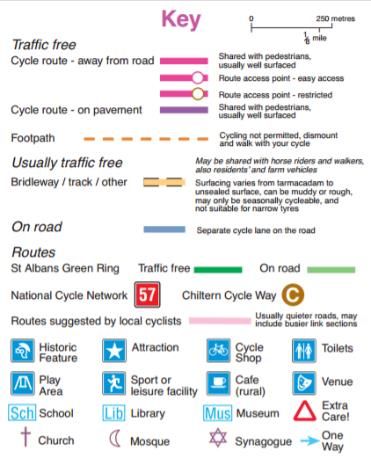
Harpenden Neighbourhood Plan Baseline Report for Harpenden Town Council

        Leyton Green. This results in a town with a low-density and green character that responds
        to its rural surroundings.

2.7     The rural land within the HNP Area, mostly within Harpenden Rural Parish, is predominantly
        in agricultural use. This is with the exception of Harpenden Golf Course, south-west of the
        town, and the east part of Redbourn Golf Club. The Green Belt surrounds Harpenden,
        which has protected this land from development.

                                                                                               Page 8
Harpenden Neighbourhood Plan Baseline Report for Harpenden Town Council
3.0 Planning Policy Context
Status of planning policy and guidance
Neighbourhood Plans must conform to national planning policy and guidance as well as the
development plan of the LPA. Therefore, the status of planning policy at SADC is of
importance to the HNP.
The table below sets out national planning policy and guidance and adopted and emerging
planning policy documents at SADC.
Title Purpose of the document Date of adoption/ emerging
timeline
National Planning Policy and Guidance
National Planning The NPPF is the overarching Adopted in 2012.
Policy Framework planning policy framework in
(NPPF)2 England. It sets out a broad
agenda for decision taking and plan
making.
National Planning NPPG supports the NPPF with The Government frequently
Practice more detailed guidance, responding update NPPG.
Guidance frequently to developments in the
(NPPG)3 planning system.
Local Planning Policy and Guidance
Adopted Local This comprises the adopted Adopted in 1994, with a
Plan Review4 planning policy framework. Given number of policies ‘saved’ in
its age, the NPPF resolves to apply 2007.
weight to its policies in accordance
with conformity to the NPPF (NPPF
Paragraph 215). For example, if a
policy does not conform to the
NPPF, it is no longer acceptable to
apply weight to it.
2
HM Government (2012) National Planning Policy Framework. Available at:
https://www.gov.uk/government/publications/national-planning-policy-framework--2
3
HM Government (regularly updated) National Planning Practice Guidance. Available at:
https://www.gov.uk/government/collections/planning-practice-guidance
4
St Albans City and District Council (1994, saved 2007) Adopted Local Plan Review. Available at:
http://www.stalbans.gov.uk/planning/Planningpolicy/currentadoptedlocalplan.aspx
Page 9Harpenden Neighbourhood Plan Baseline Report for Harpenden Town Council
Emerging The SLP contains strategic policies The SLP is prepared in final
Strategic Local and major site allocations in the draft form and pre-submission
Plan (SLP)5 district. It is the first part of a new consultation (Regulation 19) is
Local Plan. complete. It would normally
proceed to examination after
this; however, the Inspector
has postponed this due to an
alleged failure to comply with
the legal duty to cooperate
with neighbouring authorities.
SADC intends to seek Judicial
Review of that decision. No
timeline is currently available.
Emerging The DLP supports the SLP with The DLP has undergone an
Detailed Local detailed policies related to issues and options
Plan (DLP)6 development management and the consultation (Regulation 18).
masterplans of site allocations The latest timeline suggests
identified in the SLP. It is the that pre-submission
second part of the new Local Plan. consultation is due in early
2017, with submission in
Summer 2017, examination in
Autumn/Winter 2017 and
adoption in Spring 2018.
5 St Albans City and District Council (2016) Emerging Strategic Local Plan (Regulation 19 draft) Available at: http://stalbans-
consult.limehouse.co.uk/portal/planning_policy/strategic_local_plan_2016/slp2016.
6 St Albans City and District Council (2016) Emerging Detailed Local Plan (Regulation 19 draft) Available at: http://stalbans-
consult.limehouse.co.uk/portal/planning_policy/dlpreg18/dlp
Page 10Harpenden Neighbourhood Plan Baseline Report for Harpenden Town Council
National policy requirements
At the heart of the NPPF is a presumption in favour of sustainable development. The effects
of this for Neighbourhood Plan makers are set out at Paragraph 16 and require
Neighbourhood Plans to:
Support the strategic development need identified in Local Plans, including those set
out in housing and economic development policies;
Plan positively to shape and direct local development in parts of the neighbourhood
outside of those covered in the strategic policies of the Local Plan; and
Identify opportunities to use Neighbourhood Development Orders to enable
development consistent with the Neighbourhood Plan to proceed.
Paragraph 58 expects Neighbourhood Plans to set out policies relating to the quality of
development locally, based on objectives relating to future development needs.
Paragraph 76 encourages local communities to designate Local Green Spaces in
Neighbourhood Plans, protecting land from development other than in very special
circumstances.
Paragraphs 183 – 185 specifically relate to neighbourhood planning. The paragraphs make
clear that:
Neighbourhood Plan policies are used to determine decisions on planning
applications (183);
Neighbourhood Plans must conform with strategic policies of the LPA’s Local Plan;
and,
Once a Neighbourhood Plan is in force, where there is a conflict between its policies
and non-strategic policies of the LPAs Local Plan (e.g. site allocations or detailed
policies), policies of the Neighbourhood Plan take a precedence.
NPPG contains a chapter of guidance related to the detailed practice of preparing and
implementing Neighbourhood Plans.
Page 11Harpenden Neighbourhood Plan Baseline Report for Harpenden Town Council
Local planning policy
While the NPPF considers the Local Plan Review (1994) to be out of date, it is worth noting
that the Settlement Strategy identifies Harpenden as the second largest town in the District,
after St Albans. It states that development is generally to be concentrated in those
locations;
The submission draft of the SLP sets out a number of strategic policies that have a bearing
on the development of the HNP, particularly once adopted. These include the following
noteworthy emerging policies:
Emerging Policy SLP1 (‘Spatial Strategy and Development Strategy’), which sets out
how Harpenden is a main urban settlement excluded from the Green Belt. It
considers these locations to be the most sustainable for development and
encourages higher density development, so as it respects local character, in order to
protect the Green Belt. Emerging Policy SP1 identifies north-west Harpenden as a
‘broad location’ for principally housing-led development of approximately 500
dwellings;
Emerging Policy SLP2 (‘Metropolitan Green Belt’), which sets out that the SLP will
release the ‘broad locations’ from the Green Belt and how further release may be
included in the DLP;
Emerging Policy SLP13c (‘North West Harpenden Broad Location – Principally
Housing’), sets out how the Council will seek to deliver circa 500 homes and related
infrastructure including recreation/open space, a one-form entry primary school and
sustainable transport upgrades at North West Harpenden;
Emerging Policy SLP17 (‘Rothamsted Research’), which supports a redevelopment
of Rothamsted Research, including a possible extension, to meet the future needs of
the centre;
Emerging Policy SLP18 (‘Retail Hierarchy of Centres’), which sets out how
Harpenden is a Town Centre, subservient to St Albans as the major Town Centre,
yet serving the northern part of the District with an offer comprised on food/grocery
Page 12Harpenden Neighbourhood Plan Baseline Report for Harpenden Town Council
shopping and a diverse mix of independent retailers, supported by cafes,
restaurants, leisure, cultural and other uses; and
Emerging Policy SLP21 (‘Provision and Retention of Cultural Facilities’), which sets
out support for the redevelopment of Harpenden Public Hall plus the redevelopment
of leisure and cultural facilities in Rothamsted Park.
Page 13Harpenden Neighbourhood Plan Baseline Report for Harpenden Town Council
4.0 Population and People
4.1 This section sets out the current socio-demographic background to the HNP. Unless stated,
statistics in this section relate to the entire HNP Area.
Population
4.2 The 2011 Census7 established that there were 29,853 residents in the HNP Area, comprised
of 29,448 residents from Harpenden Town Parish and 405 residents from Harpenden Rural
Parish. Harpenden Town Parish witnessed a population increase of 6% (1,762 persons)
since the 2001 Census. The Harpenden Rural population decreased by 4% over the same
period (17 persons). Residents in the HNP Area make up 21% of the SADC population.
4.3 Figure 1 sets out how the population of Harpenden Town Parish has grown since 1921 (with
the exception of 1941 when there was no Census). It shows how population growth was
rapid in the four post-war decades and has steadily increased since (albeit falling slightly
from 1981 to 1991).
Figure 1. Harpenden Population by Census Year
2011
2001
1991
1981
1971
1961
1951
1941
1931
1921
0 5,000 10,000 15,000 20,000 25,000 30,000 35,000
7 HM Government (2001 and 2011) UK Census. Available at: www.neighbourhood.statistics.gov.uk and www.nomisweb.co.uk/
Page 14Harpenden Neighbourhood Plan Baseline Report for Harpenden Town Council
Demographics
4.4 The 2011 Census found that 51% of residents are female, which is very similar to the SADC
and national average.
4.5 Figure 2 outlines the breakdown of the Harpenden Rural and Harpenden Town populations
by age group, in comparison to SADC and national averages, at the time of the 2001 and
2011 Censuses. Key findings include:
In 2011, both Parishes had a notably larger population aged 0-17 than the SADC
and national averages. This age group has grown across the HNP Area since 2001;
In 2011, both Parishes have a low number of residents in the 18-29 age bracket
compared to SADC and national averages, which has reduced since 2001.
As of 2011, Harpenden Rural has more residents aged 45-59 and less aged 75+
than Harpenden Town, SADC and England; and
The remainder of the age ranges across each area are broadly similar.
Figure 2. Comparison of 2001 and 2011 Populations by Age Group
100%
90%
80%
70%
60%
Percent
50%
40%
30%
20%
10%
0%
Harpenden Harpenden Harpenden Harpenden St Albans St Albans England England
Rural 2001 Rural 2011 Town 2001 Town 2011 District District 2001 2011
2001 2011
0-17 18-29 30-44 45-59 60-74 75+
Age group
4.6 Figure 3 sets out the ethnic background of residents in Harpenden Town and Harpenden
Rural in comparison to SADC and the national composition. Harpenden Town and
Harpenden Rural are less ethnically diverse than the remainder of SADC and England.
Figure 3. Comparison of 2011 Population by Ethnic Group
Page 15Harpenden Neighbourhood Plan Baseline Report for Harpenden Town Council
England
St Albans District
Harpenden Town
Harpenden Rural
0% 10% 20% 30% 40% 50% 60% 70% 80% 90% 100%
White British/Irish White Other
Mixed Race Asian (inc. South/East/British)
Black (inc African/Caribbean/British) Other (inc. Arab)
Deprivation
4.7 The Office for National Statistics measures deprivation at Lower Super Output Area (LSOA)
level8. Deprivation is measured based on seven domains, from which an ‘Index of Multiple
Deprivation (IMD) is determined. The domains are:
Income deprivation (percentage of low income population);
Employment deprivation (percentage of people involuntarily unemployed);
Education, skills and training deprivation (percentage of people without formal
qualifications or low-level qualifications);
Health deprivation and disability (morbidity, disability and premature mortality)
Crime;
Barriers to housing and services; and
Living environment deprivation (quality of houses, air quality, road traffic accidents);
4.8 Harpenden Town is comprised of 16 LSOAs and Harpenden Rural forms part of a larger
LSOA incorporating the northern part of Redbourn Parish (mostly rural). The latest
measures of deprivation were released by the Department for Communities and Local
Government (DCLG) in 2015 and are shown in Figure 4.
8 HM Government (2015). Indices of Multiple Deprivation. Available at: http://dclgapps.communities.gov.uk/imd/idmap.html
Page 16Harpenden Neighbourhood Plan Baseline Report for Harpenden Town Council
Figure 4. LSOAs in HNP Area by Decile of Deprivation.
Please note that this plan has an underlay map, which results in certain areas that appear to be darker green. This
is not relevant to the decile of deprivation measurement.
4.9 Harpenden Town and Harpenden Rural generally have very low levels of deprivation, with all
but three LSOAs in the 10% least deprived LSOAs in England. LSOAs 001C and 002D, to
the North East of Harpenden, are in the 30% least deprived areas nationally and 002C, to the
furthest North East part of Harpenden (comprising Batford), is in the 50% least deprived parts
of England. While no areas are below the average level of deprivation nationally, it is worth
noting that these three areas, particularly 002C, experience some deprivation and this is
likely to be a key consideration for the Neighbourhood Plan.
4.10 It is possible to understand further deprivation data through looking at economy data from
Herts Insight (HCC)9, which supports its Children’s Centre programme. This data is arranged
by LSOA and includes the percentage of under five year olds living in poverty and the
number of Benefits Claimants, which are shown at Figures 5 and 6.
9
HCC (2017) Children’s Centre Economy Selection – Harpenden and Southdown. Available at:
https://www.hertfordshire.gov.uk/microsites/herts-insight/information-for-childrens-centres.aspx
Page 17Harpenden Neighbourhood Plan Baseline Report for Harpenden Town Council
Figure 5. Percentage of under five year olds living in poverty by LSOA
100
90
80
70
60
50
40
30
20
10
0
1A 1B 1C 1D 1E 2A 2B 2C 2D 2E 3A 3B 3C 3D 3E 5A 5B 5C 5D
2013 2014
Figure 6. Number of Benefits Claimants by LSOA (Q3 2015)
140
125
120
100
80
65
60 60
60 55
40
40 35 35
30
25 25 25
20 20
20 15 15 15 15
10
0
1A 1B 1C 1D 1E 2A 2B 2C 2D 2E 3A 3B 3C 3D 3E 5A 5B 5C 5D
Number of claimants
4.11 Figures 5 and 6 show that some pockets of deprivation exist within some of the LSOAs
regarded as being within the least deprived 10% of LSOAs nationally. This includes a
relatively high amount of child poverty in 003C and a higher claimant count in parts of south
Harpenden (005A, 005B and 005C).
Page 18Harpenden Neighbourhood Plan Baseline Report for Harpenden Town Council
5.0 Housing
5.1 This section sets out the current housing circumstances in the HNP Area and a summary of
future growth requirements.
Current Housing Stock
5.2 Figure 7 shows the composition of the housing stock in Harpenden Town and Harpenden
Rural at the time of the 2011 Census. The housing stock in Harpenden Town is primarily
composed of medium to large sized detached and semi-detached housing set in low-density
neighbourhoods, with some denser areas of smaller unit sizes. Harpenden Rural Parish is
typified by large detached houses set in spacious private gardens. The amount of detached
housing is notably higher in the HNP Area than in SADC and across England. The current
stock of housing, in terms of size and quality, has contributed to Harpenden’s status as a
desirable place to live.
Figure 7. Comparison of 2011 Housing Stock by Type
Harpenden Rural
Harpenden Town
St Albans District
England
0% 10% 20% 30% 40% 50% 60% 70% 80% 90% 100%
Detached housing Semi-detached housing
Terraced housing Flat, masionette or apartment
Mobile home
5.3 House prices in the HNP Area reflect its status as a sought after place to live. According to
Rightmove data10, the average sale price in Harpenden in 2016 was £723,391. This is
considerably higher than the average house price in SADC during 2016, which was
10 Right Move (regularly updated) House Price Data. Available at: http://www.rightmove.co.uk/house-prices.html
Page 19Harpenden Neighbourhood Plan Baseline Report for Harpenden Town Council
£508,273, and vastly higher than the average house price in England over that period, which
was £228,813.
5.4 LPAs are required to prepare a Strategic Housing Market Assessment (SHMA), which
analyses the status of the local housing market with a view to determining future need, in
order to inform the preparation of planning policy. The latest comprehensive SHMA was
produced in 201311, but there have been a number of update addendums released since.
The SHMA notes that Harpenden is a ‘house price hotspot’ within SADC, which is itself an
area with house prices higher than in neighbouring districts, particularly those to the north.
5.5 The SHMA details that the private rented sector is relatively small in the HNP Area. Less
than 10% of residents in Harpenden Rural rent privately and the figures for Harpenden (by
LSOA) range from less than 10% to 30% of residents.
5.6 Housing growth in the HNP Area has been steady in recent years, but has fallen below
SADC and national rates. This may be in part due to the area being constrained by the
Green Belt. Between the 2001 and 2011 Census, the number of dwellings in Harpenden
Rural grew by 6.8% (from 147 to 157) and the number of dwellings in Harpenden Town grew
by 3.3% (from 11,225 to 11,600). In comparison, the number of dwellings grew by 7.8% in
SADC and 8% in England.
Overall Housing Need
5.7 A requirement of the SHMA is to provide an objective assessment of need (OAN), from
which the housing target of a Local Plan is established. This should align with the emerging
Local Plan period. The SHMA sets out an OAN of 11,882 new homes in SADC between
2011 and 2031 (586 per annum). The submission version of the SLP sets a housing target
of 8,720 new homes between 2011 and 2031 (436 per annum). This is less than the OAN
figure; however, the Council regards this to be a realistically deliverable target over the plan
period in a District where most undeveloped land is within the Green Belt.
5.8 SADC is not required to determine housing need for each settlement within its boundaries,
as it will decide on an appropriate strategy for meeting this need (i.e. where new
development should be located in the borough) as it develops its strategic planning policies.
11St Albans City and District Council (2013) Independent Assessment of Housing Needs and Strategic Housing Market
Assessment: Final Report. Available at: http://www.stalbans.gov.uk/Images/SP_EB_SHMA_tcm15-39883.pdf
Page 20Harpenden Neighbourhood Plan Baseline Report for Harpenden Town Council
Housing Tenure Need
5.9 In addition to determining the OAN in the District, LPAs are also required to determine what
breakdown of tenure is required in order to meet the financial circumstances of those in need
of housing. This exercise should determine how many of the new homes required to meet
the OAN should be affordable, either available through social/affordable rent or ‘intermediate’
housing, designed to help people on to the property ladder, and how many new homes
should be ‘market’, those available on the open market.
5.10 The SHMA, at Table 6.5, sets out a need for 56.82% of the OAN (equivalent to 6,662 homes)
to be affordable homes available through social rent, with an additional 8.27% of the OAN
(970 homes) available through affordable rent and 3.75% (440 homes) through shared
ownership (intermediate). This represents a significant proportion of the OAN in the District,
with 68.85% of new homes required to be affordable, including intermediate.
5.11 Table 6.5 further states a need for 15.24% of the OAN (1,787 homes) to be available through
the private rental sector and 15.91% of the OAN (1,865) to be available for owner-occupiers.
Together these comprise 31.15% of new homes to be available on the open market.
5.12 Emerging SLP Policy SLP9 (‘Affordable Housing’) requires new residential development to
provide 40% affordable housing, subject to viability. This is a greater requirement than the
adopted development plan. The policy requires 60% of the affordable housing to be social
or affordable rented and 40% should be intermediate housing, such as shared ownership (as
detailed in the SHMA).
Housing Mix Need
5.13 The final issue the SHMA must consider is housing mix, which considers issues such as
what size dwellings (in number of bedrooms) are required for each tenure and whether there
is a need for specialist housing, such as housing for over 65s.
5.14 The SHMA sets out an overall need for 21.49% (2,520) new dwellings to be one-bed,
19.87% (2,329) to be two-bed, 51.34% (6,020) to be three-bed and 7.3% (855) to be four or
more bedrooms. The SHMA regards that this breakdown applies exactly to all tenures,
across affordable, intermediate and market housing.
5.15 The SHMA identifies that to 2031 there is a need for 3,240 homes across the District for
older people, which is part of the overall OAN as detailed above. This is comprised of a pre-
2011 need for 2,160 units and an anticipated need for 1,080 units arising during the period of
2011 – 2031. The overall need breaks down to a need for 1,378 ‘designated’ older person
Page 21Harpenden Neighbourhood Plan Baseline Report for Harpenden Town Council
dwellings (i.e. older person housing without individual support/care), 657 sheltered units and
1,205 extra-care units. There is no indication of how these break down in terms of tenure or
size or in terms of the HNP Area.
5.16 The emerging SLP (Policy SP10 – ‘Housing Size, Type and Mix’) refers to the SHMA for
determining the mix at allocated sites, and elsewhere it expects proposals to take into
account the existing pattern of development, while considering that smaller housing,
including one and two bed flats, is a priority.
Housing Delivery and Site Allocations
5.17 The emerging SLP (Policy SLP11 – ‘Density of Housing Development’) expects housing
density to be 40 dwellings per hectare in allocated sites. It is more flexible in other locations,
where it expects density to be appropriate in the context of the local area.
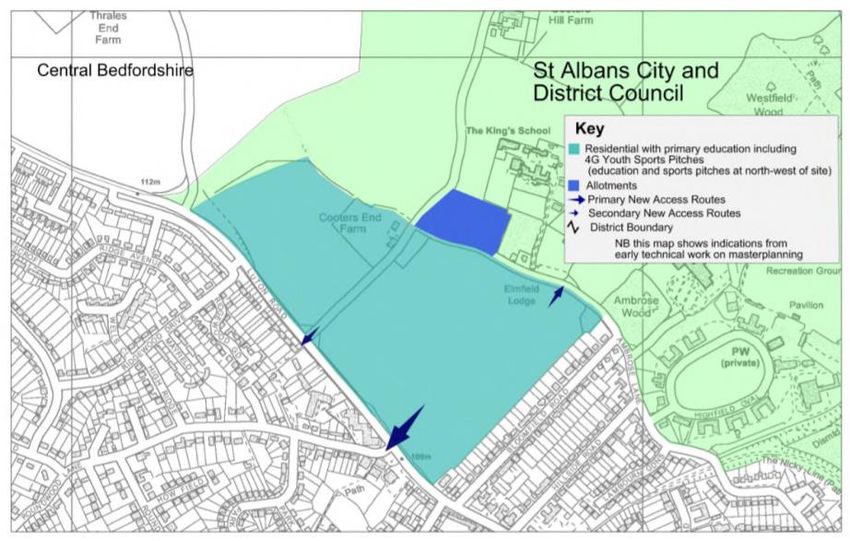
5.18 The emerging SLP (Policy SLP13c ‘North West Harpenden Broad Location – Principally
Housing’) proposes a single housing site allocation in Harpenden, at North West Harpenden,
with a capacity of circa 500 dwellings. Two outline masterplan options are included in the
emerging DLP Policy DLP13 (‘Broad Location Masterplanning’), which show a primary
school and allotments in addition to the residential area. These are shown at Figures 8 and
9.
Figure 8. North West Harpenden Broad Location: Option A
Page 22Harpenden Neighbourhood Plan Baseline Report for Harpenden Town Council
Figure 9. North West Harpenden Broad Location: Option B
Page 23Harpenden Neighbourhood Plan Baseline Report for Harpenden Town Council
6.0 Employment
6.1 This section sets out the current employment circumstances of residents in the HNP Area,
details employment sites and provides a summary of future growth requirements.
Economic Activity
6.2 At the time of the 2011 Census, 72% of the population aged 16 – 74 were economically
active (i.e. in work or looking for work). This is lower than in SADC (75%) and higher than
the national average (70%). Notably, 12% of the female population aged 16-74 is
economically inactive due to looking after home or family. This is higher than the SADC
average of 9% and UK average of 8%.
6.3 Of the economically active proportion of the population, 94% were in employment, 3% were
unemployed and 3% were in full time education. Both the unemployed and full time
education figures are lower than the SADC and national averages, with unemployment
recorded at around half of the national figure.
6.4 A total of 28% of residents aged 16-74 were economically inactive, of which 49% were
retired, 22% were full-time carers (including stay at home parents) and 4% were long-term
sick or disabled.
Employment by Industry
6.5 Figure 10 sets out the occupation (by broad industry groupings) of employed residents of the
HNP Area in comparison to the SADC and national averages. This shows that residents of
the HNP Area are more likely to be in skilled or semi-skilled jobs than those in SADC and
considerably more likely than the national population.
Figure 10. Comparison of 2011 working population by broad industrial groupings
England
St Albans District
HNP Area
0% 10% 20% 30% 40% 50% 60% 70% 80% 90% 100%
Managerial and professional roles
Associate professional, technical, administrative or secretarial roles
Skilled trade, care, leisure, sales, customer services, process, plant, machinery or elemetary
occupations
Page 24Harpenden Neighbourhood Plan Baseline Report for Harpenden Town Council
Qualifications
6.6 Residents of Harpenden are generally very well educated. At the time of the 2011 Census,
only 10% of the population had no qualifications, compared to 13% in SADC and 23% in
England. Over half of Harpenden’s residents (53%) held qualifications that are at least level
four (those above A-Level, i.e. higher level certificate, higher apprenticeship, degree,
master’s degree). This was higher than the SADC average of 46% and significantly higher
than the national average of 27%.
Journey to Work
6.7 The 2011 Census shows that the average travel to work distance for Harpenden residents is
21.8km (13.5 miles). This is higher than in both SADC (17.8km / 11 miles) and England
(14.9km / 9.3 miles). The Census records travel to work distances in brackets. The most
popular distance brackets from Harpenden (in order of volume of people not distance) are:
30km (19 miles) to less than 40km (25 miles) (3,295 persons) – this bracket includes
the Central Activity Zone of central London, including the whole of the City of London
and Westminster. It also includes Milton Keynes and Bedford;
5km (3 miles) to less than 10km (6 miles) (2,126 persons) – this bracket includes the
centres of Luton and St Albans as well as Luton Airport. For most residents it would
also include Welwyn Garden City Town Centre and Hatfield Business Park;
Less than 2km (1.25 miles) (1,896 persons) – this bracket includes most residents
working in Harpenden. More information on local employment sites is detailed at
Paragraph 6.9, below; and
10km (6 miles) to less than 20km (12 miles) (1,528 persons) – this bracket includes
Watford, Hatfield (including University of Hertfordshire), Stevenage, Hitchin and
Dunstable.
6.8 A considerable proportion of residents work from home, with 7% of the population doing so
compared to 6% in SADC and 3% in England.
6.9 Figure 11 sets out resident’s primary mode of travel to work at the time of the 2011 Census
(please note those using more than one mode of transport will have only stated the mode
they consider to be primary and the figures exclude work from home).
Page 25Harpenden Neighbourhood Plan Baseline Report for Harpenden Town Council
Figure 11. Resident’s Primary Mode of Travel to Work (2011 Census)
8,000
7,000
6,000
Number of Residents
5,000
4,000
3,000
2,000
1,000
0
Private Vehicle Train On foot Bicycle Bus
6.10 Evidence from ticket sale data suggests that rail travel to work is likely to be higher than set
out above, as there are a number of irregular passengers, who may travel to London only on
a part time basis and may not be reflected in the above figures.
Employment Land
6.11 Despite its reputation as a commuter town, there are some designated employment sites in
and around Harpenden. These are:
Rothamsted Research;
Southdown Industrial Estate;
Batford Mill Industrial Estate; and
Coldharbour Lane.
6.12 In addition to these locations, the Town Centre also hosts a number of jobs and there are
some additional employment uses at James Marshall Units. The Town Centre has a number
of small office locations used by professional service companies such as accountants and
solicitors.
6.13 Local anecdotal evidence suggests a majority of people working in Harpenden do not live in
the HNP Area, with most residents commuting out of Harpenden.
6.14 The emerging DLP policies map proposes Coldharbour Lane and Southdown Industrial
Estate as ‘Primarily Business Use Areas’. The corresponding emerging Policy, DLP14, sets
Page 26Harpenden Neighbourhood Plan Baseline Report for Harpenden Town Council
out how commercial uses (‘B Class’) are expected in these locations, which already host a
range of B-Class uses, such as industrial, light industrial and storage/distribution.
Rothamsted Research, a world leading agricultural research centre, is proposed for
designation as a ‘Special Employment Location’ where, according to emerging Policy DLP18,
proposals will be required to directly enhance the business of Rothamsted Research.
6.15 The emerging SLP and DLP do not propose any new employment sites in or around
Harpenden. The major proposed new employment allocation is located in East Hemel
Hempstead, which is within 10km of the HNP Area and therefore may have some impact on
it.
Page 27Harpenden Neighbourhood Plan Baseline Report for Harpenden Town Council
7.0 Retail
7.1 This section considers the retail performance of Harpenden Town Centre and its
neighbourhood centres, including current issues and potential future requirements.
7.2 In addition to the Town Centre, Harpenden has a neighbourhood centre in Southdown and
some smaller undesignated retail frontages, all of which are detailed in this section.
Harpenden Town Centre
7.3 Most of the retail units in Harpenden Town Centre run either side of the High Street (A1081)
(some are located on Bower’s Parade, east, but have a High Street address), including Leyton
Road, which runs parallel to the southern extent of the High Street. Another key frontage is
the west end of Station Road, which connects the High Street to the railway station. This
results in a relatively linear Town Centre, with the High Street/Bower’s Parade frontages
extending for around 500 metres.
7.4 Harpenden Town Centre is noteworthy for its mix of uses, including a number of independent
and national retailers selling a range of goods. It also has a diverse range of eating and
drinking establishments.
7.5 The SADC Shopping Monitoring Report (2010) 12 states that Harpenden Town Centre is the
District’s second largest shopping centre. It sets out how a number of national retailers are
located in the Town Centre, including three supermarkets (Sainsbury’s, Waitrose and Marks
and Spencer Simply Food) as well as a number of major national retailers, such as Boots and
WH Smith. It also sets out how key features in the Town Centre include the range of
restaurants and the monthly Farmer’s Market.
7.6 The Shopping Monitoring Report studies the status of ‘primary’ and ‘secondary’ shopping
frontages in Harpenden. Primary frontages are key retail locations, which will have a
predominance of retail units. SADC also regularly prepares an Authority Monitoring Report,
which reviews, among other matters, the composition of shopping frontages in the District. The
most recent Authority Monitoring Report considers 2015-201613. This allows some
comparison of the change of frontages over time. The Shopping Monitoring Report and
Authority Monitoring Report consider the primary frontages in Harpenden to be:
12 St Albans City and District Council (2010) Shopping Monitoring Report. Available at:
http://www.stalbans.gov.uk/Images/SP_ShoppingMonitoringReport_April2010_tcm15-15786.pdf
13 St Albans City and District Council (2016) Authority’s Monitoring Report. Available at:
http://www.stalbans.gov.uk/Images/SP_EB_AuthoritysMonitoringReport2016.pdf
Page 28Harpenden Neighbourhood Plan Baseline Report for Harpenden Town Council
1-3 Church Green/ 2b-10 Leyton Road;
1-31 High Street;
18-50 High Street;
The Leys;
1-11 Leyton Road/ 12-18 Church Green Row; and
2-16 High Street & 1-3 Leyton Green Road.
7.7 Figure 12 sets out the percentage use of primary frontages in Harpenden in 2010 and 2016,
measured by the length of shopfronts in each use. It shows very little change in the overall
composition over the six-year period, which implies a stable primary shopping area.
Figure 12. Comparison of Primary Frontage Composition in Harpenden by Use.
2010
2016
0 10 20 30 40 50 60 70 80 90 100
Percent
A1 (Retail) A2 (Financial and Professional Services)
A3 (Restaurants and Cafes) A4 (Drinking Establishments)
A5 (Hot Food Takeaways) Combined A Class Uses
Non-A Class Uses
7.8 Secondary frontages are less prominent areas of the Town Centre, which generally are more
diverse in terms of uses. The Shopping Monitoring Report considers the secondary
frontages in Harpenden to be:
4-6 Church Green & 52-104 High Street;
33-61 High Street;
12-14 Leyton Road;
2a-34 Station Road; and
1-17 Station Road.
7.9 Figure 13 details the percentage use of secondary frontages in Harpenden in 2010 and 2016
by length of shopfronts. It shows a similar amount of change over the period to primary
frontages, with very little change in the overall composition.
Page 29Harpenden Neighbourhood Plan Baseline Report for Harpenden Town Council
Figure 13. Comparison of Secondary Frontage Composition in Harpenden by Use.
2010
2016
0 10 20 30 40 50 60 70 80 90 100
Percent
A1 (Retail) A2 (Financial and Professional Services)
A3 (Restaurants and Cafes) A4 (Drinking Establishments)
A5 (Hot Food Takeaways) Mixed-A Class Uses
Non-A Class Uses
7.10 Harpenden Town Centre has maintained a very low vacancy rate since 2001, as detailed in
the AMR and shown in Figure 14. While there have been fluctuations, It appears that the
average vacancy rate in both primary and secondary frontages has grown slightly since
2001.
Figure 14. Harpenden Town Centre Vacancies Since 2001
6
5
4
No. of vacancies
3
2
1
0
2001 2002 2003 2004 2005 2006 2007 2008 2009 2010 2011 2012 2013 2014 2015 2016
Primary Frontages Secondary Frontages
Southdown Neighbourhood Centre
7.11 Southdown Neighbourhood Centre offers a smaller range of units than Harpenden Town
Centre, which are more tailored to its role as a local centre with a smaller visitor catchment
area. It is difficult to consider change in Southdown as the Authority Monitoring Report does
not include the Neighbourhood Centre, meaning the most up-to-date data is contained in the
Shopping Monitoring Report. The breakdown of uses, in 2010, was:
Page 30Harpenden Neighbourhood Plan Baseline Report for Harpenden Town Council
A1 (retail) – 67% of frontages (by length);
A2 (financial and professional services) – 4% of frontages;
A3 (restaurants and cafes) – 3% of frontages;
A4 (drinking establishments) – 0% of frontages;
A5 (hot food takeaways) – 8% of frontages; and
Other uses – 19% of frontages.
7.12 Southdown also has maintained a low vacancy rate since 2001, as set out in Figure 15. The
Authority Monitoring Report does not analyse Southdown, so the latest figures are from
2010. It is worth noting that there did appear to be a small uplift in vacancies in Southdown
following the 2008 financial market downturn.
Figure 15. Southdown Neighbourhood Centre Vacancies 2001 – 2010
4
No. of vacancies
3
2
1
0
2001 2002 2003 2004 2005 2006 2007 2008 2009 2010
Vacancies
Undesignated retail frontages
7.13 These sites are not designated as retail frontages and therefore have not been studied by
SADC as part of its evidence base. Undesignated retail frontages include:
A small cluster of three retail units (including a Tesco Express) to the north end of
the Luton Road, north of the junction with Park Mount; and
A pair of retail units in Batford, at the junction of the Lower Luton Road and Pickford
Hill. These accomodate a medium size Co-operative supermarket and a fast food
takeaway.
Future provision
7.14 The SADC Retail Study Economic Capacity Update (2010)14 set out an analysis of the
sufficiency of retail provision in Harpenden. It stated that:
14 St Albans City and District Council (2010) Retail Study Economic Capacity Update. Available at:
http://www.stalbans.gov.uk/Images/SP_RetailStudyUpdate_April2010_tcm15-14303.pdf
Page 31Harpenden Neighbourhood Plan Baseline Report for Harpenden Town Council
There is a good provision and choice of foodstores in Harpenden and, while there is
not a demonstrable need for new retail floorspace, should it be encouraged it should
be in existing stores in the Town Centre rather than new stores outside of the centre;
and
There is some need for more floorspace for retailers other than foodstores (such as
clothes shops), which should be provided in the Town Centre through infill and small
scale extension and redevelopment, rather than expansion of the Town Centre
and/or large-scale redevelopment.
7.15 The above study is now seven years old, so the situation may have changed somewhat
since its preparation. The emerging SLP and DLP do not currently propose new retail
provision in Harpenden.
Page 32Harpenden Neighbourhood Plan Baseline Report for Harpenden Town Council
8.0 Transport
8.1 This section highlights the existing transport network in Harpenden, including walking,
cycling, public transport and road networks, as well as issues related to it.
8.2 Harpenden is located in the north of SADC and has a range of sustainable transport
connections, including a train station with Thameslink connections, buses to a range of
nearby destinations and some cycle routes. It is also very well connected by road, with the
A1081 running through the town, which connects to Luton and St Albans, and the M1 and
A1(M) less than 10km away.
8.3 The Hertfordshire County Council Traffic Data Report (2015)15 monitors modal split of
transport users in Hertfordshire’s towns. The modal split of those travelling in Harpenden
has most recently been studied in 2011 and 2014, through monitoring travel around the
Town Centre from a number of sites between 7am to 10am (please note train is not included
and many users may be travelling to the station). The results were:
Car – 82.5% (2011) to 81.9% (2014);
Bus – 9.4% (2011) to 8.9% (2014);
Foot – 6.5% (2011) to 9.2% (2014);
Bicycle – 1.1% (2011) to 1.7% (2014); and
Motorcycle – 0.5% (2011) to 0.7% (2014).
8.4 The study also considered car occupancy rates, which were 1.26 in 2011 and 1.25 in 2014.
Road Network
8.5 The A1081 runs through Harpenden Town Centre, at which point it is referred to as the High
Street. North of the Town Centre it is known as Luton Road and south it is known as St
Albans Road. The Hertfordshire Local Transport Plan (2011-2031)16 identifies the A1081 as
a main distributor and primary trunk road in Hertfordshire, connecting Borehamwood to
Harpenden via Radlett and St Albans. The Harpenden Urban Transport Plan (2011)17 states
that the A1081 suffers from high traffic flows northbound and southbound throughout the day,
but particularly at AM peak times. It sets out how congestion appears to arise from its role
15 Hertfordshire County Council (2015) Traffic and Transport Data Report. Available at:
https://www.hertfordshire.gov.uk/media-library/documents/highways/transport-planning/transport-and-accident-data/ttdr/traffic-
and-transport-data-report-2015.pdf
16 Hertfordshire County Council (2011) Local Transport Plan 2011-2031. Available at: https://www.hertfordshire.gov.uk/media-
library/documents/highways/transport-planning/local-transport-plan-live/overarching-strategy.pdf
17 Hertfordshire County Council (2011) Harpenden Urban Transport Plan. Available at:
https://www.hertfordshire.gov.uk/media-library/documents/highways/urban-transport-plans/harpenden/harpenden-urban-
transport-plan.pdf
Page 33Harpenden Neighbourhood Plan Baseline Report for Harpenden Town Council
as both a strategic route and an access road to a number of vehicle attracting land uses in
the Town Centre, such as retail and community uses, resulting in demand for medium and
short distance trips.
8.6 Other routes that connect Harpenden with surround areas include:
B653 (Lower Luton Road), which runs north east of Harpenden, through Batford, and
connects to Luton and Wheathampstead;
B487 (Redbourn Lane), which adjoins the A1081 by Hatching Green and leads
towards Redbourn, where it also connects to the A5183 (Dunstable Road), which
connects to the M1 at Junction 9;
The Common/Annables Lane, which adjoins the A1081 by Kinsbourne Green
Common and runs through Harpenden Rural Parish, where it splits to provide an
alternative route to M1 Junction 9 or Flamstead (as Watery Lane) or Markyate (at
Coles Lane);
Pipers Lane, which adjoins Grove Road in Southdown connects to roads leading to
B651 (High Street) south of Wheathampstead, providing an alternative route to St
Albans; and
Wheathampstead Road, which runs from Southdown and connects to the B651 in
Wheathampstead.
8.7 A key route within Harpenden is the B652 (Station Road), which adjoins the High Street in
the Town Centre and runs east, past the railway station, towards the north east suburbs of
Harpenden, eventually continuing to Luton as the Lower Luton Road. The Harpenden
Urban Transport Study notes this road as another congested route, especially between the
A1081 and the junction with Cowper Road, due to traffic accessing and egressing the station.
It also notes some congestion beyond Cowper Road towards Batford during AM and PM
peak times, including up to the junction with the Lower Luton Road.
8.8 The Harpenden Urban Transport Plan further notes that congestion occurs generally around
Harpenden due to school runs in the AM and PM.
8.9 Harpenden Urban Transport Plan notes four hazardous sites in Harpenden, those being sites
that have experienced six or more collisions over the preceding six years. Those sites are
all located on the A1081, at junctions with Bloomfield Road, Rothamsted Avenue, Station
Road and Bull Road. It further notes that there are issues with excess speed (including
noncompliance with speed limits and unsuitable speed limits) across Harpenden, particularly
on roads that adjoin the A1081 from the east across Harpenden Common (including Cravells
Page 34Harpenden Neighbourhood Plan Baseline Report for Harpenden Town Council
Road), Walkers Road, Grove Road, the A1081 from Beesonend Lane to Bull Road,
Wheathampstead Road and Leyton Road.
8.10 Hertfordshire County Council carries out an annual Programmed Vehicle Survey (PVS)18,
which monitors the level of traffic at certain nodes around Harpenden based on an Annual
Average Weekday (AAWD) flow, usually recording between 0600 and 2200 and avoiding
occasions where the level of traffic is likely to be unusual (i.e. road works or special events).
Figure 16 shows the locations of the nodes and Figure 17 sets out annual counts at each of
those nodes since 2005.
Figure 16: PVS locations around Harpenden (1. Luton Road 2. Lower Luton Road, Batford 3.
Bower Heath Lane 4. Wheathampstead Road 5. Harpenden Road 6. Redbourn Lane).
18 Hertfordshire County Council (regularly updated) Programmed Vehicle Survey. Available at:
http://webmaps.hertfordshire.gov.uk/highwayspub/index.htm?layers=%5B5:15,18%5D
Page 35Harpenden Neighbourhood Plan Baseline Report for Harpenden Town Council
Figure 17: Harpenden vehicle traffic counts measured at each node (2005-2015).
AAWD flow by node (2005-2015)
25000
20000
15000
10000
5000
0
2005 2006 2007 2008 2009 2010 2011 2012 2013 2014 2015
8.11 Figure 17 suggests that traffic on the A1081 has reduced slightly between 2005 and 2015, as
shown by flows north (1, Luton Road) and south (5, Harpenden Road). Usage of the Lower
Luton Road and Wheathampstead Road and Bower Heath Lane has also reduced over the
period; however, the Lower Luton Road appears to be becoming busier. Redbourn Lane
stands out as traffic has generally increased over the period. The above data shows that the
traffic volume has been managed in Harpenden over the past ten years. Most roads are on
a trajectory towards less volume.
Parking
8.12 SADC sets out a list of public car parks on its website19. It identifies the following car parks
in and around Harpenden Town Centre:
Amenbury Lane – 206 spaces (operated by NCP);
Bowers Way East – 148 spaces (operated by NCP);
Bowers Way West – 158 spaces (operated by NCP);
Harpenden Station – 670 spaces (operated by Meteor Parking);
Lydekker Park – 88 spaces (operated by Harpenden Town Council); and
Waitrose Supermarket Cark Park – 130 spaces.
19 St Albans City and District Council (regularly updated) Car Parks in Harpenden. Available at:
http://www.stalbans.gov.uk/transport-and-streets/parking/Car_Parks/Car-parks-in-Harpenden/default.aspx
Page 36Harpenden Neighbourhood Plan Baseline Report for Harpenden Town Council
8.13 In addition, there are some car parks in Southdown, including the Cooperative car cark (157
spaces), Cravells Road Car Park and BAA Lamb car park. The Rothamsted Research car
park is also occasionally open to the public.
8.14 The Harpenden Urban Transport Plan states that key issues in the town include the
presence of commuters seeking to use on-street parking spaces (outside of controlled areas)
and an undersupply of off-street parking spaces. It notes that the station car parks are full
by 08.30am each day.
8.15 The Harpenden Urban Transport Plan considers that the expansion of the controlled parking
zone could help alleviate parking issues, and recommends it for further consideration.
Walking and Cycling
Walking
8.16 Harpenden is not a particularly compact town, being relatively linear in shape, with distinct
areas separated by large green spaces, including The Common. The Town Centre is
particularly linear, with the Town Centre part of the High Street extending by over 500
metres, which may discourage walking.
8.17 The Harpenden Urban Transport Plan notes a number of locations where residents feel
pavements are narrow and crossings should be provided, including around the A1081 and
the Common. It also notes that signage clutter in the Town Centre makes navigation
confusing.
Despite the challenges set out above, pedestrian infrastructure in Harpenden is strong in
places, with some areas of wide pavements and many tree-lined streets punctuated by green
spaces. This means that, outside of problem areas, walking from one destination to another
in Harpenden can be a reasonably pleasant experience.
Cycling
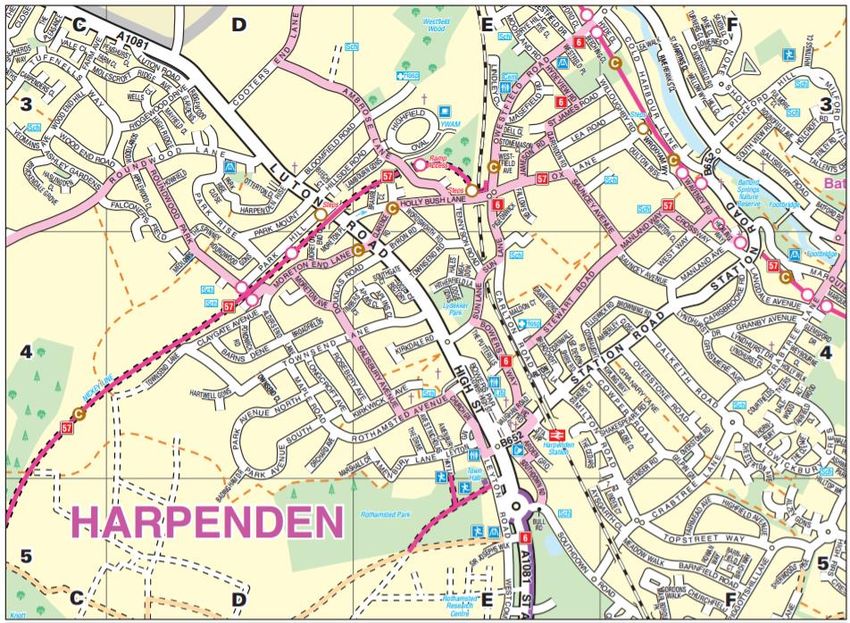
8.18 Figure 18 is taken from the SADC Cycling Map20 and sets out existing cycle routes in
Harpenden.
20 St Albans City and District Council (2014) Cycling Map. Available at:
http://www.stalbans.gov.uk/Images/St%20Albans%20City%20%26%20District%20Cycling%20Map%20-
%20St%20Albans%20%26%20Harpenden_tcm15-20384.pdf
Page 37Harpenden Neighbourhood Plan Baseline Report for Harpenden Town Council
Figure 18. Cycle Infrastructure in Harpenden
8.19 The Harpenden Urban Transport Plan notes that cycling numbers are low, despite the strong
strategic transport routes set out above. It notes that there are issues with cycling in the
Town Centre, including lack of continuous cycle routes and poor crossing facilities by the
station. It also notes a lack of cycling infrastructure generally, including routes connecting to
the strategic cycle network and signage. The topography of the town, with its gently sloping
valley, also somewhat discourages cycling and it is noted that this makes travelling across
the town (east-west) somewhat challenging.
Public Transport
Bus
8.20 A number of bus routes run through Harpenden, regularly connecting the Town Centre to
destinations including Luton, St Albans, Hemel Hempstead, Hatfield, Welwyn Garden City
and Watford. The Arriva 321 route from Luton to Watford (every 20 minutes) and Uno 610
route from Cockfosters to Luton (hourly) also stop at Kinsbourne Green. The 321 route also
Page 38Harpenden Neighbourhood Plan Baseline Report for Harpenden Town Council
serves Southdown on its way to St Albans. The 610, the Centrebus 366 from Luton to
Welwyn Garden City and Hatfield (hourly) and the Uno 657 from Harpenden Cross Lane to
St Albans via Wheathampstead (hourly) serve Batford on their way to Wheathampstead.
The 657 also runs from the Town Centre to the Cross Lane Estate via Southdown. Town
services are provided by the HA1 (2 services a day) and the 307 (3 services a day), which
together provide a limited service from the Aldwickbury area via Southdown into the Town
Centre. The 307 extends to Redbourn. There is also a new community bus service (pilot
scheme) linking the Town Centre with North Harpenden. In addition, there are a number of
school only routes serving the secondary schools in the town from the surrounding villages.
8.21 The Harpenden Urban Transport Plan notes concerns about bus provision in the town,
including:
Punctuality problems due to congestion at peak times (particularly on A1081) and
lack of real time information;
No direct bus to hospitals in St Albans, Hemel Hempstead or Watford;
Poor bus service to Redbourn; and
Evening services finishing too early.
Train
8.22 Harpenden station is on the Thameslink Network, with fast trains connecting regularly (every
15-30 minutes during the day) to Bedford via Luton (including Airport Parkway) and Sutton,
Brighton or Sevenoaks via St Albans, West Hampstead and central London (St Pancras
International, Farringdon and Blackfriars). Fast trains to London take 25-35 minutes, which
attract commuters. Slow trains stop at more destinations within Hertfordshire are also
relatively regular, generally running every half hour.
8.23 The Harpenden Urban Transport Plan notes concerns about train provision in the town,
including:
The lack of any east – west services across Hertfordshire;
Bicycles not being allowed on the trains and poor cycle parking at Harpenden
station;
Overcrowding in AM peak hours;
Poor bus interchange at the station;
Lack of taxi rank at eastern station exit; and,
Insufficient vehicle parking (including Blue Badge) and access.
Page 39You can also read