Sustainable Water Management Plan 2021 2024 - Together we thrive! E ora ngātahi ana! - Central ...
←
→
Page content transcription
If your browser does not render page correctly, please read the page content below
Sustainable Water
Management Plan
       2021 - 2024
 Together we thrive! E ora ngātahi ana!
Document Overview
 Document Status
 Version          Comments                                      Status                                           Date

 001              First Version                                 Draft – Awaiting Approval                        13-02-2021

 002              First workshop with Council                   Working Draft                                    Sept 2020

 003                                                            Working Draft                                    21-09-2020

 004              Updated with consents                         Working Draft                                    29-09-2020

 005                                                            Working Draft                                    18-11-2020

 006              Workshopped with Council                      Working Draft                                    13-02-2021

 007                                                            Final Draft – Awaiting Approval                  24-02-2021

 008              Minor tweaks                                                                                   16-03-2021

 1.0              Adopted by Council                            Approved - Operational                           25-02-2021

 2.0              Designed version                              Approved - Operational                           08-04-2021

Document Purpose
The Sustainable Water Management (SWM) Plan (2021) has been developed to demonstrate Council’s programme for
managing water demand such that the potential effects on the water takes are minimised. The SWM Plan identifies how the
Council and the Community will improve water-use efficiency and reduce water loss in operations using a range of techniques
that are consistent with industry practice and supports Council’s desire to become an efficient user of this valuable resource.

Document Audience
This Policy applies to all Council staff and contractors.

Document Contributors
 Contributor      Name and Title                                                                                 Approval Date

 Creator          Daniel Johnson, Water Group Manager - WSP                                                      08-02-2021

 Reviewer         Ian Cover, 3 Waters Operations Manager, CHBDC Wayne Termaat, Outcomes Manager, Veolia          15-02-2021

 Authoriser       Darren de Klerk, Director Projects and Programmes - CHBDC                                      16-02-2021

 Approver         CHBDC Finance and Infrastructure Committee                                                     25-02-2021

Related References
Documents Informing Asset Management Strategy and Direction

• Water Safety Plans                                              • DRAFT Long Term Plan 2021-2031
• Water Supply Bylaws 2018                                        • Draft District Plan
• DRAFT Water Supply Bylaw 2021                                   • Spatial Plan
• Organisational Values                                           • Environmental and Sustainability Strategy
• Project THRIVE Documentation                                    • Water Asset Management Plan
• Infrastructure Strategy 2021                                    • DRAFT 3 Waters Asset Management Plan 2021
• Long Term Plan 2018-21
Contents
Purpose of this Plan ........................................................................................................................................................................................2
Water Supply Schemes ..................................................................................................................................................................................5
Consents and Regulative Requirements ................................................................................................................................................. 12
Demand: Current and Future ...................................................................................................................................................................... 15
      Water Demand & Availability..................................................................................................................................................................15
      Leakage......................................................................................................................................................................................................18
      New Zealand Benchmarking.................................................................................................................................................................21
Current Approach.......................................................................................................................................................................................... 24
      Engagement and Public Education......................................................................................................................................................24
      Plans and Policies ...................................................................................................................................................................................24
      Conserve Water Measures ....................................................................................................................................................................25
      Previous Water Management and Conservation Strategy (2012).................................................................................................29
Strategic Objectives ..................................................................................................................................................................................... 31
How Do We Get There?................................................................................................................................................................................. 33
      Action Plan................................................................................................................................................................................................33
Plan Implementation .................................................................................................................................................................................... 35
      Ownership – Roles and Responsibilities.............................................................................................................................................36
      Measure of Success................................................................................................................................................................................36
      Plan Review...............................................................................................................................................................................................36
      Risks and Mitigation................................................................................................................................................................................36

Action Plan
A1: Engaging with Our Customers ........................................................................................................................................................... 39
A2: Improving our Assets ........................................................................................................................................................................... 40
A3: Working with our Stakeholders .......................................................................................................................................................... 42
Purpose of this Plan
Hawke’s Bay Regional Council (HBRC) require a               Purpose of this Plan
Water Management Strategy as part of the resource           The purpose of our SWM plan is to highlight our
consent which demonstrates how demand for water             activities and those areas where we are promoting
from the water supply bore will be minimised at             water sustainability.
times of low flows in the Rivers.
                                                            Our approach to water sustainability can be grouped
As a requirement of the consents for Johnson Street,        into four key areas/ themes:
Waipawa (WP030817T), Tikokino Road, Waipawa
                                                            • Engaging with our customers
(WP030818T), Meta Street, Takapau (WP140534T)
and State Highway 2, Waipukurau (AUTH-113708-03)            • Ensuring environmental vitality and sustainability
the Central Hawke’s Bay District Council is required to       through our way of working
submit a water management strategy to the HBRC.             • Improving our assets

In response to these requirements, the following            • Working with our stakeholders.
Sustainable Water Management (SWM) Plan (2020-2023)         To ensure we value our most natural resource, water, our
has been developed to demonstrate Council’s programme       focus is on reducing leakage, working with our customers
for managing water demand such that the potential effects   to use water wisely and in a sustainable manner and using
on the water takes are minimised. The SWM Plan identifies   the most appropriate ways to store and distribute water to
how the Council and the Community will improve water-       ensure a reliable and consistent supply of water.
use efficiency and reduce water loss in operations using
                                                            We are aware that the effects of water efficiency activities
a range of techniques that are consistent with industry
                                                            are difficult to measure (even where good demand
practice and supports Council’s desire to become an
                                                            component measurement is in place); however, we are
efficient user of this valuable resource.
                                                            committed to exploring water efficiency opportunities.
                                                            While the SWM Plan has been developed to meet
                                                            consent conditions, it also serves as a base document
                                                            for the implementation of Council’s long-term strategic
                                                            direction and District Plan which identifies the sustainable
                                                            management of natural and physical resources and the
                                                            social, economic, environmental and cultural well-being
                                                            of the community
                                                            Alignment with Council’s strategic framework:
                                                            • Social and Cultural – A health, safe place to live:
                                                              Risks to public health are identified and appropriately
                                                              managed
                                                            • Economic – A place with a thriving economy:
                                                              Central Hawke’s Bay District has an efficient and
                                                              affordable water infrastructure
                                                            • Environmental – A place that is environmentally
                                                              responsible: Central Hawke’s Bay plans and manages
                                                              water use to minimise the effect on the environment.

                                                                                    Sustainable Water Management Plan • 2
Relationship with Other Plans
Introduction
To achieve a holistic and integrated approach to three waters management in the District that is consistent
with Council’s District Plan, other Policies, Plans, Strategies and Objectives and also reflect the principles of the
Te Mana o Te Wai. The following overarching purposes has recently been set for all four water services bylaws
(Water Supply, Stormwater, Wastewater and Trade Waste).
The Sustainable Water Demand Management Plan is an enabling tool to support the management of water
demand in the district and complements the water supply bylaw whilst link to the plans and purposes below.
1. Integrated Approach
Adopt an integrated and holistic approach to the Three Waters (water supply, wastewater including trade waste
and stormwater) that recognises the interconnections between each of the waters and promotes their sustainable
use and management.
2. Environmental Responsibilities
Facilitate environmentally responsible practices by raising awareness of how the Three Waters interact and
effect the District’s natural environment. Additionally, ensure that Council meet its own responsibilities in terms
of resource consent requirements set by the Hawke’s Bay Regional Council.
3. Sustainable Practices
Encourage and incentivise the community and businesses to adopt practices that lead to the enhancement of
the environment and the sustainable management of water resources including water and product stewardship,
rainwater harvesting, waste minimisation and cleaner production.
4. Support Sustainable Growth
Support the sustainable provision of three waters infrastructure to enable future growth while minimising impacts
on the environment.
5. Achieve Project Thrive Values
Develop and implement Three Water Bylaws to give effect to ‘Project Thrive’ values in particular trust, honesty,
respect, innovation, and valuing people.
6. Te Mana o Te Wai
Recognise the fundamental concept of Te Mana o Te Wai as prescribed under the National Policy Statement for
Freshwater Management 2020 and in particular the need to restore and preserve the balance between the water,
the wider environment, and the community.
7. Tangata Whenua Status
Recognise the status of tangata whenua as Kaitiaki.
8. Durable Infrastructure
Develops and maintain durable and resilient infrastructure that achieves Council’s levels of service in an efficient
and cost-effective manner.

                                                                                            Sustainable Water Management Plan • 3
Water Supply Schemes
The provision of systems for the extraction, treatment and distribution of water is a function of Council’s
permitted activities and governed by the Local Government Act 2002 and the Health Act 1956.
There are five potable water supply schemes that are operated and maintained by Council:
• Waipukurau – an on-demand scheme servicing the                 • Pōrangahau-Te Paerahi – an on-demand scheme
  Waipukurau township. Water is sourced from four bores            servicing the Te Paerahi Beach and Pōrangahau
  located at the foot of Pukeora Hill (approximately 4             settlements. Water is sourced from a bore located
  km west of Waipukurau). The bores are hydraulically              off Beach Road and treated for manganese and
  connected to the Tukituki River. Water is pumped to              iron removal (green sand filtration) and chlorinated
  a reservoir on Pukeora Hill and treated with UV and              (UV and chlorine). Ion exchange has recently been
  chlorination. The supply to the reticulation comprises           installed to soften the water. Booster pump stations
  two ‘zones. Most connections are supplied in the                 supply the stored treated water to the township and
  high-pressure zone, which is serviced by the Pukeora             Te Paerahi Beach networks. There is further storage in
  reservoir, with the smaller Mangatara Road tank at the           the Pōrangahau township network in the form of three
  east end of the scheme supplying a small number of               treated water reservoirs on the hill next to the township.
  houses during high demand (back-feed). Hunter Park             • Kairakau – a scheme servicing the Kairakau domestic
  reservoir, which is located on top of Hunter Memorial            properties, public toilets and camping ground. Water
  Park, is fed from the Pukeroa reservoir and supplies the         is sourced from a spring and a bore. Raw water is
  low-pressure zone area (central north area of township).         chlorinated and then pumped to the network via a series
  There is also a small offtake (Shand booster pump) after         of treated water reservoirs. The campground has its
  the Pukeora reservoir. This supplies some high elevation         own dedicated reservoir, with a further three supplying
  connections via a gravity supply from the Shand                  the community. Each property has an onsite rainwater
  reservoir.                                                       collection tank (minimum volume 1,800 L) which is also
• Waipawa- Otāne* – an on-demand scheme servicing                  supplemented by the Council supply.
  the two townships of Waipawa and Otāne. Water                  In addition to the above, there are further water supply
  is sourced from a bore on Tikokino Road which is               activities within the District that Council considers as
  pumped to two reservoirs approximately 4.5 km on               part of the over-arching approach to sustainable water
  Abbotsford Road. A second bore located in Johnson              management:
  Street supplements the supply and pumps into a
  low-pressure zone of the network. The bores are                • Pourerere Campground – a Council water supply
  hydraulically connected to the Waipawa River. Water              servicing the Pourerere camping ground, public toilet
  from the Abbotsford Road reservoir gravitates into the           block and two houses. Water is taken from a spring in
  Waipawa township reticulation. A dedicated main from             Gibraltar Road and supplied via a 20mm diameter pipe.
  the Abbotsford reservoir also fills the Otāne reservoir        • Russell Park / Waipukurau Sports Fields – Council
  which gravity supplies the Otāne township. The Otāne             has a consent to take as use water from the Tukituki
  township is also supplied from a second connection to            River for the purpose of irrigating 17.5ha of sports
  the Waipawa reticulation via a pressure reducing valve.          field at Russell Park in Waipukurau.
  *Supplied from two different bores and treatment plants.
• Takapau – an on-demand scheme servicing the
  Takapau township, with some farm connections being
  metered. Water is sourced from a deep bore located in
  Meta Street, treated for manganese and iron removal
  (ultrafiltration) and chlorinated before being stored in
  seven tanks. Water is pumped from the tanks to the
  reticulation, also filling the SH2 (Sydney Street) reservoir
  on the west side of the network.

                                                                                         Sustainable Water Management Plan • 4
Table 1 and Figure 1 provides an overview of the potable water supply schemes serviced by the Council.

 Figure 1: Central Hawkes Bay District Council Water Supply Schemes Overview
                                                                                     Sustainable Water Management Plan • 5
Table 1: Potable Water Supply Scheme Overview

                                                         Length
 Water                                     No.                                                                              Pump
               Supply Type    Population                 of Mains   Source    Treatment      Storage
 Supply                                    Connections                                                                      Station
                                                         (km)

 Waipukurau    On-demand      3,666        2,249         79.1       5 bores   UV,            Pukeroa Hill - 2,700 m³        1 no.
                                                                              Chlorination   Hunter Park - 900 m3
                                                                                             Mangatarata Rd tank 20 m³
                                                                                             Shand Rd - m³

 Waipawa       On-demand      2,355        966 + 326     77         3 bores   UV,            Abbotsford Rd - 400 m³
 - Otāne                                                                      Chlorination   + 700 m³ (treated)
                                                                                             Johnson Street – 210cm³
                                                                                             Otāne – 2 x 150 m³ (treated)

 Takapau       On-demand      570          278           16.4       1 bore    UV,            Meta St – 240 m³
                                                                              Greensand,
                                                                              Ozone          SH2 – 230 m³

 Pōrangahau    On-demand      160          133 + 110     16.2       1 bore    UV,            Beach Rd - 96 m³ (raw)         1 no.
 -Te Paerahi                                                                  Greensand,     + 264 m³ (treated)
                                                                              Ion Exchange
                                                                                             New treated storage
                                                                                             – 180 m³

 Kairakau      On-demand      83           84            3.3        1         Chlorination   4 x 25 m³ (raw)                1 no.
               to rainwater                                         spring,
               tanks                                                1 bore                   3 x 25m³ + 20m³ (treated)

                                                                                             Sustainable Water Management Plan • 6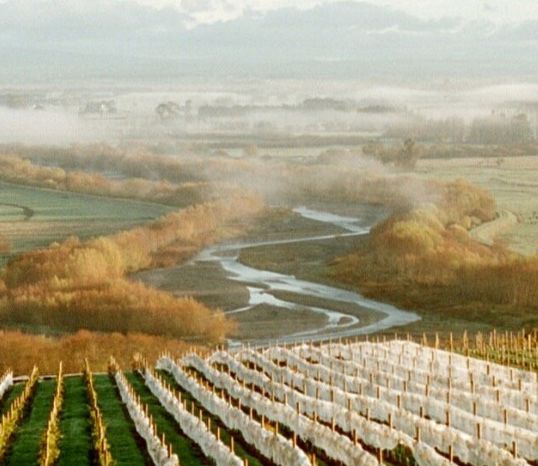
Reticulation
In terms of the reticulation network the water supply schemes have a range
of pipe materials and age (0 – 113 years). A high-level assessment of ‘age
based’ condition was undertaken for each water supply as shown in Figure 2.

              25.0

              20.0
Length (km)

              15.0

              10.0

               5.0

               0.0
                       1                            2                       3                      4                      5
                                       Condition (1=Excellent, 2=Very Good, 3=Good, 4=Poor, 5=Very Poor)

                           Kairakau      Otane          Porangahau        Takapau     Te Paerahi       Waipawa     Waipukurau

Figure 2: Water Supplies Pipe Age Based Condition

      Observations – Pipe Age Based Condition
      • Waipukurau (36km, 46%), Waipawa (21 km, 40%) and Pōrangahau (4.7 km, 48%) are estimated to
        have > 40% of pipes that are assessed as being in poor to very poor condition.
      • Pipe condition assessment and development of a strategic renewals programme will enable the
        Council to prioritise and target pipe renewals as part of an over-arching water loss management strategy
        (refer ‘Leakage’ section).

Storage – Resilience
The optimal volume of treated water storage for a water supply usually comprises a balance between considering
resilience (climate change, planned and unplanned interruptions), water quality and demand. Generally, more than
one day of storage at peak day demand could be considered the minimum required to help mitigate the effect of any
supply interruption and allow Council time to initiate a response (e.g. repairs, conserve water communication). A general
assessment of the CHBDC water supplies against current peak day and average day demand is shown in Table 2 .
Table 2: Water Supply Treated Water Storage No. Days for Peak Day and Average Day Demand

                                                        Peak day demand         No. hours                Average day demand   No. hours
    Water Supply               Treated Water (m3)
                                                        (m3/day)                storage                  (m3/day)             storage

    Waipukurau                 3,600                    6,480                   13 hours                 4,277                20 hours

    Waipawa- Otāne             1,600                    3,513                   10 hours                 1,872                9 hours

    Takapau                    470                      686                     14 hours                 378                  13 hours

    Pōrangahau-Te Paerahi      464                      399                     16 hours                 151                  42 hours

    Kairakau                   95                       42                      54 hours                 24                   95 hours

                                                                                                        Sustainable Water Management Plan • 7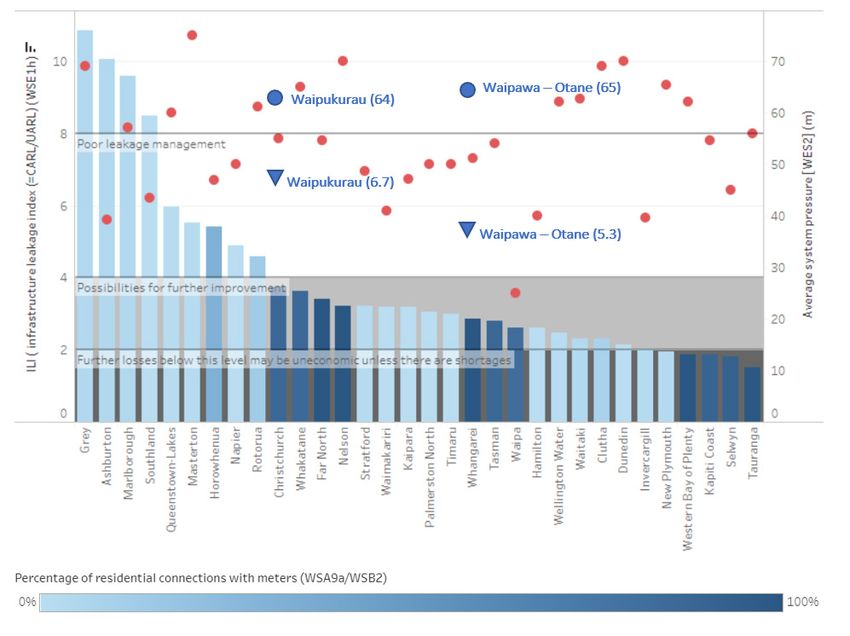
Observations – Treated Water Storage
                • All the water supplies, except for Kairakau, have less than one day of storage a current peak day demand.
                • Further assessment of storage is required that considers resilience scenarios and considers the impact
                  of future demand.

              Pressure
              Council has a legal requirement to ensure that an adequate and continuous supply of water is provided at a pressure
              that enough for user activities and firefighting purposes. Figure 4 show the maximum pressure contours predicted by
              the current hydraulic models for Waipukurau and Waipawa- Otāne. Generally, pressures vary from 75m down to 20m in
              Waipukurau, with the lower pressures evident in the low-level area supplied by the Hunter Park Reservoir. There are higher
              pressures in excess of 90m evidenced in the Waipawa- Otāne water supply with pressures in the Waipawa network being
              dictated by the pumping required to supply the Abbotsford Reservoir. The Otāne network is already fed through a PRV on
              the incoming main from Waipawa.

                Figure:
              Figure 3 – Waipukurau  PeakDay
                         Waipukurau Peak  Day Maximum Pressure Contours
              Maximum Pressure Contours, AZP
                AZP (m) = 68.6
              = 68.6m

ure: Waipukurau    Peak DayPeak
          Figure: Waipukurau Maximum     Pressure
                                Day Maximum Pressure Contours
                                                     Contours

P (m) = 68.6AZP (m) = 68.6

                                                                                                   Figure: Waipukurau Peak Day Maximum

                                                                                                   AZP (m) = 68.6

                Figure: Waipawa Otane Peak Day Maximum Pressure Contours

                AZP (m) = 62.5
              Figure 4: Waipawa- Otāne Peak Day
              Maximum Pressure Contours, AZP = 62.5 m

                                                                                                     Sustainable Water Management Plan • 8
             Figure: Waipawa Otane Peak Day Maximum Pressure Contours
In terms of the Takapau water supply pressures are dictated by the WTP pump station operating to the Sydney Street
reservoir on the west side of the network. The pressures in the network vary depending on whether the WTP pump station
is operating. The head difference between the pump station and reservoir is approximately 18m, which suggests network
pressures are already low.
Pressure reduction (management) is a key component of an over-arching water loss management strategy in terms
of ‘squeezing the box’ (refer ‘Leakage’ section). Council investigated the opportunity to implement a form of pressure
reduction for the low-level zone in the Waipukurau water supply as part of an overall firefighting capacity assessment
(Waipukurau Detailed Modelling Outpus, WSP, July 2016). The assessment with the hydraulic model determined that using
a Pressure Reducing Valve (PRV) was feasible but could potentially add a risk in terms of achieving fire flow during the
event of a fire if the valve was not set up operate correctly.
Observations – Pressure
• There may be further opportunity for pressure reduction as part of an over-arching leakage reduction strategy
in the Waipukurau and Waipawa- Otāne water supplies. However, this may be limited by the need to maintain
fire fighting capacity.
• Pressure reduction in the other water supplies is unlikely to be feasible.
Sustainable Water Management Plan • 9Consents and Regulative Requirements
Consents
This section is to confirm the requirements which the Council water supplies must be operated under, particularly during
river low flows and peak water use. The consents set out the water take and restriction limits on when this can be taken.
Consent Number
Water Supply System Source Number Max. Consented Take Restriction Limits Expiry Date
(Hyperlink)
Waipukurau Well No.s 15107 AUTH-113708-03 All Wells and / or a Cumulative Tukituki River 31-May-
5617, 5676, rate of 100 litres per second. 2028
16892, 16893 Level 1: 3,000 L/s @
(SH2) 60,480m³ 7-day period Taipairu Rd
3,144,960 m3 in Level 2: 2,300 L/s @
12-month period Tapairu Rd
Waipawa- Otāne Well No. 2402 WP030817T 35 litres per second Waipawa River 31-May-
(Johnson St) 2028
21,168m³ 7-day period Level 1: 3,700 L/s @ SH2
Level 2: 2,300 L/s @ SH2
Well No.s 5618 , WP030818T 55 litres per second Waipawa River 31-May-
5619, (Tikokino 2028
Rd) 33,264m³ 7-day period Level 1: 3,700 L/s @ SH2
Level 2: 2,300 L/s @ SH2
Takapau Well No. 1762 WP140534T 19.0 litres per second N/A 31-May-
(Meta St) 2035
31,600 m³ per 28-day period
410,800 m3 in
12-month period
Pōrangahau Well No. 4993 WP090150T 10.2 litres per second N/A 31-May-
-Te Paerahi (Beach Rd) 2034
6,169m³ per 7-day period
Kairakau Well No. 3130 WP090153T 1 Litre per second N/A 31-May-
(Brodie Pl) (Bore) 2029
605m³ per 7-day period
Spring WP090166T 0.7 Litres per second N/A 31-May-
(Brodie Pl) (Spring) 2029
420m³ per 7-day period
Pourerere Spring WP010510T 0.25 Litres per second N/A 31-May-
Campground 2022
Waipukurau Well No. 1461 AUTH-125279-01 6 Litres per second Tukituki River 31-May-
Sports Fields (Russell Park) 2039*
7,120 m3 per 28-day period 2,300 L/s @ Tapairu Rd
Not exceeding 173 m3/day 4,300 L/s @ Red Bridge
if flow at Tapairu Rd and Red
Bridge measuring sites are
below low flow triggers levels
Table 3: Water Supply Permits – Current
Sustainable Water Management Plan • 10Water Supply,
Monitoring Site Flow Triggers Required
Consent & River
Waipukurau Taipairu Rd #23207 1) at or < 3,000 L/s Purpose of Water Management Strategy (WMS):
WP030775T implement public a) statement of purpose
Tukituki River education as per WMS
b) commitment to demand management and water conservation
2) at or < 2,300 L/s = measures during low flows in Tuktuki River.
implement demand c) confirm bylaws for non-compliance of water use restrictions or
mang & water water use directions.
conservation as per
WMS d) when HBRC advise flow is at or below 2,300 L/s – implement
demand management and water conservation measures as set
out in the WMS
e) when HBRC advise flow is at or below 3,000 L/s – implement
public education as set out in the WMS
f) document water conservation measures as part of annual
monitoring report
g) within 5yrs. of consent issue a report including up to date
population projections
Waipawa – SH2 #23211 1) at or < 3,700 L/s Purpose of Water Management Strategy (WMS):
Otāne implement public
WP0308 education as per WMS a) statement of purpose
Waipawa River b) commitment to demand management and water conservation
2) at or < 2,300 L/s = measures during low flows in Waipawa River.
implement demand
mang & water c) confirm bylaws for non-compliance of water use restrictions
conservation as per or water use directions.
WMS d) confirm public education programme to communicate the
need for efficient water use at times of low flow during the
Waipawa River.
d) when HBRC advise flow is at or below 2,300 L/s – implement
demand management and water conservation measures
as set out in the WMS
e) when HBRC advise flow is at or below 3,700 L/s – implement
public education as set out in the WMS
e) document water conservation measures as part of annual
monitoring report
f) within 5yrs. of consent issue a report including up to date
population projections
Takapau 1 - Red Bridge #23201 1) at or < 4,300 L/s Develop and implement a Water Conservation and Demand
WP140534T 2 - Tapairu Rd #23207 2) at or < 2,300 L/s Management Strategy (WDCMS) to include, but not limited
Tukipo River 3 - Ashcott Rd #23213 3) at or < 1,043 L/s to the following:
up to 30 June
Purpose of strategy
1 - Red Bridge #23201 1) at or < 5,200 L/s
2 - Tapairu Rd #23207 2) at or < 2,500 L/s - Commitment to the implementation of a range of demand
3 - Ashcott Rd #23213 3) at or < 1,043 L/s management and water conservation measures to minimise
from 1 July 2023 consumption at times of low flows and which may include water
use restrictions, water use direction, pressure management and
reduction, leak detection, metering and education
A detailed explanation of how the WDCMS will be implemented.
Ensure that the WCDMS is implemented when the low flow triggers
are reached and continue to be implemented until flow return to
be in excess of the trigger limits.
Sustainable Water Management Plan • 11Climate Change
WSP have undertaken a review of how climate change may affect demand, or impact and limit supply for
the Waipukurau Second Water Supply Project (Demand Analysis and Future Supply Security, WSP, February
2020). In terms of climate changes, the following observations and comments were made:
• In the Hawke's Bay Region, it is projected that, compared • Changes in river flows and hydrology - while increases
to 1995 data, temperatures are likely to be between in rainfall volume are projected over summer periods,
0.7˚C to 1.1˚C warmer by 2040 and 0.7˚C to 3.1˚C some models suggest that this increase will come from
warmer by 2090 (MfE 2018). more extreme, less frequent events. This will lead to
• Changes in rainfall will vary across the district, however flashier rivers flows, with higher suspended sediment
at present downscaled models are not refined enough loads, interspersed by longer periods of drought and
to directly attribute projected changes to specific lower river levels. For example analysis estimates
catchments. The seasonal distribution of rainfall is that the Tukituki River (refer Figure 5) mean flow may
projected to change the most; with winter rainfall decrease by up to 2% by 2090 with median flows
projected to decrease by up to 13% in Napier by 2090. decreasing by 8% by 2040 and 13% by 2090 (WSP,2020).
Summer and autumn rainfall, however, are expected to This will likely increase the average number of days
increase (MfE 2018). where flows fall below the current consented limit
of 2,300 L/s, which will increase the duration of time
• According to the most recent projections (MfE 2018),
CHBDC must implement after conservation and demand
the frequency of extreme rainfall days is not expected
management measures. Subsequently community
to increase in the Hawke’s Bay District as a result of
supplies reliant on water from primary sources (i.e.
climate change.
rivers and streams) will be affected.
The main impacts of climate change on the water
supplies will be:
• Demand for residential irrigation during periods of
drought is likely to increase due to increasing soil
moisture deficits. A theoretical assessment (WSP,
2020) indicates the increase in demand associated with
climate change could be about 460m³/day. The degree
to which this additional demand occurs will depend on
the effectiveness of our water management strategies
and the community’s future attitude to water use.
Sustainable Water Management Plan • 12Figure 5: Trend in Tukituki River at Tapairu flow record (10 year moving average of annual median
Observations – Consents and Impact of Climate Change
• Drier and longer summers means there is likely to be longer periods of restrictions required across the district
as demand increases and river flows decrease
• Restrictions may need to be put in place if more extreme storm events result in increased degradation of raw
water quality over time which cannot be treated by the current water treatment plants.
• Effective communication (and escalation) of conservation of water and increasing user awareness will play
an important role in managing demand.
• The focus on water consumption and management may increase with enforcement of greater restrictions
on takes and river flows.
Sustainable Water Management Plan • 13Demand: Current and Future
Water Demand & Availability
Historic Water Demand
Table 5 presents the historical peak day and average day source demand recorded for the water
supplies based on daily volume totals. Kairakau demand has been assessed using monthly volume
totals. Peak day demands have been identified in red.
Waipukurau Waipawa - Otāne Takapau Pōrangahau – Te Paerahi Kairakau
7 Year Average Average Average Average Monthly
Peak Day Peak Day Peak Day Peak Day
Day Day Day Day Average
2015-16 5,647 3,944 3,268 1,967 686 417 283 131 -
2016-17 6,172 4,151 2,972 1,728 586 369 323 145 -
2017-18 6,480 4,224 3,214 1,808 640 364 252 146 42
2018-19 5,588 4,397 2,693 1,888 678 356 399 172 35
2019-20* 6,130 4,671 3,513 1,968 613 381 271 159 32+
*2019-20 is for period 1 September to 31 December 2019, +2019-20 is for period September to December 2019.
Table 5: Historical Peak Day and Average Day Demand (m3/day)
The following graphs show the historical trend for the five water supplies. These are based
on daily totals recorded at the source, except for Kairakau which is based on monthly totals.
Waipukurau Daily Water Usage, September 2015 - January 2020
Takapau Source Daily Water Usage, September 2015 - January 2020
Sustainable Water Management Plan • 14Kairakau Source Average Daily Water Usage, September 2017 -November 2019
Waipawa/ Otāne Daily Water Usage, September 2015 - January 2020
Pōrangahau Source Daily Water Usage, September 2015 - January 2020
Figure 6: Historical Demand Profiles, Restriction on and Consented Volumes
Sustainable Water Management Plan • 15Observations – Demand and Availability
• Peak day usage occurs around the December – January period, coinciding with the Christmas
and school holiday periods.
• The estimated peak day demands for the water supplies have not accounted for reservoir turnover.
In terms of the impact of restrictions on demand a comparison of Waipukurau water
supply over the December to March period for years 2015-2018 shows. Restrictions
were put in place on the following dates:
• 23 December 2015
• 20 December 2016
• 11 December 2017
• 10 December 2018
Waipukurau December 2015 Demand - Restrictions On
Waipukurau December 2016 Demand - Restrictions On
Sustainable Water Management Plan • 16Waipukurau December 2017 Demand - Restrictions On
Waipukurau December 2018 Demand - Restrictions On
Figure 7: Comparison of Waipukurau Demand and Impact of Restrictions
Observations – Restrictions
• Generally, there is a lag in demand decreasing. This could be attributed to the time for the conserve water
messaging to be received and implemented by customers.
• Demand does appear to decrease for a period before flattening out / increasing.
• Overall it is difficult to determine how effective water restriction measures are currently.
Sustainable Water Management Plan • 17Water Availability (Consents) vs Demand (Current & Future)
A review of future peak day demand has been undertaken using the 2020/21 ‘medium’ growth
projections for number of households for townships and the district proposed for the 2021 Long Term Plan.
Year Waipukurau Waipawa - Otāne Takapau Pōrangahau – Te Paerahi Kairakau
2015-16 5,647 3,268 686 283 -
2016-17 6,172 2,972 586 323 -
2017-18 6,480 3,214 640 252 42
2018-19 5,588 2,693 658 399 36
2019-20* 6,480 3,513 613 271 32
Current consented maximum take (m³/day) 8,640 7,776 1,128 881 146
Current peak day (m³/day) 6,480 3,513 686 399 42
*2019-20 is for period 1 September to 31 December 2019, +2019-20 is for period September to December 2019
Table 6: Historical Peak Day and Average Day Demand (m³/day)
A review of future peak day demand has been undertaken using the 2020/21 ‘medium’ growth projections for
number of households for townships and the district proposed for the 2021 Long Term Plan (refer Figure 8).
Waipukurau - Projected Peak Day vs Consented Volume (m³/day)
Takapau - Projected Peak Day vs Consented Volume (m³/day)
Sustainable Water Management Plan • 18Kaiakau - Projected Peak Day vs Consented Volume (m³/day)
Waipawa/ Otāne - Projected Peak Day vs Consented Volume (m³/day)
Pōrangahau/Te Paeahi - Projected Peak Day vs Consented Volume (m³/day)
Sustainable Water Management Plan • 19Projected Household Growth 2020-2055
10000 Low Medium High
9000
Projected households
8000
7000
6000
5000
4000
2015
2020
2025
2030
2035
2040
2045
2050
2055
Year
Figure 8: Projected Future Demand & No. Households vs Consented Volume
Observations – Water Availability
• The projected growth forecasts and equivalent increase in the water demand for the water supplies indicates
that there is still enough headroom in terms of consented volumes for the existing sources and estimated future
peak day demand in 2051.
• This assessment has not considered additional commercial / industrial growth or tourism. Future projections
and demand forecasting should be aimed at understanding what the likely trends will be in relation to these
growth areas.
Leakage
As the water supply system ages, there is a tendency for a continual trend to increase as new leaks and bursts occur,
natural rate of rise of Real Losses (leakage) through new and the distribution system deteriorates with age, but it can
leaks and bursts, some of which will not be reported to be constrained and reduced by an appropriate combination
the Council. This tendency is controlled and managed by of pressure management, speed and quality of repairs,
some combination of the four primary components of Real active leakage control (to locate unreported leaks and
Losses Management shown by the arrows in Figure 9. bursts), and pipeline and assets management.
• Pressure management Real losses cannot be eliminated totally. The lowest
• Speed and quality of repairs technically achievable annual volume of real losses for
well-maintained and well-managed systems is known as
• Active leakage control
unavoidable annual real losses (UARL).
• Pipeline asset management
Using the four methods of leakage management real
The International Water Association (IWA) Water Loss
losses can be controlled, but (at the current operating
Task Force (WLTF) have examined the relationships
pressure) cannot be reduced any further than the UARL.
between pressure, burst frequency and background
However, although the UARL represents the minimum level
losses and developed a theory regarding water loss
of real losses that could technically be reached, for most
management which they describe as ‘squeezing the box’.
utilities it will not be economic to reduce real losses to this
This theory is demonstrated by Figure 9 The ‘Squeezing
level. There will be some intermediate economic level of
the box’ approach is now widely used internationally
real losses which it is appropriate for a utility to achieve.
to demonstrate the essential principles for effective
management of Real Losses. The volume of Current
Annual Real Losses (CARL) from a distribution system is
represented by the large box. The CARL volume exhibits a
Sustainable Water Management Plan • 20The best practice performance indicator for the technical efficiency of Real Losses is the Infrastructure Leakage Index (ILI).
This is the non-dimensional ratio of CARL divided by UARL. In order to calculate the ILI a water supplier needs to know and
have confidence in significant range of data and parameters:
Pressure
Economic
Management
Level of
Losses
Unavoidable Annual
Real Losses (UARL)
Speed and Active
quality of Leakage
repairs Control
Potentially Recoverable Real Losses
Current
Annual Real
Lossess Pipeline and Asset Management:
(CARL) Selection, Installation,
Maintenance, Renewal,
Replacement
Figure 9: The 4 Components Approach to Management of Real Losses
• Water balance – standard components of demand for a top down water balance that requires leakage, minimum night
flow estimates, demand types and equivalent volumes for metered / non-metered and residential / non-residential
customers
• Network data – pipe length (by type and material), number of billed properties, number of service connections, service
connections by material type, average zonal pressure (AZP), average zonal night pressure (AZNP)
• Burst data – reported bursts and unreported bursts (number and type of reported bursts, typical run times categorised
by type), including cost and frequency of ALC for unreported bursts, burst flow rates, natural rate of rise of bursts
As an alternative the Snapshot ILI was developed by the IWA Water Loss Group to assist water authorities to target zones
for Active Leakage Control (ALC) interventions. The snapshot ILI is a function of the night leakage rate (MNF – legitimate
use) divided by the UARL, it provides a simpler approach for targeting ALC across water supplies. Figure 10 shows the
components required to calculate the snapshot ILI.
Sustainable Water Management Plan • 2180.00
Average Zone Night Pressure P0
70.00
60.00
Average Zone Pressure in m.
50.00
40.00
Exceptional Customer Night Use
Night
30.00 Consumption
Assessed Customer Night Use and Leakage
20.00
Night Reported & Unreported Bursts (pressure dependant)
10.00 Leakage
UARL Rate
(m3/hr) Background Leakage
=IWA Unavoidable Background Leakage x ICF
0.00
00 to 01 01 to 02 02 to 03 03 to 04 04 to 05 05 to 06 06 to 07
Figure 10: Snapshot ILI
The ILI can be used to categorise performance in real losses into one of four bands, as shown in Table 7.
MNF calculations are reliant on estimating the legitimate night usage in order to define the level of leakage.
Band ILI Range Guideline Description
AWaipawa Pōrangahau
Water Supply Waipukurau Takapau Kairakau
- Otāne - Te Paerahi
System Input - AD 4,277 1,872 378 151 24
System Input - PD 6,130 3,770 686 399 42
Total Length of mains (km) 79.1 77.0 16.4 16.2 3.3
Total number of connections 2,173 1,254 272 243 84
AZP (m) 64 65 18 40 17
AZNP (m) 65.7 66.0 18.4 40.8 17.3
Min Night Flow (m³/hr) 72.0 41.8 5.4 4.9 1.7
Including Unavoidable Annual Real Losses
10.8 7.8 0.5 1.0 0.2
(UARL) (m³/hr)
Legitimate Usage - 4L/conn/hr (m³/hr) 8.7 10.0 2.2 1.9 0.7
Total Leakage Rate (m³/hr) 63.3 31.7 3.3 2.9 1.0
Average Day Use (L/conn/day) 1,269 886 1,102 333 -2
Average Day Use (L/person/day)
453 316 394 119 -
*assume occupancy rate of 2.8
Peak Day Use (L/conn/day) 2,122 2,399 2,234 1,354 212
Total Leakage (L/prop/day) 699.2 607.2 288.0 288.0 288.0
Table 8: Snapshot ILI Parameters
It should be noted that the negative average day use for the Kairakau water supply is due to all customers having rainwater
tanks which are supplemented by the Council’s water supply. The estimated ILI and predicted band for the CHBDC water
supplies is presented in Table 9.
Water Supply Snapshot Band Confidence Key Assumptions and Data Limitations
ILI
Waipukurau 6.7 C Average System input based on average day demand from 5 years of historical daily totals. No.
of connections obtained from 2018 AMP figures. Length of mains based on GIS. MNF
obtained from hydraulic model.
Waipawa- Otāne 5.3 C Average System input based on average day demand from 5 years of historical daily totals. No.
of connections obtained from 2018 AMP figures. Length of mains based on GIS. MNF
obtained from hydraulic model.
Takapau 11.6 D Low System input based on average day demand from 5 years of historical daily totals, of
which for 1-year restrictions were in place. No. of connections obtained from 2018 AMP
figures. Length of mains based on GIS. MNF estimated based on similar NZ water supplies
using a ‘per connection’ approach. AZP derived from average static head estimate using
approximate elevations at pump station / reservoir and across water supply.
Pōrangahau 5.0 C Low System input based on average day demand from 5 years of historical daily totals, of
-Te Paerahi which 1-year restrictions were in place. No. of connections obtained from 2018 AMP
figures. Length of mains based on GIS. MNF estimated based on similar NZ water supplies
using a ‘per connection’ approach. AZP derived from average static head estimate using
approximate elevations at pump station / reservoir and across water supply.
Kairakau 10.2 D Low System input based on monthly totals from 2 years of historical data, both of which
restrictions were in place. System input based on average day demand from 3 years
of historical daily totals. No. of connections obtained from 2018 AMP figures. Length
of mains based on GIS. MNF estimated based on similar NZ water supplies using
a ‘per connection’ approach. AZP derived from average static head estimate using
approximate elevations at pump station / reservoir and across water supply.
Table 9: Estimated ILI for CHBDC Water Supplies
Observations - Leakage
• The snapshot ILI estimates indicate that there is opportunity for Council to implement strategic leakage
management and active leakage control across all the water supplies.
• At the same time Council should focus on improving the overall understanding and confidence in the key
parameters that underpin successful leakage management – data improvement areas include billing information,
number and type of customers, metered and non-metered customers.
Sustainable Water Management Plan • 23New Zealand Benchmarking
The Infrastructure leakage index is a non-dimensional performance indicator used for comparing the operational
management of real water losses. It is the ratio of Current Annual Real Losses to Unavailable Annual Real Losses.
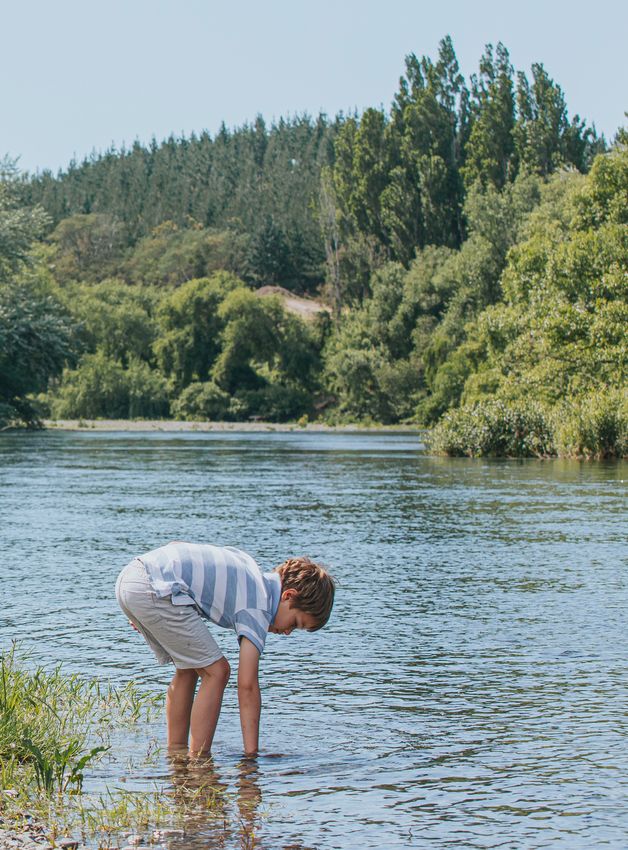
Figure 11 shows the Average daily residential water use (Litres/person/day). Bars are colour coded according
to the proportion of the network that has residential water metering.
Figure 11: Average Daily Residential Demand (Litres/person/day)
Sustainable Water Management Plan • 24Figure 12 shows the Infrastructure Leakage Index (sourced Water New Zealand – Residential Water Efficiency)
Figures shown on bars, have been colour scaled based on levels of residential metering, as this affects the
accuracy of water loss calculations.
Figure 12: ILI FY2019 (Average system pressure, in m head, represented by red dots)
Average daily residential water use (Litres/person/day). Bars are colour coded according to the proportion of the
network that has residential water metering.
Observations – Benchmarking
• Water consumption and leakage rates vary considerably throughout New Zealand. Those supplies with residential
metering typically have the lowest average daily residential usage and ILI, which clearly highlights the benefits of
residential customer metering.
• The benefits from pressure management are unclear from the data provided, however the use of other metrics such
as burst frequency (number of mains breaks) will likely provide a more informative measure with benefits such as a
reduction in breaks, and a reduction in demand and water loss.
• Tauranga and Nelson City Councils have seen a reduction in residential consumption toCurrent Approach
Current Sustainable • Ensuring ‘planning for tomorrow’ is considered as part
of ‘future-proofing’ and undertaking ‘environmentally
Management Practices responsible’ decision making.
Engagement and Public Education Council also undertakes a public education programme
In 2016 Council implemented a new consultation focused at a school level throughout the District. Year 3
through to Year 8 children participate in a water awareness
and engagement activity called Project Thrive.
programme in the classroom and are provided with water
The aim of Project Thrive was to increase visibility
education and water conservation information brochures.
of Council’s strategic direction and aspirations for
the District to the community, and thereby support
decisions on investment into infrastructure.
One of the key focus areas in this engagement for
Council was elevating the importance of water for the Our vision for Central Hawke’s Bay is a proud and prosperous district made
up of strong communities and connected people who respect and protect
future of the District. Council has continued to invest in our environment and celebrate our beautiful part of New Zealand.
Together we thrive!
raising the profile of investment decisions in three waters
infrastructure through their #bigwaterstory, which included Our Strategic Direction
for Central Hawke’s Bay
seeking feedback from the community on support for the
capital works delivery programme. What we know What we stand for
– Our DNA - - Our Values -
Our values capture who we are and
what matters most to us. They are the
attitudes we embrace as individuals,
teams and as a whole organisation.
We are all personally responsible for
WORKING CUSTOMER THINKING acting with these in mind.
TOGETHER EXCELLENCE SMARTER
Central Hawke’s Bay will The communities we serve We need to think smarter
be stronger when we work are our customers. and better in everything T TRUST – We create trust by acting with integrity.
together. Partnerships and They are at the heart of we do. With a culture of H HONESTY – We do what is right even when no one is looking.
collaboration are at the core our decisions, interactions innovation and continuous R RESPECT – We have respect for each other, our community and our stakeholders.
of everything we do. and communication. improvement we will add
I INNOVATION – We find smarter ways to do things to produce improved and sustainable results.
We’ll engage with our value to our communities.
customers to deliver value V VALUING PEOPLE – We are one team, supporting each other to succeed.
and exceed expectations. E EXCELLENCE – We deliver exceptional results.
ud of
#bigwaterstory will continue to be an important tool What we’re most pro Why we do what we do
-
for Council as part of establishing further improvement - Our Greatest Asset – Our Purpose -
measures, undertaking investigations and implementing People are our greatest asset.
At Central Hawke’s Bay District
It’s our goal to create an environment
that supports a thriving Central
demand management strategies to underpin the future Council we are committed to providing
a safe and great place to work that
Hawke’s Bay district, by providing
efficient and appropriate infrastructure,
values diversity and inclusion, services and regulatory functions.
approach to sustainable water management in the District: and develops skilled people who can
lead our community to thrive.
outcomes
• Incorporating ‘smart growth’ into the objectives for How we’ll reach our
The outcomes we wan
t to achieve
- Our Focus -
the management of the water supplies. - Our Objectives - • Promoting smart growth.
• Developing clear ‘road maps’ for water activities so • A proud district.
• Attracting and enabling
business success.
• A prosperous district.
that both communities and Council are clear on the
• Strengthening our district and
• Strong communities. community identity.
• Connected citizens. • Protecting and promoting our
priorities and directions. •
•
Smart growth.
Environmentally responsible.
unique landscape.
• Planning for tomorrow to future-
• Durable infastructure. proof Central Hawke’s Bay.
Observations – Engagement
Council have set up a responsive and collaborative engagement tool through Thrive and the #Big Water Story. These
activities are already seeing the benefits of an elevated and transparent messaging to the community on why certain
decisions are being made for the water supplies. It is recommended that the improvements and action plan identified
in this Plan are presented to the community using the Thrive and #bigwaterstory engagement platforms so that the
community can understand why it is important for Council to continue to invest in infrastructure and sustainable
management activities for the water supplies.
Sustainable Water Management Plan • 26Plans and Policies
Council has several plans and policies that include provisions for the promotion of sustainable water
management practices. These include the District Plan, Water Services Bylaw, Long Term Plan,
Environmental and Sustainability Strategy and the Engineering Code of Practice.
As well as seeking to ensure that future development In terms of demand management 708.7.3 of the Water
is appropriately accommodated for, the District Plan’s Bylaw currently states that “The customer shall comply
intention is to underpin the Resource Management with any restrictions which may be required by Council to
Act requirements by encouraging sustainable water manage high seasonal or other demands. Such restrictions
management of the district’s sources. For example: shall be advised by public notice. Even when such
restrictions apply Council shall take all practicable steps to
• The resource consents relating to Council’s taking of
ensure that an adequate supply for domestic purposes is
water are considered as part of district wide matters
provided to each point of supply”.
and activities.
• Part C Section 6 of the draft 2019 District Plan sets In terms of emergency restrictions 708.7.4 of the Water
out the use of water efficient landscaping / planting Bylaw currently states that “During an emergency Council
and water saving devices for developments. may restrict or prohibit the use of water for any specified
purpose, for any specified period, and for any or all of its
• Part D Section 15 of the draft 2019 District Plan outlines
customers. Such restrictions shall be advised by public
that Council is required to manage the effect of the
notice. Council may enact penalties over and above those
operation, maintenance and upgrading / development
contained in these conditions to enforce these restrictions.
of the water supplies on the environment, whilst
The decision to make and lift restrictions, and to enact
balancing the social, cultural and economic wellbeing
additional penalties, shall be made by Council or any officer
of the communities.
authorised to exercise the authority of Council”.
Council’s Water Bylaw 2018 is made under the authority
of the Local Government Act 2002, and Council can: In terms of flow meter installation 708.12 .1 of the Water
Bylaw currently states that “Meters for on demand
• Erect, construct, and maintain any public work, supplies, and restrictors for restricted flow supplies, shall
which in the opinion of the Council may be necessary be supplied, installed and maintained by Council, and shall
or beneficial to the District remain the property of Council. Where on demand supplies
• Consult with communities are not universally metered, Council where it considers
• Complete assessments of water services within water use is unusually high, reserves the right to fit a meter
the District at the customer’s cost, and charge accordingly”.
• May make bylaws with regards to water services
within the District.
Observations – Policies and Plans
The current source capacity versus demand assessments in this Plan indicate that there is capacity between
consented water volumes and forecasted growth projections for the water supplies. However, it is likely as consents
come up for renewal that further conditions could be imposed as a result of increased scrutiny on the impact of
climate change on local river flows, the need for sustainable water management practices to be implemented and
freshwater management objectives. A review is needed on how best to integrate demand management targets (e.g.
leakage reduction, per property consumption, customer metering) into Council’s policies such as the District Plan and
Long-Term Plan with further support via the water bylaw. By building in some achievable targets over the next 10 years
this would help offset any constraints that come from the reduction in consented take volumes and allow the District’s
economy to continue to grow.
Sustainable Water Management Plan • 27Conserve Water Measures
Historically Council have had to put in sustainable water measures (restrictions) due to river
levels falling below the trigger levels for demand management to apply.
Restrictions are set at four levels as detailed in Table 10:
Sustainable Water Measure Detail Levels
LEVEL 1 – PLEASE CONSERVE WATER AT ALL TIMES
LEVEL 2 – SPRINKLERS AND HOSES ON ALTERNATIVE DAYS
• Even numbered houses on even days of the month
(i.e. if you live at number 10, you may use a sprinkler or hose on the 2nd, 4th, 6th... of the month)
• Odd numbered houses on odd days of the month
(i.e. if you live at number 11, you may use a sprinkler or hose on the 1st, 3rd, 5th... of the month)
Watering gardens:
• Odds and evens apply (odd numbered houses on odd days of the month and even numbered houses on even days)
• Sprinklers can only be used for 1 hour, before 9am and after 5pm
• Hoses fitted with a trigger nozzle can be used before 10am and after 4pm and cannot be left running unattended
• Watering cans and buckets permitted
• Washing of vehicles and/or buildings
• Washing of vehicles and/or buildings permitted only with a hose fitted with a trigger nozzle
• Swimming pools - permitted to top up swimming pool or spa
• Hard surfaces - no hosing of hard surfaces as part of general cleaning. Spot cleaning permitted
for health, safety or emergency reasons only
LEVEL 3 - WATERING GARDENS
• Odds and evens apply (odd numbered houses on odd days of the month and even numbered houses on even days)
• Sprinklers are not permitted at any time.
• Hoses fitted with a trigger nozzle can be used before 10am and after 4pm and cannot be left running unattended
• Watering cans and buckets permitted
• Washing of vehicles and/or buildings
• Washing of vehicles and/or buildings permitted only with a bucket and sponge, or at a commercial carwash
Swimming pools - permitted to top up a pool or spa using a hose fitted with a trigger-nozzle, watering can or bucket for a maximum
of 15 minutes per day
Hard surfaces - no hosing of hard surfaces as part of general cleaning. Spot cleaning permitted for health, safety or emergency reasons only
LEVEL 4 - NO OUTDOOR USE, EXCEPT IN THE CASE
OF AN EMERGENCY
Table 10: Current Council Sustainable Water Measures
Sustainable Water Management Plan • 28You can also read