Town of Innisfil 2021 Community Profile
←
→
Page content transcription
If your browser does not render page correctly, please read the page content below
Town of Innisfil
                                                         2021 Community Profile

                                    V 2.0
                                Septemer 2019
                            © 2019 Town of Innisfil

Information in this document is subject to change without notice. Although all data is
believed to be the most accurate and up-to-date, the reader is advised to verify all data
before making any decisions based upon the information contained in this document.

For further information, please contact:
Economic Development Office
Town of Innisfil
2101 Innisfil Beach Road
Innisfil, ON | L9S 1A1

Phone: 705-436-3710

                                           innisfil.ca
Town of Innisfil
                                                         2021 Community Profile

                                           V 1.0
                                   March 2021
                              © 2021 Town of Innisfil

Information in this document is subject to change without notice. Although all
data is believed to be the most accurate and up-to-date, the reader is advised
to verify all data before making any decisions based upon the information
contained in this document.

For further information, please contact:

Economic Development Office
Town of Innisfil
2101 Innisfil Beach Road
Innisfil, ON
L9S 1A1
Phone: 705-436-3710
Email: business@innisfil.ca

                                           innisfil.ca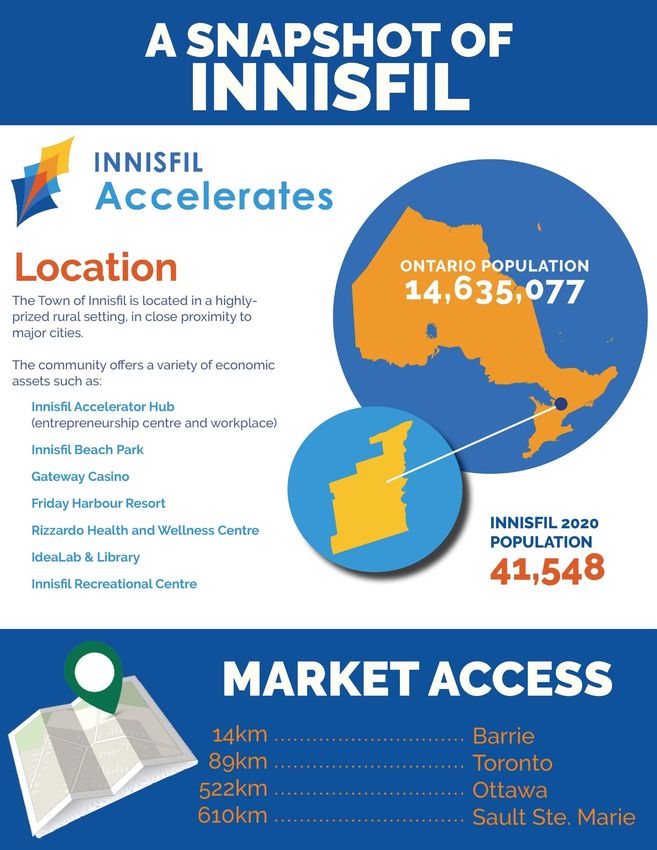
Town of Innisfil
                                                                                            2021 Community Profile

Table of Contents
DATA SOURCES................................................................................................................................1
INTRODUCTION ................................................................................................................................2
               Location....................................................................................................................................... 3
               Climate ........................................................................................................................................ 5
DEMOGRAPHICS .............................................................................................................................7
               Population Size and Growth ...................................................................................................... 7
               Age Profile ................................................................................................................................... 8
               Income ...................................................................................................................................... 10
               Mobility Characteristics ............................................................................................................ 12
               Language Characteristics ....................................................................................................... 13
               Level of Education.................................................................................................................... 14
LABOUR FORCE .............................................................................................................................18
               Key Indicators............................................................................................................................ 18
               Labour Force by Occupation ................................................................................................. 19
               Labour Force by Industry ......................................................................................................... 21
               General Wages by Occupation ............................................................................................. 23
               Largest Employers ..................................................................................................................... 25
               Place of Work ............................................................................................................................ 27
TRANSPORTATION AND SHIPPING ...............................................................................................29
               Highways ................................................................................................................................... 29
               Rail Services ............................................................................................................................... 31
               Airports ....................................................................................................................................... 32
               Ports............................................................................................................................................ 33
TAXES AND UTILITIES ......................................................................................................................34
               Local Property Tax Rates .......................................................................................................... 34
               Federal and Provincial Income Tax Rates .............................................................................. 34
               Water/Wastewater and Waste Management ...................................................................... 36
               Electricity ................................................................................................................................... 38
               Natural Gas ............................................................................................................................... 40
PLANNING, AND DEVELOPMENT RELATED FEES ..........................................................................41
               Planning Related Fees/Charges ............................................................................................. 41
               Development Charges and Fees ........................................................................................... 43
BUSINESS SUPPORT PROGRAMS AND SERVICES .........................................................................44
               National and Provincial Support ............................................................................................. 44
               Local/Regional Support ........................................................................................................... 46
               Education and Training ............................................................................................................ 47
QUALITY OF LIFE ............................................................................................................................48
               Housing Characteristics ........................................................................................................... 48
               Social and Community Services ............................................................................................. 49
               Education .................................................................................................................................. 50
               Recreational Facilities .............................................................................................................. 51
               Events ......................................................................................................................................... 52
               Local Media .............................................................................................................................. 53
               Communications Infrastructure ............................................................................................... 55
APPENDIX – PROVINCIAL AND FEDERAL FUNDING/INCENTIVES ..............................................57

                                                                       innisfil.ca
Town of Innisfil
                                                                                           2021 Community Profile

List of Tables
Table 1: Innisfil, Average Temperature (°C), 1981-2010 ............................................................................. 5
Table 2: Census Population Change ................................................................................................................ 7
Table 3: Age Distribution, 2020 ..................................................................................................................... 9

Table 4: Total Individual Income Levels, 2020 ........................................................................................... 10
Table 5: Mobility Rates, 2020 ....................................................................................................................... 12
Table 7: Knowledge of Official Languages, 2020 ..................................................................................... 13
Table 7: Most Common Non-Official Languages Spoken, 2020 ............................................................. 13

Table 8: Educational Attainment, Innisfil, 2020 - 2029 .............................................................................. 15
Table 9: Major Field of Study, Population Aged 15 Years or Older, 2020 ............................................... 17
Table 11: Labour Force Characteristics, 2020 ........................................................................................... 18
Table 12: Labour Force by Occupation, 2020 .......................................................................................... 20

Table 13: Labour Force by Industry, 2020 .................................................................................................. 22
Table 14: General Wages by Occupation, 2020 ...................................................................................... 23
Table 15: Largest Private Sector Employers ............................................................................................... 25
Table 16: Largest Public Sector Employers ................................................................................................ 26

Table 17: Where the Innisfil Resident Labour Force Works, 2016 ............................................................. 27
Table 18: Place of Residence for Persons Working in Innisfil, 2016 .......................................................... 28
Table 19: Distance to Urban Centres ......................................................................................................... 29
Table 20: Distance to Major US Border Crossings ...................................................................................... 30

Table 21: Regional Airports ......................................................................................................................... 32
Table 22: Regional Ports .............................................................................................................................. 33
Table 23: Local Property Tax Rates, 2020 .................................................................................................. 34
Table 24: Combined Corporate Taxes – General Corporation (2020/2021) ......................................... 34
Table 25: Corporate Taxes – Canadian Controlled (2020/2020) ............................................................ 35

Table 26: Personal Income Tax, 2020-2021 ................................................................................................ 35
Table 27: Sales Tax ....................................................................................................................................... 36
Table 28: Water and Sewer Charges, 2019 ............................................................................................... 36
Table 29: Landfill and Tipping Fees ............................................................................................................ 37

Table 30: Electricity Rates, 2021 .................................................................................................................. 38
Table 31: Natural Gas Rates, Commercial and Industrial, January 2021 ............................................... 40
Table 32: Land Use Planning Fees .............................................................................................................. 41
Table 33: Area Specific Development Charge, Effective July 1, 2020 ................................................... 43

                                                                      innisfil.ca
Town of Innisfil
                                                                                             2021 Community Profile

Table 34: National and Provincial Business Support Organizations ........................................................ 44

Table 35: Local Business Support ................................................................................................................ 46
Table 36: Dwelling Characteristics, 2020 ................................................................................................... 48
Table 37: Social and Protective Services ................................................................................................... 49
Table 38: Primary and Secondary Schools ................................................................................................ 50

Table 39: Radio ............................................................................................................................................ 53
Table 40: Television ...................................................................................................................................... 53
Table 41: Print ............................................................................................................................................... 53
Table 42: Online ........................................................................................................................................... 54
Table 43: Monthly Print ................................................................................................................................ 54

Table 44: Communications Infrastructure ................................................................................................. 55

List of Figures
Figure 1: Innisfil Location Map ...................................................................................................................... 3
Figure 2: Transportation Corridor, GTA and the County of Simcoe .......................................................... 4
Figure 3: Innisfil, Temperature and Precipitation Averages, 1981-2010 .................................................... 5
Figure 4: Age Distribution Chart, 2020 ............................................................................................................ 8

Figure 5: Employment Income Levels, 2020 .............................................................................................. 11
Figure 6: Household Income Levels, 2020 ................................................................................................. 11
Figure 7: Educational Attainment, Age Group 25-64............................................................................... 14

Figure 8: Major Field of Study, Population Aged 15 Years or Older, 2020 .............................................. 16
Figure 9: Labour Force by Occupation, 2020 ........................................................................................... 19
Figure 10: Employment by Sectors, 2020 ................................................................................................... 21
Figure 11: Structure type by occupied dwelling, 2020............................................................................. 48

                                                                        innisfil.ca

Town of Innisfil
2021 Community Profile
DATA SOURCES
Please note that every effort has been made to use the
most current data available. The major sources of
information for this document are:
2006, 2011, and 2016 Census from Statistics Canada;
Manifold SuperDemographics data is 2020 from
Manifold Data Mining Inc.
The most recent Census was conducted in May 2016. SuperDemographics
2020 is the most up-to-date estimation of population characteristics, based
on mathematical models that draw from various data sources.
Manifold Projection Method
Manifold estimates demographic data annually, including population
projections for 5 and 10 years in the future. Manifold methodologies are
based on the following techniques:
Enhanced cohort survival methods;
Nearest neighbourhood and regression techniques; and
Structural coherence techniques.
Manifold Data Sources include:
Statistics Canada Real Estate Boards/Companies
Health Canada Canadian Bankers Association
Regional Health Ministries Bank of Canada
Citizenship and Immigration Canada Canada Post Corporation
Consumer and business directories
Regional School Boards
books
Proprietary survey and research Flyer Distribution Association
Publications of hospitals, CMHC, BBM and partners
|1
innisfil.ca
Town of Innisfil
                                                             2021 Community Profile

              INTRODUCTION

              Innisfil offers the best of all worlds!
              The Town of Innisfil has many of the characteristics of a
              small lakeside community while providing the amenities
              of a larger urban centre. Just 45 minutes north of
              Toronto, Innisfil offers prime access to major markets
              through a variety of transportation options. Innisfil offers development
              opportunities, a diversity of housing options, and is home to a strong local
              workforce.

              Innisfil Heights Strategic Settlement Employment Area
              Innisfil Heights is an area of approximately 1,000 acres, consisting of a wide
              range of industrial, commercial, and tourism-based land uses on a range of
              lot sizes. It is a gateway into the Town of Innisfil and County of Simcoe that is
              bisected by Highway 400, providing high visibility and ideal access to a high
              volume of users.
              To find out more about opportunities in Innisfil and Innisfil Heights, please see
              business.innisfil.ca or contact the Economic Development Office.

                                              |2
innisfil.ca
Town of Innisfil
2021 Community Profile
Location
Innisfil is a town in Ontario, Canada, located on the western
shore of Lake Simcoe in Simcoe County, immediately south of
Barrie and 80 kilometres north of Toronto.
With ease of access from the major 400 series Highways, the
Town is situated just 45 minutes north of Toronto and the
Greater Toronto Area (GTA) and five hours west of Ottawa.
Figure 1: Innisfil Location Map
Source: Google Maps, McSweeney & Associates, 2019
|3
innisfil.caTown of Innisfil
2021 Community Profile
The town includes, within its borders, Highway 400 and Highway 27, providing
access to the GTA in the south, and Highway 89 which provides access to the
counties of Simcoe, Dufferin and Grey Bruce to the west.
The map below illustrates highway and GO Transit commuter access routes
to Toronto and the GTA, Barrie and Simcoe County.
Figure 2: Transportation Corridor, GTA and the County of Simcoe
|4
innisfil.caTown of Innisfil
2021 Community Profile
Source: Town of Innisfi
Climate
Innisfil derives its climatic data (normal and averages) from the
Environment Canada staffed Barrie Weather Station. Table 1
and Figure 3 illustrate precipitation levels, average and
extreme temperatures.
Table 1: Innisfil, Average Temperature (°C), 1981-2010
Temp. (°C) Jan Feb Mar Apr May Jun Jul Aug Sep Oct Nov Dec
Daily
-7.7 -6.6 -2.1 5.6 12.3 17.9 20.8 19.7 15.3 8.7 2.7 -3.5
Average
Daily
-2.9 -1.5 3.2 11 18.1 23.6 26.3 25.1 20.7 13.5 6.5 0.4
Maximum
Daily
-12.4 -11.7 -7.4 0.2 6.5 12.3 15.3 14.3 10 3.9 -1 -7.3
Minimum
Extreme
14 14 24 30.5 35 35 36 36.5 34.5 30 21.5 19.5
Maximum
Extreme
-35 -33 -30.5 -15 -4 1 6 0 -1.5 -6.5 -19.5 -33
Minimum
Source: Environment Canada, Station. Temperature and Precipitation Graph for 1981 to 2010 Canadian
Climate. Weather Station: BARRIE. http://bit.ly/2l0ZIvW
Figure 3: Innisfil, Temperature and Precipitation Averages, 1981-2010
Precipitation (mm) Daily Average (°C) Daily Maximum (°C) Daily Minimum (°C)
30 100
25 90
20 80
70
15
Precipitation (MM)
Temperature (°C)
60
10
50
5
40
0
30
-5 20
-10 10
-15 0
JAN FEB MAR APR MAY JUN JUL AUG SEP OCT NOV DEC
Source: Environment Canada, Barrie Weather Station. * This station meets WMO standards for temperature.
http://bit.ly/2l0ZIvW
|5
innisfil.caTown of Innisfil
2021 Community Profile
|6
innisfil.caTown of Innisfil
2021 Community Profile
DEMOGRAPHICS
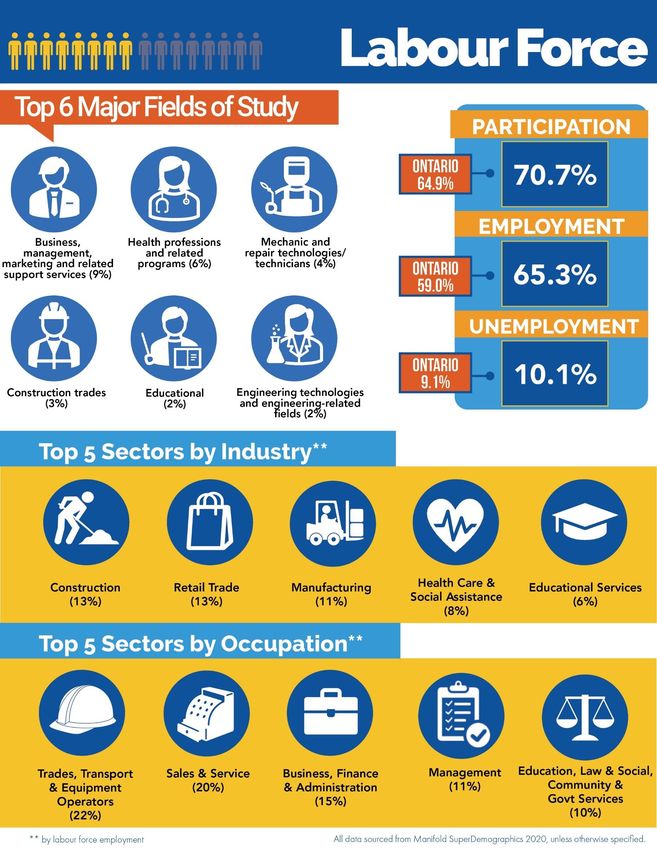
Population Size and Growth
Between 2006 and 2016, the census population in Innisfil
grew from 31,175 to 36,566 (see Table 2), which is
approximately 17.3 % growth over 10 years. The remainder
of the document uses Manifold 2020 demographic and
labour force data estimates.
Table 2: Census Population Change
Population 2001 2006 2011 2016 2020* 2025* 2030*
Innisfil 28,666 31,175 32,727 36,566 41,548 45,778 50,026
% Change 16.0% 8.8% 5.0% 11.7% n/c 10.2% 9.3%
2001 2006 2011 2016 2020* 2025* 2030*
Ontario 11,410,046 12,160,282 12,851,821 13,448,494 14,635,077 15,489,765 16,338,605
% Change 6.1% 6.6% 5.7% 4.6% n/c 5.8% 5.5%
Source: Statistics Canada Census Profiles 1996, 2001, 2006, 2011, 2016 and Manifold SuperDemographics
2020
* = Estimates, n/c = not comparable
The Town of Innisfil is expected to grow faster than the province over the next
five years, with 10.2% population growth projected for Innisfil, compared to
5.8% for Ontario.
17.3 %
population growth over last 3 census periods!
|7
innisfil.caTown of Innisfil
2021 Community Profile
Age Profile
Figure 4 illustrates changes to Innisfil’s population by
age, over the past 15 years.
The town has had strong growth in population ages
60 to 79. However, the largest percentage growth
over the past 15 years came from persons between
the ages of 25 to 39.
Figure 4: Age Distribution Chart, 2020
0 to 19 20 to 39 40 to 59 60 to 79 80 +
3% 3% 4%
13% 18% 20%
27%
31% 28%
19%
23% 25%
23% 24% 22%
2006 2016 2020*
Source: McSweeney & Associates from Manifold Data Mining Inc. SuperDemographics 2020.
|8
innisfil.caTown of Innisfil
2021 Community Profile
Table 3 shows 2020 population estimates by age group. It compares the
percentage of the total population by age group against that of Ontario.
Table 3: Age Distribution, 2020
Characteristics Innisfil Innisfil Ontario
Total Population 41,548 100.0% 14,635,077
0 to 4 years 1,926 4.6% 5.0%
5 to 9 years 2,284 5.5% 5.2%
10 to 14 years 2,397 5.8% 5.4%
15 to 19 years 2,589 6.2% 5.8%
Median Age: 20 to 24 years 2,829 6.8% 6.9%
42 vs 41 in 25 to 29 years 2,491 6.0% 7.0%
Ontario 2,460 5.9% 6.9%
30 to 34 years
Average Age: 35 to 39 years 2,668 6.4% 6.7%
41 vs 41 in 40 to 44 years 2,585 6.2% 6.3%
Ontario 2,746 6.6% 6.3%
45 to 49 years
50 to 54 years 2,925 7.0% 6.6%
55 to 59 years 3,504 8.4% 7.3%
60 to 64 years 3,017 7.3% 6.5%
65 to 69 years 2,255 5.4% 5.5%
70 to 74 years 1,857 4.5% 4.6%
75 to 79 years 1,369 3.3% 3.2%
80 to 84 years 862 2.1% 2.2%
85 years and over 786 1.9% 2.6%
Source: McSweeney & Associates from Manifold Data Mining Inc. SuperDemographics 2020.
|9
innisfil.caTown of Innisfil
2021 Community Profile
Income
Table 4 shows the breakdown of total individual incomes in
20201. The median individual income was slightly higher than in
the province. Most recently, since 2020, the average individual
income level in Innisfil surpassed that of Ontario. A smaller
percentage of the Innisfil population (66%) has total income
levels below $50,000, compared to Ontario (67%).
Table 4: Total Individual Income Levels, 2020
Characteristic Innisfil Innisfil Ontario
Total population 15 years and over 34,942 100.0% 100.0%
Without total income 1,441 4.1% 4.4%
With total income 33,500 95.9% 95.6%
Under $10,000 (including loss) 4,005 11.5% 13.5%
$10,000 to $19,999 5,352 15.3% 16.2%
$20,000 to $29,999 4,752 13.6% 13.0%
$30,000 to $39,999 3,895 11.1% 10.5%
$40,000 to $49,999 3,429 9.8% 9.3%
$50,000 to $59,999 2,930 8.4% 7.5%
$60,000 to $69,999 2,258 6.5% 5.9%
$70,000 to $79,999 1,813 5.2% 4.5%
$80,000 to $89,999 1,462 4.2% 3.6%
$90,000 to $99,999 1,080 3.1% 3.1%
$100,000 and over 2,524 7.2% 8.5%
Characteristic Innisfil Ontario
Median total income $ $39,159 $37,377
Average total income $ $52,483 $53,382
Source: McSweeney & Associates from Manifold Data Mining Inc. SuperDemographics 2020 *(2019
incomes).
In 2020, Innisfil had a slightly higher median employment income (by 9%) than
Ontario (see Figure 5 below). The average employment income in Innisfil was
6% lower compared to the provincial figure.
The average employment income for males is 47% higher than for females in
Innisfil. In comparison, there is a 41% male-female average employment
income disparity in Ontario.
1Please note that the 2020 Manifold data uses 2019 income data, as it is the most recent information
available.
| 10
innisfil.caTown of Innisfil
2021 Community Profile
Figure 5: Employment Income Levels, 2020
Median employment income ($)
Average employment income ($)
$59,803
$56,777
$51,376
$50,937
$48,114
$42,323
$41,993
$39,266
$38,508
$36,112
$31,035
$30,370
M AL E F E M AL E T O T AL M AL E F E M AL E T O T AL
INNISFIL O N T AR I O
Source: McSweeney & Associates from Manifold Data Mining Inc. SuperDemographics 2020 (2019
incomes)
Figure 6 demonstrates that the median and average household income
levels are higher in Innisfil than in Ontario. A larger percentage of households
in Innisfil enjoy income levels over $100,000.
Figure 6: Household Income Levels, 2020
Innisfil % Ontario %
33.7%
32.1%
31.3%
24.0%
22.1%
17.6%
10.4%
10.1%
10.0%
8.7%
UNDER $50,000 TO $100,000 $150,000 $200,000
$50,000 $99,999 TO $149,999 TO $199,999 AN D O V E R
Source: McSweeney & Associates from Manifold Data Mining Inc. SuperDemographics 2020 (2019
incomes).
| 11
innisfil.caTown of Innisfil
2021 Community Profile
Mobility Characteristics
Residents in Innisfil are equally likely to change their place of
residence once living in Innisfil, compared to the province,
as can be seen by the percentage of non-movers.
Estimates indicate those movers to Innisfil tend to be
relocating almost exclusively from within the province rather
than outside of Ontario or Canada (Table 5).
Table 5: Mobility Rates, 2020
Characteristics Innisfil Innisfil % Ontario%
Mobility status – place of residence year ago
Total population 41,101 100.0% 100.0%
Non-movers2 36,315 88.4% 87.3%
Movers3 4,786 11.6% 12.7%
Non-migrants4 1,398 3.4% 7.3%
Migrants5 3,389 8.2% 5.4%
Internal migrants 3,298 8.0% 4.2%
Intra-provincial migrants 3,168 7.7% 3.7%
Interprovincial migrants 130 0.3% 0.5%
External migrants 91 0.2% 1.2%
Mobility status – place of residence status five years ago
Total population 39,303 95.6% 95.8%
Non-movers 24,757 60.2% 59.6%
Movers 14,546 35.4% 36.1%
Non-migrants 4,250 10.3% 19.7%
Migrants 10,297 25.1% 16.4%
Internal migrants 9,987 24.3% 12.2%
Intra-provincial migrants 9,781 23.8% 10.8%
Interprovincial migrants 206 0.5% 1.4%
External migrants 310 0.8% 4.2%
Source: McSweeney & Associates from Manifold Data Mining Inc. SuperDemographics 2020.
2 Non-movers are persons who, on Census Day, were living at the same address as the one at which they
resided one year earlier.
3 Movers are persons who, on Census Day, were living at a different address from the one at which they resided
one year earlier.
4 Non-migrants are movers who, on Census Day, were living at a different address, but in the same census
subdivision (CSD) as the one they lived in one year earlier.
5 Migrants are movers who, on Census Day, were residing in a different CSD one year earlier (internal migrants)
or who were living outside Canada one year earlier (external migrants).
| 12
innisfil.caTown of Innisfil
2021 Community Profile
Language Characteristics
Table 7 indicates knowledge of Canada’s official
languages. Over 99% of residents in Innisfil speak English,
which is above the provincial figure. Only 0.7% of the
population speaks neither official language (versus 2.5%
in Ontario).
Table 6: Knowledge of Official Languages, 2020
Characteristics Innisfil Innisfil Ontario
Total population 41,548 100.0% 100.0%
English 39,240 94.4% 86.1%
French 5 0.0% 0.3%
English and French 2,025 4.9% 11.1%
Neither English nor French 278 0.7% 2.5%
Source: McSweeney & Associates from Manifold Data Mining Inc. SuperDemographics 2020.
Moreover, Table 7 illustrates the most common languages outside of the
official languages of Canada that are spoken in Innisfil.
Table 7: Most Common Non-Official Languages Spoken, 2020
Characteristics Innisfil Innisfil %
Total population with knowledge of non-official languages 6,752 100%
Italian 1,207 18%
Portuguese 809 12%
Spanish 786 12%
Russian 510 8%
Polish 446 7%
German 442 7%
Cantonese 236 3%
Dutch 194 3%
Hungarian 166 2%
Source: McSweeney & Associates from Manifold Data Mining Inc. SuperDemographics 2020.
| 13
innisfil.caTown of Innisfil
2021 Community Profile
Level of Education
Figure 7 illustrates educational attainment for residents ages
25 to 64. Approximately, 32% of the population has
completed only high school, while over 55% completed
postsecondary education.
University level was reached by 15% of the population,
10% of which corresponds to postsecondary education at
the Bachelor level.
Figure 7: Educational Attainment, Age Group 25-64
Innisfil Ontario
0% 10% 20% 30% 40%
13%
No certificate, diploma or degree
10%
32%
High school certificate or equivalent
24%
Apprenticeship or trades certificate 10%
or diploma 6%
College, or other non-university 29%
certificate or diploma 25%
University certificate, diploma or 15%
degree 35%
Source: McSweeney & Associates from Manifold Data Mining Inc. SuperDemographics 2020.
| 14
innisfil.caTown of Innisfil
2021 Community Profile
The following table breaks down educational attainment for residents in Innisfil
by the level of attainment today and projected level of attainment in 2029.
Unlike the previous figure, the table shows attainment for all persons 15 and
older to demonstrate the entire supply of skills. Note that some categories are
nested, and as such, they are separated by black lines. Attainment of
university certificates, diplomas or degrees at bachelor level or above are
poised to have the strongest growth in the community over the next 10 years.
Table 8: Educational Attainment, Innisfil, 2020 - 2029
Expected
Characteristics6 2020 2029
Change
Total population 15 and older 34942 41,342 18%
No certificate, diploma or degree 7176 8,133 13%
Secondary (high) school diploma or 11200 13,183 18%
equivalency certificate
Postsecondary certificate, diploma or degree 16565 20,026 21%
Apprenticeship or trades certificate or 3339 3,236 -3%
diploma
Trades certificate or diploma other than 1501 1,467 -2%
Certificate of Apprenticeship or Certificate of
Qualification
Certificate of Apprenticeship or Certificate 1838 1,769 -4%
of Qualification
College, CEGEP or other non-university 8583 11,108 29%
certificate or diploma
University certificate or diploma below 586 318 -46%
bachelor level
University certificate, diploma or degree at 4057 5,365 32%
bachelor level or above
Bachelor's degree 3077 4,171 36%
Degree in medicine, dentistry, veterinary 69 135 96%
medicine or optometry
Master's degree 527 843 60%
Earned doctorate 34 53 56%
Source: McSweeney & Associates from Manifold Data Mining Inc. SuperDemographics 2020.
6 By highest certificate, diploma or degree obtained may not add up to 100% due to nested categories
| 15
innisfil.caTown of Innisfil
2021 Community Profile
Figure 8 and Table 9 illustrate major fields of study of residents ages 15 years
and older. ‘Architecture, engineering and related technologies’ is the most
prominent field of study, with higher uptake in this field compared to the
province. This broad field of study group includes the following:
Architecture and related services
Engineering
Engineering technologies and engineering-related fields
Construction trades
Mechanic and repair technologies/technicians
Precision production
Figure 8: Major Field of Study, Population Aged 15 Years or Older, 2020
Innisfil % Ontairo %
0% 2% 4% 6% 8% 10% 12%
Business, management, marketing and related 8.8%
support services 10.6%
Health professions and related programs 6.3%
6.9%
Mechanic and repair technologies/technicians 3.6%
2.0%
Construction trades 3.4%
1.8%
Education 2.4%
3.2%
Engineering technologies and engineering- 2.2%
related fields 2.1%
Precision production 2.1%
1.1%
Visual and performing arts 1.6%
2.0%
Personal and culinary services 1.6%
1.7%
Family and consumer sciences/human 1.4%
sciences 1.3%
Security and protective services 1.4%
0.9%
Social sciences 1.3%
2.8%
Legal professions and studies 1.2%
1.1%
Computer and information sciences and 1.0%
support services 2.1%
Transportation and materials moving 0.9%
0.5%
| 16
innisfil.caTown of Innisfil
2021 Community Profile
Source: McSweeney & Associates from Manifold Data Mining Inc. SuperDemographics 2020.
Table 9: Major Field of Study, Population Aged 15 Years or Older, 2020
Expected
Major Field of Study 2020 2029
growth
Total population aged 15 years and over 34,942 41,343 18%
No postsecondary certificate, diploma or degree 18,143 21,336 18%
Architecture, engineering, and related 4,331 5,010 16%
technologies
Business, management and public administration 3,323 4,030 21%
Health and related fields 2,432 2,758 13%
Social and behavioural sciences and law 1,873 2,606 39%
Personal, protective and transportation services 1,379 1,764 28%
Education 839 926 10%
Visual and performing arts, and communications 707 815 15%
technologies
Humanities 706 856 21%
Mathematics, computer and information 437 343 -22%
sciences
Physical and life sciences and technologies 394 439 11%
Agriculture, natural resources and conservation 366 460 26%
Source: McSweeney & Associates from Manifold Data Mining Inc. SuperDemographics 2017.
| 17
innisfil.caTown of Innisfil
2021 Community Profile
LABOUR FORCE
Key Indicators
Innisfil is home to a labour force that is over 24,000 persons
strong. As illustrated in Table 11, the labour force
participation and employment rate are above that of
Ontario. The unemployment rate is higher than that of the
province but lower than that of the regional economy,
Barrie Census Metropolitan Area (CMA).
Table 10: Labour Force Characteristics, 2020
Characteristic Innisfil Barrie CMA Ontario
Total population aged 15 years and older 34,942 184,400 12,350,146
In the labour force7 24,697 129,200 8,017,579
Employed 22,196 113,600 7,286,079
Unemployed 2,500 15,600 731,500
Not in the labour force 10,245 55,200 4,332,567
Participation rate % 70.7 70.1 64.9
Employment rate % 63.5 60.6 59.0
Unemployment rate % 10.1 12.1 9.1
Source: McSweeney & Associates from Manifold Data Mining Inc. SuperDemographics 2020.
Note Barrie CMA data is from Statistics Canada. Table 14-10-0294-01 Labour force characteristics by
census metropolitan area, three-month moving average, seasonally adjusted and unadjusted, last 5
months
7Labour force - Refers to persons who were either employed or unemployed. Unemployed - Refers to
persons 15 years and over, excluding institutional residents, who, during the week (Sunday to Saturday)
prior to Census Day (May 16, 2006), were without paid work or without self-employment work and were
available for work and either:
(a) had actively looked for paid work in the past four weeks;
(b) were on temporary lay-off and expected to return to their job;
(c) had definite arrangements to start a new job in four weeks or less.
| 18
innisfil.caTown of Innisfil
2021 Community Profile
Labour Force by Occupation
Figure 9 and Table 12 illustrate Innisfil’s resident labour force
make up by occupation. Figure 9 illustrates the top 15
occupations of residents by 2-digit NOCS8 Codes.
Figure 9: Labour Force by Occupation, 2020
0% 5% 10% 15% 20% 25%
7 Trades, transport and equipment operators 22%
and related occupations 12%
6 Sales and service occupations 20%
20%
1 Business, finance and administration 15%
occupations 16%
0 Management occupations 11%
11%
4 Occupations in education, law and social, 10%
community and government services 12%
9 Occupations in manufacturing and utilities 5%
5%
3 Health occupations 5%
6%
2 Natural and applied sciences and related 4%
occupations 8%
8 Natural resources, agriculture and related 2%
production occupations 2%
5 Occupations in art, culture, recreation and 2%
sport 3%
Innisfil % Ontario %
Source: McSweeney & Associates from Manifold Data Mining Inc. SuperDemographics 2020.
8 Occupation data are produced according to the NOC 2011:
http://www.statcan.gc.ca/eng/subjects/standard/noc/2011/index
| 19
innisfil.caTown of Innisfil
2021 Community Profile
Table 12 presents a breakdown of the Town of Innisfil’s resident labour force by
major occupational grouping (1-digit NOCS code) in 2020, as well as the
projected breakdown and expected growth by 2029.
Table 11: Labour Force by Occupation, 2020
Expected
Characteristic 2020 2029
Growth
Total labour force 15 years and over 24,697 28,876 17%
Occupation - Not applicable 1,266 826 -35%
All occupations 23,430 28,050 20%
7 Trades, transport and equipment operators and
5,512 7,408 34%
related occupations
6 Sales and service occupations 4,878 6,164 26%
1 Business, finance and administration occupations 3,665 3,480 -5%
4 Occupations in education, law and social,
2,381 3,044 28%
community and government services
0 Management occupations 2,613 2,899 11%
9 Occupations in manufacturing and utilities 1,280 1,635 28%
3 Health occupations 1,139 1,319 16%
2 Natural and applied sciences and related
1,061 1,113 5%
occupations
8 Natural resources, agriculture and related
499 613 23%
production occupations
5 Occupations in art, culture, recreation and sport 402 375 -7%
Source: McSweeney & Associates from Manifold Data Mining Inc. SuperDemographics 2020.
| 20
innisfil.caTown of Innisfil
2021 Community Profile
Labour Force by Industry
Figure 10 illustrates the distribution of employment by
sectors in Innisfil. The largest employment sectors are
‘Construction’ (14%), ‘Retail trade’ (13%), and
‘Manufacturing’ (11%). These account for a larger
percentage of the labour force in Innisfil compared to
these same sectors in Ontario.
Figure 10: Employment by Sectors, 2020
Innisfil % Ontario %
23 Construction 13%
6%
44-45 Retail trade 13%
11%
31-33 Manufacturing 11%
9%
62 Health care and social assistance 8%
10%
61 Educational services 6%
8%
56 Admin and support, waste and remediation 5%
4%
48-49 Transportation and warehousing 5%
4%
54 Professional, scientific and technical services 5%
8%
91 Public administration 5%
6%
41 Wholesale trade 4%
4%
81 Other services (except public administration) 4%
4%
72 Accommodation and food services 4%
5%
52 Finance and insurance 3%
6%
53 Real estate and rental and leasing 2%
2%
51 Information and cultural industries 2%
2%
71 Arts, entertainment and recreation 2%
2%
11 Agriculture, forestry, fishing and hunting 2%
1%
22 Utilities 1%
1%
21 Mining, quarrying, and oil and gas extraction 0%
1%
55 Management of companies and enterprises 0%
0%
| 21
innisfil.caTown of Innisfil
2021 Community Profile
Source: McSweeney & Associates from Manifold Data Mining Inc. SuperDemographics 2020.
Table 12: Labour Force by Industry, 2020
Expected
Industry 9 2020 2029
Growth
Total labour force 15 years and over 2,4697 28775 17%
Industry - not applicable 1,266 824 -35%
All industries 23,430 27,951 19%
23 Construction 3,182 4,877 53%
44-45 Retail trade 3,142 3,758 20%
31-33 Manufacturing 2,702 2,839 5%
62 Health care and social assistance 2,072 2,868 38%
61 Educational services 1,441 1,781 24%
56 Administrative and support, waste 1,286 1,734 35%
management and remediation services
48-49 Transportation and warehousing 1,242 1,212 -2%
54 Professional, scientific and technical services 1,235 1,396 13%
91 Public administration 1,125 1,104 -2%
41 Wholesale trade 1,083 843 -22%
81 Other services (except public administration) 1,083 1,293 19%
72 Accommodation and food services 1,030 1,486 44%
52 Finance and insurance 740 679 -8%
53 Real estate and rental and leasing 499 523 5%
51 Information and cultural industries 428 542 27%
71 Arts, entertainment and recreation 419 394 -6%
11 Agriculture, forestry, fishing and hunting 383 346 -10%
22 Utilities 237 226 -5%
21 Mining, quarrying, and oil and gas extraction 69 -10 -114%
55 Management of companies and enterprises 33 60 82%
Source: McSweeney & Associates from Manifold Data Mining Inc. SuperDemographics 2020.
9North American Industry Classification System 2017:
http://www23.statcan.gc.ca/imdb/p3VD.pl?Function=getVD&TVD=118464
| 22
innisfil.caTown of Innisfil
2021 Community Profile
General Wages by Occupation
Below is a sampling of local wage rates of the highest paying
occupations (by median wage) for the closest and most
representative region available (Kitchener-Waterloo-Barrie
Region).
For a complete review of all wags by occupation see:
https://www.jobbank.gc.ca/wagereport/location/39328
Table 13: General Wages by Occupation10, 2020
Low Wage Median Wage High Wage
Category
($/hour) ($/hour) ($/hour)
Advertising, marketing and public 24.48 43.27 70.19
relations managers (0124)
Computer and information systems 39.23 51.92 72.12
managers (0213)
School principals and administrators of 42.31 53.46 68.04
elementary and secondary education
(0422)
Accommodation service managers (0632) 18.00 28.00 61.54
Health information management 21.90 27.41 33.00
occupations (1252)
General office support workers (1411) 14.25 19.00 28.85
Survey interviewers and statistical clerks 14.25 20.00 32.00
(1454)
Mechanical engineers (2132) 20.65 36.06 48.08
Registered nurses and registered 25.00 40.00 48.00
psychiatric nurses (3012)
Medical laboratory technicians and 18.00 27.40 41.00
pathologists' assistants (3212)
Family, marriage and other related 22.00 31.25 46.63
counsellors (4153)
Social policy researchers, consultants and 21.54 34.48 52.92
program officers (4164)
Program officers unique to government 30.00 46.25 61.54
(4168)
For more wage rates please visit:
10
www.jobbank.gc.ca/LMI_report_area.do?&area=29315&reportOption=wage
| 23
innisfil.caTown of Innisfil
2021 Community Profile
Low Wage Median Wage High Wage
Category
($/hour) ($/hour) ($/hour)
Audio and video recording technicians 17.97 27.58 40.97
(5225)
Financial sales representatives (6235) 15.00 24.00 37.98
Chefs (6321) 14.25 17.09 24.17
Bartenders (6512) 14.25 14.37 25.00
Sheet metal workers (7233) 17.75 28.00 40.30
Welders and related machine operators 18.00 24.25 32.50
(7237)
Telecommunications line and cable 17.00 26.44 40.00
workers (7245)
Heavy-duty equipment mechanics (7312) 17.50 28.73 41.97
Labourers in chemical products 14.79 20.50 37.79
processing and utilities (9613)
Source: Produced by Human Resources and Skills Development Canada's Labour Market Information
Service. Last updated December 2020.
| 24
innisfil.caTown of Innisfil
2021 Community Profile
Largest Employers
Tables 16 and 17 identify some of the largest private and
public employers by NAICS and employment level in Simcoe
County.
Table 14: Largest Private Sector Employers
# of Employees
Name NAICS
(approximate)
Honda of Canada Manufacturing 33611 4,300
Casino Rama Resort 72112 2,712
F&P Manufacturing 33635 846
Simcoe Parts Service Inc. 48412/49311 810
Napoleon/Wolf Steel Ltd. 33341 800
44112/ 52691/
Georgian International Limited 675
48121
Horseshoe Resort 72111 630
Raytheon ELCAN Optical Technologies 33461 600
Sinton Transportation 485110 589
Transcom North America 56143 490
Source: Simcoe Economic Development http://bit.ly/2pNz9fn
| 25
innisfil.caTown of Innisfil
2021 Community Profile
Table 15: Largest Public Sector Employers
# of Employees
Name NAICS
(approximate)
Simcoe County District School Board 61111 6,600
Canadian Forces Base Borden 91111 5,000
Simcoe Muskoka Catholic District School Board 61111 3,400
Georgian College 61121 2,500
Royal Victoria Regional Health Centre 62211 2,465
County of Simcoe 91391 1,750
OPP General Headquarters 91213 1,550
Soldiers’ Memorial Hospital 62211 1,282
Waypoint Centre For Mental Health Care 62322 1,246
City of Barrie 91391 1,265
OLG Slots at Georgian Downs 72112 292
Town of Innisfil 91391 284
Source: McSweeney & Associates from Simcoe Economic Development http://bit.ly/2pNz9fn
| 26
innisfil.caTown of Innisfil
2021 Community Profile
Place of Work
Tables 18 and 19 provide information on persons reporting a
“usual place of work other than in their home or outside of
Canada”, and reveal the following regarding labour force
commuting:
More than 80% of the Innisfil labour force works outside
of the community.
Most residents that work outside the community, commute to Barrie or
Toronto.
Most of the non-resident workers are from Barrie, Essa and New
Tecumseth.
Table 16: Where the Innisfil Resident Labour Force Works, 2016
Place of Residence / Place of Work Total Male Female
Innisfil, Town/ Barrie, City 3,480 1,310 2,170
Innisfil, Town/ Innisfil, Town 2,565 980 1,590
Innisfil, Town/ Toronto, City 1,940 1,205 730
Innisfil, Town/ Vaughan, City 1,130 765 365
Innisfil, Town/ Newmarket, Town 1,025 360 660
Innisfil, Town/ Bradford West Gwillimbury, Town 860 440 425
Innisfil, Town/ New Tecumseth, Township 610 375 235
Innisfil, Town/ Mississauga, City 460 305 160
Innisfil, Town/ Aurora, Town 345 135 210
Innisfil, Town/ Brampton, City 305 210 95
Innisfil, Town/ Markham, Town 250 145 110
Innisfil, Town/ Essa, Township 230 175 50
Innisfil, Town/ East Gwillimbury, Town 190 75 115
Innisfil, Town/ Springwater, Township 175 100 80
Innisfil, Town/ King, Township 165 95 70
Innisfil, Town/ Oro-Medonte, Township 155 85 70
Innisfil, Town/ Springwater, Township 145 45 100
Innisfil, Town/ Caledon, Town 115 75 35
Innisfil, Town/ Orillia, County 80 40 35
Innisfil, Town/ Whitchurch-Stouffville, Town 40 25 0
Innisfil, Town/ Georgina, Town 40 20 20
Innisfil, Town/ Uxbridge, Township 25 15 10
Total workforce residing in Innisfil 14,380 7,000 7,360
Total resident labour force with a usual place of work
11,815 6,020 5,770
outside Innisfil
Percent of residents declaring a place of work outside of
82% 86% 78%
Innisfil
Source: McSweeney & Associates, Statistic Canada, 2016 Commuting Flow; https://bit.ly/2xkKPc4
| 27
innisfil.caTown of Innisfil
2021 Community Profile
Table 17: Place of Residence for Persons Working in Innisfil, 2016
Place of Residence / Place of Work Total Male Female
Innisfil, Town/ Innisfil, Town 2,565 980 1,590
Barrie, City/ Innisfil, Town 1,795 850 945
Essa, Township/ Innisfil, Town 340 155 185
Springwater, Township/ Innisfil, Town 215 140 75
New Tecumseth, Township/ Innisfil, Town 185 45 145
Bradford West Gwillimbury, Town/ Innisfil, Town 170 65 100
Oro-Medonte, Township/ Innisfil, Town 145 90 50
Toronto, City/ Innisfil, Town 100 75 25
Vaughan, City/ Innisfil, Town 70 50 25
Newmarket, Town/ Innisfil, Town 70 35 35
Wasaga Beach, Town/ Innisfil, Town 45 30 20
King, Township/ Innisfil, Town 35 25 10
Adjala-Tosorontio, Township/ Innisfil, Town 35 15 20
Severn, Township/ Innisfil, Town 35 20 15
Orillia, City/ Innisfil, Town 35 30 10
Mississauga, City/ Innisfil, Town 30 20 10
East Gwillimbury, Town/ Innisfil, Town 25 25 10
Tiny, Township/ Innisfil, Town 20 10 10
Midland, Town/ Innisfil, Town 20 15 10
Total workforce residing in Innisfil 5,935 2,675 3,290
Total non-resident workforce commuting to work to 3,370 1,695 1,700
Innisfil
Percent of workers (non-residents) commuting to 57% 63% 52%
work in Innisfil
Source: McSweeney& Associates, Statistic Canada, Commuting Flow, http://bit.ly/2q6ezEx
| 28
innisfil.caTown of Innisfil
2021 Community Profile
TRANSPORTATION AND SHIPPING
Highways
Innisfil has direct access to Highway 400, which connects the town with
Toronto and Barrie. Highway 400 connects the town with the 400 series
highways (401, 407, 404, 403) which provides access eastwards to Ottawa
and south to the U.S. Highway 400 also connects with Highway 11 and the
Trans-Canada Highway, which provide access to northern Ontario.
Average Annual Daily Traffic (AADT) counts for key roads:
Highway 400: From Highway 89 north to Innisfil Beach Road
Distance (km): 9.7
Annual Average Daily Traffic (AADT): 90,000
Highway 89: From Hwy 400 west to Cookstown settlement boundary
Distance (km): 3.9
Annual Average Daily Traffic (AADT): 17,000
Table 18: Distance to Urban Centres
Distance to Major Urban Centres
Location Distance (km) Distance (miles) Driving Time
Barrie 14 9 20 min
Orillia 58 36 35 min
Collingwood 71 44 1h
Toronto 100 62 1h
Hamilton 142 88 1 h 35 min
Oshawa 128 80 1 h 30 min
Kitchener 158 98 1 h 45 min
Buffalo 233 145 2 h 20 min
Source: McSweeney & Associates from Google Maps
| 29
innisfil.caTown of Innisfil
2021 Community Profile
Table 19: Distance to Major US Border Crossings
Distance to Border Crossings
Border Crossing Distance (km) Distance (miles) Driving Time
Niagara Falls, ON/Niagara
182 113 2h
Falls, NY
Fort Erie, ON/Buffalo, NY 207 129 2 h 20 min
Lansdowne, ON/Wellesley
383 238 4h
Island, NY
Sarnia, ON/ Port Huron, MI 324 202 3 h 30 min
Detroit, MI/ Windsor, ON 406 252 4h
Source: McSweeney & Associates from Google Maps.
| 30
innisfil.caTown of Innisfil
2021 Community Profile
Rail Services
Barrie Collingwood Railway
The Barrie Collingwood Railway (BCRY) provides rail car
transportation and switching services for customers of the
City of Barrie and area.
GO Transit
GO Transit operates commuter rail services from the GTA to South Simcoe. In
South Simcoe, GO Stations are in Barrie as well as Bradford. Also, note that a
GO station has been approved by Metrolinx for 6th line in Innisfil. For more on
this, please visit: (https://bit.ly/2MIvuXN)
Metrolinx
97 Front Street West
Toronto, ON M5J 1E6
Phone: 416-874-5900
Fax: 416-869-1755
CN Rail
CN is a leader in the North American rail industry. Following its acquisition of
Illinois Central in 1999, WC in 2001 and GLT in 2004, as well as its partnership
agreement with BC Rail in 2004, CN provides shippers with more options and
greater reach in the rapidly expanding market for north-south trade. More
CN services at:
Headquarters
935 de La Gauchetière Street West
Montreal, QC H3B 2M9
Phone: 1-888-888-5909
Web: http://www.cn.ca/en/index.htm
Intermodal Facility:
Brampton Intermodal Terminal
76 Intermodal Dr.
Brampton, ON L6T 5B3
Phone: 1-888-888-5909
| 31
innisfil.caTown of Innisfil
2021 Community Profile
Canadian Pacific
CP has numerous routing options across Canada and through the U.S. as well
as excellent North American reach through gateways with all Class I railways.
CP has extensive Canadian and U.S. short-line partners and serves leading
Atlantic and Pacific port facilities.
Canadian Head Office: Closest Transload Facility: Intermodal Facility:
Gulf Canada Square 6660 Financial Drive Vaughan Intermodal Terminal
401 9 Avenue SW, Suite 500 Mississauga, ON 6830 Rutherford Road
Calgary, AB Phone: 905-821-0514 Kleinburg, ON
T2P 4Z4 Fax: 905-821-9173 Phone: 1-888-333-8111
Web: www.cpr.ca/ Fax: 905-893-5027
Airports
Three main airports serve Innisfil, as listed below.
Table 20: Regional Airports
Name Location Web
Collingwood 1969 Concession Rd 6
Regional Airport Stayner ON http://www.collingwood.ca/regional_airport
L0M 1S0
Lake Simcoe 224 Line 7 North
Regional Airport Oro-Medonte ON http://lakesimcoeairport.com/contact/
L0L 2E0
Billy Bishop Airport 2 Eireann Quay, Toronto,
ON M5V 1A1 https://www.billybishopairport.com/
Pearson 6301 Silver Dart Drive
International Mississauga ON https://www.torontopearson.com/#
Airport L5P 1B2
Source: McSweeney & Associates from Google Maps
| 32
innisfil.caTown of Innisfil
2021 Community Profile
Ports
Table 21: Regional Ports
Name Location Web
605 James St. North
Hamilton Port 6th Floor
www.hamiltonport.ca
Authority Hamilton, ON
L8L 1K1
60 Harbour Street
Port of Toronto
Toronto, ON http://www.torontoport.com/index.asp
(Ocean Port)
M5J 1B7
Port of 1621 Simcoe St S.
www.portofoshawa.ca
Oshawa Oshawa ON, L1H 8J7
Source: McSweeney & Associates from Google Maps
| 33
innisfil.caTown of Innisfil
2021 Community Profile
TAXES AND UTILITIES
This section describes the taxes (local, provincial and federal),
cost of water and sewer connection, waste management
rates and sites, and natural gas and electricity rates.
Local Property Tax Rates
Table 22: Local Property Tax Rates, 2020
Local Tax Rates 2020 Total
Combined Town, County and Education %
Residential 0.99598
Commercial Occupied 2.035494
Commercial Excess Land 1.718847
Commercial Vacant Land 1.718847
Commercial Full New Construction 2.035494
Industrial Occupied 2.305494
Industrial Excess Land 1.988847
Industrial Vacant Land 1.988847
Industrial Full New Construction 2.035494
Pipelines 2.330526
Farm 0.248995
Source: Town of Innisfil https://innisfil.ca/tax-rates/
Federal and Provincial Income Tax Rates
Table 23: Combined Corporate Taxes – General Corporation (2020/2021)
Corporate Tax Rates – Non-Canadian Controlled 2020 2021
Combined Federal and Provincial % %
General/Manufacturing and Processing/Investment11 25.0 25.0
General; Active Business Income 26.5 26.5
Source: McSweeney & Associates
11Ontario provides a manufacturing and processing tax credit that effectively reduces the corporate tax
rate on the corporation’s Canadian manufacturing and processing profits earned in the province to 10%.
| 34
innisfil.caTown of Innisfil
2021 Community Profile
Table 24: Corporate Taxes – Canadian Controlled (2020/2020)
Corporate Tax Rates - Canadian Controlled 2020 2021
Combined Federal and Provincial % %
Small Business Income up to $500,000 12.2 12.2
General; Active Business Income 26.5 26.5
Investment Income 50.2 50.2
Source: McSweeney & Associates
Table 25: Personal Income Tax, 2020-2021
2021 Combined Federal and Provincial Tax Rates
2021 Taxable Income Other Capital Canadian Dividends
Income Gains
Eligible Non-
Eligible
first $45,142 20.05% 10.03% -6.86% 9.24%
over $45,142 up to $49,020 24.15% 12.08% -1.20% 13.95%
over $49,020 up to $79,505 29.65% 14.83% 6.39% 20.28%
over $79,505 up to $90,287 31.48% 15.74% 8.92% 22.38%
over $90,287 up to $93,655 33.89% 16.95% 12.24% 25.16%
over $93,655 up to $98,040 37.91% 18.95% 17.79% 29.78%
over $98,040 up to $150,000 43.41% 21.70% 25.38% 36.10%
over $150,000 up to $151,978 44.97% 22.48% 27.53% 37.90%
over $151,978 up to $216,511 48.29% 24.14% 32.11% 41.72%
over $216.511 up to $220,000 51.97% 25.98% 37.19% 45.95%
over $220,000 53.53% 26.76% 39.34% 47.74%
Marginal tax rate for dividends is a % of actual dividends received (not grossed-up taxable
amount).
Marginal tax rate for capital gains is a % of total capital gains (not taxable capital gains).
Gross-up rate for eligible dividends is 38%, and for non-eligible dividends is 15%.
The surtax is calculated before deducting dividend tax credits.
For more information see Ontario dividend tax credits.
Marginal tax rates do not include the Ontario Health Premium, which increases the above
rates by up to 1.2%
Basic Personal Amount
Level 2021 Amount 2021 Tax Rate
Federal $13,808 15%
Ontario $10,880 5.05%
Source: http://www.taxtips.ca/taxrates/canada.htm
| 35
innisfil.caTown of Innisfil
2021 Community Profile
Table 26: Sales Tax
Sales Tax 2020
HST (harmonized sales tax) 13%
Source: https://www.taxtips.ca/salestaxes/sales-tax-rates-2019.htm
Water/Wastewater and Waste Management
Table 27: Water and Sewer Charges, 2019
Commercial/Residential
Sewer Rates Rate with Water Connection Rate without Water
Connection*
Residential $212.30 $529.36
Mixed Use $424.80 $741.40
Comm./Ind. $1,147.52 $1,783.35
Institutional $6,553.65 $10,571.53
Water Rate
Residential Base $ 275.26
Commercial Base $ 491.34
Industrial Base $1,105.46
Institutional Base 2,864.56
Consumption:
All services (per m3) $2.16
Source: Town of Innisfil https://innisfil.ca/water-and-wastewater-2019-rates/
*These accounts are not subject to consumption charges.
| 36
innisfil.caYou can also read