FREEDOM PARK MITCHELL'S PLAIN - BACKYARDING MATTERS Enabling People, Place and Policy
←
→
Page content transcription
If your browser does not render page correctly, please read the page content below
Neighbourhood Profile

  FREEDOM PARK
MITCHELL’S PLAIN

      BACKYARDING MATTERS
   Enabling People, Place and Policy

                                12/2020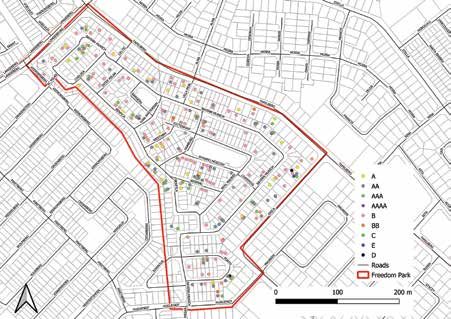
table of CONTENTS

04   1. Executive Summary
                                                45             8. About the
                                                                  Neighbourhood

05
                                                                8.1.    Perception of the
     2. Introduction                                           		       Neighbourhood
        2.1.   Project Background                               8.2.    Push & Pull Factors
        2.2.   Project Objectives                               8.3.    Commuting
        2.3.   Project Methodology                              8.4.    Services
        2.4.   Project Narrative
        2.5.
        2.6.
               Safeguarding
               About the Neighbourhood
               Profile
                                                53             9. Rental Structures
                                                                   9.1. Density & Infrastructure

08   3. Participatory Data Collection
       3.1. Data Collection
                                                57             10. About the Informal
                                                                   Rental Market
       3.2. Fieldwork sample survey in                             10.1. Rent
     		     Freedom Park, Mitchells Plain                          10.2. Market

11   4. About Freedom Park
        - Contextual Analysis                   59             11. Salient Findings

                                                61
        4.1. Historical Context & Development                  12. References
        4.2. Spatial Context & Urban Fabric
        4.3. Social and Economic Context

16   5. Landlords
        5.1.   Landlord Tenure
        5.2.   Landlord Demographic Profiles
        5.3.   Landlord Economic Status
        5.4.   Typical Landlord

29   6. Tenants
        6.1.   Tenant Tenure
        6.2.   Tenant Demographic Profiles
        6.3.   Tenant Economic Status           This document is produced as part of the project
        6.4.   Typical Tenant                   Backyard Matters: Enabling People, Place and
                                                Policy. Backyard Matters is a partnership project

40
                                                initiative between Development Action Group
     7. About the Social Nature                 (DAG), Isandla Institute and Violence Prevention
        of the Yard                             through Urban Upgrading (VPUU). The project is
                                                aimed at strengthening the backyard rental market
        7.1.   The Yard                         and contributing towards well-managed, quality
        7.2.   Tenant / Landlord Relationship   rental stock that provides affordable, dignified
        7.3.   Rental Agreement                 and safe housing solutions. Backyard Matters is
        7.4.   Social Cohesion                  funded by Comic Relief.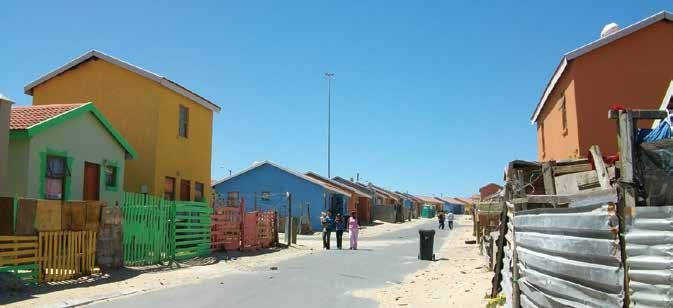
list of TABLES
10   [1] Sample sizes by tenure type     31   [25] Effective tenant marital
                                                                               47   [48] Push and pull factors
                                              status                                (out of all households)
13   [2] Description of all erven uses
     in enumeration area (City of Cape   32   [26] Age range of tenants        48   [49] Most common commuting
     Town, 2020)                                                                    locations & times *excl.
                                         32   [27] Average effective tenant         students/learners
15   [3] Age Distribution of residents        and tenant household age
     Source: Stats SA                                                          49   [50] Access to electricity
                                         32   [28] Tenant primary household
16   [4] Landlord types                       language                         50   [51] Households which
                                                                                    selected access to electricity
     (Scheba & Turok, 2020:10-15)        33   [29] Tenant nationality               as a priority for area
                                                                                    improvement
18   [5] Landlord households by
                                         33   [30] Tenant household size
     tenure type
                                         34   [31] Effective tenant highest    50   [52] Households not paying
                                                                                    for electricity
19   [6] Landlord length & tenure             education level achieved
20                                                                             50   [53] Household average
     [7] Effective landlord gender       35   [32] Effective tenant                 monthly expenditure on
                                              employment status
20   [8] Effective landlord marital                                                 electricity
     status by gender                    36   [33] Tenant household
                                                                               51   [54] Water supply access
                                              members’ employment status
21   [9] Age range of landlords
                                                                               51   [55] Households not paying
                                         36   [34] Tenant household income          for water
21   [10] Average effective landlord
     and landlord household age          37   [35] Tenant household sources    51   [56] Household average
                                              of income                             monthly expenditure on water
21   [11] Landlord primary
     household language                  37   [36] Tenant household            51   [57] Household which selected
                                              members receiving grants              access to water as a priority for
21   [12] Nationality of effective                                                  area improvement
     landlords                           38   [37] Average household
                                              expenses by tenure type          52   [58] Access to sanitation
22   [13] Landlord household size                                                   services
                                         41   [38] Tenant households reason
22   [14] Effective landlord highest          for moving to Freedom Park       52   [59] Access to sanitation
     education achieved                                                             services
                                         42   [39] Payment method for rent
24   [15] Effective landlord                  or bond                          52   [60] Households not paying for
     employment status                                                              sanitation
                                         42   [40] Number of households
25   [16] Landlord household                  with a signed rental agreement   52   [61] Household average
                                                                                    monthly expenditure on
     residents’ employment status
                                         42   [41] Quality of relationship          sanitation
25   [17] Landlord household income           between tenants and landlords
                                                                               53   [62] Households which
26   [18] Landlord household             43   [42] Perception of the                selected access to toilets as a
     sources of Income                        stability of the relationship         priority for area improvement

26   [19] Effective landlord and         44   [43] Agreement that people       53   [63] Comparison of structure
     landlord household disabilities          generally help each other out         type and building materials

27   [20] Members of landlord            44   [44] Trust in other households   54   [64] Responsibility for
                                              on the yard                           maintenance of structures
     households receiving grants

27   [21] Average household              45   [45] Top changes households      57   [65] Average monthly rental
                                              would like to see in the area         paid by tenant households
     expenses by tenure type
                                         46   [46] Perceptions of safety at    57   [66] Spread of rent
30   [22] Tenant households by
     tenure type                              home and in the area during      58   [67] How tenants discovered
                                              either the day or night               the property by tenure type
30   [23] Tenant length of tenure
                                         46   [47] Perceptions of main         58   [68] Ease in finding affordable
31   [24] Effective tenant gender             crimes out of households              rental opportunities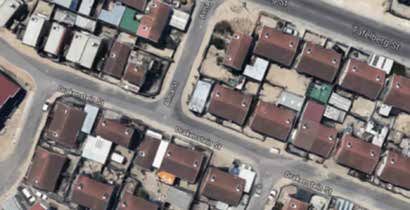
list of FIGURES

09   Figure 1
     Boundary of enumeration area
                                        14   Figure 6
                                             Bird’s-eye view of backyards
     Source: Enumeration Survey              in Freedom Park
                                             Source: Google Maps

11   Figure 2
     Location of Freedom Park,
                                        54   Figure 7
     circled in the City of Cape Town        Typical main house structures,
     (Stamen, 2020)                          both single & double storey
                                             are common

12   Figure 3
     Social facilities and
                                        55   Figure 8
     transport infrastructure                Typical freestanding backyard
     (City of Cape Town, 2020)               structures and main house
                                             extensions made of
                                             timber panels

13   Figure 4
     Zoning scheme
     (City of Cape Town, 2020)

14   Figure 5
     A typical streetscape
     (Google Maps, 2020)
Neighbourhood Profile / Freedom Park, Mitchells Plain / Executive Summary   04

EXECUTIVE SUMMARY
The backyard sector is widely        The key findings from this survey           households pay their rent in cash
recognised as a critical and         are as follows:                             and less than 10% of both tenant
growing component of housing                                                     and landlord households say
provision in South African           533 residential erven in the                that they have a formal written
cities. However, an absence          enumeration area were surveyed              rental agreement.
of data, particularly at the         and altogether 1892 residents
neighbourhood level, has meant       were interviewed. In general, the           There is a trio of related factors
that the nature of backyarding       survey discovered multiple forms            which help to understand why
is not well understood. As           of tenure and high degree of fluidity       households (both tenants and
such, there is a lack of public      between landlords and tenants.              landlords) choose to live in
policy offering guidance and         This can be attributed to extended          Freedom Park that are primarily
programmatic responses.              family relationships where, for             social. They want to be closer to
                                     example, several household                  family, access affordable housing
Within this context, the             members of landlords reside as              and have better living conditions.
Backyard Matters project             backyard tenants etc.                       Push factors would be primarily
aims to contribute towards an                                                    economic - households would
improved understanding and the       Most landlord households have               move to improve their livelihoods
identification of interventions      been living in Freedom Park for a           through better employment.
which enhance and foster this        fair length amount of time. While
particular under-estimated and       many moved to Freedom Park                  Across the board the main
neglected housing sector.            in the 1990s after or during land           house secures refuse, water,
                                     occupation, the majority moved to           sanitation and electricity from the
Backyard Matters is a 42-month       the area in the 2000s. The overall          municipality and provides these
project funded by Comic Relief,      average of landlord household               services in turn to the backyarders,
which brings together the            is about four people. Amongst               though a few backyarders access
Development Action Group             effective landlords themselves,             services independently. The
[DAG], Violence Prevention           nearly 75% are unemployed or                majority of households (mostly
through Urban Upgrading [VPUU],      looking for work. For the landlords         landlord and main house tenants)
and the Isandla Institute. The       earning less than R3 500, the rent          are living in the main house on
main objectives of the project       contributes substantially to the            the property which is almost
related to improving access for      overall household income.                   always made of brick and cement.
affordable rental housing stock,                                                 However, in Freedom Park a fair
improve the quality of rental        Much like landlord households,              number of other structures are
stock through technical support      tenant households have lived in             also made from brick and cement.
and develop new forms of             Freedom Park for many years,                38 backyard structures in total
collective bargaining.               though most households arrived              were made of brick and cement -
                                     from the 1990s onwards. Whereas             around 7% of all households. The
In order to improve the              landlord households averaged                remainder are largely informal
understanding of the backyard        around four members, tenant                 structures made of metal or wood.
rental market, DAG and VPUU          households are, on average three            There were no significant examples
conducted primary data collection    people, though there is a fair              of entrepreneurial landlords or
in eight neighborhoods Lost City     spread of households between                boarding houses.
and Freedom Park (in Tafelsig,       one and six people. Some
Mitchells Plain), Maitland           households are very large with              This document, along with the
Garden Village, Palm Park (in        seven or more members, indicating           seven other neighbourhood
Eerste River), Lotus Park, Ilitha    overcrowded conditions.                     profiles will inform further
Park, Kensington, and Manenberg.                                                 synthesis and understanding
The primary data is distilled into   The average rent is around                  of the backyarding sector.
these neighbourhood profiles         R662 per month with a range
and supplemented by focus            from R300 to as high as R1,800
group discussions.                   per month. 80% of all tenant
05 Neighbourhood Profile / Freedom Park, Mitchells Plain / Introduction
INTRODUCTION
Project Background
The backyard sector is Within this context, the Backyard Matters project aims to contribute
widely recognised as towards an improved understanding and the identification of
interventions which enhance and foster this particular under-estimated
a critical and growing and neglected housing sector.
component of housing
provision in South Backyard Matters is a 42-month project funded by Comic Relief, which
African cities. However, brings together the Development Action Group [DAG], Violence Prevention
through Urban Upgrading [VPUU], and the Isandla Institute.
an absence of data,
particularly at the The following insights and arguments motivate for the project:
neighbourhood level,
has meant that the • The backyard rental market is a rapidly growing accommodation option
for an increasing number of people, especially in South African cities.
nature of backyarding • There is a lack of data and understanding of the nature and dynamics
is not well understood. of backyard rental markets in different cities and neighbourhoods.
As such, there is a • There is no clear definition of backyarding or backyard dwellings to
lack of public policy guide policy and programmatic responses.
• Government responses to backyarding have been untargeted
offering guidance and ad-hoc.
and programmatic • New actors have emerged that are likely to shape backyard
responses. rental markets.
Project Objectives
• Better access to reliable information and well managed, quality rental
housing stock.
• Improved rental housing stock through technical support, development
guidelines and formalisation.
• New and innovative collective bargaining models are tested
and adopted.Neighbourhood Profile / Freedom Park, Mitchells Plain / Introduction 06
Project Methodology
To gain a deeper understanding Village, Palm Park (in Eerste as a provider of affordable,
of the community-owned River), Lotus Park, Ilitha Park, flexible and dignified housing
solution that is the backyard Kensington, and Manenberg. The options. As such, the project
rental sector, the primary focus data collected has been compiled will engage in literature, policy
of the project in the first year into a series of neighbourhood review and convene stakeholder
[October 2019 - September specific sample profiles directly engagements, including
2020] is on data collection informing a synthesis paper, meetings of the local community
and analysis, through sample which will seek to distil a of practice of Cape Town
surveys and focus group provisional typology of backyard based-NGOs. Lastly, the project
discussions in eight selected rental markets in Cape Town. will initiate engagements with
neighbourhoods across the landlords and tenants in selected
Cape Town metropolitan area. The project will also focus on neighbourhoods, to review and
research and engagement strengthen opportunities for
The eight identified case studies, processes aimed at collective bargaining in a move
with different socio-spatial understanding potential policy towards a robust and affordable
conditions, are Lost City and levers and programmatic backyard rental sector.
Freedom Park (in Tafelsig, interventions to strengthen
Mitchells Plain), Maitland Garden the backyard rental sector
Project Narrative
To comprehensively unpack What is and could be people’s Quality of Life within the
the backyard sector, a series backyarding phenomenon is the underpinning question
of relevant themes have
of this research, simultaneously mapping the status quo
been identified and organised
into a coherent research
and exploring the potential.
policy framework, namely
the project narrative. In this light, the project narrative includes the following themes:
Each of these themes explores Tenant and landlord profiles | tenant-landlord relationships |
how to measure a dimension of renting household profile | cost of living | market | support |
the backyarding phenomenon, neighbourhood [context/area] | properties | structures | basic-
testing various indicators services | design/planning | policy/legislation
through targeted questions,
which may [or may not] find The project intends to test the research methodology, together
their answers in the literature with the Project Narrative as a precursor of a more in-depth –
review, sample surveys, Backyarding Index.
qualitative interviews and or
focus group discussions.07 Neighbourhood Profile / Freedom Park, Mitchells Plain / Introduction
Safeguarding About the
Partners have adopted a
Neighbourhood Profile
safeguarding strategy that
aims to protect all stakeholders
taking part in the project from Within the Backyard Matters project, this
harm during data collection report aims to provide a deeper understanding
and analysis; as well as any of the informal rental sector within a specific
meetings and forums that are
neighbourhood context.
organised. This has been
tailored to address specific risks
in each community through As part of a set of eight reports illustrating and
local safety plans. analysing the data collected within the selected
neighbourhoods, this report focuses on the informal
All participants in surveys will rental sector in Freedom Park, Mitchells Plain.
be informed about the purpose
However, it is important to note that this study
of the project and how the
data will be used and consent explores a way of inquiry through sample surveys,
will be obtained. Data will be rather than mapping each neighbourhood in
anonymised so that the identity its entirety.
of participants is protected and
used for research purposes only. Firstly, this report illustrates the neighbourhood
context, and it provides a summary of some of the
The COVID-19 pandemic and the
declaration of a State of Disaster key demographic, social, economic, and housing
in South Africa required specific trends. Secondly, it maps the informal rental sector
safety measures to be put into within that specific neighbourhood.
place to comply with the law,
prevent spread of the virus and To identify targeted responses and policy
protect staff, fieldworkers and
recommendations, it is necessary to explore
residents from being infected as
well as managing distress and the informal rental sector within different
the fears of all involved. neighbourhood contexts, and drawing from the
nuances emerging from the different socio-spatial
conditions.
In this light, the synthesis paper interrogated
and compared the informal rental sector within
different contexts, drawing from the various
neighbour-specific sample surveys.Neighbourhood Profile / Freedom Park, Mitchells Plain / Participatory Data Collection 08
PARTICIPATORY DATA
COLLECTION
Data Consultation and training
Collection • Local leadership and/or organisations were identified and engaged to
secure buy-in for the field work.
• Preliminary focus group discussions were conducted with residents
This neighbourhood
and potential local fieldworkers with the intention of providing
profile is based on information about the project and gaining an initial understanding of
a participatory data how the backyard sector functions in each community.
collection process. • Local field workers were recruited by staff and community leaders,
screened for suitability and between 5 and 10 were then trained on the
purpose of the project and how to complete and troubleshoot the
surveys on the tablets. They were paid for this work.
Fieldwork sample surveys
• An extensive survey was designed to capture data on the main
research areas. The surveys were conducted during level three of the
lockdown (30 June to 07 July 2020).
• Before fieldwork began, the fieldworkers went door-to-door and a
community meeting was held to ensure that as many residents as
possible were aware that the enumeration was taking place and what
it was for. This preparation assisted greatly in helping to ensure the
actual enumeration went smoothly.
• Over a few days, field workers surveyed as many households in
the area as they could access. This included information about each
household living on the erf and additional information about each
person in the household.
• In general a central location was designated as a headquarters during the
process that could be used for daily briefing, queries and an assembly
point should any incident occur. Each day, target erf numbers were
identified and field workers conducted surveys in pairs and maintained
contact regarding their movement with supervisors via whatsapp.
• Particular concerns arose regarding gang activity. Field workers were
mostly drawn from the area and were able to navigate the
neighbourhood, but were advised to enter the nearest house to avoid09 Neighbourhood Profile / Freedom Park, Mitchells Plain / Participatory Data Collection
getting caught in crossfire. Vacant and dilapidated houses were gang
or drug activity were likely to be taking place were avoided. Yards were
checked for the presence of dogs.
• Where possible, permission was obtained from landlords before
entering backyards and speaking to tenants. Consent was obtained
and photos were taken of each house that was enumerated.
Data analysis
• The data collected was then cleaned and analysed.
• Key themes were identified and possible questions for focus group
discussions were identified.
Focus group discussions
• Focus group discussions were conducted with both tenant and
landlord households where participants gave consent to be contacted.
Fieldwork sample survey in Freedom Park,
Mitchells Plain
Boundary
Figure 1: Boundary of enumeration area. Source: Enumeration Survey.Neighbourhood Profile / Freedom Park, Mitchells Plain / Participatory Data Collection 10
The enumeration area covers the boundaries of east. The southern boundary falls behind the last
what is locally known as Freedom Park in Mitchells row of house on the boundary line behind
Plain, following Tafelberg road on the northern Benfica Street.
boundary, Langeberg to the west and Erica to the
Sample size
533 1892
residential erven
in the enumeration residents surveyed:
area surveyed:
211 landlord households across
various tenure types with: tenants living in backyards 676
243 198 124 383
tenants living in the main house 370
effective
landlords
backyarder tenants living effective
households in rooms in the tenants1
members of landlord households 846
main house Exact breakdown of residents in the table below.
SAMPLE SIZE (IN VALUES)
Total households Effective landlord/tenant Total Residents
TENANT households
Main house tenants 124 143 370
Backyard owners 68 89 243
Backyard tenants 124 144 415
Backyard residents 6 7 18
Total 322 383 1046
LANDLORD households
Landlord owners 194 221 774
Landlord tenants 10 12 38
Landlord residents 7 10 34
Backyard landlords 0 0 0
Total 211 243 846
Grand Total 533 626 1892
Table 1: Sample sizes by tenure type.
1
The tenure types and definition of effective landlords/tenants are discussed in more detail in the landlord and tenant sections.11 Neighbourhood Profile / Freedom Park, Mitchells Plain / About Freedom Park - Contextual Analysis
ABOUT FREEDOM PARK -
CONTEXTUAL ANALYSIS
Historical Context and Development
Location
Figure 2: Location of Freedom Park, circled, in the City of Cape Town (Stamen, 2020).
Freedom Park is located at the periphery of the city in the very south-east corner
of Tafelsig, Mitchells Plain. It one of the last suburbs at the edge of the apartheid
era buffer of open land that was left between Mitchells Plain and Khayelitsha.
Historical development
Freedom Park was initially intended to be a public school and was left
undeveloped while other housing projects were established. Around 1998 the
land was occupied by local residents who had been living in backyards. The City
of Cape Town moved to evict the residents and quickly secured an eviction order,
but the new residents were well-organised and managed to resist the execution
of the order. The City Council and residents agreed to enter into a mediation
process and the City withdrew its eviction application. By the end of 1999, about
485 homes had been erected and nearly 2500 people were living on the land. ByNeighbourhood Profile / Freedom Park, Mitchells Plain / About Freedom Park - Contextual Analysis 12
2001 rudimentary services were installed including construction started in 2007 with the support of
shared toilets and standpipes and refuse collection. the Mellon Housing Initiative and various typologies
By this stage circumstances had changed and the were developed. Despite significant issues that had
City Council had agreed to allow the community to be worked through, including poor construction,
to build their own homes through a People’s lack of security and contestation over access to
Housing Process also known as PHP. DAG provided housing, progress was made and many residents
significant support through this time as residents eventually occupied their homes nearly a decade
negotiated with the Council on the development. after originally occupying the land (DAG, 2009).
By 2006, the site was ready for housing and
Spatial Context & Urban Fabric
Connectivity
Freedom Park is not
near any major railway
lines and residents
would have to take
taxis to the nearest
interchange. Despite
being in the geographic
heart of the city, it is not
well connected to the
surrounding suburbs nor
any major truck routes into
the city centre, resulting in
long commutes for those
who do have work.
Figure 3: Social facilities and transport infrastructure (City of Cape Town, 2020).
Social facilities
Mitchells Plain is extremely large and sprawling and public service are
thinly spread out across the suburb. Freedom Park is located in the
south-east corner, fairly far from the local CBD. There are schools, a clinic
and two large community centres within walking distance, though this
would take some time. Freedom Park does have a small hall that was
constructed during the developing phase and two small parks.13 Neighbourhood Profile / Freedom Park, Mitchells Plain / About Freedom Park - Contextual Analysis
Land use and zoning
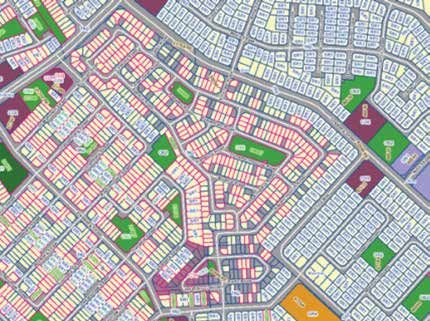
Figure 4: Zoning scheme (City of Cape Town, 2020).
Apart from the obvious exceptions such as All of the residential erfs are zoned as Single
the parks, which are zoned for community use, Residential 1
the remaining erfs are zoned as residential.
The surrounding land is zoned almost entirely Single Residential 1 provides for,
residential too. '… predominantly single-family dwelling
houses… in low- to-medium-density residential
Of the 536 erven in the enumerated area of neighbourhoods [and] limited employment
Freedom Park, 533 are primarily residential. and additional accommodation opportunities
are possible as primary or consent uses'
(City of Cape Town, 2015:108).
ERVEN
Accordingly, the zoning scheme provides for up
Residential erven 533
to three dwellings on the same erf with a floor
Parks, fields and open space 2 factor of one. While it is possible to build up to the
Schools and Pre-Primaries 0 boundary, a maximum floor coverage of 75% of
the erf is permissible. Second and third dwellings
Churches and community facilities 1
must be constructed in a style that is similar to
the architecture of the main dwelling house and is
536
subject to certification that capacity is available on
Table 2: Description of all erven uses in enumeration area the service networks (City of Cape Town, 2015:112).
(City of Cape Town, 2020).Neighbourhood Profile / Freedom Park, Mitchells Plain / About Freedom Park - Contextual Analysis 14
Clearly the majority
of households with
Urban fabric
backyard housing are not
compliant with the zoning Streetscape
scheme, which imagines
Through the PHP, it was
the construction of more
agreed that there would be
formal housing, primarily
smaller erf sizes so that
because there are often
more households could be
more than three dwellings
accommodated and this has
and the backyard Figure 5: A typical streetscape
resulted in smaller roads that
structures (made out of (Google Maps, 2020).
have bends and a somewhat
wood and zinc) are rarely
constructed in a similar denser urban form. While the houses are similar in design to many public
architectural style. housing projects, there is a mixture of freestanding, semi-detached and
double storey homes.
In addition, apart
from providing for a There is a significantly amount of infilling of land, not just with backyard
limited range of home structures, but with boundary walls and a mixture of extensions. In general,
occupations including the lack of greening is obvious. The soil is mostly beach sand, which
hair salons, the zoning blows across the suburb and is hard to manage. Most of the houses are
scheme expressly surrounded by sand and gravel. The community is poor and unemployment
forbids commercial is high and many homes have fallen into disrepair over the years.
activity such as
workshops and Growth in backyarding
spaza shops.
As can be seen, backyarding is fairly ubiquitous in Freedom Park. The
General Residential 1 number of backyard structures has increased substantially over the last 10
primarily encourages, years or so. An aerial desktop analysis reveals very few wooden backyard
'…group housing, which is structures immediately after the construction of the area compared to
a medium-density form of roughly 250 in 2020.3
residential development,
where attention is
given to aesthetics,
architectural form and the
inter-relationship between
different components
of the development' (City
of Cape Town, 2015:116).
Clearly, this is ambitious
and the underlying zoning
doesn’t match the current
built form at all.
Figure 6: Bird’s-eye view of backyards in Freedom Park. Source: Google Maps.
2
A floor factor is used to calculate the maximum floor space of buildings permissible. It is the maximum floor space as a proportion of the net erf area. For
example, an erf 200m2 in size with a floor factor 1 may have up to 200m2 of floorspace across storeys subject to coverage and height limitations. High floor
factors can be used to encourage density in some land uses.15 Neighbourhood Profile / Freedom Park, Mitchells Plain / About Freedom Park - Contextual Analysis
Land values in
Freedom Park: R290,000 to R325,000
City of Cape Town, 2018
Social and Economic Context
Official census data from 2011 is only available at the subplace level for Tafelsig, which
is too big to be of use comparatively. At the small area level, the closest match is section
of Freedom Park between Langeberg Avenue in the north and Stella Road in the south,
which is about two-thirds of the enumerated area.
Gender and Age
Total population:
2,092 living in
400 households
51%
The population is distributed across age groups
split majority
and is largely youthful (66% of residents under 30
female
years of age).
AGE DISTRIBUTION
0-9 10-19 20-29 30-39 40-49 50-59 60-69 70-79 80+
No. 493 456 417 229 322 128 30 5 6
% 24% 22% 20% 11% 15% 6% 1% 0.2% 0.3%
Table 3: Age distribution of all residents. Source: Stats SA.
Race and language
Nearly 96% of the population identifies as Coloured with less than 3% identifying as Black
African. The majority, around 84% speak Afrikaans as a first language, with 12% speaking
English (Stats SA, 2011).
Employment and household income
Unfortunately employment and household income data is not available publicly at the
small area level at this stage.Neighbourhood Profile / Freedom Park, Mitchells Plain / Landlords 16
LANDLORDS
Landlord
Tenure A landlord is defined as, ‘The person who occupies
the main house, controls access to the backyard unit
and services, and enters into a rental agreement with
Types of landlords in the backyard tenant… The landlord is not necessarily
the backyard sector the owner of the land and does not necessarily have legal
have not been formally authority to let the space in the back’ (Tshangana, 2014:8).
designated in public
policy, though there is
some convergence in Landlords have for the most part been categorised by the degree to which
the literature. the landlord is investing in and deriving an income from rental housing
and this is reflected in the formality of the relationship with tenants and
the typology of backyard structures.
LANDLORD TYPES
Investment Relationship Structure typology
Subsistence Landlords rent out parts of Tenants may be family or Backyard shacks made out
landlords their property to generate extended relations or others of timber and zinc or other
income for basic household known to the landlord. materials are erected to the
needs. Renting forms part of Most pay rent though not front, rear or side of the main
the household’s strategy to always. Rental agreements house. Limited access to
get by. Minimal investment are normally verbal and services, often in or from
on the part of landlord and relationships are managed the main house.
rental does not generate large informally.
surpluses. Tenants often
build their own structures on
landlord’s property.
Homeowner Landlords who are not Tenants are more One or two storey micro-flats
landlords necessarily reliant on independent and less reliant or rooms built from brick
the rental income for on the main house and and mortar are constructed
basic needs. They invest the relationship is more in the backyard, often with
surplus in upgrading the formal. They often have their shared facilities in the yard
infrastructure and rooms, own keys. The landlord either or en suite bathrooms. Some
often incrementally, and are lives on the property and include electricity in the room.
able to charge higher rents. manages the relationships Mostly constructed without
The intention is to increase or appoints someone. formal plans or technical
income to improve their know-how. Can result in units
quality of life. that are haphazardly built.17 Neighbourhood Profile / Freedom Park, Mitchells Plain / Landlords
LANDLORD TYPES
Investment Relationship Structure typology
Entrepreneurial Landlords who collect rent Landlord rarely lives on Boarding houses or larger
landlords as their main source of the premises and the double storey buildings. Often
income. Their intention is relationship is more clinical the main house has been
to expand and accumulate and ‘arms-length’ even demolished or completely
wealth and they are able though agreements may renovated to accommodate
to network and invest in still be verbal. multiple rooms with en suite
multiple properties, though or shared bathrooms and a
they may not have access to shared kitchen. Electricity
finance or technical skills. connection may be upgraded
and separate meters
installed, though the original
water and sewerage lines
are used.
Table 4: Landlord types (Scheba & Turok, 2020:10-15).
The most visible indicator of the nature of the fair number of brick and cement structures
landlording is the typology of backyard structures. might indicate that more and more landlords are
In Freedom Park, around 80% of backyarder investing in backyard structures. There was as a
households are living in timber, plastic or metal few examples of entrepreneurial landlords, where
structures with around 19% living in structures the property had been entirely renovated into
made of brick and cement. It would appear that double storey structures that are rented. The survey
the majority of landlord households are renting was not able to capture the details of landlord
backyard structures on a subsistence basis, though households which do not reside on the property.
Landlord tenure types
Through the consultations, survey development and analysis a number of different tenure types were
documented for landlords and tenants. These include:
LANDLORD HOUSEHOLDS TENURE TYPE
General Definition Common expression in Freedom Park
Landlord owners Most property owners in Freedom Park built their own
Landlord households which own the property and live in home or bought the property on the private property
the main house. They rent out rooms and/or structures market.
and space in the yard.
Landlord tenants A few landlord tenants in Freedom Park rent the main
Landlord households which rent the main house house. This might be a main tenant who sublets to
themselves and sublet rooms and/or structures and others living on the property, or more likely a number of
space in the yard. households who all rent rooms and backyard structures
from the owner.Neighbourhood Profile / Freedom Park, Mitchells Plain / Landlords 18
LANDLORD HOUSEHOLDS TENURE TYPE
General Definition Common expression in Freedom Park
Landlord residents Some landlord households may have inherited their
Landlord households which have some other kind of homes from parents or bought the property but never
tenure and rent out room and/or structure and space in transferred formal title. Others may be where the owner
the yard. is absent or a relative who isn’t interested in taking
occupation. This was common in Freedom Park as most
tenure was strictly ownership.
Backyard landlords Mostly in order to make extra income, but it may be that
Landlords who own and rent the main house and/or an elderly parent has moved out back to allow a child or
structure and space in the yard and live in a structure in relation to live in the main house.
the yard themselves.
There were no backyard landlords surveyed in Freedom
Park. All of the landlords who lived on the property were
staying in the main house.
Table 5: Landlord households by tenure type.
Landlord tenure types
• Where the landlord doesn’t live on the property
92% Landlord owners
and rents the main house or rooms in the main
5% Landlord tenants house and structures in the backyard directly
3% Landlord residents and separately.
In Freedom Park, 2% of landlord household
211 landlord households were enumerated, of members (38 out of 1892) consider themselves
which the vast majority owned the main house. to be tenants. These are possibly ‘hidden’ tenants
This makes sense in Freedom Park, where all of the in landlord households - most often boarders, adult
houses were built as part of the People’s Housing singles, couples and elderly members of landlord
Programme. A few may have since been purchased households who pay rent of some kind, but
on the private property market. consider themselves to be part of the household
or extended household.
Only 10 landlord households rent the main house
themselves and sublet rooms and the yard to As it stands, where these were deemed to be
backyarders. None were living in the backyard separate households they were captured as
themselves. There is fairly consistent pattern here tenants, but where these were deemed to be part
of landlord households living in the main house of the landlord household they may be rendered
and renting rooms, yard space or backyard invisible. This in large part comes down to how
structures to tenants. respondents considered what a household is,
which is always a subjective determination. The
There are; however, a number of complexities and survey did not impose a standard on what might be
anomalies in tenure which were not well captured considered a household and so respondents were
by the survey and might require further research. able to determine themselves what constituted a
These may include: household. A more standardised assessment might
have revealed more separate households with more
• Single intergenerational households living in tenants or less households with more members
multiple structures on the property. contributing financially - depending on the measure.19 Neighbourhood Profile / Freedom Park, Mitchells Plain / Landlords
Length of tenure LENGTH OF TENURE
Table 6: Landlord length of tenure.
Owner Resident Tenant Total %
Most landlord households have
been living in Freedom Park for a fair 1970s 1 1 0.47%
amount of time. While many moved 1980s 1 1 0.47%
to Freedom Park in the 1990s, the 1990s 54 2 56 26.54%
majority moved to the area in the 2000s 119 4 4 127 60.19%
2000s. This seems to have tapered
2010s 19 1 5 25 11.85%
off and by the early 2010s very few
households were moving to the area. 2020s 1 1 0.47%
This may be because the landlord
households were fairly stable and there is less churn in houses being sold; because there are now no new
open plots of land available to build housing.
When asked directly, as many as 131 out of 243 (around 53%) of effective landlords stated that they had
have benefited from a housing subsidy with the remainder indicating that they had not or did not respond.
This is a strange result, considering that the whole area was developed through PHP which is a public
subsidy programme.
Landlord Demographic Profiles
Landlord demographic profiles are determined by the economic and social history
of the area (Bank, 2007).
More recently it has been commonly assumed that landlords are mostly women:
‘In older township areas the landlords are often predominantly female, retired
or close to retirement age, low income and long-term urban residents. By enabling
home owners to become small-scale landlords, backyard rental thus creates
valuable entrepreneurial opportunities’ (Tshangana, 2014:6).
The survey did not ask specifically who the landlord may not represent how the relationship
effective landlord might be in each household is managed. This is most obvious in the case
and determining this is problematic and may where a multi-generational household lives
not necessarily have been accurate. For example: in rooms and backyard structures. Rent does
not necessarily accrue to any one individual but
• The landlord may not reside on the property payment is made in kind towards overall
at all, which makes it hard to capture their household costs or pooled.
demographic details in a house to house • It is also possible for rent to accrue to multiple
neighbourhood survey. households in a property who all consider
• Depending on the particular circumstances, the themselves to be landlords of sorts. For example,
idea that one or more particular individuals is theNeighbourhood Profile / Freedom Park, Mitchells Plain / Landlords 20
where a boarder pays towards
rent to a backyarder tenant.
Gender and marital status4
Gender in landlord households is not evenly split. Across
It would be easier to determine who
all 846 members 52% identify as women (and girls) and 47%
the landlord is technically based on
identify as men (and boys). Three individuals (two children and
whose name title formally resides in
an adult) had another gender identity.
through a title deed. However, many
families have owned a home for
When it comes to effective landlords, this trend becomes
years, but do not have a title deed.
clear. Over 60% of landlords are women compared to 37% who
Sometimes, title is held technically
are men.
one member of the household but,
in effect, the person who actually
manages the tenant relationship is EFFECTIVE LANDLORD GENDER
another member of the household
and both or either may consider Owner Resident Tenant Total %
themselves the landlords. This is
Women 137 7 9 153 62.96%
most obvious in the case of an
Men 84 3 3 90 37.04%
elderly parent who owns the property
but is frail and to a large extent 221 10 12 243 100%
leaves management of the property
to a grown child or other relation. Table 7: Effective landlord gender.
As a result, for this analysis we have
There is an interesting divergence between male and female
deemed a household member to be
landlords when it comes to marital status. The majority of
the effective landlord where they are
male landlords are married (around 60% of men are married);
living in the main house, own the
whereas female landlords are roughly equally likely to be
land, and are considered to be the
married, divorced or separated, or a widow (between 22 - 26%
head of the household. This is an
in each case).
informed assumption and of course
this may not always be the case and
as a result demographic profiling EFFECTIVE LANDLORD MARITAL STATUS BY GENDER
in this report should be taken
as indicative. Women Men Total
Civil partnership 2 1 3
While there are 211 landlord
Traditional / Customary 2 4 6
households, there are 243 effective
landlords; in a number of households Cohabiting / living together as partners 12 4 16
there were two members who Divorced / Separated 34 5 39
both considered themselves to be
Widow / Widower 34 6 40
joint-heads (often because they are
married, but not always). In these Never Married 28 15 43
instances we have included them Married 41 55 96
both as landlords.
153 90 243
Table 8: Effective landlord marital status by gender.
4
Respondents were provided with the opportunity to select additional gender identities.21 Neighbourhood Profile / Freedom Park, Mitchells Plain / Landlords
Age EFFECTIVE LANDLORD AGE RANGE
It might be tempting to determine Owner Resident Tenant Total %
an average age for landlords in 20-29 8 2 2 12 4.94%
Freedom Park.
30-39 17 2 2 21 8.64%
50-59 yrs
40-49 39 3 2 44 18.11%
50-59 107 2 5 114 46.91%
60-69 44 1 1 46 18.93%
predominant landlord age
70-79 6 6 2.47%
Table 9 demonstrates that ages range 221 10 12 243 100%
widely from landlords in their 20s
Table 9: Age range of landlords.
through to landlords nearing 80. The
youngest is 21 and the oldest is 77.
LANDLORD / LANDLORD HOUSEHOLD AGE
The average age for all members
across landlord households is 31 Owner Resident Tenant Total
years old, which makes sense when
Landlords 52 44 46 52
you factor in youth and children.
Landlord
31 25 31 31
households
Language and Table 10: Average effective landlord and landlord household age.
nationality
LANDLORD HOUSEHOLD PRIMARY LANGUAGE
The vast majority (nearly 90%) of
landlord households speak Afrikaans Owner Resident Tenant Total
as a primary language with the Afrikaans 172 6 6 184
remainder speaking English at home.
English 22 1 4 27
The vast majority (about 99%) of all 194 7 10 211
effective landlords are South African
citizens and this is the same for Table 11: Landlord primary household language.
households in general.
EFFECTIVE LANDLORD NATIONALITY
It would seem then that Freedom
Park is fairly homogenous culturally.
Owner Resident Tenant Total %
This is not surprising and correlates
with both the tenant households Permanent
1 1 0.12%
Resident
and the overall demographics of the
suburb and is almost certainly due Prefer not to
1 1 2 0.24%
answer
to the fact that Freedom Park was
historically a Coloured suburb South African 772 33 38 843 99.65%
and has remained so.
774 34 38 846 100%
Table 12: Nationality of effective landlords.Neighbourhood Profile / Freedom Park, Mitchells Plain / Landlords 22
Household size LANDLORD HOUSEHOLD SIZE
Landlord households can range Household Size Resident Owner Tenant Total %
from one to over ten people, though 1 1 1 1 4 3.42%
most households are between two
2 2 2 2 6 5.13%
and five people and the overall
average is about four people. When 3 3 3 6 5.13%
you consider that the average 4 4 4 4 12 10.26%
number of people staying on the 5 5 5 5 15 12.82%
property is around nine people, it
6 6 6 12 10.26%
becomes clear that there are many
more people living on properties 7 7 7 14 11.97%
in backyarder households than in 8 8 8 16 13.68%
landlord houses. In fact there are 9 9 9 7.69%
double as many.
10 10 10 20 17.09%
>10 3 3 2.56%
58 29 29 117 100%
Table 13: Landlord household size.
Education
EFFECTIVE LANDLORD EDUCATION
The level of formal education
amongst landlords is low and Owner Resident Tenant Total
extremely variable. A good
None 15 15
number, (around 40%), only
received education at the primary Grade 1 4 4
school level. Of the remainder, Grade 2 1 1
almost everyone left school during Grade 3 9 1 10
secondary school with only about
Grade 4 8 8
7% finishing matric. Five landlords
(around 2%) went on to secure a Grade 5 6 6
part or full tertiary qualification. Grade 6 15 1 16
Grade 7 42 1 3 46
Grade 8 35 35
Grade 9 23 3 2 28
Grade 10 36 2 2 40
Grade 11 14 1 15
Grade 12 14 1 4 19
Full tertiary 5 5
221 10 12 243
Table 14: Effective Landlord highest education level achieved.23 Neighbourhood Profile / Freedom Park, Mitchells Plain / Landlords
EFFECTIVE LANDLORD EDUCATION
Owner Resident Tenant Total %
Completed Grade 7 42 1 1 44 18%
Did not complete primary 42 2 4 48 19%
Completed Grade 12 14 1 4 19 8%
Did not complete 6 3 117 47%
None 15 15 6%
Tertiary 5 5 2%
221 10 12 248 100%
Tertiary
2%
None
7%
25%
Did not complete 60%
49%
33%
Completed Grade 12 10%
6%
33%
Did not complete primary 20%
19%
8%
Completed Grade 7 10%
19%
Owner Resident TenantNeighbourhood Profile / Freedom Park, Mitchells Plain / Landlords 24
Landlord Economic Status
There is a perception that subsistence landlords are mostly unemployed and rely
on rent from backyarding to get by: ‘Renting out a room in the back or even making
enough space for a tenant to erect their own structure, can enable a vital income
stream for those who own a house but are simply unable to find formal employment’
(Tshangana, 2014:6).
This goes hand in hand with the idea that where a landlord is working, the rental
income becomes surplus and is available for investing in the backyard housing
- a necessary step towards becoming what Scheba and Turok (2020) called a
homeowner landlord.
Employment
Unemployment is very serious amongst all residents living in
landlord households. Amongst effective landlords themselves, nearly
75% are unemployed or looking for work. While only 5% are retired and
only around 16% are employed or self-employed.
EFFECTIVE LANDLORD EMPLOYMENT
Owner Resident Tenant Total %
Looking for work 1 1 0.41%
Self-employed 1 1 0.41%
Other 2 2 0.82%
Home keeper 8 8 3.29%
Retired 9 2 1 12 4.94%
Employed 32 1 5 38 15.64%
Unemployed 168 7 6 181 74.49%
221 10 12 243 100%
Table 15: Effective landlord employment status.25 Neighbourhood Profile / Freedom Park, Mitchells Plain / Landlords
When school learners are excluded,
LANDLORD HOUSEHOLD RESIDENTS EMPLOYMENT
around 70% of household members
are unemployed or looking for work. Owner Resident Tenant Total %
Tertiary student 1 1 0.12%
Household income Looking for work 5 5 0.59%
and source Self-employed 7 1 8 0.95%
Pre-school 12 1 1 14 1.65%
Around 25% of households are
Retired 11 2 3 16 1.89%
earning no income at all and a
further 7% are earning under Home keeper 24 24 2.84%
R400 per month. Most households Other 58 3 2 63 7.45%
have a combined income of
predominantly between R1,501 and Employed 81 4 7 92 10.87%
R3,501 per month. This compares Learner at
170 7 8 185 21.87%
well with income across the City school
of Cape Town, where the average Unemployed 405 17 16 483 51.77%
household income is roughly
R4,775 per month (Stats SA, 2011). 774 34 38 846 100%
What is noticeable is how much Table 16: Landlord household residents’ employment status.
income in landlord households is
primarily from rent, with households
earning less than R3,500 per month LANDLORD HOUSEHOLD INCOME
indicating that they rely more on rent
Owner Resident Tenant Total %
than wealthier households.
No income 52 1 53 25.12%
R1 - R400 15 15 7.11%
R401 - R800 29 1 1 31 14.69%
R801 - R1,500 29 3 1 33 15.64%
R1,501 - R3,500 37 2 5 44 20.85%
R3,501 - R7,500 28 1 2 31 14.69%
R7,501 - R15,000 3 3 1.42%
R15,001 - R22,000 1 1 0.47%
194 7 10 211 100%
Table 17: Landlord household income.Neighbourhood Profile / Freedom Park, Mitchells Plain / Landlords 26
HOUSEHOLD INCOME BY SOURCE
Salary/ Own
Rent Grants Other Total %
Job Business
No income 0 0 0 0 0 0 0%
R1 - R400 1 0 9 5 0 15 8.67%
R401 - R800 1 0 26 7 0 24 13.87%
R801 - R1,500 4 0 19 7 5 25 14.45%
R1,501 - R3,500 22 1 19 6 2 50 28.90%
R3,501 - R7,500 22 1 7 0 4 34 19.65%
R7,501 - R15,000 2 1 1 0 0 4 2.31%
R15,001 - R22,000 1 0 0 0 0 1 0.58%
58 3 81 25 11 173 100%
Table 18: Landlord household sources of income (more than one option can be selected).
In this regard, rental income forms a necessary component of overall household income as a strategy to
diversify sources of income in the context of unemployment, generally low wages and a high cost of living.
Landlording is not necessarily a strategy to secure income in the absence of employment - it is part and
parcel of getting by.
Disabilities DISABILITY
and grants Household
Landlords Total
members
Disabilities Hearing difficulty 5 5
Mental difficulty 8 4 12
66 out of 846 (nearly 8%) people
living in landlord households Seeing difficulty 1 5 6
considered themselves to have
Communication /
a disability with a few having 3 1 4
speech difficulty
multiple disabilities. For those
selected another disability not listed, Walking difficulty 2 11 13
chronic illnesses, diabetes and Other 12 24 36
hypertension are in the majority.
26 50 76
Table 19: Effective landlord and landlord household disabilities.27 Neighbourhood Profile / Freedom Park, Mitchells Plain / Landlords
Grants LANDLORD HOUSEHOLD GRANTS
A significant number of people Owner Resident Tenant Total
receive a grant of some form or
Care Dependency
another in landlord households. Grant
1 1
Altogether 342 out of 846
Child Support Grant 210 9 9 229
(around 40%) of people receive
grants with the majority Disability Grant 53 1 2 56
receiving a child support grant. Foster Child Grant 4 4
Older Person’s Grant 51 1 52
320 11 11 342
Table 20: Landlord household grants.
Expenditure
Subsistence landlords simply do not make enough income to maintain or improve
backyarder structures (Tshangana, 2014) (Scheba and Turok, 2020).
Of those households which did LANDLORD HOUSEHOLD EXPENSES
respond, the breakdown of average
expenditure is listed in table 21. Owner Resident Tenant Total %
As expected food and groceries Food & groceries 1336 1129 1111 1319 32%
takes up 32% or about a third of all
Electricity 323 250 285 319 8%
expenditure, followed closely by rent
or bond payments (with landlord Water 133 200 117 131 3%
tenants paying about R200 more Sanitation 45 0 50 45 1%
per month than those who own their Refuse 0 0 0 0 0%
own home).
Rent or bond 791 650 967 824 20%
Services such as electricity, Transport 450 690 571 483 12%
water, refuse, rates and sanitation Clothing 249 485 413 263 6%
combined account for 18%
Education 0 0 0 0 0%
of expenditure.
Cell phone,
71 45 133 73 2%
airtime & data
Transport costs in other households
across the city can be considerable Maintenance 98 128 120 101 2%
and in Freedom Park it averages at Medical expenses
0 0 0 0 0%
a 12% share of expenditure. & insurance
Municipal rates 262 0 0 262 6%
Stated expenditure confirms that Other expenses 244 325 233 247 6%
money spent on maintenance of
structures is negligible - accounting 4002 3801 4000 4067 100%
for only 2% of expenditure and less
than R100 per month. Table 21: Average household expenses by tenure type.Neighbourhood Profile / Freedom Park, Mitchells Plain / Landlords 28
Landlord household income
R15,001 - R22,000 0.47%
R7,501 - R15,000 1.42%
R3,501 - R7,500 14.69%
R1,501 - R3,500 20.85%
R801 - R1,500 15.64%
R401 - R800 14.69%
R1 - R400 7.11%
No income 25.12%
Landlord household expenditure
Other expenses 6%
Municipal Rates 6%
Medical expenses & insurance 0%
Maintenance 2%
Cell phone, airtime and data 2%
Education 0%
Clothing 6%
Transport 12%
Rent or Bond 20%
Refuse 0%
Sanitation 1%
Water 3%
Electricity 8%
Food & Groceries 32%
It is important to note that due to survey restrictions and estimated figures provided by households, there might be
discrepancy between reported income and expenditure.29 Neighbourhood Profile / Freedom Park, Mitchells Plain / Tenants
Typical Landlord
A typical landlord in Freedom Park is likely to be an Afrikaans speaking South African women in her
50s who moved to the area in the 2000s. She might be married, single or divorced and lives with three
others - which could include her children and their partners. She didn’t finish secondary school and is
currently unemployed and the household lives on less than R3,500 per month - mostly drawn from rent
and different members of the household who are receiving wages or a child support grant.
TENANTS
Tenant
Tenure In general, a backyard tenant is defined as, ‘A person
occupying a backyard residential unit under some type of
rental agreement with the main homeowner which may or
Types of tenants may not include monetary payment for the right to occupy
in the backyard the unit, and may or may not be set out in a formal written
sector have not been agreement’ (Tshangana, 2020:8).
comprehensively
designated in public
policy, nor in The survey recognised three forms of tenure for tenants living in
research to date. backyards, including an option for ‘none of the above’. Through the
enumeration and further verification, a fourth tenure type was
identified as common - tenants living in the main house. We describe
all four tenure types in table 22.
Altogether there were 322 tenant households enumerated of which 124
were staying in rooms in the main house - a surprisingly large number.
Despite the lack of expenditure on maintenance, there is clearly surplus
income available amongst landlord households to be able to provide
structures for tenants to rent. A further 124 were renting structures in
the backyard.
The remaining tenants own their structures or live under another
tenure arrangementNeighbourhood Profile / Freedom Park, Mitchells Plain / Tenants 30
Tenant tenure types
TENANT HOUSEHOLDS TENURE TYPE
General Definition Common expression in Freedom Park
Backyard owners This is most often a timber wendy house, but can be whatever
Tenant households which own their own structure and rent materials they can afford. Tenants are unlikely to build in brick
space in the yard from the landlord. and cement on the landlord’s property, but there are instances
where family members might pay for the materials for a more
permanent backyard structure. These are tenants who own
their structure and pay to rent space in the yard. If they ever
move they can take the structure with them.
Backyard tenants This can be a temporary structure or a more permanent brick
Table 22: Tenant households by tenure type.
Tenant households which rent both the structure and the and cement structure.
space in the yard.
Backyard residents There are a range of households living in yards who have
Households which live in a structure in the yard under some unique tenure arrangements with the landlord and don’t
other form tenure. generally pay rent. For example, the landlord may be offering a
household shelter on a charitable basis, or is allowing a parent,
child or other relation to live on their property rent free.
Main house tenants Where the landlord lives in the main house these could rightly
Tenants which rent a room or rooms in the main house be considered boarders. In other instances, the landlord isn’t
directly from the landlord. living on the property and the whole main house is rented
to tenants households. These tenant households generally
occupy a room each, though some may occupy more than
one room.
Tenant tenure types
Length of tenure
21% Backyard owners
Much like landlord households, 38,5% Backyard tenants
tenant households have lived in
2% Backyard residents
Freedom Park for many years,
38.5% Main house tenants
though most households arrived
from the 1990s onwards. One or two
households dated their tenure back TENANT HOUSEHOLD LENGTH OF TENURE
to the 1970s. This is unlikely to be
in Freedom Park itself as the area Main House
Owner Resident Tenant Total %
Table 23: Tenant length of tenure.
did not exist then, but could be in Tenant
Mitchells Plain more generally. 1970s 1 1 0.31%
1980s 1 3 4 1.25%
Backyard tenants renting structures
started arriving mostly in the 1990s 3 3 18 17 41 12.81%
2000s and have continued apace. 2000s 15 3 41 62 121 37.81%
Tenants who own their structure 2010s 46 55 32 133 41.56%
started to arrive in the 2010s. This
2020s 4 6 10 20 6.25%
is hard to interpret but it could mean
that landlords switched to allow
more tenants to construct their own structures. Overall between 120 and 130 new tenant households are
moving into the area each decade.You can also read