Understanding Local Housing Markets - Advice and Guidance for Local Authorities A report for the Local Government Association - Local Government ...
←
→
Page content transcription
If your browser does not render page correctly, please read the page content below
Understanding
     Local Housing
       Markets
       Advice and Guidance for Local Authorities

A report for the Local Government Association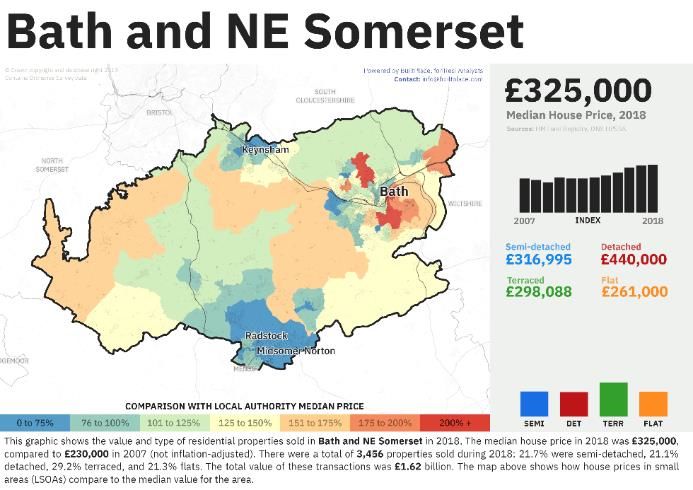
Contents
Contents ................................................................................................................................................................. 2
Introduction ............................................................................................................................................................ 3
Multiple Housing Issues .......................................................................................................................................... 3
Report Guide and Summary ................................................................................................................................... 4
Local Authority Reports .......................................................................................................................................... 6
1.      Affordability of Housing ................................................................................................................................. 8
     1.1.       Measuring Affordability .......................................................................................................................................... 9
     1.2.       High House Prices ................................................................................................................................................. 14
     1.3.       High Cost of Housing ............................................................................................................................................ 15
     1.4.       Low-Income Renters ............................................................................................................................................. 17
     1.5.       Financialisation of Housing ................................................................................................................................... 18
     1.6.       Falling Home-Ownership ...................................................................................................................................... 20
     1.7.       Social Mobility ...................................................................................................................................................... 22
     1.8.       Weak Economic Demand...................................................................................................................................... 23
2.      Availability of Housing ................................................................................................................................. 24
     2.1.       Measuring Availability .......................................................................................................................................... 25
     2.2.       Lack of New Supply ............................................................................................................................................... 37
     2.3.       Turnover of Existing Housing Stock ...................................................................................................................... 39
     2.4.       Distribution of Housing......................................................................................................................................... 41
     2.5.       Homelessness ....................................................................................................................................................... 43
     2.6.       Weak Demographic Demand ................................................................................................................................ 45
3.      Suitability of Housing ................................................................................................................................... 47
     3.1.       Measuring Suitability ............................................................................................................................................ 48
     3.2.       The Quality of Housing ......................................................................................................................................... 51
     3.3.       Ageing Population ................................................................................................................................................ 53
     3.4.       Climate Change..................................................................................................................................................... 55

2           Understanding Local Housing Markets: Advice and Guidance for Local Authorities
Introduction
This report was commissioned by the Local Government Association. Its purpose is to
provide local authorities with advice and guidance on how to best understand the various
complexities within their local housing markets in order to inform their decision making.
Local authorities have a range of duties and wider interests in ensuring the most effective
functioning of their local housing markets. They want to ensure affordable, appropriate,
good quality housing for everyone in the community within successful and sustainable
places. Therefore, a better understanding of their local housing markets will empower local
authorities to make decisions best suited to maximise positive added value in local markets.
This is especially timely as more local authorities are: developing interests in directly
delivering new homes alone or in partnership, embedding housing as part of wider
strategies for the health and well-being of individuals and places; building relationships with
the reshaped Homes England or the Greater London Authority (GLA), and; taking forward
new planning responsibilities within the new NPPF guided by the locally assessed housing
need numbers.

          Multiple Housing Issues
There is growing public and political recognition that there is a crisis in housing but there
has been little consensus around what constitutes the current housing crisis and how to
solve it. The national housing debate can be over-simplified and regularly fails to recognise
that housing is a complex and interconnected system within the economy and society.
There is no simple single housing market. Instead there are multiple markets defined by
location, property type, tenure, and price. The housing need and demand within these
markets is perhaps even more varied, driven by demographics, income, wealth, health,
employment, migration, education, family and personal relationships, consumer confidence,
and an array of preferences.
Given this complexity, it is clear there is no simple single housing crisis. There are multiple
overlapping issues that affect different parts of the country and different types of people in
different ways and to varying degrees. There may be factors that influence all housing
markets across the UK, indeed across much of the globe. There will, however, be others that
impact more locally and within specific housing sectors. It appears there are several
different and sometimes overlapping issues that mean housing is unaffordable, unavailable,
and unsuitable for everyone that needs it.

3    Understanding Local Housing Markets: Advice and Guidance for Local Authorities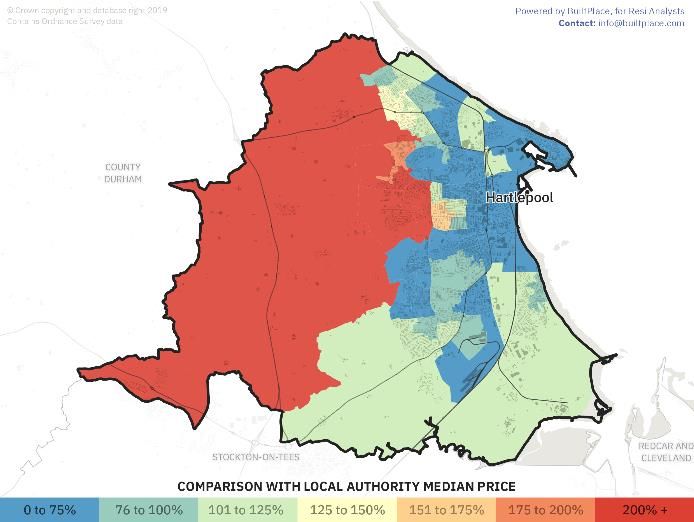
Report Guide and Summary
This section provides a guide to using this report and summary of the issues within it.
The report is split into three main sections, each one containing an introduction to
measuring the issues and the issues themselves. The three sections are:
    1. Affordability of Housing    2. Availability of Housing      3. Suitability of Housing
Each of the three main sections starts with an introduction to measuring the issues falling
within the section. The introductions provide links and guidance to using publicly available
data to measure these issues. They also highlight some of the common errors and
misinterpretations found when using these data sources. As such these introductions to
Measuring Affordability, Measuring Availability and Measuring Suitability may be of most
interest to those who deal directly with data and produce analysis. However, other readers
may still find them useful in furthering their understanding of housing.
The three main sections then provide summaries of 15 issues facing housing across England.
These are:
      High House Prices           High Cost of Housing           Low-Income Renters
       Financialisation         Falling Home-Ownership              Social Mobility
  Weak Economic Demand             Lack of New Supply              Market Turnover
         Distribution                 Homelessness           Weak Demographic Demand
       Housing Quality              Ageing Population               Climate Change
There are other housing issues but we consider these the most significant at this time. Some
of the identified issues are unique while others are interconnected with each other. Some of
the issues will be recognisable across the country while others will only be recognisable in
certain areas. The exact mix of housing issues will vary across every local authority with each
one facing its own unique set of challenges. However, while the exact mix will vary, there
will inevitably be other local authorities facing some of the same challenges. It is hoped that
this report and its supporting Local Authority Reports can help diagnose and begin to
explain some of the issues contributing to the housing challenges in your local area.
You as the local authority are best placed to know your local circumstances. Therefore,
rather than seeking to diagnose the challenges from afar, this report is intended to help
guide you in determining the issues and challenges facing your local area. To aid this, we
have provided a table overleaf containing some of the most common housing related
symptoms found across England. We have then identified which of the fifteen issues
discussed in this report that they are most likely linked to. It is quite likely that you may
recognise more than one symptom within your local authority. Given the ease of
misdiagnosis, we have also highlighted situations where this might occur. The report also
highlights symptoms where limited data prevents accurate identification, these may require
you to go out to collect data and ask questions about your own market.
Once diagnosis is complete, it will be necessary to identify the action required. While this is
beyond the scope of this report, some suggestions may be found within.

4      Understanding Local Housing Markets: Advice and Guidance for Local Authorities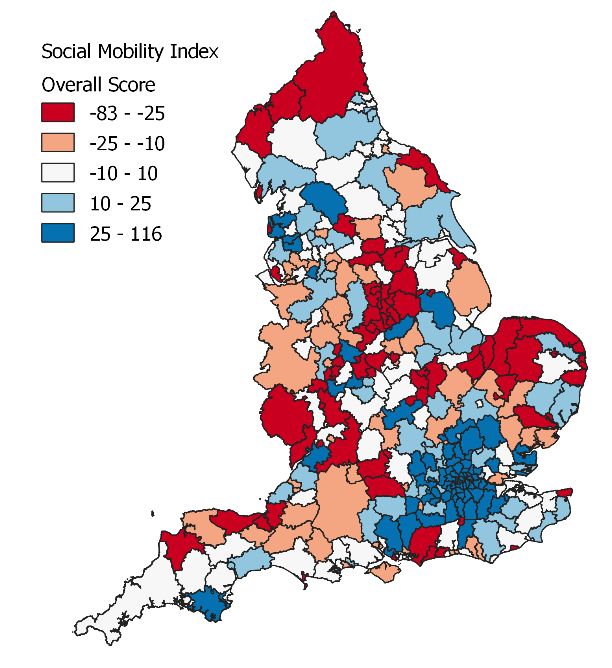
Symptom                                         Diagnosis
                      High house prices are commonly attributed to a lack of supply. This
                      may be the case in some areas but the financialisation of housing
Stretched House
                      and changes in mortgage lending conditions have played bigger
Price Affordability
                      roles in driving up national house prices. Other issues including the
                      distribution of housing and social mobility may also play a role.
                      Home-ownership is falling partly thanks to high house prices but
                      more so due to mortgage lending conditions since the credit crunch.
                      A lack of supply may constrain household formation but is unlikely
                      to have significantly impacted on home-ownership. The high cost of
Falling Home-
                      renting, particularly for lower income households, is a barrier for
Ownership
                      many trying to save a deposit. For others, it is a lack of economic
                      opportunity. Falling home-ownership has negatively affected social
                      mobility and, in combination with an ageing population, has
                      lowered housing market turnover.
                      The high cost of housing can be difficult to diagnose given the lack
                      of private rental data. A lack of new supply may be responsible in
                      many of the most stretched markets where high rents make it
                      difficult for many to save a deposit and access home-ownership.
                      However, stretched rental affordability is an issue across all areas
Stretched Rental
                      with external factors including mortgage lending criteria, investor
Affordability
                      behaviour, and government policy all impacting on low income
                      renters and potentially leading to homelessness. It’s not just the
                      cost of housing that needs to be considered but also the quality of
                      housing being purchased. Many renters consume less space or
                      poorer quality housing than would otherwise be desired.
                      The low turnover of existing housing stock is a big barrier to a
                      functioning housing market. It partly reflects high house prices and
                      falling home-ownership but is also linked to mortgage lending
                      conditions, weak economic demand, and the ageing population.
Low Market
                      Some markets have been negatively affected by tax changes in
Turnover
                      recent years while others have seen activity rise. A low turnover
                      market risks negative consequences for first-time buyers that rush
                      into home-ownership and may prevent the optimal distribution of
                      housing while limiting social and economic mobility.
                      Household sizes have been static or rising in recent years as more
                      young adults live with their parents or in over-crowded private
                      rental housing. A lack of new supply is partly responsible along with
                      high house prices but in some areas it may be due to local
Rising Household
                      preferences. Building more homes is the simple solution but the
Sizes
                      unequal distribution of housing raises some questions as new
                      supply could be purchased as second-homes or even left empty in
                      extreme cases. New homes must match the needs and affordability
                      of those who require them.

5   Understanding Local Housing Markets: Advice and Guidance for Local Authorities
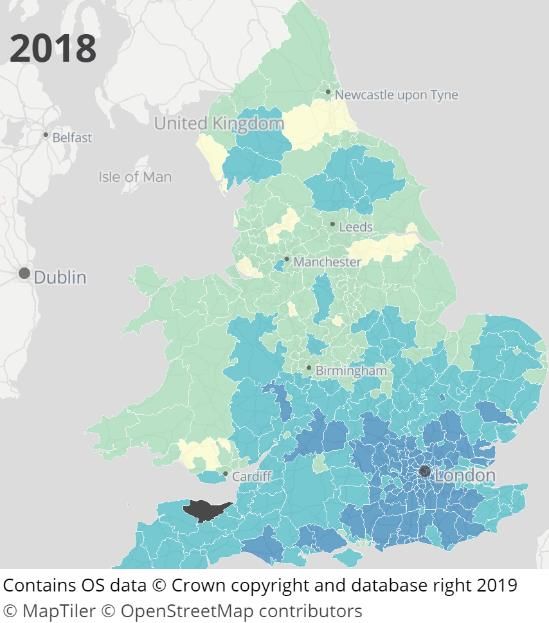
Local Authority Reports
This main report is accompanied by an individual
report and two maps for every local authority in
England. The reports and maps for each local
authority area can be downloaded via the
Residential Analysts website.
The local authority reports provide a summary of
publicly available data for the local authority in
question along with some national comparisons. The
analysis highlights some of the challenges faced by
that local authority in the context of the housing
issues covered in this main report. As such, this main
report should be used as a guide to help understand
the data and analysis in the local report.
The local authority reports are accompanied by two
maps. The first map shows house prices across the
local authority at a lower super output area
geography while the second map shows transactions
by type of property at a full postcode level.
The primary purpose of these two maps is to highlight how housing markets and the issues
they face can vary not just across different local authorities but also within each one.
The local house price map highlights how median house prices vary across the local
authority. For example, blue areas on the map have house prices below the local authority
median while red areas have house prices of two-times or more the local authority median.
The map also provides a summary of the ONS house price index since 2007, median house
prices by property type, and the relative share of transactions by property type (bar chart).
Figure 1 – Local House Prices
Source: BuiltPlace for Residential Analysts

6      Understanding Local Housing Markets: Advice and Guidance for Local Authorities
The local transaction map shows the location of residential transactions during 2018 by
postcode and property type. It also provides a summary of the ONS house price index since
2007, median prices by property type, and the relative share of transactions by property
type (bar chart). The local transaction map provides a guide to the geography of the local
authority’s housing market as can be seen in the Birmingham example below. The city
centre is highlighted by large numbers of flats (yellow) surrounded by terraced property in
green and semi-detached in blue. A concentration of detached properties (red) can be seen
in the north of the local authority.

Figure 2 – Local Transactions, Birmingham
Source: BuiltPlace for Residential Analysts

Ideally, the two maps should be used in tandem. For example, the house price map shows
prices by lower super output area but tells us nothing about the type of property selling or
how many sales there have been. An extreme example of this can be seen in Hartlepool as
per Figure 3. The house price map highlights a large red area with house prices of two-times
or more the local authority median to the west of the district. However, the transaction map
shows this area is lower density with fewer sales of typically detached homes. Therefore,
higher prices on the price map may reflect differences in the stock of property selling.
Figure 3 – Local House Prices and Transactions, Hartlepool
Source: BuiltPlace for Residential Analysts

7      Understanding Local Housing Markets: Advice and Guidance for Local Authorities
1. Affordability of Housing
Housing affordability is an issue because it is stretched for many people in this country.
National house prices are near record highs relative to earnings (Figure 4) and rents in many
London boroughs are over 50% of local earnings. The most popular explanation for this
stretched affordability is a lack of new supply. But there are several different ways of
measuring affordability and this suggests there are several different affordability-based
challenges affecting local markets to varying degrees across the country.
Figure 4 – House Price to Earnings Ratio, UK
Source: ONS Average Weekly Earnings and ONS House Price
                                 10.0
                                  9.0
                                  8.0
 House price to earnings ratio

                                  7.0
                                  6.0
                                  5.0
                                  4.0
                                  3.0
                                  2.0
                                  1.0
                                  0.0
                                        1968

                                               1972

                                                      1976

                                                             1980

                                                                    1984

                                                                           1988

                                                                                  1992

                                                                                         1996

                                                                                                2000

                                                                                                       2004

                                                                                                              2008

                                                                                                                     2012

                                                                                                                            2016
For example, the high price of houses (and flats) tends to reflect the cost and availability of
credit rather than a lack of new supply. Instead, a high and rising cost of housing (rents) is a
much better indicator for a lack of new supply.
Meanwhile, mortgage repayments are well within historic affordable levels for most owner-
occupiers, even recent first-time buyers. For many renters the barrier to home-ownership is
saving up a big enough deposit. This deposit barrier means access to home-ownership for
many renters is dictated by how much wealth their parents or grandparents can give them.
This suggests a growing issue with social mobility. Meanwhile, for others, a bigger barrier to
home-ownership is the lack of secure and well-paid employment opportunities. The issue is
economic rather than purely housing related.
This section of the report will look at the different ways of measuring housing affordability
and what they tell us about local housing challenges.

8                                  Understanding Local Housing Markets: Advice and Guidance for Local Authorities
1.1. Measuring Affordability
This section provides a brief look at the various ways of measuring affordability.
1.1.1. Measuring House Prices
There are several different house price measures, with different methodologies and
covering different parts of the market. This GOV.UK website provides a summary of the five
main indices. The national house price indices are useful indicators of macro trends but
there can be significant variation across regions and local authorities.
The ONS UK House Price Index (UK HPI) is the only index that provides publicly available
data at geographies below regional level. LSL Acadata and Hometrack also publish sub-
regional indices, but the data are not freely available to download.
The UK HPI is based on several data sources, one of which is the Land Registry price paid
data. This data contains individual property details on nearly all residential transactions
across England and Wales since 1995. The price paid data can be matched to other address
level data such as Energy Performance Certificates to create house price per square metre
data (for example as in this interactive map). The ONS have matched house price data to
Council Tax valuation lists from the Valuation Office Agency (VOA) to create price per square
metre and price per bedroom data (link).
1.1.2. Measuring House Price to Earnings Ratios
House price to earnings (or income) ratios are perhaps
Figure 5 –Price to Earnings Ratio
the most popular way of demonstrating the stretched Source: ONS UK HPI, ASHE
affordability of housing (e.g. Figure 4) and are regularly
used to highlight an affordability crisis. They are also an
important component in the standard method of
calculating housing need, using the ONS ratios.
Unfortunately, these ratios can be simplistic and
misunderstood due to the limitations of what and how
they are measured. They have no regard for changes in
interest rates and do not distinguish between the cost
of buying and the cost of owning.
Additionally, the comparison of a single house price to
a single earnings figure ignores issues such as the size
of the local rental market, any self-employed earners,
and the shift to multiple earner households.
It is also important to avoid assuming that the lowest ratio markets do not have constrained
house price affordability. Even the lowest priced areas have seen large increase in their ratio
over the last twenty years and recent work by Geoff Meen showed that 30% of renters in
the North East could not afford a property at the lowest house price decile.
9 Understanding Local Housing Markets: Advice and Guidance for Local Authorities1.1.3. Measuring the Cost of Owning
House price to earnings ratios may be near record highs but the cost of servicing a mortgage
is well within historically affordable levels (Figure 6). UK Finance data shows the median
new first-time buyer is currently spending around 17% of their gross income on mortgage
repayments. This reflects record low mortgage rates, longer mortgage terms, and a shift to
higher income buyers (see box-out). Unfortunately, local level measures of actual mortgage
affordability aren’t publicly available though estimates can be modelled.
Figure 6 – First-Time Buyer Initial Mortgage Costs as % of Gross Income, England
Source: UK Finance
30%
25%
As a % of gross income
20%
15%
10%
5% Interest Only Interest & Capital Interest & Capital
(actual) (calculated using 25yr term)
0%
1996
1974
1976
1978
1980
1982
1984
1986
1988
1990
1992
1994
1998
2000
2002
2004
2006
2008
2010
2012
2014
2016
2018
1.1.4. Measuring the Cost of Buying
For many prospective first-time buyers, the cost of buying is the biggest barrier to home-
ownership. High house prices relative to incomes and the withdrawal of higher loan-to-
value mortgages during the credit crunch are a large barrier. While the availability of higher
loan-to-value mortgages has increased in recent years and their cost has fallen, UK Finance
and ONS data show the typical deposit required to become a first-time buyer is still
substantial. Local level estimates for the deposit barrier and need for housing equity can be
inferred from house price to earnings ratios. However, it is very difficult to directly measure
the access to savings/deposits for prospective first-time buyers at a local level.
Figure 7 – First-Time Buyer Deposits as % of Income
Source: calculated using UK Finance medians
150%
North West England London
125%
As a % of gross income
100%
75%
50%
25%
0%
1978
2012
1974
1976
1980
1982
1984
1986
1988
1990
1992
1994
1996
1998
2000
2002
2004
2006
2008
2010
2014
2016
2018
10 Understanding Local Housing Markets: Advice and Guidance for Local AuthoritiesBeyond Averages and Aggregates: First-Time Buyer Incomes
First-time buyers have always tended to have higher incomes than average. The chart
below shows how 64% of recent first-time buyers are in the top 40% of the income
distribution. Meanwhile, only 13% are in the bottom 40% of incomes. This suggests that
calculations using simple average earnings and incomes may over-state the affordability
constraints for those managing to buy and under-state affordability constraints for those
unable to buy.
Figure 8 – Income Distribution of Recent First-Time Buyers
Source: English Housing Survey 2015/16 and 2017/18
45% 1995-96 2005-06 2015-16 2017-18
40%
% of recent first-time buyers
35%
30%
25%
20%
15%
10%
5%
0%
First Quintile Second Quintile Third Quintile Fourth Quintile Fifth Quintile
(lowest income) (highest income)
Gross income
This issue can be seen in the comparison of two sources for first-time buyer mortgage
repayment affordability in London (Figure 9). The Nationwide data is based on the mean
sole earnings of a full-time worker and shows the stretched repayment affordability they
would be experiencing if they could buy alone with a 90% loan-to-value (LTV) mortgage.
However, as UK Finance data shows, the repayment affordability for actual first-time
buyers in London is well within affordable levels based on their much higher than average
joint gross household income. Buying with a partner or others has become more
important with 60% of new mortgages now based on joint incomes. A 90% LTV mortgage
would probably be unavailable for most London buyers due to the soft cap on mortgages
with loan-to-income ratios above 4.5.ONS published analysis in 2018 comparing the
affordability of potential first-time buyers to actual ones across local authorities.
Figure 9 – First-Time Buyer Initial Mortgage Repayments, London
Source: Nationwide, UK Finance
100% Nationwide
90% UK Finance (calcuated using 25yr term)
Percent of earnings/income
80%
UK Finance (actual)
70%
60%
50%
40%
30%
20%
10%
0%
1983
1984
1985
1986
1988
1989
1990
1991
1993
1994
1995
1996
1998
1999
2000
2001
2003
2004
2005
2006
2008
2009
2010
2011
2013
2014
2015
2016
2018
11 Understanding Local Housing Markets: Advice and Guidance for Local Authorities1.1.5. Measuring the Cost of Renting
Over one-third of households now live in the rented sector but limited publicly available
rental data is a big challenge, particularly for the private rented sector. It hampers our
ability to measure how much renting households actually pay and their affordability at a
local level.
In the private rented sector, the VOA publishes useful summaries of local market rents by
number of bedrooms and quartile. These can also be supplemented with data from property
listings sites as the gap between asking and achieved rents is less of an issue than for house
prices though some agents may manipulate the listings giving a false impression of turnover.
Unfortunately, the VOA data cannot be reliably compared across time due to changes in the
mix of properties measured. For national and regional geographies, the ONS index provides
a useful time-series for the stock of private rents paid. This is different to most other
published rental indices that measure the flow of new rents agreed (e.g. HomeLet and LSL).
The ONS index shows that national private rents have risen broadly in line with earnings
(Figure 10), suggesting private rental affordability has not worsened in recent years. This is
looked at in more detail in Section 1.3. Unfortunately, the lack of sub-regional indices means
there is no easy way to measure rental growth at a local authority level. We can assess
affordability at fixed points in time by comparing the VOA data to ONS earnings data.
However, doing so raises some of the same issues as when comparing average house prices
to average earnings.
Figure 10 – Private Rents and Earnings, England
Source: MHCLG, ONS
130
125
120
Index, 2007=100
115
110
105
100
95
Private Rents
90 Earnings
85
2009
2005
2006
2007
2008
2010
2011
2012
2013
2014
2015
2016
2017
2018
There are more data sources available for Local Authority and Registered Provider rents
including averages from MHCLG. However, these are not adjusted for differences in
properties over time and any change in affordable rents may reflect housing policy rather
than underlying need. For example the recent declines in average rents may reflect the
obligation on social landlords to reduce rents by 1% per year from April 2016.
12 Understanding Local Housing Markets: Advice and Guidance for Local Authorities1.1.6. Measuring the Long-Term Costs of Housing
Home-ownership has consistently been the preferred housing tenure for most people in this
country. Owning your own home has typically provided stability, a hedge against rising
housing costs in the future, and a successful financial investment. However, the current
economic conditions suggest that those stretching themselves to ‘get on the housing ladder’
may face unwelcome side-effects in the future.
The housing ladder was a common feature of the UK housing market of the last fifty years.
Unfortunately, it appears the economic conditions that enabled it are unlikely to return
(high inflation of the 1970s/80s and falling borrowing costs in the 1990s/00s). Households
are finding it harder to move to a new home thanks to high house prices, low income
growth, and limited capacity to borrow more. Stamp duty and other transaction costs are
also a constraint but the single biggest one is the lack of sustained income growth.
Meanwhile, to afford current house prices and pass affordability stress-tests, first-time
buyers now have longer mortgage terms (66% have a term longer than 25 years) and new
borrowers appear more likely to have a mortgage post retirement (Figure 11).
Figure 11 – Borrower Aged Over 65 At End of Mortgage
Source: FCA Sector Views, January 2019
45%
Percent of mortgage advances
40%
35%
30%
25%
20%
15%
10%
5%
0%
2012 2013 2014 2015 2016
All these factors suggest that any household stretching themselves to buy a home that
meets their current needs but may not meet future ones (e.g. more space due to a growing
family) could find themselves trapped and unable to move. This could be particularly risky
for households using financial products beyond just a simple mortgage such as those where
they have to share in capital growth and/or pay rent on secondary borrowing.
Meanwhile, there are a growing number of people who may be stuck living in the private
rented sector into retirement. Without the ability to limit any future rises in housing costs,
these people may find retirement a very different proposition than for those living in a
home they own outright.
Measuring the long-term cost of housing is clearly difficult if not impossible. Much of our
understanding and expectations of housing are based on our historic experiences. However,
the future could be very different and is unknowable. Therefore, we need to plan carefully
to avoid any unwelcome side-effects in the event the future is not like the past.
13 Understanding Local Housing Markets: Advice and Guidance for Local Authorities1.2. High House Prices
High house prices are perhaps the most recognised and easiest to identify of all the housing
challenges given the availability of house price data (Section 1.1.1). The affordability
problems created by high house prices are also well known, including the need for large
deposits and the resultant barriers to home-ownership. However, there is much more
debate about why house prices are high and how to fix them.
The most popular explanation and the one underpinning central Government policy is that
the long-running under-supply of new homes is at fault. While a lack of new supply may
contribute to rising housing prices, a lack of supply is typically seen in the rising cost of
housing. It is these two uses of a home that can create confusion: house prices reflect the
value of a home as an asset while housing costs reflect its use as somewhere to live.
An asset can be priced by capitalising its income with a discount rate. For a home, the
income is reflected by the housing cost (see next section) while the discount rate reflects
mortgage rates and alternative investment returns. Under this model a lack of supply would
typically be seen in rising housing costs which would then push up house prices via
capitalisation.
Instead, if housing costs are fixed, the other way for house prices to rise is changes in the
discount rate. Figure 12 compares a simple model of house prices to actual ones. The model
is based on average earnings as a proxy for housing costs and prevailing mortgage rates as
the discount rate. The model suggests that falling mortgage rates have had the biggest
impact on house prices over the last three decades, though the late 1980s and early 2000s
booms clearly require further explanation.
Figure 12 – House Prices – Actual and Modelled, UK
Source: ONS, UK Finance (model uses average wage, average mortgage rate net of MIRAS, repayments:30%, and LTV:70%)
£250,000 Actual House Price Modelled House Price
£200,000
Nominal house price
£150,000
£100,000
£50,000
£0
1970
1992
1968
1972
1974
1976
1978
1980
1982
1984
1986
1988
1990
1994
1996
1998
2000
2002
2004
2006
2008
2010
2012
2014
2016
2018
As the local level analysis shows, high house prices are a serious issue across the country.
However, it is dangerous to simply assign the challenge of high house prices to a lack of
supply, low interest rates or some other cause without assessing other measures such as the
cost of housing and demographics.
HIGH HOUSE PRICE SUMMARY: High house prices are a very useful measure of housing
market stress, but local authorities should avoid interpreting them as simply reflecting a
lack of new build supply or some other singular issue.
14 Understanding Local Housing Markets: Advice and Guidance for Local Authorities1.3. High Cost of Housing
High house prices may get more newspaper headlines but the high cost of housing (rents) is
the more pressing issue, especially for those struggling or unable to buy. As Figure 13 shows,
there is a clear difference in average housing costs across tenures. For most owner-
occupiers, including recent first-time buyers, the cost of owning their own home is well
within affordable levels despite high house prices (see section 1.1.3). However, as the chart
shows, households in the rented sectors spend a much larger proportion of their income on
housing, even once housing benefit is factored in.
Figure 13 – Housing Costs as % of Household Income Including Housing Benefit, England
Source: English Housing Survey
40%
35%
As a % of household income
30%
25%
20%
15%
10%
5%
Mortgaged Owners Private Renters Social Renters
0%
2010-11 2011-12 2012-13 2013-14 2014-15 2015-16 2016-17 2017-18
The high cost of housing for renters creates multiple problems and is directly linked to other
housing issues, including over-crowding, tenure insecurity, and poor-quality housing. It also
accentuates the issues with high house prices by constraining renters’ ability to save for a
deposit and become home-owners.
Tackling the high cost of housing should be a priority but the lack of data makes it difficult to
assess how much of a problem it is and where it is located, particularly in the private rented
sector. As Section 1.1.5 showed, it is possible to make simple assessments of rental
affordability across local authority at fixed points in time by comparing rents to average
earnings. However, this is too blunt to accurately assess how issues like Local Housing
Allowance and changes to housing benefit impact on different household types.
Unfortunately, it is nearly impossible to accurately track the change in rental costs over time
below regional level. Tracking changes in rental affordability over time is important because
a high cost of housing does not necessarily indicate a lack of supply. A lack of supply would
normally be associated with a rising cost of housing. However, as Figure 9 showed, rents
across England have risen in-line with earnings in recent years. Combined with the above
chart it appears national housing costs are high but have been stable in recent years.
15 Understanding Local Housing Markets: Advice and Guidance for Local AuthoritiesThe stability of housing costs at a national level may possibly suggest there is no national
lack of supply. However, the lack of local data tracking rents and housing costs over time
makes it more difficult to definitively assess whether there is or isn’t a lack of supply in local
housing markets. For example, as Figure 14 shows, the ONS private rent index suggests
rental growth has been relatively low across most English regions over the last decade with
the exception of London, at least until 2017.
Figure 14 – Annual Change in Private Rents
Source: ONS Private Rent Index
6% London
5% Rest of England
Annual change
4%
3%
2%
1%
0%
-1%
-2%
2006
2007
2008
2009
2010
2011
2012
2013
2014
2015
2016
2017
2018
2019
HIGH HOUSING COSTS SUMMARY: High housing costs are a significant issue for renters in
many markets but the lack of data will make it difficult for local authorities to accurately
assess the pressures in their local market. Ideally local authorities would be able to
measure the change in housing costs over time.
16 Understanding Local Housing Markets: Advice and Guidance for Local Authorities1.4. Low-Income Renters
Housing benefit plays an important role in enabling low-income renters to afford their rent.
For example, the English Housing Survey shows the average social rented household’s
housing costs were reduced from 37% to 28% of their income by housing benefit.
The total number of housing benefit claimants has fallen in recent years (Figure 15) and
government expenditure on housing benefit has also fallen. Despite these falls, there are
still many local markets where housing benefit claimants make up a large proportion of the
private rented sector leaving them exposed to changes benefits. These changes include the
household benefit cap and a freeze to Local Housing Allowance (LHA) which are causing
issues for many low-income households, particularly in the private rented sector. Given the
wider affordability picture, it is likely the fall in housing benefit claimants results from
reduced welfare spending rather than reducing demand.
Figure 15 – Housing Benefit Claimants by Tenure
Source: DWP
3,500,000 LA Tenants
Number of claimants
3,000,000 RSL Tenants
2,500,000 Private Rented Tenants
2,000,000
1,500,000
1,000,000
500,000
0
1993/94
2012/13
1992/93
1994/95
1995/96
1996/97
1997/98
1998/99
1999/00
2000/01
2001/02
2002/03
2003/04
2004/05
2005/06
2006/07
2007/08
2008/09
2009/10
2010/11
2011/12
2013/14
2014/15
2015/16
2016/17
2017/18
LHA was originally intended to be equivalent to the 30th percentile of private rents across
the Broad Rental Market Area (BRMA) for a given property type. However, the freeze in LHA
since 2016 has resulted a growing gap between LHA and 30th percentile rents. Figure 16
shows that LHA only covers 95% or more of rent in just 31 of 152 of BRMAs. It also shows
the gap is bigger in BRMAs with higher rents. Households must make up the difference from
other income, including other benefits. However, this is made more difficult for those
subject to the cap in total household benefit. It is also important to consider the impact on
different household types including single parents and young people.
Figure 16 – Local Housing Allowance as % of 30th Percentile Rent by BRMA and Weekly Rent
Source: Calculated using VOA data for 2 bed properties, 2018
80 Weekly Rent
Over £250
Number of BRMAs
60 £200 to £250
£150 to £200
40
£100 to £150
Up to £100
20
0
Up to 80% 80% to 85% 85% to 90% 90% to 95% Over 95%
LHA as % of 30th percentile rent
LOW INCOME RENTERS SUMMARY: Local authorities need to be aware of how changes to
housing benefit (cap, LHA freeze etc) are affecting different groups of renters.
17 Understanding Local Housing Markets: Advice and Guidance for Local Authorities1.5. Financialisation of Housing
The fall in global interest rates has played an important role in the substantial rise of UK
house prices over the last thirty years. The fall in interest rates was seen in most developed
economies across the world but not all saw a similar rise in house prices. There are
numerous reasons for this including the responsiveness of new supply but the links between
the UK’s economy, lenders, and housing market make UK house prices very susceptible to
any changes in macro-economic conditions, banking regulation, and housing policy.
All the post-war housing booms and busts featured a combination of these factors but the
late 1990s/early 2000s have had a lasting impact. It’s more likely that looser mortgage
lending conditions followed rather than led house price rises during the boom but it’s clear
that the massive increase in the volume of lending (Figure 17) along with relaxed lending
criteria (higher loan-to-income and loan-to-value ratios, income self-certification, interest-
only, and sub-prime lending amongst others) contributed to rising house prices.
Figure 17 – Gross and Net Lending Secured on Dwellings, UK
Source: Bank of England
£100,000,000,000 Gross Lending
£90,000,000,000 Net Change in Lending
£80,000,000,000
£70,000,000,000
£60,000,000,000
£50,000,000,000
£40,000,000,000
£30,000,000,000
£20,000,000,000
£10,000,000,000
£0
Q4 2000
Q4 1987
Q4 1988
Q4 1989
Q4 1990
Q4 1991
Q4 1992
Q4 1993
Q4 1994
Q4 1995
Q4 1996
Q4 1997
Q4 1998
Q4 1999
Q4 2001
Q4 2002
Q4 2003
Q4 2004
Q4 2005
Q4 2006
Q4 2007
Q4 2008
Q4 2009
Q4 2010
Q4 2011
Q4 2012
Q4 2013
Q4 2014
Q4 2015
Q4 2016
Q4 2017
Q4 2018
The combination of rapidly rising house prices, an advantageous tax system, and readily
available mortgage debt enabled more people to move home, buy second homes, and buy
investment properties. Many did so under the assumption that house prices would continue
to rise in the future and saw significant benefits when prices did. Housing was increasingly
viewed by many as a financial asset rather than just a home.
The financialisation of housing may have benefited most home-owners but there are many
others who have been negatively impacted by it. For example, the growth in landlords and
the private rented sector was enabled by the introduction of the assured shorthold tenancy
and the buy-to-let mortgage lending market. Prospective first-time buyers soon found
themselves competing with and being outbid by investors.
18 Understanding Local Housing Markets: Advice and Guidance for Local AuthoritiesFirst-time buyers are no longer being outbid by investors thanks to a combination of tax
changes and the greater availability of higher loan-to-value mortgages. This has seen first-
time buyers take the place of investors in most markets outside London. As Figure 18 shows,
it appears the rise in private rented households has levelled out in the last couple of years
but it’s still important to understand how these changes have negatively impacted people.
Figure 18 – Private Rented Household, England
Source: English Housing Survey
5,000,000
4,500,000
Households
4,000,000
3,500,000
3,000,000
2,500,000
2,000,000
1,500,000
1,000,000
500,000 Labour Force Survey English Housing Survey
0
1980
1982
1984
1986
1988
1990
1992
1994
1996
1998
2000
2002
2004
2006
2008
2010
2012
2014
2016
2018
It’s not just first-time buyers that investors have priced out. The financialisation of property
also coincided with the rapid growth in the number of students attending higher education.
The growth in student numbers was far greater than could be housed in existing university
accommodation and so local markets were left to deal with the surplus of rental demand.
Potential home movers found themselves crowded out by investors able to pay much higher
prices thanks to the rents generated by squeezing students into what had been family
homes. While the activity of investors has diminished in most markets and the growth in
purpose-built accommodation has helped, the high concentrations of student households
living in family homes has had a lasting effect on many local housing markets.
Many of the problems described in this report fit into more than one issue. For example, the
student housing issue above is not just about financialisation but also housing distribution
(see section 2.4). This is also the case for second homes. The conditions created by the
financialisation of housing enabled more people to buy second homes in city centres, and
desirable rural and coastal locations. This has had a direct effect on house price affordability
in many of these locations, leaving local residents less able to afford to buy in their local
markets.
FINANCIALISATION OF HOUSING SUMMARY: The effects of financialised housing are
varied and will depend on the geographic, social, and economic profile of your local
authority.
19 Understanding Local Housing Markets: Advice and Guidance for Local Authorities1.6. Falling Home-Ownership
Home-ownership is this country’s preferred tenure, housing nearly two-thirds (64%) of
household and surveys repeatedly show that most people aspire to own their own home.
Unfortunately, that aspiration has become increasingly unrealised for many people.
Home-ownership has fallen from its peak in the early 2000s (71% of households) while the
number of mortgaged home-ownership stagnated through the 1990s and early 2000s. That
stagnation reflects several factors including the ageing baby boomer generation moving into
outright ownership and constrained housing affordability amongst lower income
households. However, it was the credit crunch that is responsible for most of the decline in
mortgaged home-ownership.
The credit crunch led to the withdrawal of higher loan-to-value mortgages and this created
a massive deposit barrier preventing many prospective first-time buyers from buying (see
Section 1.1.4). Mortgaged home-ownership has fallen by over one million households since
2007 (Figure 19 below).
Figure 19 – Mortgaged Home-Owning Households, England
Source: ONS LFS, MHCLG English Housing Survey
9,000,000
8,500,000
8,000,000
Households
7,500,000
7,000,000
6,500,000
6,000,000
5,500,000 Labour Force Survey
English Housing Survey
5,000,000
2004
2006
1980
1982
1984
1986
1988
1990
1992
1994
1996
1998
2000
2002
2008
2010
2012
2014
2016
2018
The fall in home-ownership would not necessarily be a problem if the alternatives offered
similar benefits such as security of tenure, cost, quality, advantageous tax incentives, and
the ability to minimise housing costs in retirement. Unfortunately, many of those priced out
of home-ownership end up living in the private rented sector, which has none of those
benefits. Reforming the private rented sector to offer at least some of those benefits would
be an improvement but home-ownership remains the preferred tenure, not least thanks to
the continued assumption that house prices will rise in the future.
Recent years have seen housing policy target first-time buyers with the intention of
increasing home-ownership. Higher loan-to-value mortgages have increased in availability
and have reduced their mortgage rate premium to lower loan-to-value products.
Meanwhile, the changes to Stamp Duty Land Tax have hit investors and helped first-time
buyers replace them in all but the highest house price markets. Surveys now suggest that
mortgaged home-ownership has started to rise again in the last couple of years (Figure 19).
20 Understanding Local Housing Markets: Advice and Guidance for Local AuthoritiesHome-ownership may be rising again but many people have and will continue to be affected
by both the credit crunch and high house prices relative to incomes. As Figure 20 shows,
home-ownership rates for younger generations are recovering but are still lower than for
previous generations at any given age. It’s possible that these generations could see lower
home-ownership rates forever even if the mortgage market continues to improve as house
price affordability remains a constraint, particularly for less wealthy and lower income
households.
Figure 20 – Home-Ownership Rate by Age Cohort (Year Born), UK
Source: ONS Labour Force Survey
90%
80% 1946
% of households owning their home
1961 1951 1941
70% 1956
1966
1971
60% 1976
1981
50%
1986
40%
30% 1991
20%
10% 1996
0%
15 20 25 30 35 40 45 50 55 60 65 70 75
At age
FALLING HOME-OWNERSHIP SUMMARY: People were already struggling to access home-
ownership prior to the recession but mortgage lending conditions following the credit
crunch have been the biggest barrier. Local authorities may struggle to influence local
home-ownership rates given the importance of wider economic conditions and limited
evidence that building new homes has an effect on home-ownership rates
21 Understanding Local Housing Markets: Advice and Guidance for Local Authorities1.7. Social Mobility
Social mobility is a much bigger issue than just housing, but housing plays an important part
in both enabling and preventing disadvantaged people from making social progress.
The barriers to social mobility can take many Figure 21 – Social Mobility Index by LA
forms. The Social Mobility Commission Source: Social Mobility Commission
published their fifth ‘State of the Nation’
report in 2017. It noted that: “The divide is
not just an economic or social one. It takes
the form of a widening geographical divide”.
As part of that report they published a Social
Mobility Index. Figure 21 shows the overall
score across all local authorities with blue
representing areas of high social mobility and
red representing areas of low social mobility.
The report highlighted that: “There is no
simple north/south divide. Instead, a divide
exists between London (and its affluent
commuter belt) and the rest of the country –
London accounts for nearly two-thirds of all
social mobility hotspots.”
London and its affluent suburbs may rank most highly overall for social mobility, but the
underlying unaffordability of its housing markets are a big problem as pointed out by recent
LSE research. Young peoples’ ability to access home-ownership is increasingly determined
by whether their parents are home-owners or not. As section 1.1.4 showed, managing to
raise a deposit is a big barrier for many prospective first-time buyers. This has meant that
increasing numbers are now reliant on the ‘bank of mum and dad’ as shown by Figure 22
below. This is an even bigger issue for the most expensive markets like London where the
required deposit is so large that there’s little hope of saving up and it requires borrowing
from a very wealthy ‘bank of mum and dad’, one probably already based in London.
Figure 22 – Source of First-Time Buyer Deposit, England
Source: English Housing Survey (more than one answer could be given)
100% 1995-96
2005-06
% of recent first-time
80%
2017-18
60%
buyers
40%
20%
0%
Savings Gift/Loan From Inheritance Other Source
Family/Friend
SOCIAL MOBILITY SUMMARY: Social mobility is a bigger issue for local authorities than
just housing but it is an important factor to include in any assessment.
22 Understanding Local Housing Markets: Advice and Guidance for Local Authorities1.8. Weak Economic Demand
The challenges described above have generally focussed on the most unaffordable of
markets, usually in terms of house price. However, even the markets with the lowest house
price to earnings ratios have considerable affordability challenges. As highlighted in section
1.1.2, recent work by Geoff Meen showed that 30% of renters in the North East could not
afford a property at the lowest house price decile. For many people in this area and others,
the challenge is not just the cost of a home but also the underlying economic conditions.
Recent years have seen many people across the UK experience a cost of living squeeze as
wages have risen slower than inflation (Figure 23). Meanwhile a lack of job opportunities
and employment insecurity all contribute to a situation where people are unable or
unwilling to rent or buy appropriate housing.
With much stricter mortgage lending regulations, many prospective first-time buyers in
economically weaker areas may struggle to pass affordability tests. Even when they do, the
underlying insecurity of their employment situation may leave many wondering whether a
long-term commitment to paying a mortgage is a sensible decision, especially when the cost
of renting is relatively affordable.
Figure 23 – Wage Growth and Inflation, UK
Source: ONS
6%
Inflation
Wages
Annual change
5%
4%
3%
2%
1%
0%
2018
2000
2001
2002
2003
2004
2005
2006
2007
2008
2009
2010
2011
2012
2013
2014
2015
2016
2017
Measuring the economic challenges in local areas is relatively easy thanks to large amounts
of ONS data. However, it can be more difficult to assess who is most affected by these issues
below a regional level without primary data collection through surveys.
WEAK ECONOMIC DEMAND SUMMARY: Even local authorities with apparently
‘affordable’ house prices will contain households struggling with unaffordable housing
due to local economic challenges and other issues.
23 Understanding Local Housing Markets: Advice and Guidance for Local Authorities2. Availability of Housing
Housing is unavailable for everyone that needs it because we have not been building
enough new homes is the most popular housing crisis narrative. The typical argument is that
new-build supply has consistently failed to meet the rate of projected household formation
and increasing new housing supply to this rate or above is widely seen as the solution.
Building new homes is essential to making housing available for everyone that needs it and
new supply has been increasing in recent years (Figure 24 below). However, the lack of new
homes is only part of the problem for many local markets. New homes only account for
around 10-12% of all residential transactions and so the second-hand market tends to
provide most of the available housing supply at any given time.
Figure 24 – New Build Completions by Tenure, England
Source: MHCLG Tables 213 and 120
400,000 Unknown
Housing Associations
350,000 Local Authorities
Private Enterprise
300,000
New build completions
250,000
200,000
150,000
100,000
50,000
0
1956
1946
1966
1976
1986
1996
2006
2016
The dependence on existing housing stock for most housing transactions means that the low
turnover of existing homes is a big problem for many areas. This is particularly the case
where housing is unevenly distributed. Housing can be unevenly distributed in terms of
space and location. For example, many older households have more space than they
regularly need while younger larger households squeeze into homes that are too small for
their needs. Meanwhile some areas with strong demographic demand may not have enough
homes while other areas with weak demographic demand may have too many homes.
Understanding how the availability of homes varies across local markets is essential to
ensuring new supply is most effective. Ideally, it should also be cross-referenced against
plans for economic growth and infrastructure improvements.
This section of the report will look at the different ways of measuring the availability of
housing and measures of housing need and demand. It will then look at what they tell us
about local housing challenges.
24 Understanding Local Housing Markets: Advice and Guidance for Local Authorities2.1. Measuring Availability
This section looks at the various ways of measuring the availability of housing.
2.1.1. Measuring Existing Housing Stock
The first step in measuring the availability of housing is to understand the existing dwelling
stock. Fortunately, there are several different sources for data on dwellings in England with
varying levels of detail and geography. These include:
Census
MHCLG English Housing Survey
MHCLG Dwelling Stock
MHCLG Council Taxbase
VOA Council Tax
The Census provides a very useful and detailed decennial look at the population and housing
profile of residents in England and Wales. It provides very granular geographic data which is
available from the slightly intimidating Nomis website and has been used to create
resources such as the mapping website DataShine. One difficulty with the Census is that it is
based on population so there are some differences in definitions and variables. For example,
accommodation type is measured by household space rather than dwelling (there can be
multiple household spaces in one dwelling) while tenure and number of bedrooms is
typically measured by households.
The English Housing Survey provides a more detailed annual look at dwellings than the
Census (and the housing circumstances of households as it is two surveys in one). However,
it is a much smaller sample and published data is usually limited to former government
office region level or above. It is weighted using MHCLG’s Dwelling Stock so matches these
numbers. The detailed survey responses are available by request from UK Data Service.
MHCLG’s Dwelling Stock data also provides estimates for the number of dwellings at a local
authority level by tenure. Meanwhile the Council Tax based statistics from MHCLG and VOA
provide more detailed information on Council Tax exemptions and property characteristics
(tax band, property type and build period) respectively.
Figure 25 – Housing Stock by Tenure and Type of Dwelling, England
Source: English Housing Survey Stock Profile 2017
8,000,000 Social Sector
7,000,000 Private Rented
6,000,000 Owner Occupied
Dwellings
5,000,000
4,000,000
3,000,000
2,000,000
1,000,000
0
Terraced Houses Semi-Detached Detached Houses Bungalows Flats
Houses
25 Understanding Local Housing Markets: Advice and Guidance for Local AuthoritiesYou can also read