Reduced replication fork speed promotes pancreatic endocrine differentiation and controls graft size - JCI Insight
←
→
Page content transcription
If your browser does not render page correctly, please read the page content below
Reduced replication fork speed promotes pancreatic endocrine
differentiation and controls graft size
Lina Sui, … , Sandra Kleiner, Dieter Egli
JCI Insight. 2021;6(5):e141553. https://doi.org/10.1172/jci.insight.141553.

 Research Article    Cell biology   Stem cells

Limitations in cell proliferation are important for normal function of differentiated tissues and essential for the safety of cell
replacement products made from pluripotent stem cells, which have unlimited proliferative potential. To evaluate whether
these limitations can be established pharmacologically, we exposed pancreatic progenitors differentiating from human
pluripotent stem cells to small molecules that interfere with cell cycle progression either by inducing G1 arrest or by
impairing S phase entry or S phase completion and determined growth potential, differentiation, and function of insulin-
producing endocrine cells. We found that the combination of G 1 arrest with a compromised ability to complete DNA
replication promoted the differentiation of pancreatic progenitor cells toward insulin-producing cells and could substitute
for endocrine differentiation factors. Reduced replication fork speed during differentiation improved the stability of insulin
expression, and the resulting cells protected mice from diabetes without the formation of cystic growths. The proliferative
potential of grafts was proportional to the reduction of replication fork speed during pancreatic differentiation. Therefore, a
compromised ability to enter and complete S phase is a functionally important property of pancreatic endocrine
differentiation, can be achieved by reducing replication fork speed, and is an important determinant of cell-intrinsic
limitations of growth.

Find the latest version:
https://jci.me/141553/pdf
RESEARCH ARTICLE

                                         Reduced replication fork speed promotes
                                         pancreatic endocrine differentiation and
                                         controls graft size
                                         Lina Sui,1,2 Yurong Xin,3 Qian Du,1,2 Daniela Georgieva,1,2 Giacomo Diedenhofen,1,4 Leena Haataja,5
                                         Qi Su,3 Michael V. Zuccaro,6 Jinrang Kim,3 Jiayu Fu,1 Yuan Xing,7 Yi He,7 Danielle Baum,1
                                         Robin S. Goland,1,2 Yong Wang,7 Jose Oberholzer,7 Fabrizio Barbetti,7 Peter Arvan,7 Sandra Kleiner,3
                                         and Dieter Egli1,2
                                         Naomi Berrie Diabetes Center, Columbia University, New York, New York, USA. 2Department of Pediatrics, Department
                                         1

                                         of Obstetrics and Gynecology, Columbia Stem Cell Initiative, Columbia Irving Medical Center, Columbia University, New
                                         York, New York, USA. 3Regeneron Pharmaceuticals, Inc., Tarrytown, New York, USA. 4Bambino Gesù Children’s Hospital,
                                         Rome, Italy. 5Division of Metabolism, Endocrinology & Diabetes, Department of Internal Medicine, University of
                                         Michigan, Ann Arbor, Michigan, USA. 6PhD program in the Department of Physiology and Cellular Biophysics, Columbia
                                         Irving Medical Center, Columbia University, New York, New York, USA. 7Department of Surgery, University of Virginia,
                                         Charlottesville, Virginia, USA.

                                                  Limitations in cell proliferation are important for normal function of differentiated tissues and
                                                  essential for the safety of cell replacement products made from pluripotent stem cells, which
                                                  have unlimited proliferative potential. To evaluate whether these limitations can be established
                                                  pharmacologically, we exposed pancreatic progenitors differentiating from human pluripotent
                                                  stem cells to small molecules that interfere with cell cycle progression either by inducing G1
                                                  arrest or by impairing S phase entry or S phase completion and determined growth potential,
                                                  differentiation, and function of insulin-producing endocrine cells. We found that the combination
                                                  of G1 arrest with a compromised ability to complete DNA replication promoted the differentiation
                                                  of pancreatic progenitor cells toward insulin-producing cells and could substitute for endocrine
                                                  differentiation factors. Reduced replication fork speed during differentiation improved the
                                                  stability of insulin expression, and the resulting cells protected mice from diabetes without
                                                  the formation of cystic growths. The proliferative potential of grafts was proportional to the
                                                  reduction of replication fork speed during pancreatic differentiation. Therefore, a compromised
                                                  ability to enter and complete S phase is a functionally important property of pancreatic
                                                  endocrine differentiation, can be achieved by reducing replication fork speed, and is an important
                                                  determinant of cell-intrinsic limitations of growth.

Conflict of interest: Y Xin, QS, JK,
and SK are employees of Regeneron        Introduction
Pharmaceuticals. JO is a scientific      The unlimited proliferation potential of human pluripotent stem cells is both an opportunity as well
founder and shareholder of CellTrans     as a challenge: it provides a renewable source of cells for cell replacement for degenerative disorders
Inc. and Sigilon Therapeutics.           such as diabetes, but it is also a risk for the formation of growths in cell transplants. Limitations in
Copyright: © 2021, Sui et al. This is    proliferation potential are established in parallel to limitations in differentiation potential; cells of the
an open access article published under   adult pancreas have largely stable identities and a very low proliferative and regenerative potential.
the terms of the Creative Commons        Limitations in cell proliferation of the pancreas are cell intrinsic and established during embryonic
Attribution 4.0 International License.   expansion of pancreatic progenitors (1). Proliferation of β cells in the developing human pancreas
Submitted: June 22, 2020                 occurs primarily during embryogenesis, and declines after birth, and proliferation in adult β cells is
Accepted: January 28, 2021               essentially absent (2, 3). During terminal differentiation, many cell types, including neurons and mus-
Published: February 2, 2021              cle cells, exit the cell cycle as they adopt full functionality (4, 5). When forced into the cell cycle, adult
                                         β cells and neurons frequently undergo apoptosis (6, 7), suggesting a compromised ability to progress
Reference information: JCI Insight.
2021;6(5):e141553.                       and complete S phase. Whether these limitations in S phase progression play a functional role in
https://doi.org/10.1172/jci.             establishing cell-intrinsic limitations in cell proliferation and are important to establish the terminally
insight.141553.                          differentiated state is not known.

                                                                                                                                                                 1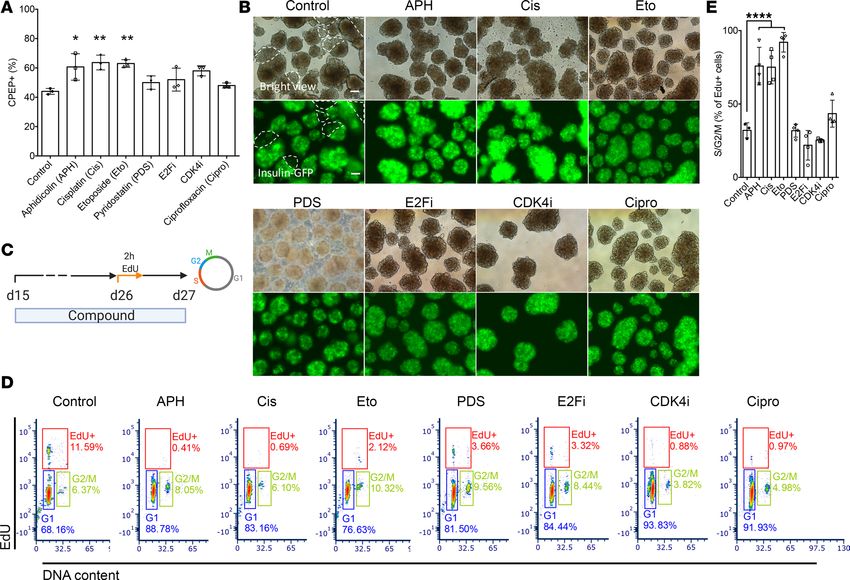
RESEARCH ARTICLE

                                       Several studies show that cell cycle progression can be disruptive to β cell function. When β cells are
                                  immortalized to generate proliferating β cell lines, the differentiated state and function are compromised.
                                  For instance, the stable transformed mouse insulinoma cell line MIN6 and the rat insulinoma cell line
                                  INS1E develop glucose-independent insulin secretion and express other islet hormones with increasing
                                  passage (8–10). Overexpression of the pro-proliferation molecules cyclin-dependent kinases in primary rat
                                  β cells increases proliferation, leads to dedifferentiation of primary β cells, and reduces glucose-stimulated
                                  insulin secretion (11). Furthermore, overexpression of the oncogene c-Myc in adult mouse β cells increas-
                                  es proliferation and β cells acquire an immature phenotype (12). Conversely, removal of immortalizing
                                  transgenes in EndoC-βH1 cell line, a proliferative immortalized β cell line generated from human fetal
                                  pancreas, decreases cell proliferation and enhances β cell–specific features, such as increased insulin gene
                                  expression and content (13). Furthermore, several studies show that cell cycle progression is disruptive to
                                  the differentiated state in general: cell cycle progression plays a critical role in mediating the transition of a
                                  differentiated cell to a pluripotent stem cell (14–20). Oncogenic principles disrupting the limitations in cell
                                  proliferation of a differentiated cell can facilitate reprogramming, including mutations in P53 (21, 22) or
                                  Rb (23), as well as C-myc (24) or SV40 T-Ag overexpression (25). These manipulations directly affect DNA
                                  replication and/or impair the exit from the cell cycle in response to genome instability.
                                       We reasoned that the reverse might also apply: that limitations in cell cycle progression can be established
                                  through interference with the progression of DNA replication and that these manipulations promote differ-
                                  entiation to insulin-producing cells from pluripotent stem cells and help establish cell-intrinsic limitations
                                  in growth potential. To test this, we treated pancreatic progenitors with compounds interfering with DNA
                                  replication and/or cell cycle progression through different mechanisms and determined β cell differentia-
                                  tion efficiency, stability of the differentiated state, and β cell function in vitro and in vivo. Compounds that
                                  interfered with G1 to S phase transition, as well as with S phase completion, were most effective in increasing
                                  differentiation efficiency to insulin-producing cells, resulted in greater stability of the differentiated state, and
                                  increased the robustness of the differentiation protocol with high endocrine cell yield. These compounds
                                  included the DNA polymerase inhibitor aphidicolin, the antineoplastic agent cisplatin, and the topoisomerase
                                  inhibitor etoposide. Inducing G1 arrest alone, such as through CDK4 inhibition without compromising tran-
                                  sition through S phase, was less effective. We found that endocrine induction signaling pathways can be sub-
                                  stituted through inhibition of DNA replication, suggesting that a primary mechanism in the activity of these
                                  pathways is to affect DNA replication and cell cycle progression. Upon transplantation, aphidicolin-treated
                                  insulin-producing cells demonstrated higher human C-peptide secretion, demonstrated greater responsive-
                                  ness to glucose level changes, and protected mice from diabetes without the formation of teratomas or cystic
                                  structures. These results demonstrate that limitations in DNA replication link proliferation potential and β
                                  cell identity, which can be exploited to improve graft outcomes in the context of cell replacement for diabetes.

                                  Results
                                  Aphidicolin reduces DNA replication fork speed in a dose-dependent manner in pancreatic progenitors. Aphidicolin
                                  (APH) is a DNA polymerase inhibitor interfering with DNA replication fork progression with dose-depen-
                                  dent effects on S phase entry and completion (26, 27). At high concentrations, APH inhibits S phase entry,
                                  while at low concentrations, APH inhibits S phase completion and enhances fragility of common fragile
                                  sites while S phase entry is not impaired (28). To understand the effect of S phase entry and completion on
                                  pancreatic differentiation from pluripotent stem cells, we exposed cells to different concentrations of APH
                                  from the pancreatic endocrine progenitor stage (day 15) to the β cell stage (day 27) (Figure 1A). Cells were
                                  exposed to APH from day 15 to day 27 at increasing concentrations from 0.1 μM to 1 μM. We evaluated
                                  replication progression by sequentially labeling the cells with thymidine analogs iodo-deoxyuridine (IdU)
                                  and chloro-deoxyuridine (CIdU) for the first hour of APH on day 15 (Figure 1B). Replication fork speed
                                  decreased from 1.6 kb per minute in untreated cells to 0.5 kb per minute in cells treated with 0.25 μM or 0.5
                                  μM and was further reduced at 1 μM APH (Figure 1C), consistent with earlier studies in other cell types
                                  (27). The decrease in replication fork progression correlated with cell cycle progression examined on day
                                  18 with 2-hour ethinyl-deoxyuridine (EdU) labeling on day 17 (Figure 1, D and E). Most cells arrested in
                                  G1 phase, and less than 1% of cells were in S phase when treated with 0.5 μM and 1 μM APH (Figure 1E).
                                  When cells were pulsed with EdU for 2 hours and released to complete the cell cycle (Figure 1D), control
                                  cells progressed to G1 phase, as indicated by EdU-positive cells in G1 (Figure 1E). In contrast, with increas-
                                  ing concentrations of APH, pancreatic progenitor cells showed a delayed replication progression, indicated

JCI Insight 2021;6(5):e141553 https://doi.org/10.1172/jci.insight.141553                                                                             2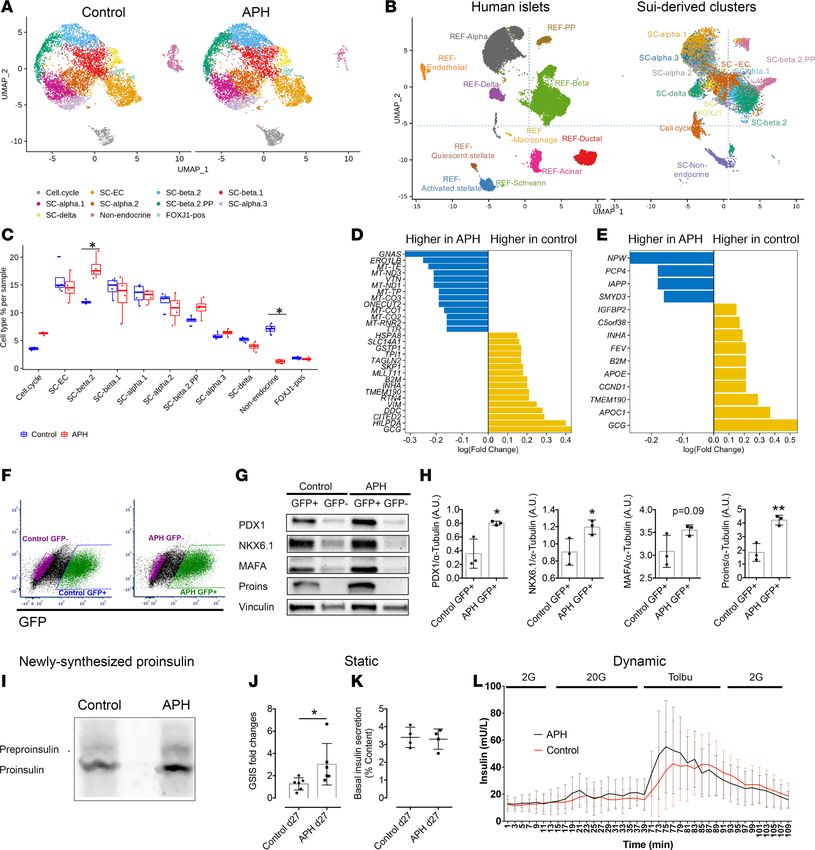
RESEARCH ARTICLE
Figure 1. APH affects DNA replication progression in a dose-dependent manner in pancreatic progenitors. (A) A schematic diagram represents the
differentiation of human pluripotent stem cells toward insulin-producing cells with and without APH treatment. Created with BioRender.com. (B) DNA
replication progression analysis by labeling cells with IdU and CIdU and (C) quantification of labeled fiber length. One-way ANOVA with *P < 0.05; ****P
< 0.0001. All conditions under **** are significantly different from control or 0.1 μM. (D) A schematic diagram indicates the time of APH treatment, EdU
incubation, and cell cycle analysis. Created with BioRender.com. (E) A representative flow plot of 3 independent experiments showed the cell cycle profile
of cells treated with different concentrations of APH on day 18 after 2 hours of EdU labeling on day 17. (F) The percentage of EdU-positive cells in S/G2/M
phase and that failed to progress to G1 phase was determined on day 18 (n = 3). One-way ANOVA test with *P < 0.05; **P < 0.01; ***P < 0.001.
by the high percentage of EdU-positive cells that were in G2/M phase in the presence of a concentration of
0.25 μM (56.1% ± 11.3%), 0.5 μM (90.6% ± 3.5%), and 1 μM APH (94.3% ± 1.4%) compared with control
(31% ± 7.8%) and 0.1 μM APH (41.4% ± 17.3%) (n = 3 for each condition). Lower concentration of 0.1
μM APH allowed S phase entry and the progression through S phase (Figure 1F).
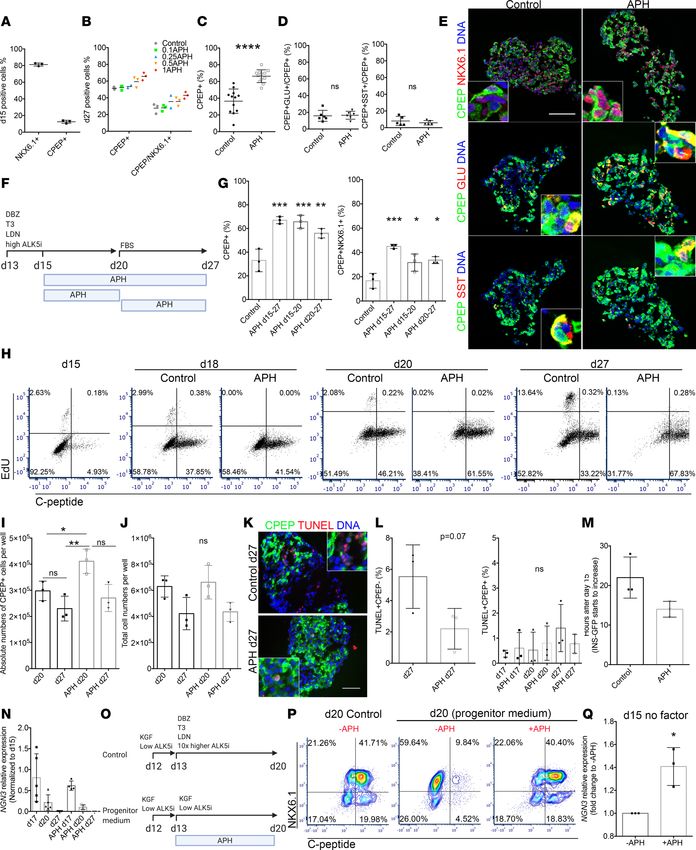
APH promotes pancreatic endocrine cell differentiation from stem cells and reduces the variability of differentiation
in vitro. To determine the effect of APH on endocrine differentiation, we treated endocrine progenitor cells
from day 15 to 27 with indicated concentrations of APH and quantified the differentiation efficiency. On
day 15, before APH treatment, 81.3% ± 1.9% of cells expressed progenitor marker NKX6.1, and only few
cells expressed C-peptide (12.5% ± 1.8%) with low intensity, indicating they were at the stage of pancre-
atic endocrine progenitors (Figure 2A). APH concentration of 0.1 μM had no effect on the percentage of
pancreatic endocrine cells on day 27. APH concentrations starting from 0.25 μM resulted in higher differ-
entiation efficiencies than controls, with 1 μM APH giving rise to the highest percentage of C-peptide– and
NKX6.1-positive cells (Figure 2B and Supplemental Figure 1A; supplemental material available online
with this article; https://doi.org/10.1172/jci.insight.141553DS1). In a total of 12 independent experi-
ments, 66.3% ± 7.6% C-peptide–positive cells were induced in the condition with 1 μM APH, which was
JCI Insight 2021;6(5):e141553 https://doi.org/10.1172/jci.insight.141553 3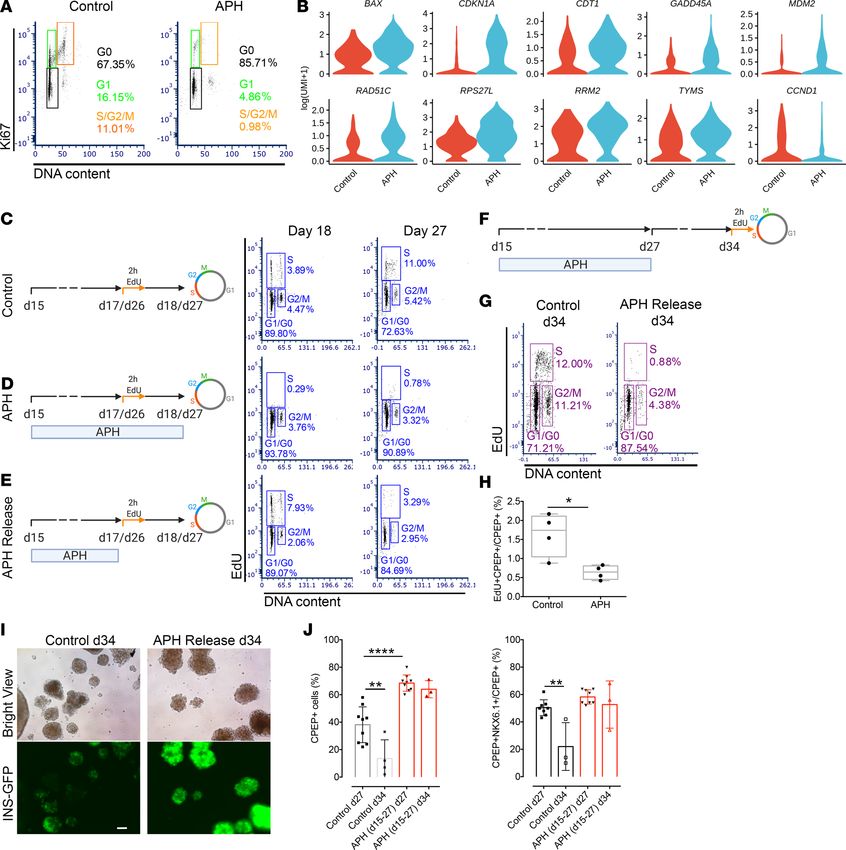
RESEARCH ARTICLE

                                  significantly higher than the percentage of C-peptide–positive cells generated in 12 independent controls
                                  differentiated in parallel (36.5% ± 14.5%) (n = 12) (Figure 2C). Similar percentage of C-peptide–positive
                                  cells coexpressed glucagon (APH: 16.5% ± 4.8%; control: 15.8% ± 6.5%, n = 6) or somatostatin (APH:
                                  5.9% ± 2.6%; control: 8.1% ± 5.5%, n = 5) in the stem cell–derived endocrine clusters between APH and
                                  control, indicating that APH did not alter the proportion of polyhormonal cells (Figure 2, D and E, and
                                  Supplemental Figure 1B). APH treatment reduced the variability of β cell differentiation; without APH,
                                  the percentage of C-peptide–positive cells ranged from 10% to 60% (n = 12). With APH, all cultures con-
                                  tained more than 50% C-peptide–positive cells with the highest over 80% (n = 12) (Figure 2C). To evaluate
                                  if the effect of APH was consistent across different genetic backgrounds, we included 2 induced pluripotent
                                  stem cell (iPSC) lines with different differentiation potentials, 1018E and 1023A. 1018E was previously
                                  identified as a cell line with poor differentiation competence (29). The percentage of C-peptide–positive
                                  cells was significantly higher after APH treatment in both cell lines (Supplemental Figure 1, C and D).
                                  Remarkably, the poor differentiation potential of 1018E increased to the range of a differentiation-compe-
                                  tent cell line, from an average of 11% to 38% (n = 3) (Supplemental Figure 1C). Thus, APH increases the
                                  purity of insulin-producing cells after formation of pancreatic progenitors in human embryonic stem cells
                                  and iPSCs of different genetic backgrounds.
                                       To determine how and at which stage of differentiation APH acts to promote endocrine differentiation,
                                  we applied APH at different stages, including early stage (d15–d20) during endocrine progenitor differenti-
                                  ation, and after commitment of endocrine lineages (d20–d27), and evaluated the percentage of C-peptide–
                                  positive cells as well as C-peptide and NKX6.1 double-positive cells at the end of differentiation on day 27
                                  (Figure 2F). Addition of APH at all indicated stages increased the proportion of C-peptide–positive cells as
                                  well as C-peptide and NKX6.1 dual-positive cells (Figure 2G and Supplemental Figure 1E).
                                       We profiled cell cycle progression on day 15, day 18, day 20, and day 27 of β cell differentia-
                                  tion (Figure 2H). In untreated cells, C-peptide–positive cells started to form on day 15 (approximately
                                  5%) and reached a peak on day 20 with approximately 46% C-peptide–positive cells. APH treatment
                                  improved the percentage of C-peptide–positive cells to approximately 60% (Figure 2H and Supplemen-
                                  tal Figure 2A). Approximately 2% of all cells in control and very few cells, if any, in the APH condition
                                  underwent proliferation during 2-hour EdU incubation at each stage before day 20 (Figure 2H). Cells
                                  treated with APH had an increased number of C-peptide–positive cells on day 20 (Figure 2I), while the
                                  total cell number remained the same between the 2 groups (Figure 2J). When compared to controls with
                                  the highest differentiation efficiency, the total number of C-peptide–positive cells between APH-treated
                                  and control groups was similar on day 27. No significant apoptosis was detected in C-peptide–positive
                                  cells after APH treatment, neither at an early stage on day 17, nor at late stage on day 20 and day 27, as
                                  measured by TUNEL staining (Figure 2, K and L, and Supplemental Figure 2B). Increased apoptosis
                                  was detected in C-peptide–negative cells in the control group (Figure 2K). We also traced the expres-
                                  sion of insulin-GFP using live-cell imaging starting from day 15 when APH was added. APH-treated
                                  progenitor clusters started to express insulin 8 hours earlier than clusters without APH: GFP started
                                  to increase at 14.00 ± 1.16 hours in APH and 22.00 ± 3.00 hours in control condition (Figure 2M
                                  and Supplemental Videos 1–6), and insulin-GFP glowed brighter in APH-treated clusters compared
                                  with control. Thus, the increased percentage of C-peptide–positive cells from day 15 to day 20 is due
                                  to increased differentiation, not due to inhibiting the expansion of other cell types and not due to cell
                                  death of C-peptide–negative cells.
                                       To test if the increased endocrine differentiation efficiency is due to the maintenance of neurogenin
                                  3 (NGN3) expression in APH-treated cells, we checked the transcription levels of NGN3 in control and
                                  in APH-treated cells on days 15, 17, 20, and d27. NGN3 is an essential transcription factor expressed in
                                  endocrine progenitors. We found that the average expression of NGN3 decreased from day 15 to 17 in both
                                  conditions, but control cells showed a greater variability in NGN3 expression levels among each batch of
                                  differentiated cells (n = 5) compared with APH groups (n = 5) (Figure 2N). This variability might contrib-
                                  ute to the variability in the final percentage of C-peptide–positive cells ranging from 10% to 60% in controls
                                  (Figure 2C) and consistently above 50% in APH-treated samples.
                                       To explore the effect of reduced replication fork speed on the differentiation of duodenal homeobox
                                  1 (PDX1) and NKX6.1 double-positive pancreatic progenitor to insulin-producing cells, we cultured cells
                                  with APH starting from the pancreatic progenitor stage on day 13 (2 days before pancreatic endocrine
                                  progenitor stage) to day 20 in pancreatic progenitor medium (Figure 2O). NKX6.1-positive cells failed to

JCI Insight 2021;6(5):e141553 https://doi.org/10.1172/jci.insight.141553                                                                      4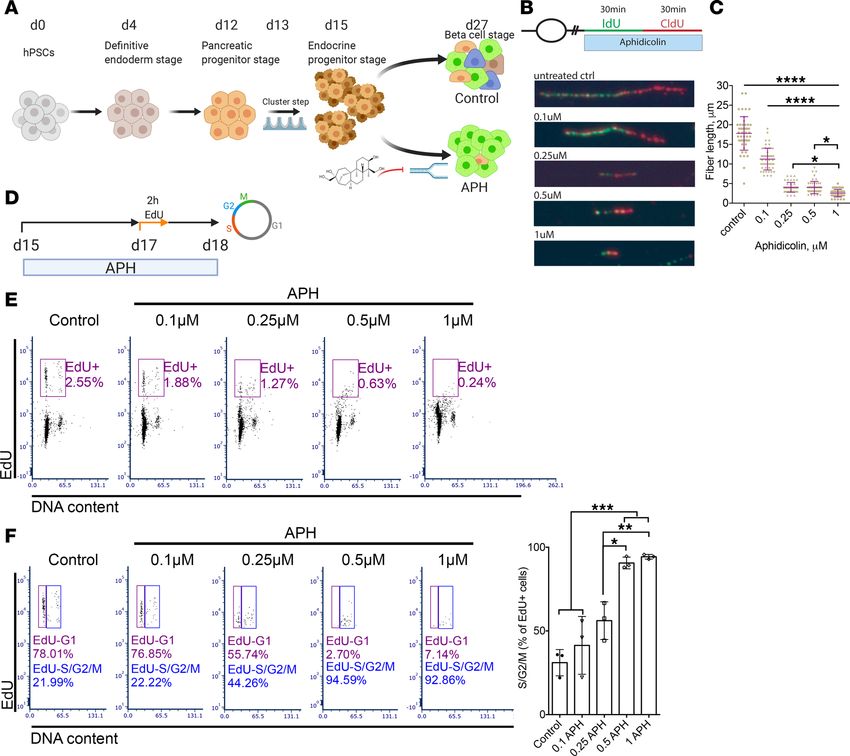
RESEARCH ARTICLE

Figure 2. Inhibiting replication fork progression promotes endocrine differentiation independent of apoptosis. (A) Quantification of NKX6.1 or C-pep-
tide–positive cells on day 15 (n = 3) and on day 27 (B) with different concentrations of APH. (C) Quantification of C-peptide–positive cells in control and
1 μM APH on day 27 (n = 12). Two-tailed paired t test with ****P < 0.0001. (D) Quantification of C-peptide/glucagon-positive cells (n = 6) or C-peptide/
somatostatin-positive cells (n = 5). (E) Immunostaining of APH-treated clusters for C-peptide, NKX6.1, glucagon, and somatostatin on day 27. Scale bar:
100 μm. Insets: 6.25× higher magnification. (F) A schematic diagram indicates APH duration. (G) Flow cytometry quantification of C-peptide–positive and

JCI Insight 2021;6(5):e141553 https://doi.org/10.1172/jci.insight.141553                                                                                      5
RESEARCH ARTICLE

C-peptide/NKX6.1-positive cells in indicated conditions on day 27 (n = 3). One-way ANOVA test, *P < 0.05; **P < 0.01; ***P < 0.001. (H) Flow cytometry
profile of cell cycle progression on days 15, 18, 20, and 27 without and with APH, indicated by the percentage of cells positive for C-peptide and EdU. (I)
Quantification of total C-peptide–positive cells on days 20 and 27. One-way ANOVA test, *P < 0.05; **P < 0.01. (J) Total cell numbers on days 20 and 27.
(K) Immunostaining on day 27 clusters for TUNEL and C-peptide (6.25× higher magnification in inset). Scale bar: 100 μm. Quantification of TUNEL-positive
and C-peptide–negative cells on day 27. (L) Quantification of C-peptide– and TUNEL-positive cells on days 17, 20, and 27 (n = 3). (M) Timing of insulin-GFP
expression. (N) NGN3 expression determined by quantitative real-time PCR (RT-PCR). (O) Schematic diagram of experimental conditions. (P) Flow cytome-
try analysis of day 20 cells for NKX6.1 and C-peptide when day 13 pancreatic progenitors were cultured in progenitor medium with and without APH (day 20
control no APH: 41.5% ± 13.44%; day 20 progenitor medium no APH: 13% ± 1.4%; day 20 progenitor medium plus APH: 52% ± 9.9%, n = 2). (Q) Quantitative
RT-PCR for NGN3 expression of day 15 cells cultured in basal endocrine medium with and without APH (n = 3). Two-tailed unpaired t test, *P < 0.05. DBZ,
γ-secretase inhibitor; T3, thyroid hormone; LDN, LDN193189; KGF, keratinocyte growth factor.

                                   progress to C-peptide–positive cells in progenitor medium (Figure 2P). In stark contrast, when APH was
                                   added, it resulted in the efficient induction of C-peptide–positive cells, comparable to cell culture with
                                   endocrine induction medium containing thyroid hormone T3, TGF-β receptor 1 inhibitor (ALK5i), and
                                   bone morphogenetic protein 4 inhibitor, and Notch signaling (control) (Figure 2P). To specifically test
                                   if APH can replace these endocrine induction factors, we removed them from the differentiation medi-
                                   um, and instead added APH, and tested for the induction of NGN3. NGN3 expression was significantly
                                   increased on day 15 after 2 days of APH addition without any induction factors, compared with cells cul-
                                   tured in the absence of APH (Figure 2Q). These results show that the reduction of DNA replication fork
                                   speed is sufficient to promote pancreatic endocrine differentiation from progenitors and suggest that endo-
                                   crine induction signaling pathways may be upstream of processes acting at the level of DNA replication.
                                        Next, we determined how APH increased the percentage of C-peptide–positive cells after commitment
                                   to the endocrine fate. A high percentage of C-peptide–positive cells was maintained from day 20 to day 27
                                   in the APH condition but declined in controls (Figure 2H). The decline in control cells was primarily driven
                                   by cell proliferation of insulin-negative cells: from day 20 to day 27, approximately 13% of C-peptide–neg-
                                   ative cells showed proliferation in controls and essentially none in APH-treated samples. This suggests that
                                   at late stage of differentiation, APH maintains C-peptide–positive cells mainly through the inhibition of
                                   proliferation of nonendocrine cell types. The total number of cells in control was not significantly different
                                   from that in APH-treated condition (Figure 2J). This may be due to the increased apoptosis of C-peptide–
                                   negative cells observed in controls (Figure 2K). In summary, APH improves differentiation efficiency both
                                   by promoting endocrine differentiation and by preventing expansion of nonendocrine cells when endocrine
                                   differentiation factors are no longer applied.
                                        Inhibition of S phase entry and compromised S phase completion promote endocrine differentiation. To determine
                                   whether the increased differentiation efficiency is specific to polymerase inhibition, or due to its effect on S
                                   phase entry and/or progression, we tested a panel of compounds interfering with either S phase entry or
                                   completion or both. The cyclin-dependent kinase 4 inhibitor (CDK4i) arrests cells in early G1 phase (30).
                                   The MCM replicative helicase inhibitor (ciprofloxacin) and the E2F inhibitor (E2Fi), a transcription factor
                                   required for regulating expression of S phase genes (31), prevent entry into S phase. Cisplatin (Cis) induces
                                   DNA damage by cross-linking DNA, interferes with S phase progression, and arrests cells at G0/G1 phase
                                   (32); etoposide (Eto) is a topoisomerase II inhibitor inhibiting the unwinding of the DNA helix during repli-
                                   cation and transcription and arrests cells mainly in the S and G2 phases (33). Other tested compounds include
                                   pyridostatin (PDS), a compound promoting the formation of G4 structures to induce replication fork stalling
                                   (34), thereby affecting S phase progression. The percentage of C-peptide–positive cells was increased in all
                                   conditions treated with the indicated compounds in comparison with untreated controls (n = 3) (Figure 3A
                                   and Supplemental Figure 3, A and B). A high percentage of insulin-expressing cells indicated by the expres-
                                   sion of GFP and evenly distributed in the islet-like clusters were observed with all compounds tested, whereas
                                   some parts of the clusters in control remained GFP negative (Figure 3B). Notably, cells treated with APH and
                                   Cis expressed higher levels of GFP compared with cells treated with other compounds and control.
                                        We analyzed the cell cycle progression by labeling cells with EdU for 2 hours on day 26 and collected
                                   cells for flow cytometry analysis the next day (Figure 3C). We found that the ability to increase the per-
                                   centage of insulin-positive cells correlated with an increase in the percentage of G1/G0 cells, a reduction of
                                   EdU-positive cells, as well as an increase in the percentage of G2/M cells relative to cells that completed the
                                   cell cycle in the presence of the compound and progressed to G1 (n = 3–4) (Figure 3, D and E, and Supple-
                                   mental Figure 3C). APH, cisplatin, and etoposide resulted in all 3 changes to cell cycle progression (Figure
                                   3, D and E, and Supplemental Figure 3C). Compounds or concentrations that did not fulfill all 3 changes

JCI Insight 2021;6(5):e141553 https://doi.org/10.1172/jci.insight.141553                                                                                  6
RESEARCH ARTICLE
Figure 3. Interference with DNA replication completion promotes differentiation of insulin-producing cells. (A) Flow cytometry quantification of
C-peptide–positive cells on day 27 with indicated compounds (n = 3). One-way ANOVA test *P < 0.05; **P < 0.01. (B) Representative bright view and
fluorescence picture of stem cell–derived islet clusters after treatment with indicated compounds. GFP-negative parts are circled by dashed white line.
Scale bar: 100 μm. Pictures were taken with an OLYMPUS IX73 fluorescence microscope with equal exposure time (148.1 ms). (C and D) EdU pulse and chase
experiment to determine S phase entry and progression. Cells treated with indicated compounds were labeled with EdU for 2 hours on day 26 and analyzed
1 day later for cell cycle distribution. (D) A representative flow plot showed percentage of cells in each cell cycle. (E) Quantification of EdU-positive cells in
S/G2/M phase (n = 3–4). One-way ANOVA test ****P < 0.0001.
were less effective. CDK4i and the replication licensing inhibitor ciprofloxacin arrested cells in G1 with
comparable efficiency to APH but showed only an insignificant increase in endocrine differentiation (Fig-
ure 3, A and D). CDK4i had no effect on the progression of replicating cells through G2 to G1 phase (Figure
3E). E2Fi and PDS reduced the number of cells in S phase but not to the same extent as other compounds
(Figure 3D). Consistent with compromised S phase completion, APH concentrations 0.25–1 μM resulted
in a significant increase in 53BP1 bodies relative to controls (Supplemental Figure 4). 53BP1 bodies mark
incompletely replicated DNA inherited during cell division (35, 36). Such incomplete replication promotes
the decision to enter quiescence (37). Control cells also showed low levels of 53BP1 bodies, which were
not increased by treatment with CDK4i. Cisplatin increased both 53BP1 bodies as well as DNA damage
marked by γH2AX relative to both APH-treated cells as well as controls (Supplemental Figure 4). Thus,
induction of G1 arrest and compromised completion of S phase progression is an intrinsic property of
pancreatic differentiation and can be used to promote differentiation to stem cell–derived insulin-producing
cells, measured by the increased percentage of C-peptide–positive cells.
Transcriptome analysis shows an increase in endocrine cells and a decrease in nonendocrine cells. To further
understand the cell composition of stem cell–derived clusters, we performed single-cell RNA sequencing
of control and APH-treated cells (Gene Expression Omnibus, GEO: GSE139949). We sequenced 16,739
cells (control = 8091 cells, APH = 8648 cells) on day 27 of differentiation using the MEL1 embryonic stem
cell line from both conditions (Supplemental Figure 5A). We first identified 11 cell populations using cells
JCI Insight 2021;6(5):e141553 https://doi.org/10.1172/jci.insight.141553 7RESEARCH ARTICLE
from both control and APH-treated cells, and a large proportion of the cells were endocrine cells (Figure
4A). We then compared these populations corresponding to primary pancreatic human islets (38) (Figure
4B and GEO: GSE114297, GSE139949). Stem cell–derived islet-like clusters contained all endocrine cells
identified in primary human islets, including β, α, δ, and pancreatic polypeptide cells. Three stem cell–
derived populations (SC-β 2, SC-α, and SC-δ) corresponded most closely to primary human islet β, α, and
δ cells (Figure 4B). A total of 69 genes expressed in pancreatic β cells and characteristic of mature cells
were enriched in SC-β 2 cluster (including IAPP, SIX2, HOPX, NEFM), proinsulin processing and insulin
granule exocytosis (PCSK1, CPE, PDIA3, RAB1A, RAB2A, RAB3A, SCG3, VGF), and metabolism sensing
and signaling pathways (NUCB2, PAM, G6PC2, PDX1) (Supplemental Figure 5B).
We also identified a group of insulin-expressing cells (SC-β 1) that failed to overlap with the human
primary β cell cluster (Figure 4B). Gene Ontology analysis illustrated that genes expressed in SC-β 1 were
enriched in the biological process of glycolytic process and molecular function of response to hypoxia,
whereas genes in SC-β 2 were highly enriched in the process of hormone transport and secretion (Sup-
plemental Figure 5C). Higher expression of lactate dehydrogenase LDHA, which inhibits mitochondrial
activity, and lower expression of key β cell genes were also observed in SC-β 1 (Supplemental Figure 5D).
This indicates that SC-β 1 cells are less mature than SC-β 2 cells. Though SC-β 2 cells are closer to human
primary β cells than SC-β 1 cells, some of the key β cell markers, including SLC2A1, MIF, and NEUROD1
were expressed at higher levels in SC-β 1 cells (Supplemental Figure 5D and Supplemental Table 7). We
also noticed the low detectability of maturation markers, including MAFA, NKX6.1, and HNF1A, at the
single-cell level, which did not fully reflect protein levels detected by immunocytochemistry and Western
blot (Figure 2E and Figure 4, G and H). Therefore, neither SC-β 1 nor SC-β 2 are identical to pancreatic β
cells, pointing out technical challenges in comparing populations by any one set of genes. Other endocrine
cells included endocrine cells expressing enterochromaffin cell markers (SC-EC) and a cluster of cells with
several hormones (and more similar to pancreatic polypeptide cells, SC-β 2 PP). Nonendocrine cells par-
tially overlap with acinar cells and duct cells in the human islet. Additional cell types, such as endothelial
cells or macrophages, were only seen in human islets, while stem cell–derived clusters contained additional
nonendocrine cells, including enterochromaffin cells, FoxJ1-positive cells, and cells in the cell cycle (Figure
4B). In a comparison with single-cell RNA sequencing data obtained from a published data set (39), we
found a high correlation for each cell cluster (Supplemental Figure 6A).
We then compared APH-treated and untreated cell populations and quantified their composition. We
found a striking reduction in the number of nonendocrine cells in the APH group compared with control
(Figure 4C). Furthermore, the proportion of insulin-expressing SC-β 2 cells that are most similar to β cells of
primary human islets was significantly increased after APH treatment (Figure 4C). Changes in the number of
cells expressing cell cycle genes (CDKN1A, GADD45A, BAX, MDM2, RAD51C, RPS27L, RRM2, CDT1, and
TYMS) were also observed. (Detailed data are listed in Figure 5B.) Within SC-β 1 population, the upregulated
genes of APH-treated cells included GNAS, an important gene for β cell insulin secretory capacity and func-
tion (40); ERO1LB, a β cell–enriched gene that is involved in insulin processing (41); ONECUT2, a transcrip-
tion factor increased with age in β cells (42); and TTR, which has a positive role in glucose-stimulated insulin
release (43). TPI1, a gene acting in glycolysis, was decreased in APH-treated cells (Figure 4D and Supplemen-
tal Table 8). Within SC-β 2 cells, upregulated genes included IAPP and PCP4, a gene involved in Ca2+ binding
and signaling (44). The expression of FEV, a signature gene expressed in immature β cells (45), was reduced
in APH compared with control (Figure 4E and Supplemental Table 8). We also observed that the cell cycle
genes (CITED2 and CCND1) were downregulated compared with control in both SC-β 1 and SC-β 2 cells.
To further evaluate β cell markers in a targeted manner, we isolated insulin-positive cells based on GFP
expression (Figure 4F) and determined the expression of key β cell genes using Western blot and RT-PCR.
We found that protein levels of PDX1, NKX6.1, v-maf musculoaponeurotic fibrosarcoma oncogene
homolog A (MAFA), and Proinsulin were all upregulated in GFP-positive cells isolated from APH-treated
clusters compared with GFP-positive cells in control clusters (Figure 4, G and H). The higher protein lev-
els correlated with increased transcription levels (Supplemental Figure 7A and Supplemental Table 3). In
addition, APH-treated cells produced higher newly synthesized proinsulin normalized to total protein syn-
thesis (Figure 4I). These data show that APH-induced cell cycle arrest promotes a gene expression program
characteristic of more mature cells.
To examine the effect of APH on the functionality of insulin-producing cells, static and dynamic glu-
cose-stimulated C-peptide secretion were evaluated. In response to elevated glucose, C-peptide secretion
JCI Insight 2021;6(5):e141553 https://doi.org/10.1172/jci.insight.141553 8RESEARCH ARTICLE Figure 4. Single-cell transcriptome analysis shows an increase of endocrine cells and decrease of nonendocrine cells in the APH condition. (A) Identified cell populations in stem cell–derived islet cells with and without APH during differentiation (samples were collected from 4 independent wells of 1 experiment in each condition). (B) Identified cell populations in stem cell–derived islet cells compared with primary human islet cells. (C) Quantification of indicated cell populations between control and APH groups. *Wilcoxon’s test with P < 0.05. (D) The upregulated and downregu- lated genes after cells were treated with APH compared with control in SC-β 1 cells and (E) SC-β 2 cells. (F) Insulin-GFP–positive and –negative cells were sorted from control and APH groups for downstream analysis. (G) Protein expressions of sorted cells by a representative Western blot analysis for PDX1, NKX6.1, MAFA, Proins, and Vinculin (Supplemental Figure 9, A and B). (H) Quantification of Western blot band intensity and normalized to α-tubulin (n = 3). Two-tailed paired t test *P < 0.05; **P < 0.01. (I) Proinsulin biosynthesis of an iPSC line–derived β cell clusters with and with- out APH treatment (Supplemental Figure 9C). (J) Static glucose stimulated insulin secretion (GSIS) (a stimulation index is determined by the fold changes of insulin secretions of nonsorted cells incubated in 2 mM and 20 mM glucose). Mann-Whitney U test *P < 0.05. (K) Basal insulin secretion levels of nonsorted cells normalized to insulin content. (L) Dynamic analysis of insulin secretion of nonsorted cells stimulated sequentially by 2 mM glucose, 20 mM glucose, 150 μM tolbutamide. JCI Insight 2021;6(5):e141553 https://doi.org/10.1172/jci.insight.141553 9
RESEARCH ARTICLE

Figure 5. Transient APH treatment reduces growth potential and increases stability of insulin expression by upregulating cell cycle inhibitors. (A) Cell cycle
profile of untreated and treated cells on day 27 indicated by flow cytometry combined with Hoechst staining for DNA content and KI67 labeling. (B) The dif-
ferential expression of cell cycle genes between control and APH-treated cells using single-cell RNA sequencing. Violin plots show probability density of gene
expression of given single cells. (C–E) Schematic diagrams of cell cycle progression experiments with indicated conditions. (E) APH-treated cells were released
and labeled with EdU for 2 hours on either day 17 (n = 3 in each condition) or 26 (n = 4 in each condition), and analyzed 1 day later (day 18 or 27) for cell cycle
distribution. Cells without APH treatment (C) and unreleased from APH (D) were analyzed in parallel. (F) A schematic diagram represents the timeline of APH
addition, release from cell culture, and cell cycle progression analysis after 2-hour EdU incubation on day 34. Created with BioRender.com (G) Cell cycle distri-
bution (n = 4) and (H) percentage of EdU- and C-peptide–positive cells on day 34 with (n = 4) and without APH (n = 4) from days 15 to 27. Two-tailed unpaired
t test *P < 0.05. (I) Microscopic pictures of cells on day 34 after releasing cells from APH from day 27 to 34. Scale bar: 100 μm. (J) Quantification of C-peptide–
and NKX6.1-positive cells and C-peptide–positive cells on days 27 and 34 before and after APH releasing. One-way ANOVA test **P < 0.01; ****P < 0.0001.

                                     was increased 2- to 6-fold, with an average of 3-fold in a static assay, significantly more than in untreated
                                     controls (Figure 4J). The levels of basal insulin secreted by APH-treated cells were comparable with those
                                     in control (Figure 4K). Dynamic perifusion demonstrated that APH-treated insulin-producing cells showed
                                     a response to high glucose and to tolbutamide comparable to controls (n = 3) (Figure 4L).

JCI Insight 2021;6(5):e141553 https://doi.org/10.1172/jci.insight.141553                                                                                         10
RESEARCH ARTICLE
Therefore, cell cycle arrest triggered by APH reduces the proportion of nonendocrine cells and has no
adverse effects on the functional properties of differentiated cells.
Transient treatment with APH limits proliferation potential and stabilizes insulin expression by upregulating cell
cycle inhibitors in vitro. To determine whether APH has lasting effects on cell cycle progression, we examined
the expression of cell cycle markers at the end of treatment on day 27. As shown in Figure 5A, 86.4% ±
0.9% (n = 3) of cells treated with APH versus 74.3% ± 6.5% (n = 3) of cells in control conditions were
found to exit the cell cycle to G0. A total of 14.4% ± 11.2% (n = 3) of control cells were in the cell cycle, as
indicated by the expression of KI67 and DNA content. About 2.9% ± 1.8% (n = 3) of APH-treated cells
expressed KI67 in G1, and very few of the cells were in S phase (Figure 5A). We also examined the cell
cycle gene expression in insulin-expressing cells by isolating GFP-positive cells from cell clusters. We found
that the expression of CDK inhibitor 1A (CDKN1A, a cell cycle progression inhibitor) was upregulated, and
the expression of cyclin D1 (CCND1) and CDK4 (both involved in G1 phase progression) was downregu-
lated in APH-treated insulin-positive cells (Figure 5B and Supplemental Figure 7B). These results demon-
strate that APH promotes G1/G0 arrest and induces S and G2/M arrest in pancreatic endocrine progenitors.
A subset of cells appeared competent of DNA replication after APH treatment. In KI67-positive cells,
single-cell RNA sequencing showed upregulation of genes involved in the P53 signaling pathway (CDK-
N1A, GADD45A, BAX, MDM2, RPS27L, RRM2) in APH-treated cells. These genes mediate G1 cell cycle
arrest or respond to difficulties in DNA replication progression. CDKN1A and GADD45A are able to arrest
cells either in G1/S or G2/M (46). Chromatin licensing and DNA replication factor 1 (CDT1), a replica-
tion licensing gene (stable in G1 and degraded in S phase), was also upregulated, indicating that cells were
arrested in late G1 (Figure 5B). CDT1 upregulation appears to be a compensatory response to enable S
phase progression and attempt to rescue S phase in the presence of APH.
To explore the consequences of transient APH treatment on proliferation potential, we exposed pan-
creatic progenitors to APH and released them at different time points (Figure 5, C–E). On day 17, 2 days
after APH treatment, APH was removed from culture, and cells were incubated with EdU for 2 hours and
collected the next day (day 18). As shown in Figure 5D, 93.3% ± 1.1% (n = 3) of cells were arrested in G1/
G0, and very few cells, 0.4% ± 0.4% (n = 3), went through S phase when APH was present. Upon removal
of APH, 6.0% ± 1.8% (n = 3) of cells resumed proliferation, as indicated by EdU staining, more than in
control (3.2% ± 0.8%) (n = 3) (Figure 5E). When cells were treated for 12 days and released from APH on
day 26, 3.4% ± 1.1% (n = 4) of cells were EdU positive on day 1 after releasing (day 27), while in controls
7.9% ± 3.7% (n = 4) were proliferating (Figure 5, C and E). Therefore, while short-term exposure induced
enrichment at the G1/S phase transition and S phase could resume, long-term exposure increased G0 arrest,
while approximately 3% were in G1 (Figure 5A) and capable of reentering S phase (Figure 5E).
To test the stability of G0/G1 arrest, we continued culturing cells after release from APH for 7 days
till day 34 and labeled with EdU on day 34 for 2 hours (Figure 5F). The percentage of EdU-positive cells
was substantially reduced to 2.1% ± 1.2% (n = 4), whereas control cells continued proliferating at a rate
of 12.0% ± 3.4% (n = 4) (Figure 5G). The percentage of proliferating C-peptide–positive cells was also
reduced from 1.6% ± 0.6% (n = 4) in controls to 0.6% ± 0.2% (n = 4) in APH-treated cells (Figure 5H).
Thus, growth potential was greatly reduced across all cell types, when replication fork speed was slowed
by APH during 12 days of differentiation, and the vast majority of cells had entered a stable G0 state.
To explore if the lasting effect of APH on cell cycle progression contributes to maintain β cell identity,
insulin-producing cells were cultured for an additional 7 days till day 34 upon removal of inhibitors on day
27. In untreated control cells and CDK4i-treated cells, the insulin-GFP expression was lost while it remained
high in APH-, Cis-, and Eto-treated cells on day 34 (7 days after release) (Figure 5I and Supplemental Figure
7C). In addition, the percentage of C-peptide and NKX6.1 double-positive cells and the total of C-pep-
tide–positive cells were still high on day 34 in cells treated with APH, Cis, and Eto, respectively, whereas
the percentage of C-peptide–positive cells was significantly reduced in the control and the CDK4i groups
(Figure 5J and Supplemental Figure 7D). Cells treated with low dose of APH (0.1 μM) were comparable to
untreated controls in cell composition (Supplemental Figure 7E). These data show that transient treatment
with APH (≥0.25 μM) (and other inhibitors of DNA replication) results in more stable β cell identity and
that the stability of insulin-expressing endocrine cells subsequently becomes independent of the compounds.
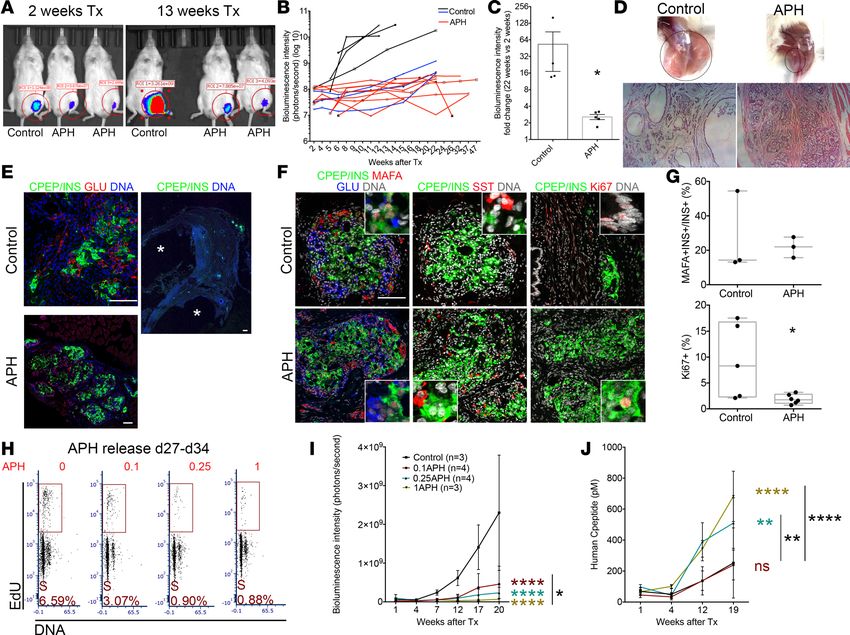
APH-treated cells show reduced growth potential in vivo in a dose-dependent manner. To determine long-term
effects of cell cycle arrest and reduced replication fork speed on growth potential, we removed APH on
day 27 and monitored the graft growth after transplantation in vivo. Control and APH-treated cells were
JCI Insight 2021;6(5):e141553 https://doi.org/10.1172/jci.insight.141553 11RESEARCH ARTICLE
prepared from 3 independent differentiation experiments using a MEL1 cell line. Within each experiment,
the same number of cells were transplanted in APH and control groups. MEL1 cell line was targeted with
a luciferase reporter under the control of the GAPDH promoter, which allows us to monitor cell growth
in vivo (Supplemental Table 1). APH was removed permanently on day 27 before transplantation. Graft
growth was evaluated by monitoring a luciferase reporter using in vivo imaging. After 2 weeks of trans-
plantation, the graft size of APH mice was small, while controls grafted with the same number of cells
were modestly larger (Figure 6A). Eleven weeks later, 4/7 control mice displayed large growths, whereas
none of the mice transplanted with APH-treated cells did (9/9) (Figure 6A). The different growth trend of
grafted cells between control and APH-treated cells was evident in the bioluminescence intensity (Figure
6B). At 22 weeks of engraftment, the size of graft in the APH group was on average 2.6-fold larger than that
at 2 weeks, while the size of the control group increased on average by 53-fold (Figure 6C). Graft growth
occurred in controls even from cultures with very high differentiation efficiency (>60%). Even in mice with
the smallest growths of control cells, cystic structures still formed in 3/3 mice (Figure 6B, indicated by blue
lines). No cysts were observed in mice grafted with 1 μM APH-treated cells in 9/9 mice (Figure 6D). Grafts
were isolated from mice for examination. Both control graft and APH graft were composed of islet-like
structures and showed monohormonal cells positive for insulin, for glucagon, or for somatostatin (Figure
6, E and F). Approximately 25% of insulin-expressing cells stained positive for MAFA, and no difference
in the proportion of insulin- and MAFA-positive cells was observed between control and APH (Figure
6, F and G). In mice grafted with untreated control cells, the graft contained groups of C-peptide–posi-
tive cells but developed several large cystic structures after 9 months of transplantation (Figure 6E) with
approximately 10% of cells positive for KI67 (Figure 6, F and G). Grafts derived from APH-treated cells
had approximately 2% KI67-positive cells (Figure 6, F and G), demonstrating that APH had altered growth
potential and did not damage cells without any proliferative capacity. We also transplanted iPSC-derived
clusters into NOD.Cg-Prkdcscid Il2rgtm1Wjl/SzJ (NSG) mice to determine if growth control by APH also
applied to iPSCs. No cysts were observed in mice grafted with APH-treated iPSC-derived clusters (0/3),
whereas cysts were formed in mice transplanted with nontreated cells (2/2) (Supplemental Figure 8A).
APH reduces replication fork speed in a dose-dependent manner (Figure 1, B and C). To determine
if growth potential correlates with the degree of reduction in replication fork speed, we released cells on
day 27 from different concentrations of APH and analyzed them using EdU staining 1 week later. With-
out APH pretreatment, cells kept proliferating on day 34. In contrast, cells pretreated with APH showed
a reduced proliferation rate proportional to replication fork progression (Figure 6H and Figure 1B). We
then transplanted cells pretreated with 0.1 μM, 0.25 μM, and 1 μM of APH into mice and monitored graft
growth with bioluminescence intensity for 17 weeks. A comparable number of cells and clusters were
engrafted. Accordingly, comparable bioluminescence intensity of grafted cells was observed among all 4
groups at 1 week of transplantation. A difference in graft size was apparent at 7 weeks of transplantation
and became statistically significant at 12 weeks and 17 weeks posttransplantation (Figure 6I). APH treat-
ment resulted in a dose-dependent reduction in growth potential: grafts were smallest for the highest con-
centration of APH and intermediate to controls for the lowest concentration (Figure 6I).
While the difference in graft size to controls was obvious at all tested APH concentrations, the levels
of human C-peptide secretion in mice transplanted with control cells and mice transplanted with low con-
centration (0.1 μM) of APH-treated cells remained similar, consistent with cell composition (Figure 6J).
Mice transplanted with 0.25 μM and 1 μM APH-treated cells secreted higher levels of human C-peptide
starting from 4 weeks after transplantation compared with control and low APH (Figure 6J). In contrast
to the higher concentrations of APH, low concentrations selectively reduced growth potential but had no
effect on cell composition. Thus, replication fork speed altered by APH affects control growth potential in
a dose-dependent manner and prevents teratomas and cystic growth after transplantation.
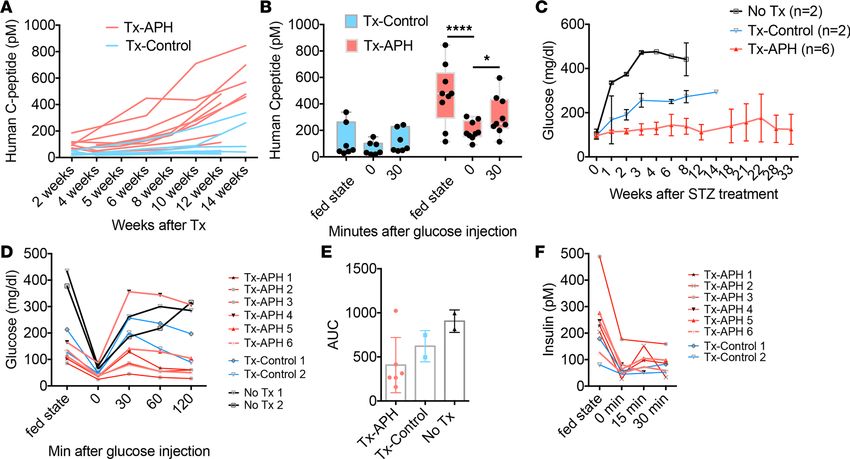
APH-treated cells secrete C-peptide and efficiently protect mice from diabetes. To test in vivo function of
APH-treated islet-like clusters, we monitored C-peptide and blood glucose levels. After transplantation
in immunodeficient mice, mice transplanted with APH-treated cells trended to higher human C-peptide
starting from 2 weeks after engraftment, compared with controls (Figure 7A). The increase was statis-
tically significant at 6 weeks after transplantation (Figure 7A and Supplemental Figure 8, B and C).
Secretion of human C-peptide in mice was downregulated when mice were fasted and increased after
glucose injection (Figure 7B), indicating the engrafted insulin-producing cells were able to respond to
changes in blood glucose levels.
JCI Insight 2021;6(5):e141553 https://doi.org/10.1172/jci.insight.141553 12RESEARCH ARTICLE
Figure 6. Reducing replication fork speed and S phase entry establishes cell-intrinsic limitations in cell proliferation. (A) In vivo imaging of mice trans-
planted with control and APH cells. Tx, transplantation. (B) Growth of grafted cells in mice after transplantation quantified by the bioluminescence intensity.
Differentiation efficiency and graft growth in controls are variable but consistent in APH treatment. Black and blue lines show mice transplanted with control
clusters (black, approximately 20% differentiation efficiency, n = 4; blue, >60%, n = 3). (C) Fold change of graft growth in control and APH mice. *Mann-Whit-
ney U test with P < 0.05. (D) Grafts in the legs of mice transplanted with equal number of cells in control and APH group at 20 weeks (black circles, graft loca-
tion). (E and F) Cell composition determined by immunostaining in mice transplanted with control and APH cells. *cysts. (Pictures with white line: close-ups.)
Scale bar: 100 μm. (G) Quantification of MAFA- and INS-positive cells (control: 2 grafts from 2 mice from 1 batch of differentiation, INS+ cells counted from
3 sections; APH: 2 grafts from 2 mice from 2 batches of differentiation, INS+ cells counted from 3 sections) and KI67-positive cells (control: 2 grafts from 2
mice from 1 batch of differentiation, cells counted from 5 sections; APH: 3 grafts from 3 mice from 2 batches of differentiation, cells counted from 6 sections)
(Supplemental Table 6). Two-tailed paired t test *P < 0.05. (H) Representative day 34 cell cycle distribution with day 15–day 27 APH pretreatment (n = 2). (I)
Cell growth in mice after transplantation of cells pretreated with APH measured by bioluminescence intensity. Two-way ANOVA *P < 0.05 (0.1APH vs. 1APH);
****P < 0.0001 (0.1, 0.25, 1APH vs. control). (J) Human C-peptide secretion in mice transplanted with APH-treated cells. Two-way ANOVA **P < 0.05 (0.1APH
vs. 0.25APH in black; 0.25APH vs. control in color ); ****P < 0.0001 (0.1APH vs. 1APH in black; 1APH vs. control in color).
The ability of APH-treated cells to protect mice from diabetes was determined after eliminating
endogenous mouse β cells with streptozotocin (STZ). STZ ablates mouse β cells but is not toxic to
human β cells at the concentrations used (29). After 15 weeks of transplantation, mice were treated with
STZ, blood glucose levels were monitored, and grafted insulin-producing cells were challenged with
high glucose to check their function. Successful ablation of mouse β cells with STZ was demonstrated
by mouse C-peptide ELISA (Supplemental Figure 8D) and was previously also shown to result in the
loss of C-peptide staining in the mouse pancreas (29). Blood glucose levels remained in the normal
range in 5 out of 6 mice transplanted with APH-pretreated cells (Figure 7C). Five out of 6 mice were
tolerant to glucose and normalized blood glucose levels within 60 minutes of glucose injection (Figure
7, D and E). Secretion of human C-peptide and insulin decreased after fasting and increased after
glucose injection (Figure 7F and Supplemental Figure 8E). Therefore, APH-treated cells control graft
growth while protecting mice from diabetes more efficiently than nontreated cells.
JCI Insight 2021;6(5):e141553 https://doi.org/10.1172/jci.insight.141553 13RESEARCH ARTICLE
Discussion
Modulation of signaling pathways has been used successfully to differentiate pluripotent stem cells to insu-
lin-producing cells (47–50). In this study, we tested the duplication of the genome as a developmentally
relevant target to induce the differentiation of stem cell–derived endocrine cells and to establish limitations
in cell proliferation. Unlike the modulation of signaling pathways that can have complex effects on both
gene expression and cell cycle progression, the use of APH is highly specific in targeting the duplication
of the genome by inhibiting DNA polymerase in a dose-dependent manner. APH affects the progression
from G1 to S phase, while also affecting DNA replication completion, in particular at common fragile sites
(28). Common fragile sites replicate late in S phase, and are prone to incomplete replication, a property
that is enhanced through addition of APH. A number of compounds tested here arrested pancreatic pro-
genitors in G1, but only DNA replication inhibitors APH, cisplatin, and etoposide substantially increased
the production of insulin-producing cells. The key difference of DNA replication inhibitors from other cell
cycle inhibitors is the compromised cell cycle progression from S to G1 phase. In the presence of DNA rep-
lication inhibitors, the progression through G2/M phase was impaired and arrested during the progression
to G1. A recent study demonstrated that the inhibition of YAP in the Hippo signaling pathway increases
the differentiation of pancreatic endocrine cells from pancreatic progenitors. In contrast, inhibition of cell
cycle progression with roscovitine, a CDK inhibitor, did not achieve the same effect as YAP (51). Our
studies point out that G1 arrest by CDK inhibition alone is not sufficient to promote β cell differentiation
but is effective when combined with compromised S phase progression. Whether YAP mediates its effect
on β cell differentiation by affecting origin activity or replication fork progression is not currently known.
Inhibition of DNA replication reduced variation in differentiation efficiency in different experiments
with the same cell line, as well as with different cell lines. Stem cell lines that were previously demonstrat-
ed as differentiation incompetent (29) also showed improved differentiation efficiency. Single-cell RNA
sequencing data revealed that the number of mature β cells (SC-β 2) that are transcriptionally more similar
to human primary β cells was increased. APH-treated cells showed upregulated expression of genes in
metabolic signaling and insulin processing and release and downregulated expression of genes in cell cycle
progression and glycolysis. Furthermore, APH treatment decreased the number of nonendocrine cells, both
in comparison with our controls, as well as compared with another study (39) (Supplemental Figure 6A).
Though the resulting cells are closer, they are not identical to pancreatic β cells in gene expression pro-
gram and function. Additional adaptations to increase glucose responses may result in further functional
improvements (50). Taken together, APH treatment increases the robustness of the differentiation protocol.
The study of DNA replication adds a new perspective to the existing literature on cell cycle progression
in the pancreatic lineage. Pancreatic endocrine differentiation is associated with cell cycle exit. A recent
study demonstrated that overexpression of islet cell enriched miRNA repressed the expression of cell cycle
regulators at the transcription level (52). Our studies demonstrate a role of reduced S phase competence in
the commitment of pancreatic progenitors to the endocrine lineage during differentiation from pluripotent
stem cells. Reduced S phase competence is established naturally in pancreatic differentiation, though with
slower developmental kinetics than induced by APH or antineoplastic agents: human β cells are not only
arrested in G1; they are also compromised in their ability to complete S phase as shown by forced S phase
entry of β cells, which can induce apoptosis (7). In the brain, replication incompetence is even greater: neu-
ronal cells that are forced to reenter a cell cycle through inhibition of Rb will die and degenerate rather than
divide and grow (6, 53). Therefore, mechanisms that impair S phase entry and S phase completion may be
an important and fundamental principle of terminal differentiation in several organs, in particular in the
brain, in muscle cells, and in the pancreas. S phase completion and S phase reentry are functionally linked,
as the decision to enter quiescence in G1 is determined by the previous S phase (37, 54).
Other studies have focused on developmental signals and the activity of transcription factors, such as
NGN3, in understanding growth and terminal differentiation of the pancreas (55). However, how NGN3 and
other transcription factors affect cell cycle progression and DNA replication remains to be further investigated.
In our study, we show that reducing DNA replication progression is sufficient to promote pancreatic endocrine
differentiation from progenitors and increase NGN3 expression. Transcription factors may modulate S phase
entry and progression not only through the expression of gene products, but also by altering origin activity.
Our findings are relevant to defining growth potential of cell replacement products for the treatment
of diabetes or other conditions. In this and previous studies, a proliferative nonendocrine population
in untreated controls can contribute to growths after transplantation (29, 56). Several strategies have
JCI Insight 2021;6(5):e141553 https://doi.org/10.1172/jci.insight.141553 14You can also read