BIG DATA FOR LABOUR MARKET INFORMATION (LMI) IN UKRAINE
←
→
Page content transcription
If your browser does not render page correctly, please read the page content below
BIG DATA FOR LABOUR
MARKET INFORMATION
(LMI) IN UKRAINE
Methodological overview and analytics insights on
Ukrainian Web Labour Market

Working Paper
                          Author: Alessandro Vaccarino

        Reviewers: Mario Mezzanzanica, Fabio Mercorio, Eduarda Castel-Branco

                                  December 2020

                                                                               1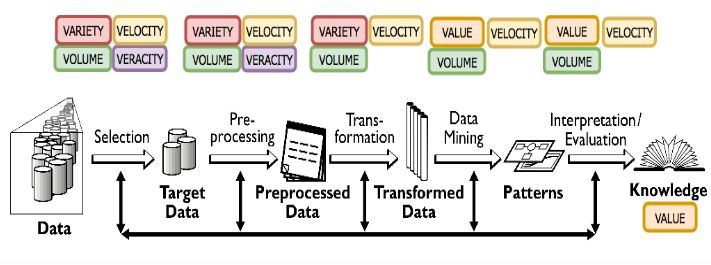
The contents of this draft report are the sole responsibility of the authors and do not necessarily reflect the views of the ETF
or the EU institutions.

© European Training Foundation, 2020
Reproduction is authorised, provided the source is acknowledged.

                                                                                                                              2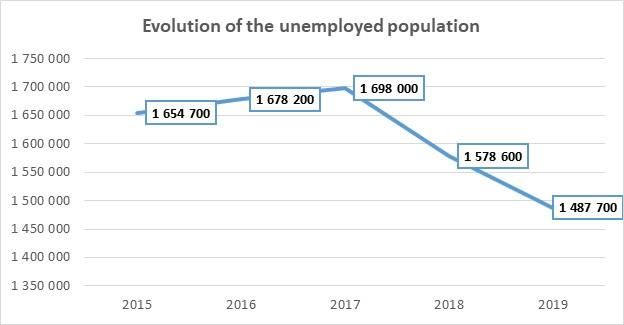
3

CONTENTS
CONTENTS                                            3

CONTENTS – FIGURES AND TABLES                       4

1   INTRODUCTION – OBJECTIVE OF THE PROJECT         7

2   BIG DATA FOR LABOUR MARKET INTELLIGENCE (LMI)   8

3   THE KDD PROCESS                                 9

4   DEFINITION OF ONLINE JOB VACANCY                12

5   ONLINE JOB VACANCIES: UKRAINE                   12
    What do the data tell?                          12

6   DATA FROM OFFICIAL STATISTICS                   14
    Population characteristics                      14
    Unemployed and unemployment rates               15
    Employed and employment rate                    22
    Conclusions                                     37

7   USE OF THE INTERNET                             39
    General use of the web in Ukraine               39
    Employment-related use of the web in Ukraine    40

8   ONLINE JOB VACANCIES (OJVS)                     44
    Occupation                                      45
    Educational level                               47
    Experience                                      47
    Type of contract                                48
    Industry                                        48
    Skills                                          51
    Conclusions                                     54

                                                     3
4

9           WEB AND STATISTICAL DATA COMPARISON                                                                                                          56
9.1 Comparison of skill level, sector of activity and educational level                                                                                  56
            Educational level                                                                                                                            60
            Conclusions                                                                                                                                  61

10          REPORT CONCLUSIONS                                                                                                                           61

11   COMPARISON BETWEEN UKRAINE AND TUNISIA BASED ON OJV DATA
ANALYSIS                                                     63

ANNEX – OJV WEBSITE CHARACTERISTICS                                                                                                                      65

TABLE OF ABBREVIATIONS                                                                                                                                   76

REFERENCES                                                                                                                                               77

CONTENTS – FIGURES AND TABLES
FIGURE 3.1. THE KDD PROCESS ............................................................................................................ 9
FIGURE 6.1. EVOLUTION OF THE UNEMPLOYED POPULATION AGED 15 YEARS AND OVER, 2015–
    2019................................................................................................................................................. 15
FIGURE 6.2. UNEMPLOYED POPULATION BY LEVEL OF EDUCATION, 15 YEARS AND OVER, 2019 16
FIGURE 6.3. UNEMPLOYED POPULATION BY REASON FOR UNEMPLOYMENT, 15 YEARS AND
    OVER, 2019 (%)............................................................................................................................... 17
FIGURE 6.4. UNEMPLOYMENT RATE EVOLUTION BY GENDER, 15–70 YEARS, 2015–2019 (%) ....... 18
FIGURE 6.5. UNEMPLOYMENT RATE EVOLUTION BY PLACE OF RESIDENCE, 15–70 YEARS, 2015–
    2019 (%) .......................................................................................................................................... 18
FIGURE 6.6. UNEMPLOYMENT RATE BY AGE GROUP, 15–70 YEARS, 2019 (%) ................................ 19
FIGURE 6.7. UNEMPLOYMENT RATE BY EDUCATIONAL LEVEL AND GENDER, 15–70 YEARS, 2019
    (%) ................................................................................................................................................... 19
FIGURE 6.8. UNEMPLOYMENT RATE BY EDUCATIONAL LEVEL AND PLACE OF RESIDENCE, 15–70
    YEARS, 2019 (%)............................................................................................................................. 20
FIGURE 6.9. EVOLUTION OF THE EMPLOYED POPULATION, 15–70 YEARS, 2015–2019 .................. 22
FIGURE 6.10. EMPLOYED POPULATION BY AGE GROUP, 15–70 YEARS, 2019 ................................. 23
FIGURE 6.11. EMPLOYED POPULATION BY EDUCATIONAL LEVEL, 15–70 YEARS, 2019 .................. 24
FIGURE 6.12. EMPLOYED POPULATION BY EDUCATIONAL LEVEL AND GENDER, 15–70 YEARS,
    2019................................................................................................................................................. 24
FIGURE 6.13. EMPLOYED POPULATION BY EDUCATIONAL LEVEL AND PLACE OF RESIDENCE, 15–
    70 YEARS, 2019 .............................................................................................................................. 25
FIGURE 6.14. EMPLOYED POPULATION BY OCCUPATIONAL GROUP, 15–70 YEARS, 2019 ............. 26

                                                                                                                                                            4
5

FIGURE 6.15. EMPLOYED POPULATION BY OCCUPATIONAL GROUP AND GENDER, 15–70 YEARS,
    2019................................................................................................................................................. 26
FIGURE 6.16. EMPLOYED POPULATION BY OCCUPATIONAL GROUP AND PLACE OF RESIDENCE,
    15–70 YEARS, 2019 ........................................................................................................................ 27
FIGURE 6.17. CLASSIFICATION OF SKILL LEVEL BY OCCUPATIONAL GROUP ................................. 28
FIGURE 6.18. EMPLOYED POPULATION BY SKILL LEVEL AND GENDER, 15–70 YEARS, 2019 ......... 29
FIGURE 6.19. EMPLOYED POPULATION BY SKILL LEVEL AND PLACE OF RESIDENCE, 15–70
    YEARS, 2019 ................................................................................................................................... 29
FIGURE 6.20. EMPLOYED POPULATION BY SECTOR OF ACTIVITY, 15–70 YEARS, 2017–2019 (%).. 30
FIGURE 6.21. EVOLUTION OF EMPLOYMENT RATE BY GENDER, 15–70 YEARS, 2015–2019 (%) ..... 32
FIGURE 6.22. EVOLUTION OF EMPLOYMENT RATE BY PLACE OF RESIDENCE, 15–70 YEARS, 2015–
    2019 (%) .......................................................................................................................................... 33
FIGURE 6.23. EMPLOYMENT RATE BY AGE GROUP, 15–70 YEARS, 2019 (%) ................................... 33
FIGURE 6.24. EMPLOYMENT RATE BY EDUCATIONAL LEVEL AND GENDER, 15–70 YEARS, 2019 (%)
    ........................................................................................................................................................ 34
FIGURE 6.25. EMPLOYMENT RATE BY EDUCATIONAL LEVEL AND PLACE OF RESIDENCE, 15–70
    YEARS, 2019 (%)............................................................................................................................. 35
FIGURE 7.1. INDIVIDUALS USING THE INTERNET, 1993–2018 (% OF UKRAINIAN POPULATION) ..... 39
FIGURE 7.2. AVERAGE NUMBER OF GOOGLE SEARCHES FOR A GIVEN KEYWORD PER MONTH . 40
FIGURE 7.3. NUMBER OF JOB-HUNTING QUERIES IN UKRAINIAN AND RUSSIAN ANALYSED USING
    GOOGLE TRENDS, APRIL 2016 TO APRIL 2020 ............................................................................ 40
FIGURE 7.4. JOB-HUNTING QUERIES IN UKRAINIAN AND RUSSIAN, BY UKRAINIAN REGIONS,
    ANALYSED USING GOOGLE TRENDS, APRIL 2016 TO APRIL 2020 (%) ....................................... 41
FIGURE 7.5. SEARCH QUERIES FOR WORK OUTSIDE UKRAINE, 1 JANUARY 2013 – 31 DECEMBER
    2018................................................................................................................................................. 42
FIGURE 8.1. PUBLICATION OF OJVS BY MONTH, APRIL–SEPTEMBER 2020 ..................................... 44
FIGURE 8.2. OJVS BY OCCUPATION (LEVEL 1) ................................................................................... 45
FIGURE 8.3. OJVS BY SKILL LEVEL ...................................................................................................... 45
FIGURE 8.4. OJVS BY OCCUPATION (LEVEL 4) ................................................................................... 45
FIGURE 8.5. OJVS BY OCCUPATION (LEVEL 1), MAY 2020 ................................................................. 46
FIGURE 8.6. OJVS BY OCCUPATION (LEVEL 4), MAY 2020 ................................................................. 46
FIGURE 8.7. OJVS BY EDUCATIONAL LEVEL ....................................................................................... 47
FIGURE 8.8. OJVS BY EXPERIENCE ..................................................................................................... 47
FIGURE 8.9. OJVS BY TYPE OF CONTRACT ........................................................................................ 48
FIGURE 8.10. OJVS BY INDUSTRY ........................................................................................................ 48
FIGURE 8.11. OJVS BY INDUSTRY ........................................................................................................ 49
FIGURE 8.12. OJVS FOR THE WHOLESALE AND RETAIL TRADE AND REPAIR OF MOTOR VEHICLES
    AND MOTORCYCLES SECTOR ...................................................................................................... 50
FIGURE 8.13. OJVS FOR THE PROFESSIONAL, SCIENTIFIC AND TECHNICAL ACTIVITIES SECTOR 50
FIGURE 8.14. OJVS FOR THE INFORMATION AND COMMUNICATION SECTOR ................................ 50
FIGURE 8.15. OJVS BY KNOWLEDGE REQUIREMENTS (%) ................................................................ 51
FIGURE 8.16. OJVS BY PERSONAL QUALITIES REQUIREMENTS (%) ................................................ 52
FIGURE 8.17. OJVS BY SKILLS REQUIREMENTS (%)........................................................................... 52
FIGURE 8.18. OJVS BY TOOLS AND TECHNOLOGY REQUIREMENTS (%) ......................................... 52

                                                                                                                                                             5
6
FIGURE 8.19. OJVS BY SKILLS/KNOWLEDGE REQUIRED FOR BUSINESS SERVICES AGENTS NOT
ELSEWHERE CLASSIFIED (%) ....................................................................................................... 53
FIGURE 8.20. OJVS BY SKILLS/KNOWLEDGE REQUIRED FOR STOCK CLERKS ............................... 54
FIGURE 9.1. COMPARISON BETWEEN OJVS AND EMPLOYED POPULATION, BY SKILL LEVEL ....... 56
FIGURE 9.2. OJVS BY OCCUPATION (LEVEL 1), APRIL 2020–SEPTEMBER 2020 ............................... 57
FIGURE 9.3. EMPLOYED POPULATION BY OCCUPATIONAL GROUP, 2019 ....................................... 57
FIGURE 9.4. OJVS AND EMPLOYED POPULATION BY SECTOR OF ACTIVITY ................................... 58
FIGURE 9.5. EMPLOYED POPULATION BY SECTOR OF ACTIVITY, 2019............................................ 58
FIGURE 9.6. OJVS BY SECTOR OF ACTIVITY, APRIL–SEPTEMBER 2020 ........................................... 59
FIGURE 9.7. OJVS BY EDUCATIONAL LEVEL, APRIL–SEPTEMBER 2020 ........................................... 60
FIGURE 9.8. EMPLOYED POPULATION BY EDUCATIONAL LEVEL, 2019 ............................................ 60
TABLE 6.1. POPULATION OF UKRAINE, 2017–2019 ............................................................................. 14
TABLE 6.2. TOTAL POPULATION STRUCTURE BY AGE GROUP, 2017–2019 (%) ............................... 14
TABLE 6.3. LABOUR FORCE PARTICIPATION BY AGE GROUP, 2017–2019 (%) ................................. 14
TABLE 6.4. LABOUR FORCE PARTICIPATION RATE BY GENDER, 2017–2019 (%) ............................. 15
TABLE 6.5. LABOUR FORCE PARTICIPATION RATE FOR URBAN AND RURAL AREAS, 15–70 YEARS,
2017–2019 (%) ................................................................................................................................. 15
TABLE 6.6. LABOUR FORCE PARTICIPATION RATES FOR QUALIFICATION LEVELS, 15–70 YEARS,
2017–2018 (%) ................................................................................................................................. 15
TABLE 6.7. UNEMPLOYMENT RATE FOR UKRAINE AND EU COUNTRIES BY GENDER, 2019 (%) .... 21
TABLE 6.8. EMPLOYED POPULATION BY SUB-SECTOR ACCORDING TO NACE, 15–70 YEARS, 2019
........................................................................................................................................................ 31
TABLE 6.9. EMPLOYED POPULATION BY SUB-SECTOR ACCORDING TO NACE, 15–70 YEARS, 2016–
2019................................................................................................................................................. 31
TABLE 6.10. EMPLOYMENT RATE IN UKRAINE AND EU COUNTRIES BY GENDER, 15+ YEARS, 2019
(%) ................................................................................................................................................... 35
TABLE 6.11. EMPLOYMENT RATE IN UKRAINE AND EU COUNTRIES BY GENDER, 15–24 YEARS,
2019 (%) .......................................................................................................................................... 36
TABLE 7.1. UKRAINIAN POPULATION AND INTERNET USE STATISTICS ........................................... 39
67
1 INTRODUCTION – OBJECTIVE OF THE PROJECT
Governments and socioeconomic partners in most ETF partner countries are unanimous on the need
to develop and better use information on labour market and skills dynamics to improve the performance
of education and training, the availability of qualifications and skills for employment, and the lifelong
societal and personal development of individuals. In this context, most partner countries have been
reinforcing their systems, capacities and methods to identify, analyse and anticipate demand and skills
needs in a context of changing economic structures, new types of work, and rapid digital transformation
of occupations and tasks.
While conventional labour market intelligence (LMI), based on regular statistics, specific-purpose
surveys and qualitative methods, has gained ground in ETF partner countries, there is room to further
innovate data sources, improve analytical capacities and modernise the formats and instruments to
visualise and disseminate insights for users (policy makers, socioeconomic partners, education and
training players).
Big Data analytics offers new opportunities to improve LMI and deliver real-time and fine-grained skills
analysis and insights for users. Big Data is all around us. Big Data is characterised by volume, variety,
velocity and – eventually – value. Machine learning and artificial intelligence (AI) algorithms, combined
with immense computing power anytime and anywhere, allow data science to exploit specific Big Data
sources that have great potential to supplement and enrich conventional LMI. This is the case for online
job vacancies (OJVs) managed by a large variety of online job portals and boards.
Creating knowledge out of large volumes of data that are available at high velocity and with great variety
is the major goal of Big Data analysis. It is about value. Analysis of thousands of millions of job vacancies
can describe much about the skills that employers want, in almost real time and in fine-grained detail.
Screening and ranking of OJV portals – the first step of the methodology – can tell us much about the
overall panorama of the online/digital labour market in countries and regions, the features of the
individual job portals, the volume of OJVs posted, and the sectoral and occupational coverage of OJVs.
Most importantly, analysis of OJVs reveals specifics of how employers describe jobs/tasks, the mix of
skills they seek, and the importance they attribute to credentials/qualifications.
OJVs are a rich source of information about the skills and other job characteristics that
employers require, information that is difficult to gather via other conventional methods. Data
from OJVs do not replace other types of LMI but add value and can be combined with
conventional statistical data.
78
2 BIG DATA FOR LABOUR MARKET INTELLIGENCE
(LMI)
The characteristics of job vacancies and the way they are advertised have changed radically over the
past few years. Technological progress, globalisation and the reorganisation of production processes
have seen not only the introduction of new professional profiles (typically linked to technological factors),
but also the redefinition of consolidated professions, through the introduction of new skills, which are
increasingly becoming essential for many professions. In fact, it is observed that the demand for digital
skills plays an increasing role within all professional profiles, even those not necessarily related to the
information and communication technology (ICT) sector. Knowledge of these current changes can
certainly be gained through the study and analysis of the data that companies publish on the web when
searching for professionals to meet their needs. An example in this direction is the growing diffusion of
services for online recruitment (e-recruitment) which make it possible to publish a job request through
various web sources, such as online newspapers, employment agencies, specialised websites and job
vacancy aggregators. The development of algorithms, methodologies and systems for labour market
analysis for the synthesis of useful information for decision making has recently been termed ‘labour
market intelligence’, by which we mean the definition and implementation of AI and Big Data techniques
for the processing and synthesis of labour market data with the aim of supporting decision-making
processes.
LMI is an emerging cross-disciplinary field of study that is attracting research interest in both industrial
and academic communities, as summarised below. Since the early 1990s, text classification (TC) has
been an active research topic. It has been defined as ‘the activity of labelling natural language texts with
thematic categories from a predefined set’ (Sebastiani, 2002). Most popular techniques are based on
the machine learning paradigm, according to which an automatic text classifier is created by using an
inductive process that is able to learn, from a set of preclassified documents, the characteristics of the
categories of interest. Recently, TC has been shown to give good results in categorising much real-life
web-based data such as news and social media, and sentiment analysis. Skills extraction from OJVs
can also be associated to the information extraction and named entity recognition frameworks. The latter
has been applied to solve numerous domain-specific problems in the areas of information extraction
and normalisation. In recent years, public administrations have started to explore new ways of
supporting knowledge management and of obtaining detailed and fresh information about the labour
market. Here, administrative information collected by public administrations has been used to study
labour market dynamics, conducting both data quality and knowledge discovery activities through AI
techniques. Unfortunately, administrative data are collected when people are hired (and only in countries
where the state collects such information), so do not provide information about labour demand.
This problem is also relevant for businesses, and this has motivated the development of several
commercial products providing job seekers and companies with skill-matching tools. Firms have a strong
need to automate human resource department activities; consequently, a growing number of
commercial skill-matching products have been developed in recent years.
89
We aim to classify OJVs according to a target classification system for building a (language-
independent) knowledge base for analysis purposes, rather than matching resumes on job vacancies.
Our approach aims to build a knowledge-graph to support fact-based decision-making activities for LMI.
3 THE KDD PROCESS
Bias, abnormalities or inconsistencies, duplication and volatility are some of the aspects that need to be
removed to improve the accuracy of Big Data. As one might imagine, for a given data source the greater
the variety, the greater the veracity. The use of natural language brings into the text a great deal of
‘noise’ containing no information (e.g. prepositions, terms not related to the topic of interest, conjunctions
and acronyms that must be expanded). All these issues must be properly addressed to enable
unstructured data to produce knowledge through the knowledge discovery in databases (KDD) process.
This approach enables management of Big Data for LMI and consists of five main steps (Figure 3.1):
selection, preprocessing, transformation, data mining and machine learning, interpretation/evaluation.
Clearly, this needs to be adapted to the domain of interest, adjusting one task or step in relation to
another.
Figure 3.1. The KDD process
Source: Fayyad et al. (1996).
Selection. Selection of data sources is the first step. Each internet source must be evaluated and ranked
in terms of the reliability of the information. This phase should consider, for example, the vacancy
publication date, the website’s update frequency, the presence of structured data, and any downloading
restrictions. At the end of this phase, a ranking of reliable web sources is produced.
Preprocessing. This step includes data cleaning to remove noise from the data or inappropriate outliers
(if any), deciding how to handle missing data, and identifying a function to detect and remove duplicated
entries (e.g. duplicated vacancies or vacancies with missing values). Data quality and cleaning are
910
essential tasks in any data-driven decision-making approach, to guarantee the credibility of the overall
process. Identification of duplicated job vacancies is far from straightforward. Job vacancies are usually
posted on multiple websites, and this is a duplication, whereas re-use of the same text to advertise a
similar position is not. Identification of appropriate features for correct recognition of duplicates in the
internet labour market domain is crucial. The preprocessing step reduces the complexity of the Big Data
scenario, mitigating the impact of the veracity dimension through data quality and cleaning.
Transformation. This step includes data reduction and projection, which aim to identify a unified model
to represent the data, depending on the purpose of the exercise. Furthermore, it may involve the use of
dimensionality reduction or transformation methods to reduce the effective number of variables or to
find invariant representations for the data. Like preprocessing, the transformation step reduces the
complexity of the data set by addressing the variety dimension. It is usually performed by the usage of
extraction, transformation and loading (ETL) techniques, which support the data preprocessing and
transformation phases in the KDD process. Roughly speaking, through ETL, the data extracted from a
source system undergo a series of transformation routines that analyse, manipulate and then clean the
data before loading them into a knowledge base. By the end of this step, the outcome of which is a
clean, well-defined data model, the Big Data variety issue should be resolved.
Data mining and machine learning. The aim of this step is to identify appropriate AI algorithms (e.g.
classification, prediction, regression, clustering, information filtering) by searching for patterns of interest
in a particular representational form, based on the purpose of the analysis. More specifically, in the
context of LMI, it usually requires the use of TC algorithms (e.g. ontology based or machine learning
based) to build a classification function for mapping data items into one of several predefined classes.
This step is crucial as it is mainly devoted to the extraction of knowledge from the data.
Interpretation/evaluation. This final step employs visual paradigms to visually represent the knowledge
obtained, depending on the user’s objectives. In the LMI context, it means considering the user’s ability
to understand the data and their main goal in the LMI field.
The collection of OJVs aims to extract the following variables, classified according to international
standards so that the data are comparable, regardless of the country analysed:
■ occupation International Standard Classification of Occupations (ISCO) v.1 down to level 4
■ skill European Skills/Competences, qualifications and Occupations (ESCO)1 v.1
■ educational level International Standard Classification of Education (ISCED) level 1
■ working hours custom taxonomy (‘part-time’ and ‘full-time’)
1 ESCO is a multilingual classification system for European skills, competences, qualifications and occupations,
developed by the European Commission. The ESCO classification corresponds to the International Standard
Classification of Occupations (ISCO-08) up to the fourth-digit level. It then extends ISCO through an additional
level of occupations and skills, organised as a graph rather than a tree (i.e. a skill may belong to multiple
occupations).
1011
■ type of contract custom taxonomy (‘temporary’, ‘permanent’, ‘self-employed’)
■ industry NACE2 level down to level 2
Once the internet labour market data have been produced, they must be delivered to end users
according to the needs of stakeholders. For labour market analysts, interactive dashboards have been
built that allow analysis of internet labour market dynamics and trends following a predefined model,
ensuring data integrity and protection. It should be emphasised that a key role in data validation is that
of the national expert. These experts’ knowledge of the country analysed allows them on the one hand
to verify and validate what emerges from the analysis of OJVs and on the other hand to help in the
interpretation of any phenomena that emerge. Only those who know the local area can make the most
effective use of web data, always with the intention of integrating rather than replacing the official
statistical data, which represent a stock figure in effect and therefore a ‘snapshot’ at a certain time, in
contrast to web data.
2Statistical classification of economic activities in the European Community, see:
https://ec.europa.eu/eurostat/web/nace-rev2
1112
4 DEFINITION OF ONLINE JOB VACANCY
The analysis of OJVs and the skills specified in them makes it possible to identify – at a given moment
in time – the main skills required by the company for the professional profile demanded. For example,
the skill of ‘programming’ is unlikely to be explicitly mentioned by the employer in an advertisement for
a software analyst as it is deemed to be implicit; meanwhile, the same skill could be made explicit for a
statistician if this is considered as enabling the profession. In this sense, therefore, a vacancy listing
should not be understood as an enumeration of the skills of the professional profile; standard taxonomies
offer a complete and comprehensive description. Instead, the job advertisement must be understood as
a specification of the competences and skills of the profession that are considered essential for
companies when the data is collected or observed. In other words, vacancy listings allow attention to be
focused on the skills required in real time by the labour market, and thus represent a valuable tool for
investigating changes over time in professions and skills in the different dimensions of analysis.
OJVs, which are job advertisements, containing two main text fields: a title and a full description. The
title briefly summarises the job position, while the full description field usually includes details of the
position and the relevant skills the employee should hold.
5 ONLINE JOB VACANCIES: UKRAINE
The analysis below was carried out on data collected monthly from April to September 2020 consisting
of over 201 400 unique job advertisements published on the web and coming from different and
heterogeneous sources aimed at the national territory of Ukraine. These are announcements that are
published daily on selected portals and that – when properly elaborated – make it possible to analyse
the professions required, their characteristics in terms of competences and skills (extracted from the
description in the text of the advertisement), the economic sector of the companies concerned and other
variables of interest, such as type of contract and years of previous experience required. The portals
selected capture the characteristics of the job demand as completely as possible on the web in the
national territory. Through the landscaping phase, 18 sources were selected; of these, 15 have a
national geographical scope, while the remaining 2 have an international scope; 17 sources of the 18
are job search portals while the remaining 1 is a classified ads portal.
Regarding small companies, generally they don’t use web channel to recruit staff, using instead more
traditional channels. Then, there will almost certainly be few OJVs collected regarding those companies.
What do the data tell?
• Ratio deduplicated/total
1213
The deduplicated/total ratio is a very relevant indicator for the job market on the web for the analysed
countries. Comparison of data for the two countries analysed, namely Tunisia and Ukraine, shows a
substantial difference for this indicator, with the latter having a much lower duplication rate. This is
hypothetically indicative of a business difference applied by the different portals: the market on the
Tunisian web, which is presumably in a phase of growth and consolidation, has rather generalist portals
that are transversal to the various sectors and probably have a high percentage of announcements in
common. Meanwhile, the Ukrainian market is more multifaceted, with portals that over the years have
developed specific markets for different business roles and sectors, specialising and, consequently,
reducing duplication. This index, based on a solid selection of sources obtained through the landscaping
phase, is therefore very interesting and is suggestive of a dynamic of maturity of the job market on the
web.
• The COVID-19 pandemic
The current period we are experiencing represents a unique and unprecedented moment in time. The
study and analysis of how the pandemic is reflected on the one hand in the employment/unemployment
data extracted from official statistics and on the other in the web data certainly represents an interesting
aspect. Although we do not have up-to-date data that we can use for our analysis of the former, for the
latter it is possible to make initial observations by analysing the monthly historical series (April–
September 2020). April is the month with the lowest number of advertisements published (17 404), and
this corresponds with the most stringent COVID-19 measures put in place by the Ukrainian authorities
since 12 March. There is a significant increase in announcements precisely corresponding to the gradual
withdrawal of the measures from 11 May onwards. The significant increase in the number of
announcements starting from May is therefore entirely logical following the recovery of the various
economic activities, although the trend in subsequent months does not seem to have stabilised. It should
be pointed out that the reduced length of the historical series does not allow for clear and irrefutable
conclusions to be drawn. Thus, this growth will have to be verified to understand whether it is an
extemporaneous factor linked to the exit from the lockdown or a seasonal factor that will recur in ‘normal’
conditions. It is therefore impossible to estimate the dynamics. Nevertheless, it is important to assess
and monitor what is happening in order to understand how the market is adapting to this historic event.
In the future, we will be able to understand better how the dynamics have stabilised, with what growth
rates (already visible today, after the first months of collection and observation) and with what new
emerging skills and professions. In this sense, the freshness and timeliness of the web data allow us to
understand aspects in almost real time, something that is not possible with the official data.
1314
6 DATA FROM OFFICIAL STATISTICS
This section provides a summary description of the labour market in Ukraine through the analysis of the
main indicators developed with respect to the available dimensions, starting with official statistics
(Statistical Information (ukrstat.org)).
Population characteristics
The total population of Ukraine was almost 42 000 000 persons as of 2018 (according to the State
Statistical Service of Ukraine). The population growth rate is negative.
Table 6.1. Population of Ukraine, 2017–2019
Population 2017 2018 2019
Total population (in thousands) 42 584.5 42 386.4 42 153.2
Average annual increase* −0.51 −0.61 −0.55**
Notes: *per 1 000 inhabitants; **estimate
With regard to the composition of the population by age group, in 2019 the 15–59 age group was the
largest share, at 61.2% of the total, followed by the over-60 group (23.4%), and finally young people
under the age of 14 (the remaining 15.4%). In the years observed there has been an increase in the
share of the over 60s, from 22.5% in 2017 to 23.4% in 2019, and a reduction in the 15–59 age group,
from 62.1% in 2017 to 61.2% in 2019.
Table 6.2. Total population structure by age group, 2017–2019 (%)
Age (years) 2017 2018 2019
0–14 15.4 15.5 15.4
15–59 62.1 61.6 61.2
60 and over 22.5 22.9 23.4
6.1.1 Number of people aged 15 years and over in the labour force
The number of people in the labour force in 2019 in Ukraine was 18 155 700, consisting of 9 501 600
men and 8 654 100 women (52.33% and 47.67%, respectively).
Table 6.3. Labour force participation by age group, 2017–2019 (%)
Age 2017 2018 2019
15–24 34.4 33.7 36.2
25–29 78.6 79.6 80.0
30–34 82.7 83.3 82.0
35–39 84.7 84.7 85.8
40–49 84.7 86.0 86.0
50–59 68.4 70.7 73.8
60–70 13.9 13.2 13.7
71 and over : : 2.4
15–70 62.0 62.6 63.4
1415
15 and over : : 56.3
The labour force participation rate for men in 2019 was 69.9% and for women 57.5%. Participation has
increased over the years for both men (from 69.0% in 2017) and women (from 55.7% in 2017). Overall,
the male participation rate is much higher than the rate for females, with a gap of around 12 percentage
points.
Table 6.4. Labour force participation rate by gender, 2017–2019 (%)
Gender 2017 2018 2019
Male 69.0 69.0 69.9
Female 55.7 56.8 57.5
In 2019 the labour force participation rates in urban and rural areas were almost equal (at around 60%).
Table 6.5. Labour force participation rate for urban and rural areas, 15–70 years, 2017–2019 (%)
Area 2017 2018 2019
Urban 62.8 63.5 64.3
Rural 60.4 60.6 61.5
In terms of qualifications, the highest labour force participation rate was among individuals with a
master’s degree (as of 2018).
Table 6.6. Labour force participation rates for qualification levels, 15–70 years, 2017–2018 (%)
Level of education 2017 2018 2019
Graduate (master’s degree) 76.4 77.5 :
Undergraduate (bachelor’s degree) 53.0 58.0 :
Undergraduate (junior bachelor) 67.3 67.1 :
Vocational education 69.3 69.3 :
Secondary general education – second stage 47.4 48.0 :
Secondary general education – first stage 20.3 19.6 :
Elementary education and non-degree 7.1 4.6 :
Unemployed and unemployment rates
In 2019 over 1 487 000 were unemployed; there was a marked decrease between 2017 and 2019
(−12.4%, corresponding in absolute value to over 210 000 fewer unemployed individuals), following a
significant increase from 2015 to 2017 (+3%, or 43 000 more people unemployed). Men represent 54%
(over 807 000) of the total unemployed population. Most unemployed people (67%) are located in urban
areas.
6.2.1 Unemployed population aged 15 years and over
Figure 6.1. Evolution of the unemployed population aged 15 years and over, 2015–2019
1516
Analysing the distribution of the unemployed population in 2019 with respect to qualification level, it can
be observed that the largest share is among those with a higher qualification, who represent 46% (over
687 000 of over 1 487 000 unemployed), followed by 30% (over 440 000 people) with a vocational
qualification, 21% (over 306 000 people) with complete secondary education, and finally only 4% (over
54 000 people) with basic secondary, primary education or not educated. The largest share of
unemployment among those with higher qualifications is among women (54%, an absolute value of over
372 000 people). Meanwhile, for the other qualifications, men have the highest shares, in particular for
the level basic secondary, primary education or not educated, with a share of 67% (36 500 unemployed
out of a total of 54 500 people).
Figure 6.2. Unemployed population by level of education, 15 years and over, 2019
Unemployed population by level of education
Basic secondary, primary education or not
4%
educated
Complete secondary 21%
Vocational 30%
Higher (complete, basic, uncompleted) 46%
0% 10% 20% 30% 40% 50%
1617
There are several factors that have led to unemployment among the Ukrainian population. In 2019, the
main cause, with a 39.6% share, was ‘dismissed due to one’s own will, upon a mutual agreement of the
parties’; analysed by gender, 41.4% of unemployed women were in this group compared to 38.2% of
unemployed men; by place of residence, this cause applied to 44.3% of those in urban areas, higher
than the share of those in rural areas (30.2%).
‘Laid off for economic reasons’ is in second position, accounting for 21.5% of unemployed people,
followed by ‘seasonal work’ (9.6%) and ‘not employed after graduating educational institutions’ (9.4%).
The remaining causes have shares below 9%.
Figure 6.3. Unemployed population by reason for unemployment, 15 years and over, 2019 (%)
Unemployed population, by reason of unemployment
Demobilised after term military service 0.8
Perform home (family) duties etc. 3.3
State of health, registering for pension 3.4
Other reasons 3.5
Dismissed due to end of employment contract
or agreement 8.9
Not employed after graduating educational
institutions 9.4
Seasonal work 9.6
Laid off for economic reasons 21.5
Dismissed due to one's own will, upon a
mutual agreement of the parties 39.6
0 5 10 15 20 25 30 35 40 45
6.2.2 Unemployment rate aged 15–70 years
The unemployment rate is high, especially for young people, men and those in rural areas.
The overall unemployment rate in 2019 was 8.2%, down from the previous year (8.8%) and even lower
than the rate for 2017, when it reached its maximum value of 9.5%.
With regard to gender, the male unemployment rate is higher than the overall rate, with a value of 8.5%
in 2019; this was also down compared to previous years and compared to 2017, when it was 11.1%.
1718
For women, the rate was 7.9% in 2019, but this was an increase compared to the previous year (7.4%
in 2018); this contrasts with the trends in the overall rate and in the male rate3.
Figure 6.4. Unemployment rate evolution by gender, 15–70 years, 2015–2019 (%)
Unemployment rate evolution by gender, 15–70 years
12.0 10.8 11.1
11.0 10.1 10.0
9.3 9.5
10.0 9.1 8.8 8.5
9.0 8.1
7.7 7.7 7.4 8.2
8.0
7.9
7.0
6.0
5.0
4.0
2015 2016 2017 2018 2019
Total Females Males
Analysis by place of residence shows a higher unemployment rate among those in rural areas, at 8.7%
in 2019, but a significant decrease compared to 2017, when it was 9.9%. For those in urban areas the
rate was lower, at 8.0% in 2019, but the trend is the same as for rural areas: the rate fell from 2017 to
2019, from 9.3% to 8.0%.
Figure 6.5. Unemployment rate evolution by place of residence, 15–70 years, 2015–2019 (%)
Evolution of Unemployment rate by place of residence, 15-
70 years
10.5
9.9
10.0 9.7
9.5
9.4 9.3
9.5 9.2
9.1 9.3 8.8 8.7
9.0 9.2
9.0 8.6
8.5
8.2
8.0
8.0
7.5
7.0
2015 2016 2017 2018 2019
Total Urban area Rural area
3 The unemployment rate is calculated as the number of unemployed people as a percentage of the active
population. Unemployed people are those of working age who are without work, who are available for work and
who have taken active steps to find work.
1819
With regard to age group, in 2019 the unemployment rate was 15.4% for young people aged 15–24
years, 8.4% for those aged 25–29 and 7.3% and 7.5%, respectively, for the age groups 30–34 and 35–
39 years; it was higher again for individuals aged 40–49 (8.4%) and fell to 8.0% for the age group 50–
59.
The male unemployment rate was higher than the female rate for the age groups 15–24 years (15.5%
vs 15.3%), 25–29 years (8.8% vs 7.8%), 30–34 years (8.1% vs 6.3%) and 50–59 years (8.8% vs 7.2%);
the female unemployment rate was higher for the remaining age groups.
Figure 6.6. Unemployment rate by age group, 15–70 years, 2019 (%)
Unemployment rate by age group, 15–70 years, 2019
60-70 0.1
50-59 8.0
40-49 8.4
35-39 7.5
30-34 7.3
25-29 8.4
15-24 15.4
0 5 10 15 20
The unemployment rate is high, particularly among men, those with basic secondary, primary
education or no education, and those in urban areas.
With regard to qualification level, the highest unemployment rate (13.9%) is among those with basic
secondary, primary education or no education, followed by basic higher (10.1%), complete secondary
(9.6%), vocational (9.2%), uncompleted higher (8.0%), and finally complete higher (6.3%). In relation to
gender, men in the basic secondary, primary education or not educated group have a much higher
unemployment rate than women with this qualification level (16.2% and 10.8%, respectively); the same
can be observed for the uncompleted higher level (9.3% for men and 7.2% for women).
Meanwhile, the female unemployment rate for the basic higher level is higher (11.5%) than the male
rate (8.7%).
Figure 6.7. Unemployment rate by educational level and gender, 15–70 years, 2019 (%)
1920
Unemployment rate by educational level and gender, year 2019
18.0
16.2
16.0
13.9
14.0
11.5
12.0 10.8
10.1 9.6 9.9 9.1
10.0 8.7
9.3 9.2 9.0 9.5
8.0
8.0 7.2
6.3 6.0 6.6
6.0
4.0
2.0
0.0
Complete higher Basic higher Uncompleted Vocational Complete Basic secondary,
higher secondary primary education
or not educated
Total Males Females
For place of residence, the unemployment rate in 2019 was higher among those in urban areas with
basic secondary, primary education or no education (15.8%) than for those in rural areas with the same
educational level (12.7%); the same is observed for complete secondary (10.0% in urban areas and
9.2% in rural areas), and uncomplete higher (8.2% and 7.7%, respectively). For the other qualifications,
a lower unemployment rate is observed in urban areas than in rural areas, in particular for the basic
higher qualification, for which the rates were 9.7% and 11.4%, respectively.
Figure 6.8. Unemployment rate by educational level and place of residence, 15–70 years, 2019 (%)
Unemployment rate by educational level and place of residence, 15–70 years,
2019
18.0
15.8
16.0
13.9
14.0 12.7
11.4
12.0 10.1 9.7
9.2 9.2 9.2 9.6 10.0 9.2
10.0
8.0 8.2 7.7
8.0 6.3 6.3 6.5
6.0
4.0
2.0
0.0
Complete higher Basic higher Uncompleted Vocational Complete Basic secondary,
higher secondary primary education
or not educated
Total Urban area Rural area
2021
Finally, the Table 6.7 shows the Ukrainian unemployment rate in relation to both the EU average (28
countries) and the individual nations in the EU.
The Ukrainian unemployment rate is higher overall than the EU rate, at 8.2% compared to 6.3% in 2019.
The same trend is evident with respect to gender: the female unemployment rate in Ukraine is 7.9%
compared to the EU average of 6.6%, while the male unemployment rate is 8.5% compared with the EU
average of 6.1%. However, the female unemployment rate is lower than the male rate in the Ukrainian
territory (7.9% vs 8.5%), whereas in the EU the female unemployment rate is higher than the male rate
(6.6% vs 6.1%).
Table 6.7. Unemployment rate for Ukraine and EU countries by gender, 2019 (%)
Countries Unemployment rate (%) Female unemployment rate (%) Male unemployment rate (%)
Ukraine 8.2 7.9 8.5
EU (28 countries) 6.3 6.6 6.1
Austria 4.5 4.4 4.6
Belgium 5.4 4.9 5.7
Bulgaria 4.2 3.9 4.5
Croatia 6.6 7.2 6.2
Cyprus 7.1 8.0 6.3
Czechia 2.0 2.4 1.7
Denmark 5.0 5.3 4.8
Estonia 4.4 4.8 4.1
Finland 6.7 6.2 7.2
France 8.5 8.4 8.5
Germany 3.2 2.7 3.5
Greece 17.3 21.5 14.0
Hungary 3.4 3.5 3.4
Ireland 5.0 4.7 5.2
Italy 10.0 11.1 9.1
Latvia 6.3 5.4 7.2
Lithuania 6.3 5.5 7.1
Luxembourg 5.6 5.5 5.7
Malta 3.4 3.6 3.3
Netherlands 3.4 3.4 3.4
Poland 3.3 3.6 3.0
Portugal 6.5 7.2 5.9
Romania 3.9 3.4 4.3
Slovakia 5.8 6.0 5.6
Slovenia 4.5 5.0 4.0
Spain 14.1 16.0 12.5
2122
Sweden 6.8 7.0 6.7
United Kingdom 3.8 3.5 3.9
6.2.3 NEETs
Ukraine, like many other Eastern European countries, faces the challenge of developing policy tools that
can help to solve the problem of young people who are not in employment, education or training
(NEETs). In 2017, the proportion of NEETs in Ukraine was 22.1% of the population aged 15–29 (0.9
percentage points less than in 2016).
In 2017, most NEETs in Ukraine were young people without higher education (63.1% with incomplete
higher education, vocational education and full secondary education). NEETs account for a significant
proportion (39.3%) of women aged 25–29, and of young women living in rural areas (where almost a
third of women do not work or study). With regard to socioeconomic status in the labour market, 66.0%
of NEETs are economically inactive while the remaining 34.0% are unemployed. Among unemployed
youth, NEETs represent the overwhelming majority of short-term unemployed (young people looking for
work up to 12 months), while among economically inactive youth, the majority of NEETs are inactive
due to care or family responsibilities; about 70% of NEETs are non-poor according to the relative poverty
criterion (75% of total median income). Women from complete graduate or undergraduate backgrounds
predominate by gender (45.0% of women are NEETs, vs 32.5% for men). The distribution of young
unemployed NEETs by population density corresponds directly to the level of education: the higher the
level of education, the higher the proportion of young unemployed NEETs in urban settlements and the
lower the proportion in rural areas. The State Employment Service of Ukraine has records of 22.5% of
unemployed NEET women and only 8.7% of men.
Women make up the largest share of economically inactive NEETs: they represent over 76% of all
economically inactive young people aged 15–29. The largest number of inactive women are in the age
group 25–29. People without higher education predominate among economically inactive youth. The
share of those who did not have even basic general secondary education was 5.6% among women and
three times more (16.6%) among men. The share of overall economically inactive NEETs disaggregated
by geographic areas and ranges from 12.3% to 34.8%. Distribution is not uniform is analysed across
age ranges: indeed, the lowest level of economic inactivity among young people is 60.9%.
Employed and employment rate
6.3.1 Employment by demographic characteristics
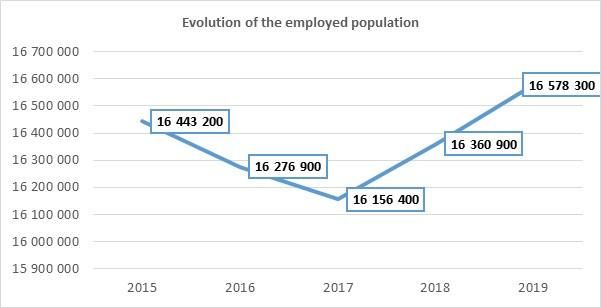
The number of employees has shown a positive and increasing trend starting from 2017, rising from
over 16 156 000 people in 2017 to over 16 578 000 in 2019, an increase of 2.6%, which corresponds in
absolute terms to over 421 000 more employees.
Figure 6.9. Evolution of the employed population, 15–70 years, 2015–2019
2223
With regard to gender, in 2019 men represented 52% of employees (over 8 620 700), compared with
48% for women (approx. 7 957 600).
Almost half of those employed were in the age group 40–59, with a share of 48% in 2019; among this
age group, those aged 40–49 accounted for 26% and those aged 50–59 for the remaining 22%. The
young employed population aged between 25 and 39 represented 41% of the total.
Figure 6.10. Employed population by age group, 15–70 years, 2019
Employed population by age group
60-70 4%
50-59 22%
40-49 26%
35-39 15%
30-34 15%
25-29 12%
15-24 7%
0% 5% 10% 15% 20% 25% 30%
Finally, 68% of total employees (over 11 414 000 people out of more than 16 578 000 employed in
Ukraine) in 2019 were in urban areas.
6.3.2 Employed population by educational level, gender and place of residence
The highest share of employees in 2019 (32%, over 5 378 000) had complete higher education, followed
by those with vocational education (26%), uncomplete higher (20%) and complete secondary (17%).
The remaining two educational levels – basic secondary, primary education or not educated and higher
2324
basic – each had a share of 2%. Therefore, Ukraine has a highly qualified workforce, with those who do
not have basic qualifications representing only 2% of the total employed population.
Figure 6.11. Employed population by educational level, 15–70 years, 2019
Employed population by educational level
Basic secondary, primary education or not
2%
educated
Complete secondary 17%
Vocational 26%
Uncompleted higher 20%
Basic higher 2%
Complete higher 32%
0% 5% 10% 15% 20% 25% 30% 35%
Comparing the educational level of employees by gender reveals some interesting insights.
• Female: the share of employment for women with complete higher education is clearly higher
than the share for men (36% vs 29%); the same can be observed for those with uncomplete
higher education (25% vs 16%).
• Male: the share of employment for men with vocational education is clearly higher than the
share for women (33% vs 19%); the same can be observed for those with complete secondary
education (19% vs 16%).
For the remaining educational levels – basic higher and basic secondary, primary education or not
educated – the shares of employed are equal.
Figure 6.12. Employed population by educational level and gender, 15–70 years, 2019
2425
Employed population by educational level and gender, 15–70 years, 2019
Males 29% 2% 16% 33% 19% 2%
Females 36% 2% 25% 19% 16% 2%
0% 10% 20% 30% 40% 50% 60% 70% 80% 90% 100%
Complete higher Basic higher
Uncompleted higher Vocational
Complete secondary Basic secondary, primary education or not educated
With regard to the composition of employees by educational level based on their place of residence,
Figure 6.13 reveals substantial differences.
• Urban: the proportion of employees with complete higher education is clearly larger in urban
than rural areas (40% vs 15%); the same can be observed for uncompleted higher education
(21% vs 18%).
• Rural: the proportion of employees with complete secondary education is larger in rural than
urban areas (29% vs 12%); the same is recorded for vocational education (32% vs 24%), and
for basic secondary, primary education or not educated (4% vs 1%).
Figure 6.13. Employed population by educational level and place of residence, 15–70 years, 2019
Employed population by educational level and place of residence
Rural area 15% 1% 18% 32% 29% 4%
Urban area 40% 2% 21% 24% 12% 1%
0% 10% 20% 30% 40% 50% 60% 70% 80% 90% 100%
Complete higher
Basic higher
Uncompleted higher
Vocational
Complete secondary
Basic secondary, primary education or not educated
2526
6.3.3 Employed population by occupational group, gender and place of residence
Elementary occupations and professionals, each with a share of 18%, are the professional groups with
the highest proportion of the employed population in Ukraine. One percentage point behind is the group
services and sales workers, with a 17% share, followed by skilled workers using specific tools and
experts, with 12% each, and plant and machine operators and assemblers with 11%.
The remaining professional groups have shares of 8% or less, and in last position is the skilled
agriculture, forestry, fishery and fish farming workers group, with only 160 000 people, just 1% of the
employed population.
Figure 6.14. Employed population by occupational group, 15–70 years, 2019
Employed population by occupational group
Skilled agriculture, forestry, fishery and… 1%
Clerical support workers 3%
Legislators, senior officials and managers 8%
Plant and machine operators, and… 11%
Experts 12%
Skilled workers using specific tools 12%
Services and sales workers 17%
Professionals 18%
Elementary occupations 18%
0% 5% 10% 15% 20%
Analysis of employees by occupational group and gender reveals the following.
• Female: the share of female employees who are in the professionals group is higher than the
share of male employees (23% vs 14%); the same is observed for services and sales workers
(23% vs 11%), experts (16% vs 8%) and clerical support workers (5% vs 1%).
• Male: meanwhile, the share of male employees who are in the other professional groups is
higher than the share of female employees, in particular for plant and machine operators, and
assemblers (18% vs 4%) and skilled workers using specific tools (20% vs 4%).
Figure 6.15. Employed population by occupational group and gender, 15–70 years, 2019
2627
Employed population by occupational group and gender
Males 9% 14% 8% 1% 11% 1% 20% 18% 19%
Females 7% 23% 16% 5% 23% 1%4% 4% 17%
0% 10% 20% 30% 40% 50% 60% 70% 80% 90% 100%
Legislators, senior officials and managers Professionals
Experts Clerical support workers
Services and sales workers Skilled agriculture, forestry, fishery and fish farming workers
Skilled workers using specific tools Plant and machine operators, and assemblers
Elementary occupations
Distinctive characteristics also emerge with regard to place of residence. In particular, rural areas are
characterised by the presence of low-specialisation employees: 37% of those in rural areas are in
elementary occupations, compared to 9% of those in urban areas. In contrast, urban areas are
characterised by the presence of highly specialised employees; in particular, 22% of those in urban
areas are professionals compared to 9% of those in rural areas, and for legislators, senior officials and
managers the shares are 10% and 4% respectively.
Figure 6.16. Employed population by occupational group and place of residence, 15–70 years, 2019
2728
Employed population by occupational group and place of
residence
Rural area 4% 9% 8% 2% 15% 2% 10% 12% 37%
Urban area 10% 22% 13% 4% 17% 0% 13% 11% 9%
0% 20% 40% 60% 80% 100%
Legislators, senior officials and managers
Professionals
Experts
Clerical support workers
Services and sales workers
Skilled agriculture, forestry, fishery and fish farming workers
Skilled workers using specific tools
Plant and machine operators, and assemblers
Elementary occupations
Classifying the professional groups by their skill level, as shown in Figure 6.17, allows us to observe the
differences in the employment of the professional groups with respect to both gender and place of
residence.
Figure 6.17. Classification of skill level by occupational group
Medium
High level Low level
level
Professionals
Services and Elementary
sales workers occupations
Plant and
Skilled workers machine
Experts using specific
tools operators, and
assemblers
Skilled
Legislators, agriculture,
senior officials forestry, fishery
and managers and fish farming
workers
Clerical support
workers
Figure 6.18 shows that the proportions of male and female employees at the medium skill level are the
same; in contrast, substantial differences emerge between the genders in terms of the employment of
high-level and low-level profiles.
2829
In particular, 45% of female employees work in high-level profiles compared to 30% of male employees;
in contrast, 37% of male employees are in low-level profiles, while for female employees the figure is
21%.
Overall, Ukraine is characterised by a greater presence of employees in high-level profiles, with a share
of 38%, followed by those at the medium level, with 33%, followed by those at the low level, with 29%.
Figure 6.18. Employed population by skill level and gender, 15–70 years, 2019
Employed population by skill level and gender
Low level 29% 21% 37%
Medium level 33% 34% 33%
High level 38% 45% 30%
0% 20% 40% 60% 80% 100% 120%
Total Females Males
The same analysis applied to the place of residence clearly shows that rural areas are characterised by
the employment of low-level profiles: 49% of those employed in these profiles are in rural areas,
compared to 20% in urban areas; in contrast, 45% of employees in high-level profiles are in urban areas,
compared with 21% in rural areas. For medium-level profiles, slightly more employees are in urban
areas than in rural areas (35% and 30%, respectively).
Figure 6.19. Employed population by skill level and place of residence, 15–70 years, 2019
2930
Employed population by skill level and sex
Low level 29% 21% 37%
Medium level 33% 34% 33%
High level 38% 45% 30%
0% 20% 40% 60% 80% 100% 120%
Total Females Males
6.3.4 Employed population and economic sectors
With regard to the distribution of employees by sector of economic activity in Ukraine, a significant share
of employment is associated with the services sector; in 2019 over half of the employed population
(62.8%) worked in services, followed by the industrial sector with 19.1% and finally the agricultural sector
with 18.2%. Analysis of the observed time period (2017–2019) shows the following.
• Industry sector: the share of employment was slightly down from 2017 to 2018 (19.1% to
18.9%), but returned to growth in the following year, rising back to the 2017 level.
• Agriculture sector: the share of employment increased over the entire time period
observed, from 17.7% in 2017 to 18.2% in 2019.
• Services sector: the share of employment decreased over the period observed, from 63.2%
in 2017 to 62.8% in 2019.
Figure 6.20. Employed population by sector of activity, 15–70 years, 2017–2019 (%)
Evolution of Employment population by sector of activity
70 63.2 63.1 62.8
60
50
40
30
19.1 17.7 18.9 18 19.1 18.2
20
10
0
2017 2018 2019
Industry Agriculture Services
30You can also read