IAB-DISCUSSION PAPER 7|2020 Robots Worldwide: The Impact of Automation on Employment and Trade
←
→
Page content transcription
If your browser does not render page correctly, please read the page content below
IAB-DISCUSSION PAPER
Articles on labour market issues

7|2020 Robots Worldwide: The Impact of Automation
on Employment and Trade
Francesco Carbonero, Ekkehard Ernst, Enzo Weber

  ISSN 2195-2663
Robots Worldwide: The Impact of Automation
on Employment and Trade

Francesco Carbonero (University of Turin, University of Regensburg), Ekkehard Ernst (ILO),
Enzo Weber (IAB, University of Regensburg)

Mit der Reihe „IAB-Discussion Paper“ will das Forschungsinstitut der Bundesagentur für Ar-
beit den Dialog mit der externen Wissenschaft intensivieren. Durch die rasche Verbreitung
von Forschungsergebnissen über das Internet soll noch vor Drucklegung Kritik angeregt und
Qualität gesichert werden.

The “IAB-Discussion Paper” is published by the research institute of the German Federal Employ-
ment Agency in order to intensify the dialogue with the scientific community. The prompt
publi-cation of the latest research results via the internet intends to stimulate criticism and
to ensure research quality at an early stage before printing.
Contents
1 Introduction . . . . . . . . . . . . . . . . . . . . . . . . . . . . . . . . . . . . . . . . . . . . . . . . . . . . . . . . . . . . . . . . . . . . . . . . . . . . . . . . . . . . . 7
2 Data and descriptive statistics . . . . . . . . . . . . . . . . . . . . . . . . . . . . . . . . . . . . . . . . . . . . . . . . . . . . . . . . . . . . . . 12
3 Theoretical and empirical approach. . . . . . . . . . . . . . . . . . . . . . . . . . . . . . . . . . . . . . . . . . . . . . . . . . . . . . . . 15
3.1 Regression setting and econometric issues . . . . . . . . . . . . . . . . . . . . . . . . . . . . . . . . . . . . . . . . . . 15
3.2 Instrumental variable . . . . . . . . . . . . . . . . . . . . . . . . . . . . . . . . . . . . . . . . . . . . . . . . . . . . . . . . . . . . . . . . . . . 17
3.3 Plausibility checks . . . . . . . . . . . . . . . . . . . . . . . . . . . . . . . . . . . . . . . . . . . . . . . . . . . . . . . . . . . . . . . . . . . . . . 19
4 Results. . . . . . . . . . . . . . . . . . . . . . . . . . . . . . . . . . . . . . . . . . . . . . . . . . . . . . . . . . . . . . . . . . . . . . . . . . . . . . . . . . . . . . . . . . 21
4.1 Effects on employment . . . . . . . . . . . . . . . . . . . . . . . . . . . . . . . . . . . . . . . . . . . . . . . . . . . . . . . . . . . . . . . . . 21
4.2 Special effects within and outside manufacturing . . . . . . . . . . . . . . . . . . . . . . . . . . . . . . . . . . . 23
5 Further effects via off- and re-shoring . . . . . . . . . . . . . . . . . . . . . . . . . . . . . . . . . . . . . . . . . . . . . . . . . . . . . . 26
6 Conclusion . . . . . . . . . . . . . . . . . . . . . . . . . . . . . . . . . . . . . . . . . . . . . . . . . . . . . . . . . . . . . . . . . . . . . . . . . . . . . . . . . . . . . 30
References. . . . . . . . . . . . . . . . . . . . . . . . . . . . . . . . . . . . . . . . . . . . . . . . . . . . . . . . . . . . . . . . . . . . . . . . . . . . . . . . . . . . . . 32
List of Figures
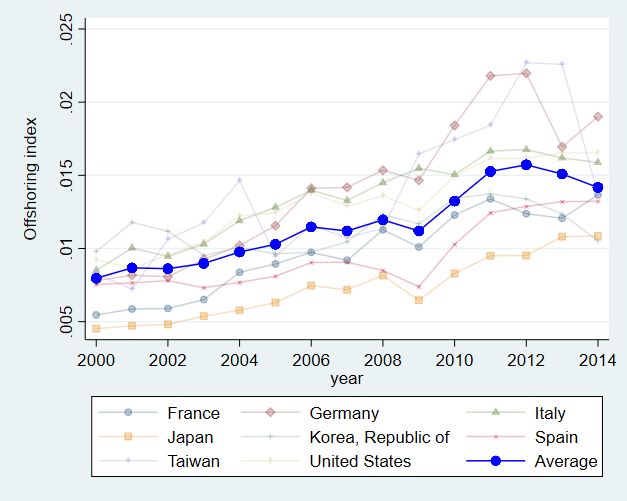
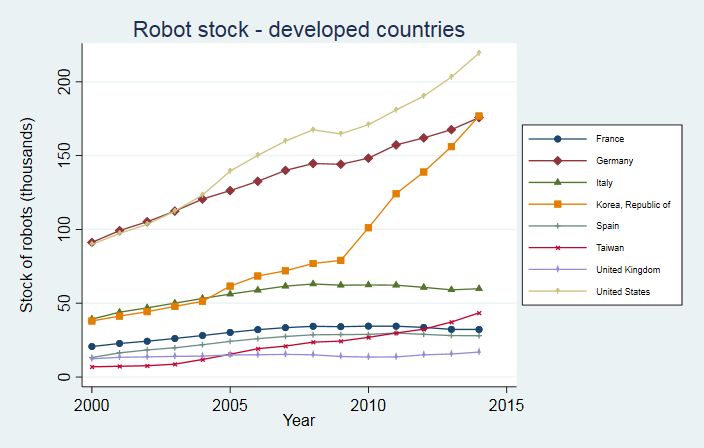
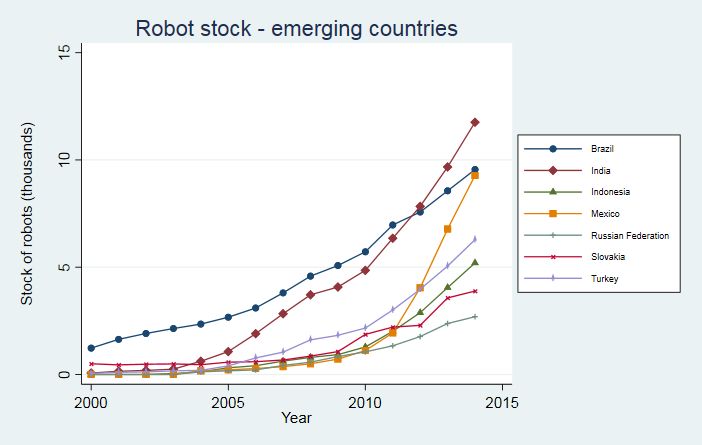
Figure 1: Evolution of the stock of robots (in ’000s) . . . . . . . . . . . . . . . . . . . . . . . . . . . . . . . . . . . . . . . . . . . . 14
Figure 2: Share of robot by industry, developed and emerging countries (2014) . . . . . . . . . . . 14
Figure 3: Robot stock (log of) by application. In circle applications with top robot usage
in 1993, in triangle application with top robot growth between 1993 and 2015. . 16
Figure 4: Standard deviation of robot share across applications versus ICT price index,
2005-2015 (2005=1). . . . . . . . . . . . . . . . . . . . . . . . . . . . . . . . . . . . . . . . . . . . . . . . . . . . . . . . . . . . . . . . . . . . . 19
Figure 5: TP index versus automation patents, US 2000-2015 (2000=1). . . . . . . . . . . . . . . . . . . . . . 20
Figure 6: First stage regression of robot stock on TP index. Regression using trend vari-
ables between 2005 and 2015. . . . . . . . . . . . . . . . . . . . . . . . . . . . . . . . . . . . . . . . . . . . . . . . . . . . . . . . . 22
Figure 7: Off-shoring index (relative to emerging countries) for countries with the high-
est share of robots in 2014. . . . . . . . . . . . . . . . . . . . . . . . . . . . . . . . . . . . . . . . . . . . . . . . . . . . . . . . . . . . . 27
IAB-Discussion Paper 7|2020 3List of Tables
Table 1: Descriptive statistics by country, overall sample, 2014. . . . . . . . . . . . . . . . . . . . . . . . . . . . . . 11
Table 2: Descriptive statistics by sector, overall sample. . . . . . . . . . . . . . . . . . . . . . . . . . . . . . . . . . . . . . . 13
Table 3: Employment regressed on robot and labour intensity. OLS approach. . . . . . . . . . . . 21
Table 4: Employment regressed on robot and labour intensity. IV approach. . . . . . . . . . . . . . . 22
Table 5: Robot stock within and outside manufacturing. IV approach. . . . . . . . . . . . . . . . . . . . . . 24
Table 6: Spillover effect of robots across sectors. IV approach. . . . . . . . . . . . . . . . . . . . . . . . . . . . . . . 25
Table 7: The impact of robots on off-shoring in developed countries. . . . . . . . . . . . . . . . . . . . . . . 29
Table 8: The impact of robots in developed countries on employment in emerging coun-
tries. . . . . . . . . . . . . . . . . . . . . . . . . . . . . . . . . . . . . . . . . . . . . . . . . . . . . . . . . . . . . . . . . . . . . . . . . . . . . . . . . . . . . . . 29
IAB-Discussion Paper 7|2020 4Abstract The impact of robots on employment and trade is a highly discussed topic in the academic and public debates. Particularly, there are concerns that automation may threat jobs in emerg- ing countries given the erosion of the labour cost advantage. We provide evidence on the effects of robots on worldwide employment, including emerging economies. To instrument the use of robots, we introduce an index of technical progress, defined as the ability of robots to carry out different tasks. Robots turn out to have a significantly negative impact on world- wide employment. While it is small in developed countries, for emerging economies it amounts to -11 per cent between 2005 and 2014. However, here, there appear positive spillovers espe- cially from robotisation in manufacturing on employment outside manufacturing. Further- more, we assess cross-country effects, finding that robots in developed countries decrease off-shoring just as employment in emerging economies. Zusammenfassung Die Auswirkungen von Robotern auf Beschäftigung und Handel sind in der akademischen und öffentlichen Debatte ein viel diskutiertes Thema. Insbesondere gibt es Bedenken, dass die Automatisierung Arbeitsplätze in Schwellenländern gefährden könnte, da der Arbeitskos- tenvorteil nachlässt. Wir liefern Belege für die Auswirkungen von Robotern auf die weltweite Beschäftigung, einschließlich der Schwellenländer. Um den Einsatz von Robotern zu instru- mentieren, führen wir einen Index des technischen Fortschritts ein, definiert als die Fähigkeit von Robotern, verschiedene Aufgaben auszuführen. Roboter wirken sich signifikant negativ auf die weltweite Beschäftigung aus. Während der Effekt in Industrieländern klein ist, beträgt er in Schwellenländern zwischen 2005 und 2014 -11 Prozent. Hier zeigen sich jedoch positi- ve Spillover-Effekte insbesondere durch die Robotisierung im Verarbeitenden Gewerbe auf die Beschäftigung außerhalb des Verarbeitenden Gewerbes. Darüber hinaus untersuchen wir länderübergreifenden Auswirkungen. Dabei stellen wir fest, dass Roboter in Industrieländern zu weniger Offshoring führen und sich so negativ auf die Beschäftigung in Schwellenländern auswirken. JEL J23, O33, F16 IAB-Discussion Paper 7|2020 5
Keywords

robot, technology, employment, off-shoring, re-shoring

Danksagung

We would like to thank Wolfgang Dauth, Stefan Kuehn, Sabine Klinger, Hermann Gartner,
Rossana Merola, Daniel Saaman, Francesco Devicienti for fruitful discussions and suggesti-
ons. We received precious inputs from the Research Department of the International Labour
Office of Geneva and the Forecasts and Macroeconomic Analyses Department of the Institu-
te for Employment Research (IAB) of Nuremberg. The University of Torino and Compagnia di
San Paolo Bank Foundation are kindly acknowledged for financial support within the pro-
ject "Productivity, welfare and decentralization". A previous version of this paper is given by
Carbonero et al. (2018).

IAB-Discussion Paper 7|2020                                                                  6
1        Introduction

Since several years, technological change dominates the discussions on the future of global
labour markets. Digitization and automation give reason to expect that there will be major
upheavals. One important dimensions of this technological change is robotisation. While the
process already lasts for several decades, it is an enormous broadening of the tasks robots are
conducting that makes robotisation a topical key issue. It is exactly this broadening of tasks,
for which we provide clear-cut evidence, that we exploit in the underlying study in order to
estimate the impact of robotisation on employment and trade.

The debate on the diffusion of robots is flourishing, with the number of studies rising con-
stantly. Scholars particularly focused on the impact of robots on employment and tackled it
either with country-industry panel setting Graetz/Michaels (2018); De Backer et al. (2018) or
with more microeconomic approach using local labour market variation (Acemoglu/Restrepo,
2017; Dauth et al., 2017; Chiacchio/Petropoulos/Pichler, 2018) or firm-level information (Koch/
Manuylov/Smolka, 2019) . Despite the high diffusion of robots in developing countries, how-
ever, research has focused mainly on developed countries. In the this paper we use a country-
industry panel setting to shed light on the role of robots in emerging economies and to anal-
yse the impact of automation on the global organisation of production.

The evidence of the impact of robots on employment is ambiguous. Graetz/Michaels (2018)
find no link between robots and overall employment in developed countries, while De Backer
et al. (2018) show a positive correlation between robot investment and employment within
MNEs in developed countries. Acemoglu/Restrepo (2017) show that one more robot per thou-
sand workers negatively affects the US employment-to-population ratio by 0.37 percentage
points , while Chiacchio/Petropoulos/Pichler (2018) find a size of 0.16-0.20 pp in the EU. With
a similar exercise, Dauth et al. (2017) find no detrimental role of robots for overall employ-
ment, while they see a compositional effect, namely, jobs lost in manufacturing are offset by
new jobs in the service sector. Using firm-level data, Koch/Manuylov/Smolka (2019) find a
net job creation in firms adopting robots of 10 per cent.

The ambiguity is likely explained by the fact that robots, that are one component of the wider
automation wave, can not be solely the threat of current employment or the source of new
employment. Rather, there are several channels through which automation can influence
the production process and that have consequences on the labour market. Specifically, Ace-
moglu/Restrepo (2019) illustrate four mechanisms that counterbalance the displacement ef-
fect of automation: a productivity effect, a capital accumulation effect, the deepening of au-
tomation (operating through an increase in productivity) and the creation of new tasks. Fur-
thermore, the authors point to potential risks related to the phase of automation (excessive

IAB-Discussion Paper 7|2020                                                                  7
automation) and to the capability of the labour market to adapt to the new required skills.1

This paper contributes to the literature in two ways. First, we are the first to present evidence
on the impact of robots on employment in emerging economies. Evidence is still scarce, yet
the diffusion of automation in middle- and low-income countries has been as pronounced as
in high-income countries. They key point is that emerging countries display several labour
market weaknesses - such as limited labour market institutions, high informality, large share
of employment in agriculture - that could be connected to larger adverse effects of robots on
employment in these countries. Moreover, robots are mainly used in manufacturing, a sector
that represents the primary source of paid employment in emerging countries. Therefore we
may expect an impact not only on the stock of employment but also on the overall quality of
jobs.

Besides the effect of robots on employment, in this paper we assess to what extent robots
affect off-shoring in high-income countries and we are the first to measure whether this mat-
ters for employment in middle- and low-income countries. Attention has been increasing
as regards the tendency of bringing production back home to advanced economies, also
known as re-shoring. In a developing literature, parallel work to our study (Faber, 2018; Ar-
tuc/Christiaensen/Winkler, 2019) finds negative impacts of robot exposure for the specific
case of Mexican employment and US imports from Mexico. Increasing labour cost and the
need of a shorter and more agile supply chain are among the factors that reduce the advan-
tage of off-shoring the production in developing countries. For instance, China and Mexico
experienced a wage increase of 500 per cent and 67 per cent during the last decades (Sirkin/
Zinser/Rose, 2014). More recently, the trade conflict between China and the US is one of the
key source of uncertainty for the economic growth in Asia (ILO, 2016). In this regard, firms
in developed countries may find it cheaper to automate certain processes instead of running
the production abroad (see UNCTAD, 2016). However, off-, re-shoring and automation are
part of a more general rethinking of business strategies that have become more complex and
based on a wider set of variables than simple cost comparisons. We may even see shoring
going in opposite direction. In the study of Cohen et al. (2016), for example, the recovery of
North America manufacturing is thought to be not due to re-shoring of US companies, but to
off-shoring of Asian and European firms. In this complex and changing scenario, our paper
looks at the role of robots in developed countries for the trade dynamics and employment in
emerging countries.

Second. We propose a new instrumental variable approach that exploits a key reason why
robots became so popular in the production process. That is their increasing ability of per-
forming diverse and complex applications. Complementing human decision makers and pos-

1
   As regards this last point, see Warning/Weber (2018) on the consequences of digitalization on the hiring pro-
cess. The authors find no impact of company-internal digitization on hirings and separations, while vacancies
and abandoned searches increase.

IAB-Discussion Paper 7|2020                                                                                   8
sibly overcoming perceived short-comings in their decision making process is probably the
key feature of the current technological wave. In the latter, robots play an important role and,
above all, we know what they actually do.

Graetz/Michaels (2018) exploited the applications of robots by comparing the description of
occupations in 1980 with the description of robot applications and generate a replaceability
score of the occupations to instrument the stock of robots. Given that there are not com-
parable occupational classifications for emerging countries, we propose a new strategy that
overcomes the lack of microeconomic data. This consists in exploiting the variation in the dif-
fusion of robots across application. Data from the International Federation of Robotics (IFR)
reveal that, between 1993 and 2015, robot have strongly increased their range of application.
We show, for instance, that the applications with the largest share of robots in 1993 (e.g., arc
welding or assembling) have been caught up in 2015 by new, fast-growing type of tasks (e.g.,
dispensing and packaging). While at the firm level the spread of robots in specific tasks can
be endogenous to the type of labour force, we argue that at the country level such evolution
depicts rather the advancement of the technological frontier of robots.

We rationalize this evolution by arguing that robots, as well as any technological tool, can
experience two types of technological advancement: one that improves the tasks currently
done (advancement at the intensive margin) and one that makes other tasks available (ad-
vancement a the extensive margin).2 We make use of a stochastic specification to describe
the two types of advancement and produce an index of technological advancement at the ex-
tensive margin based on the diffusion of robots across tasks. We find that this index is strongly
correlated with the stock of robots, signaling a stronger advancement at the extensive margin
rather than at the intensive margin. At the same time we are aware that our approach grasps
part of all sources of endogeneity. Therefore, as a plausibility check, we compare our index
with two proxies for related technological improvement: the price index of Information Com-
munication Techonologies and the number of patents in automation. Both measures reveal
a good correlation with our index.

We find the following results. First, robots have a detrimental effect on employment growth
at the global level, more than eleven times stronger in emerging economies than in devel-
oped economies. Second, the impact of robots on employment is not affected by the level of
labour intensity in developed economies, while the evidence on such non-monotonic effects
is mixed for emerging economies. We get these results using an OLS approach applied to the
long-run trend of the variables as well as with an IV approach intended to capture the endo-
geneity between employment and robots. Overall, our estimates point to a long-run decline
of employment in the relevant sectors of about 5 per cent due to an increase of the num-
ber of robots by 24 per cent between 2005 and 2014. In developed countries, this decline of

2
     Acemoglu/Restrepo (2019) are the first to propose this distinction and to clarify the different implications
for labour demand.

IAB-Discussion Paper 7|2020                                                                                    9
employment amounts to 0.43 per cent, while in emerging economies it reaches almost 11 per cent. However, we find that robotisation especially in manufacturing has substantial positive spillover effects on employment outside the sector in emerging economies, unlike in devel- oped countries. Third, robots in developed countries reduce off-shoring and have an impact on employment in emerging economies of -8 per cent over 2005-2014. The paper is structured as follows. In section 2 we provide a description of the dataset and the graphical evidence of the use of robots across sectors and countries. In section 3 we illustrate the theoretical basis of our main regression and that of our instrument. We show the diffu- sion of robots across applications and link it to our technological index of automation at the extensive margin. Following this, in section 4 we present the results of the impact of robots on employment in developed and emerging countries and discuss potential spillover effects between manufacturing and non-manufacturing sectors. Finally, in section 5 we provide the results of the analysis regarding the impact of robots on re-shoring in developed countries and the relative effect on employment in emerging countries. Section 5 concludes. IAB-Discussion Paper 7|2020 10
IAB-Discussion Paper 7|2020

                              Table 1: Descriptive statistics by country, overall sample, 2014.
                                                                                            Average ∆                                              Average ∆
                                                                             Employees                                                 Employees
                                            Country              Robots                       ln(VA)     Country              Robots                 ln(VA)
                                                                              (’000s)                                                   (’000s)
                                                                                            2014-2000                                              2014-2000
                                            Japan                295829        53310              0.00   Turkey                6286      20049       0.07
                                            United States        219434        145951             0.04   Switzerland           5764      4161        0.07
                                            China                189358        858367             0.15   Indonesia             5201      74641       0.11
                                            Korea, Republic of   176833        17547              0.07   Denmark               5119      2575        0.05
                                            Germany              175768        38307              0.05   Hungary               4302      3834        0.08
                                            Italy                 59823        18127              0.04   Finland               4178      2196        0.05
                                            Taiwan                43484         8308              0.03   Slovakia              3891      1896        0.11
                                            France                32233        24545              0.05   Portugal              2870      3794        0.05
                                            Spain                 27983        15495              0.06   Russian Federation    2694      60265       0.14
                                            United Kingdom        16935        26412              0.05   Slovenia              1819       745        0.06
                                            India                 11760        314882             0.11   Romania               1361      6171        0.12
                                            Sweden                10742         4518              0.06   Norway                1008      2588        0.08
                                            Brazil                9557         93704              0.09   Ireland               667       1593        0.07
                                            Czech Republic        9543          4326              0.09   Greece                392       2625        0.04
                                            Mexico                9277         25686              0.05   Bulgaria              197       2685        0.10
                                            Netherlands           8470          7228              0.05   Croatia               121       1304        0.07
                                            Canada                8180         16794              0.06   Estonia                83        561        0.11
                                            Belgium               7995          3795              0.06   Lithuania              57       1157        0.10
                                            Australia             7927         10669              0.09   Latvia                 19        791        0.10
                                            Austria               7237          3697              0.06   Malta                  12        172        0.07
                                            Poland                6401         12311              0.08

                                 Source: IFR and SEA (WIOD)                                                                                                    .
11
2 Data and descriptive statistics We obtain data on robots from the International Federation of Robotics (IFR). They refer to machines that are "automatically controlled, reprogrammable, multipurpose manipulator, programmable in three or more axes, which can be either fixed in place or mobile for use in industrial automation applications" (International Organisation for Standardization, ISO). Our data for robots is available for 43 countries in seven broad sectors and 13 sub-sectors within manufacturing. To get data on employment, value added and capital input, we merge it with industry-level information available from the Socio Economic Accounts (SEA) of the World Input-Output Database (WIOD) and use market exchange rates provided by WIOD to convert nominal values into US dollars. After the merge we remain with 41 countries and 15 sectors. The time dimension is reduced to 2005-2014 because of data availability. In the IFR database, information for Mexico and Canada is lumped together under "North America" before 2011. Therefore we impute them using the yearly growth rate of robots in Canada and Mexico after 2010. By looking at the stock, table 1 shows that in 2014 robots were primarily installed in Japan, in the US, in the largest economies of the EU, but also in some emerging economies, such as China, India and Brazil. The last column reports the average growth of value added between 2000 and 2014, but the evidence is mixed: within each of the two country groups, robots were installed in fast- as in slow-growth countries. Given that robots perform their tasks at constant quality and almost an unlimited number of times, industries characterized by a large share of workers that carry out repetitive tasks, may find it profitable to substitute workers for robots. For this reason, we look at the change of robots between 2014 and 2005 together with the labour intensity in 2005, at the industry level. Table 2 reveals that, at the global level, robots spread as much in labour-intensive sec- tors as in capital-intensive sectors. This is particularly visible in emerging countries where automotive is more capital intensive, while in developed economies robots increased mainly in sectors such as automotive, basic metals and electronics that display a more intense use of labour. In figure 1 we plot the time series of the stock of robots across countries to give a flavour of the evolution over time in both groups. We plot Japan and China in a separate graph due to their extreme values within their groups. Among developed economies, after Japan, Korea (Republic) emerges as one of the first investors of robots alongside the United States and Germany, while Italy reveals a declining trend. As regards emerging economies, India, Brazil and Mexico show the highest level of stock, followed by a mixture of Asian and European countries and Russia. China stands out as the country that has bought more robots than any other country in the world since 2013 and is expected to expand even more, given the planned IAB-Discussion Paper 7|2020 12
Table 2: Descriptive statistics by sector, overall sample.
                                    World           Developed economies      Emerging economies
                         ∆ Robot         Labour      ∆ Robot     Labour      ∆ Robot     Labour
   Sector                 stock         intensity     stock     intensity     stock     intensity
                        2014-2005        (2005)     2014-2005    (2005)     2014-2005    (2005)
   Education/research
                              2             6.4        -21        6.5          64         6.2
   & development
   Textiles                    3            2.4        -2         2.4          17         2.3
   Basic metals              1172           1.8       1257         2          940         1.2
   Wood and Paper             -23           1.8        -39         2           22         0.9
   Automotive                6019           1.6       5106        2.1         8509        0.1
   Construction               28            1.6        29         1.8          25         0.9
   Rubber, plastic
   and mineral                733           1.4       201         1.6         2183        0.8
   products
   Industrial
                              249           1.4        -64        1.2         1102        1.8
   machinery
   Electronics               3035           1.3       2995        1.4         3143        1.1
   Food and
                              749           1.1       878         1.3         397         0.6
   beverages
   Agriculture                13            0.9        14         0.6          9          1.6
   Chimicals and
                              306           0.8       383         0.8          96         0.8
   fuel
   Mining and
                              4             0.5        4          0.4          1          0.9
   quarrying
   Utilities                   1            0.4        -1         0.4          8          0.6

Source: IFR and SEA (WIOD)

target of 100,000 robots per year by 2030.

In addition, we present some descriptives at industry level. We follow the same classification
as in Acemoglu and Restrepo (2017) and use those industries resulting from the merge with
the SEA of WIOD. The striking fact of Figure 2 is that the distribution of robots across industries
is almost identical in developed and emerging countries. In both sub-regions the installation
of industrial robots regards essentially the manufacturing sector and is concentrated in the
automotive industry.

IAB-Discussion Paper 7|2020                                                                         13
Figure 1: Evolution of the stock of robots (in ’000s) The figure shows time series of the robot stock in different countries. The three panels contain the data for the developed countries, the emerging countries and China and Japan. Source: IFR. Figure 2: Share of robot by industry, developed and emerging countries (2014) The figure shows how robots are distributed across industries. The shares are separately displayed for devel- oped and emerging countries. Source: IFR. IAB-Discussion Paper 7|2020 14
3        Theoretical and empirical approach

3.1      Regression setting and econometric issues

We run our analysis assuming a standard Cobb-Douglas production function for output Y in
                                              β
sector i, country j and year t, Yijt = Lαijt Kijt . We log-linearize the production function and
derive the labour demand as follows,

ln(Lijt ) = ln(α) + ln(Yijt ) − ln(Wijt ),                                                  (3.1)

where Wijt denotes the wage in sector i, country j , year t. We work with equation 3.1 and
add as covariate the log of robot stock lnRijt . As we show in Section 2, robots increased
more in labour-intensive sectors. Therefore we also include a dummy equal to one if the ratio
employees/capital compensation in sector i, country j is larger than the country mean in year
t, and zero otherwise. Following the approach of De Backer et al. (2018), we use this variable
also in an interaction with robots. To avoid contemporaneous endogeneity, we measure the
labour intensity at the beginning of the sample period, namely, 2005.

Moreover we have to deal with two other sources of potential endogeneity. First, in developed
and emerging markets both employment and robot stock may be affected by transitory fluc-
tuations of other factors connected to the stance of the business cycle, which would bias the
estimated effect of robots upwards. To tackle this problem, we follow Karabarbounis/Neiman
(2013) and use cross-country trends in the stock of employment and robots. This eliminates
the influence of temporary contemporaneous shocks. Therefore, our estimation equation in-
cludes cross-sector trends of the variables in equation 3.1 and of the log of robots (that is why
there will be no t subscript), the dummy for labour intensity in 2005, the interaction of robots
with labour intensity, country and sector fixed effects:

Lij = γ0 + γ1 Yij + γ2 Wij + γ3 Rij + γ4 Rij × li05 + γ5 li05 + Xi + Zj + uij ,             (3.2)

where Xi is the sector fixed effect, Zj the country fixed effect and the other variables repre-
sent the linear trend in the log of the corresponding measure. While this estimates the em-
ployment effects within the sectors where robots are installed, we consider potential spillover
effects between sectors below in section 4.2.

Second, reverse causality might be an issue. For instance, the abundance of workers may de-
crease the incentive to install robots. By the same token, financial frictions might limit both
the usage of labour and robots alike, whereas foreign direct investments could alleviate such
limitations. On the way to developing an instrumental variables approach, we start from the
consideration that our estimation would be unbiased, if robot investments were exclusively

IAB-Discussion Paper 7|2020                                                                   15
the result of the intrinsic properties of this type of automation, such as its technological level
and the tasks it can do. The IFR dataset provides the number of robots in each task (named
"application") at country level. Robots are classified in 35 applications, clustered in 6 macro-
classes: handling operations and machine tending, welding and soldering, dispensing, pro-
cessing, assembling and disassembling, cleaning. A general trend that we detect from the
data is that robot usage starts in few applications and over the years it spreads across all
the other application. This reflects one facet of technological improvement of automation,
namely, the practical ability of carrying out more and more tasks. It is also called "automa-
tion at the extensive margin" (see Acemoglu/Restrepo, 2019) and it is key for displacement
of workers. This is the opposite of advancements at the intensive margin, which takes place
when a technological tool improves in the ability of doing what it currently does. Of course,
the widening of robot usage across applications is not necessarily unbound from the struc-
ture of employment. For instance, the scarcity of cleaners and the abundance of assemblers
could lead to more use of cleaning robots. However, this variation in robot usage would be
exogenous to the aggregate level of employment.
Figure 3: Robot stock (log of) by application. In circle applications with top robot usage in 1993, in
triangle application with top robot growth between 1993 and 2015.
Robot stock by application
15
Arc welding
Assembling, mounting, inserting
Fixing, press-fitting
Handling operations at machine tools
Stock of robots (log)
10
Plastic moulding
Spot welding
Cleanroom for others
Disassembling
Laser cutting
5
Laser welding
Others dispensing/spraying
Packaging, picking, placing
Water jet cutting
0
1995 2000 2005 2010 2015
Year
The figure shows the (log of) robot stock between 1993 and 2015 for two sets of applications: those with highest
robot usage in 1993 and those with the highest growth in robot usage between 1993 and 2015. Source: IFR.
Before presenting the analytical setting of our instrument, we provide a graphical evidence
of advancement in automation at the extensive margin. In Figure 3 we compare the evolu-
tion of applications where robot usage is among the highest (top 25th percent) in 1993 with
applications that experienced the largest (top 25th percent) increase of robots between the
beginning of the series and 2015. No application is in both groups: this already indicates that
the increase of the stock of robots goes hand-in-hand with a robotization across applications.
The figure helps us visualize our reasoning about the instrument we are going to introduce,
IAB-Discussion Paper 7|2020 16namely, if technological change makes automation spreading at the extensive margin, the
increase of technical change correlates positively with a lower dispersion of robots across
applications. Indeed the dispersion in 1993 for the selected application is much lower than
in 2015, just as for all applications, which can however not be shown within one figure.
3.2 Instrumental variable
In order to motivate our instrument, we use a stylized analytical framework to explain the
usage of robots depending on their technological frontier. To this purpose, we simplify the
range of robots to type 1 and type 2, with each type corresponding to a certain task. In a styl-
ized setting, the overall output of robots YR,t shall be given by the CES production function
h −1
i
−1 −1
YR,t = (τ1,t R1,t ) + (τ2,t R2,t ) (3.3)
where Ri,t is the stock of robot i and τi,t its technological frontier in time t. The parameter
describes the elasticity of substitution between the two types of robot, or tasks. We show
later that our results do not depend on the degree of complementarity or substitutability of
the tasks. We assume the product market of robots being competitive, therefore the price of
robot Pi corresponds to its marginal product. Moreover, we are not interested in the absolute
usage of robots, but rather in their relative demand (we provide the algebra in the Appendix),
thus we write
−1
R1,t τ1,t P2,t
= (3.4)
R2,t τ2,t P1,t
As usual, price shocks impact the usage of robots as predicted in a standard downward slop-
ing demand curve. In particular, we use a stochastic specification of the technological frontier
τ that allows us to generalize the advancement in technology in each type of robot. The laws
of motion of technology are given by
τ1,t = τ1,t−1 (1 + g1,t )
(3.5)
τ2,t = τ2,t−1 (1 + g2,t )
where gi,t is the technological shock of robot type i, with bivariate density function (g1,t , g2,t |
t − 1) ∼ F (τi,t−1 , τj,t−1 ). Here we distinguish between two technologies:
• one that advances with shocks to only one type of tasks in machines and generate au-
tomation at the intensive margin (deepening of automation in Acemoglu/Restrepo, 2019),
IAB-Discussion Paper 7|2020 17with conditional expectation of g1,t /g2,t given by the function
df df
E(g1,t /g2,t | t − 1) = f (τ1,t−1 , τ2,t−1 ) > 0, >0 (3.6)
dτ1,t−1 dτ2,t−1
• another that proceeds by spreading and affecting more and more tasks (automation at
the extensive margin), where the advancement in tasks i favors the advancement in task
j. In this case, the conditional expectation of the relative shock are governed by
df df
E(g1,t /g2,t | t − 1) = f (τ1,t−1 , τ2,t−1 ) < 0, >0 (3.7)
dτ1,t−1 dτ2,t−1
Conversely to the first type of technological advancement, this last creates labour dis-
placement.
In other words, in case of automation we condition the shock on technology i to the frontier
of both technologies in time t − 1, with the impact from an additional innovation to the fron-
tier of i being smaller than the impact from an additional innovation to the frontier of j . This
setting does not prevent infinite technological progress, but it foresees a challenge in improv-
ing further a technology relative to another one, when the first is leading in the technological
frontier.
Now we explore which implications this model has on our demand for robots. With larger
than one, i.e. robots being gross substitute, the relative demand of robots is described by
equation (3.4). If τ1,t is leading, i.e. it is the more advanced technology, then R1,t > R2,t (up
to price differences). For the property of the distribution function, τ1 being the leader, τ2 will
tend to catch up. This will increase the demand for R2 relative to R1 and, by definition, reduce
the dispersion of robots across the two classes. In case is smaller than one, namely, with
robots being gross complement, if τ1,t is leading, then R1,t < R2,t . For the same mechanism
as above, further shocks to the technological frontier of the robots will make τ2 catch up and
R1 increase, again with the result of reducing the dispersion.
Logically, this stylized approach suggests a negative correlation of technological change and
robot dispersion, which we will exploit for instrumenting purposes. As a general multivari-
ate measure for the dispersion we can use the standard deviation of the demand for robots.
We present its derivation (algebra in the Appendix) in the case of larger than one and τ1
leading,
−1 −1
!
τ1,t τ2,t 1
SDR,t = YR,t − . (3.8)
P1,t P2,t 2
IAB-Discussion Paper 7|2020 18Our data on applications are at country level. Therefore, for each country j we generate the
share of robots in each application and we compute the index of technical progress T Pjt as
the inverse of the standard deviation of the shares in year t. The logic behind is that the
higher is the capability of robots of doing different tasks and the more even is their distri-
bution among the applications, the lower will be the standard deviation, hence the higher
will be the TP index.
3.3 Plausibility checks
In order to check the plausibility of this measure, we compare it with another technologi-
cal input that has recently experienced a technological improvement, namely, Information
Communication Technologies (ICTs)1 . In particular we compare the average standard devia-
tion of the robot shares with the average ICTs price index for a set of European countries and
the US. The countries of the sample are Austria, Denmark, France, Germany, Italy, the Nether-
lands, Spain, United Kingdom, United States. The source of the ICT price index is EUKLEMS
2005-2015. Figure 4 shows the scatter plot of the two series. In order to avoid spurious corre-
lation from both series trending downward, we compute the correlation of the residuals from
regressing each variable on a constant and a linear trend. We get a value of 0.91.2
Figure 4: Standard deviation of robot share across applications versus ICT price index, 2005-2015
(2005=1).
The figure shows scatter plot of the standard deviation of the robot share
across applications versus the ICT price index. Source: IFR and EUKLEMS.
Lastly, given our assumption that robots are one example of a broader automation wave,
we compare our TP measure with the number of automation patents, available for the US.
Information on patents come from Google3 . For the definition of automation patent we rely
1
See Carbonero/Offermanns/Weber (2017) for the labour market implications of a declining ICT price.
2
We have also computed the correlation on the first difference of each series: 0.74.
3
http://www.google.com/googlebooks/uspto-patents.html
IAB-Discussion Paper 7|2020 19on Mann/Püttmann (2018): it represents a "device that carries out a process independently".
According to the authors this definition embeds, among others, robots as well as self-driving
vehicles. Figure 5 displays the two series normalized to 1 in year 2000. The evolution of both
overlap significantly and the correlation is 0.83.
Figure 5: TP index versus automation patents, US 2000-2015 (2000=1).
The figure shows time series of the TP index and the automation patents
in the US. Source: Mann/Püttmann (2018) and authors’ calculations.
IAB-Discussion Paper 7|2020 204 Results
4.1 Effects on employment
Table 3 displays the result for the OLS approach1 . At the global level, robots has a coefficient
of -0.034, statistically significant at one percent level. This means that an increase of ten per-
cent in the stock of robots decreases employment in the relevant sectors by 0.34 per cent. To
quantify the impact, if the average number of robots increases by more than 20 per cent as it
happened between 2005 and 2014, employment would fall by 1 per cent. The impact seems
to be concentrated in labour-intensive sectors, for which the estimates point to a coefficient
of -0.066. Moreover, the effect worldwide is most likely due to emerging countries, with a
coefficient of -0.056. Here, given the change in robots between 2005 an 2014, we estimate a
negative impact on employment of 2 per cent, mainly driven by labour-intensive sectors.
Table 3: Employment regressed on robot and labour intensity. OLS approach.
Dependent
variable: World Developed countries Emerging countries
employment
robot stock −0.034∗∗∗ −0.004 −0.002 −0.001 −0.056∗∗ 0.034
(0.013) (0.011) (0.005) (0.007) (0.024) (0.021)
robot stock ×
−0.066∗∗∗ −0.002 −0.145∗∗∗
labour intensity
(0.014) (0.008) (0.018)
∗∗∗
labour intensity −0.005 0.017 0.003 0.003 0.004 0.045∗∗∗
(0.004) (0.006) (0.002) (0.003) (0.006) (0.007)
N 477 477 360 360 103 103
R2 0.91 0.92 0.86 0.85 0.87 0.91
Regression using trend variables, that are the coefficients of regressions on a linear trend. Standard error clustered at
sector-country level in parentheses. Significance levels: ∗ , ∗∗ , ∗∗∗ indicate significance at 0.10, 0.05 and 0.01. Controls:
value added, wage, sector and country fixed effects. Estimates are weighted by sectoral employment in 2005. Source:
IFR and WIOD.
Turning to the IV approach, we conducted a first-stage regression of the robot variable on our
instrument and the other covariates from equation 3.2. Figure 6 is a binned scatterplot of the
robots stock against our instrument TP index, once having residualized both for the control
variables. Evidently, our instrument correlates positively with the robot stock. In a standard
OLS regression, we get a positive coefficient of TP index of 0.14, significant at 1 per cent level.
Moreover, TP index has a likelihood ratio test statistic of 39. Thus, we can build on a strong
linkage between robots and the instrument.
In Table 4 we show the results of the IV approach. All the coefficients are larger (i.e. more
1
In what follows, we exclude China. While the point estimates of the robot effects including China would be
even larger, estimation uncertainty would be strongly inflated (results available upon request).
IAB-Discussion Paper 7|2020 21Figure 6: First stage regression of robot stock on TP index. Regression using trend variables be-
tween 2005 and 2015.
The figure shows the correlation between the trend in robot stock and the trend in T P index. Source: IFR.
negative) than those with OLS and, apart the one of the interaction, they turn out to be even
more precise. The same difference appears in Graetz/Michaels (2018) using an alternative
instrumenting strategy. Thus, there seems to be substantial upward bias in the OLS estimates
due to reverse causality issues discussed in section 3. While we ague that our instrumented
trend regression does a good job in accounting for the confounding factors, should there be
any endogeneity left, the OLS-IV gap would even be underestimated.
Table 4: Employment regressed on robot and labour intensity. IV approach.
Dependent
variable: World Developed countries Emerging countries
employment
robot stock −0.209∗∗∗ −0.247∗∗ −0.024∗∗ −0.051∗∗ −0.305∗∗∗ −0.054
(0.056) (0.125) (0.009) (0.021) (0.048) (0.456)
robot stock ×
0.046 0.038 −0.268
labour intensity
(0.098) (0.023) (0.469)
labour intensity −0.014∗∗∗ −0.029 0.003 −0.004 −0.038∗∗∗ 0.050
(0.005) (0.033) (0.003) (0.006) (0.010) (0.159)
N 477 477 360 360 103 103
2
R 0.61 0.54 0.81 0.78 0.41 0.60
Regression using trend variables, that are the coefficients of regressions on a linear trend. Standard error clustered at
sector-country level in parentheses. Significance levels: ∗ , ∗∗ , ∗∗∗ indicate significance at 0.10, 0.05 and 0.01. Controls:
value added, wage, sector fixed effects. Estimates are weighted by sectoral employment in 2005. Source: IFR and
WIOD.
The magnitude at the global level increases to -0.209 that implies a negative impact on overall
employment in the relevant sectors over 2005-2014 of 5 per cent. For developed countries
we get a negative effect on employment of 0.43 per cent, while for emerging economies our
IAB-Discussion Paper 7|2020 22estimates point to a robots-driven reduction of employment of more than 11 per cent.
Assessing whether these impacts are comparable to those in the previous literature, we use
the aggregate impact of robots on employment found by Acemoglu/Restrepo (2017), accord-
ing to which one more robot reduces aggregate employment by 5.6 workers. We compute
how many robots have been installed in the US between 2000 and 2014 and reduce employ-
ment by that amount multiplied by 5.6. We get a drop of employment of 0.52 per cent (or 0.57
per cent for all developed countries), very close to our baseline effect of 0.43 per cent.
4.2 Special effects within and outside manufacturing
Robots play a special role in manufacturing, but are also used in other sectors. This section
takes a more detailed look at the employment effects of robotisation along the sectoral di-
mension. First, we seek to measure robots effects in manufacturing and the rest of the econ-
omy separately. Second, we will investigate spillover effects between the sectors.
According to our data, 85 percent of all robots are located in manufacturing. Besides manu-
facturing, our data show robot usage in utilities, construction, education and research, agri-
culture and mining.
For estimating separate effects in the two sectors, we interact the robots measure with an in-
dicator dummy for employment observations stemming from manufacturing and from out-
side manufacturing. In particular, this allows for different coefficients in these two sectors.
The results are shown in Table 5.2
The small negative employment effect in the developed countries that we determined above
comes from job losses in manufacturing. Outside manufacturing, only a minor insignificant
impact is estimated. In contrast, in the emerging countries, we find similar negative effects
of robot usage both in and outside manufacturing. Furthermore, here, labour intensity plays
an important role: The negative effects are of about three times the size in case of labour-
intensive production (baseline effect plus interaction effect), and they are highly statistically
significant.
Beyond sector-specific effects, potential spillovers between the sectors are of special inter-
est. While job losses due to automation appear within the sectors where robots are used,
effects across the sectors can mirror factors such as complementarities of robots and ser-
vices or infrastructure, demand for capital goods or intersectoral labour supply shifts. For
2
Here, China was included in order to increase the relatively limited number of observations at the sectoral
level.
IAB-Discussion Paper 7|2020 23Table 5: Robot stock within and outside manufacturing. IV approach.
Dependent
variable: World Developed countries Emerging countries
employment
robot stock
−0.142 −0.013 −0.033∗∗∗ −0.044∗∗ −0.297∗∗ −0.192
manufacturing
(0.097) (0.043) (0.008) (0.020) (0.139) (0.165)
robot stock non-
−0.182∗ −0.006 −0.015∗ −0.035∗ −0.339∗∗ −0.180
manufacturing
(0.111) (0.050) (0.009) (0.20) (0.141) (0.191)
∗∗∗
labour intensity −0.003 0.069 0.002 −0.002 −0.002 0.127∗
(0.009) (0.014) (0.001) (0.004) (0.012) (0.066)
robot
manufacturing × −0.201∗∗∗ 0.012 −0.414∗
labour intensity
(0.048) (0.022) (0.213)
robot non-
manufacturing × −0.215∗∗∗ 0.029 −0.334∗
labour intensity
(0.040) (0.022) (0.171)
N 477 477 360 360 117 117
2
R 0.59 0.66 0.78 0.77 0.08 0.04
Regression using trend variables, that are the coefficients of regressions on a linear trend. Robust standard error in
parentheses. Significance levels: ∗ , ∗∗ , ∗∗∗ indicate significance at 0.10, 0.05 and 0.01. Controls: value added, wage.
Estimates are weighted by sectoral employment in 2005. Source: IFR and WIOD.
estimating the cross effects, we first calculate the average robot stock from manufacturing
and non-manufacturing sectors, respectively. Then, we amend the baseline regression in Ta-
ble 5 by manufacturing robots in the equations for non-manufacturing sectors and vice versa.
This delivers the spillovers over and above the robot effects within sectors.
Table 6 contains the results. Formally, the variable cross-sect robot stock holds the cross ef-
fects in both directions, i.e. manufacturing robots in non-manufacturing equations and vice
versa. In addition, cross-sect robot stock manufacturing stands for cross effects only from
non-manufacturing robots on manufacturing employment.
In developed countries, we find no relevant interactions across sectors. This is in line with
evidence from Acemoglu/Restrepo (2019) and Chiacchio/Petropoulos/Pichler (2018). A dif-
ferent result of positive spillover effects is found by Dauth et al. (2017) for Germany. How-
ever, our estimation outcome does not change when we exclude the US from the sample or
consider only European developed countries. In contrast, in the emerging countries, robots
in manufacturing have substantial positive spillovers on non-manufacturing employment.
The reverse effects are also positive, but weaker. While our previous results have shown that
robotisation strongly reduces employment in the emerging countries within the sectors of
robot usage, the spillover results open up a certain perspective: importantly, robotisation in
manufacturing is accompanied by the creation of non-manufacturing jobs. This is one crucial
IAB-Discussion Paper 7|2020 24Table 6: Spillover effect of robots across sectors. IV approach.
Dependent variable: employment World Developed countries Emerging countries
∗∗
cross-sect robot stock 0.186 −0.011 0.252∗∗∗
(0.080) (0.014) (0.073)
∗∗∗
cross-sect non-manufacturing robot stock −0.090 0.002 −0.101∗∗
(0.34) (0.018) (0.041)
labour intensity −0.004 0.002 −0.006
(0.003) (0.002) (0.007)
N 475 358 117
2
R 0.72 0.80 0.70
Regression using trend variables, that are the coefficients of regressions on a linear trend. Robust standard
error in parentheses. Significance levels: ∗ , ∗∗ , ∗∗∗ indicate significance at 0.10, 0.05 and 0.01. Controls: robot
stock in manufacturing, robot stock in non-manufacturing, value added, wage. Estimates are weighted by sec-
toral employment in 2005. Source: IFR and WIOD.
aspect when thinking about future paths of labour market development.
IAB-Discussion Paper 7|2020 255 Further effects via off- and re-shoring In this section we answer the following question: to what extent the internationalization of production has been influenced by the usage of robots? In particular, the significant differ- ence in the impact of robots on employment growth between advanced and emerging coun- tries begs the question whether the latter group suffers from automation because of their integration in global supply chains. The following analysis, therefore, aims at quantifying the effects of automation on employment conditioned on trade dynamics. Indeed, there is a flourishing discussion dealing with potential shocks of off-shoring and re- shoring on employment caused by the spread of automation both in developed and devel- oping economies. UNCTAD (2016) argues that the historical labour cost advantage of low- income countries might be eroded by robots if they become cheap and easily substitutable for labour. According to this scenario, the most affected industry should be manufacturing. This adverse effect might be strengthened by the growing labour quality in developing coun- tries and the ensuing rise in labour costs. The Boston Consulting Group, for instance, reports that wages in China and Mexico increased by 500 per cent and 67 per cent between 2004 and 2014, respectively (Sirkin/Zinser/Rose, 2014). These and other issues might have pushed some companies, like General Electric and Plantronics, to shore the production back home (see, respectively, Crooks, 2012; Cattan/Martin, 2012). This convergence in cost competitiveness is likely to continue in the future, eroding the in- centives for producers to move their activities from developed to developing countries. The results of a study of Gott/Sethi (2017) demonstrate that countries that have previously ben- efited from off-shoring will witness overall more job loss due to automation than onshore countries. Nevertheless, it is claimed that off-shoring will keep on going at the same time. China remains the country receiving most of the investment flows. Even though labour cost has increased, indeed, developing countries experience also a rise of local markets with new needs and new demands. For instance, the Chinese middle class could potentially be bigger than the entire US population by 2020 (Atsmon/Magni, 2012). In the empirical analysis we want to answer these questions: do robots reduce off-shoring in developed countries? If yes, does this harm employment in emerging countries? Regarding the first question, we compute the off-shoring index with respect to emerging countries as it is computed in the literature (e.g. De Backer et al., 2018), by using the share of imported non-energy inputs from emerging countries in total non-energy inputs. We conduct a similar analysis as for employment in subsection 4.1 except for the wage variable, for which we use a wage difference of developed country i with the wage of emerging countries weighted for IAB-Discussion Paper 7|2020 26
the relative amount of imports with country i. Regarding the second question, for each sec-
tor of each emerging country we generate a variable that measures the stock of robots in the
relative sector in developed countries, weighted by the flow of exports towards each sector
in each developed country. This helps us assess the impact "abroad" of robots in developed
countries taking into account the trade activity (in this way we control for those countries
that installed many robots but have a low activity of import-export with emerging countries,
and therefore are less pivotal for an employment effect there). We call this measure trade-
weighted robots and we use it to explain employment in emerging countries (controlling for
the domestic stock of robots). As for the first exercise, we use a wage difference of each emerg-
ing country with the set of developed countries, weighted by the trade activity.

Figure 7 displays the evolution of the off-shoring index for the countries with a number of
robots in the top 25th percent in 2014. The amount of inputs imported from emerging coun-
tries passes from an average of 0.8 per cent to 1.4 per cent between 2000 and 2014. However,
after years of persistent increase, since 2011 the trend falls back to a downward trajectory. As
it visible from the graph, not all the countries experience this reversion alike. France, Spain
and the US show rather a flattening of the off-shoring activity. However, except Japan, all
countries in the sample witness a slowdown in the index. This reflects the phenomenon of re-
shoring and is consistent with previous evidence in the literature (see for instance De Backer
et al., 2016: for the media coverage of the re-shoring phenomenon).
                                                                                                         [H]
Figure 7: Off-shoring index (relative to emerging countries) for countries with the highest share of
robots in 2014.

The figure shows the degree of off-shoring for developed countries in the top 25th percentile of robot usage,
between 2000 and 2014. Source: IFR and WIOD.

Table 7 display the results for the first analysis. The OLS approach delivers weakly significant
positive results for the effect of robots on offshoring, while we don’t get any further evidence

IAB-Discussion Paper 7|2020                                                                               27
from the interaction. As above, with the IV approach, we get more negative results. The im-
pact is -0.073 significant at 5 per cent level. The coefficient is slightly larger than the one found
by De Backer et al. (2018), the difference likely arises from the off-shoring index computed, in
our paper, using only emerging countries 1 . As regards the interaction term, there seems to
be no significant difference between labour- and capital-intensive sectors. Considering the
increase of robots in developed countries between 2005 and 2014 leads to an impact on off-
shoring of almost -1.3 per cent. Such a negative effect is in line with previous evidence and
with the hypothesis that the use of robots may induce certain industries to reduce the amount
of inputs produced abroad. The next step, then, is to check whether the lower share of im-
ports caused by the spread of robots in developed countries has had any consequence on
the level of employment in emerging economies. For this, we use the trade-weighted robots
measure.
Table 8 displays the results for the second analysis. The OLS estimation provides weak evi-
dence of an effect of robots in developed countries on employment in emerging countries,
with more insights from the interaction with labour intensity. Indeed, robots in developed
countries seem to have a negative impact on employment in capital intensive sectors of emerg-
ing countries, while in labour intensive sectors the impact is slightly positive. Using an IV
approach for tackling the problems of endogeneity, we get a larger negative effect. The co-
efficient for our trade-weighted robots is -0.459, significant at 1 per cent level. A change of
trade-weighted robots in line with the change between 2005 and 2014, namely, 12 per cent is
connected to a fall of employment of 5.5 per cent.
Table 7 and 8 established negative effects of robotization in developed countries on off-shoring
in developed and on employment in emerging countries. We connect the two in a plausibility
check, as re-shoring is likely to operate as a channel for the employment losses. We would
expect that the drop in exports of the emerging countries resulting from Table 5 and the drop
in the wage bill of the emerging countries resulting from Table 6 are of similar magnitude.
The first effect may be a bit larger because, due to a labour share of about 50 per cent, part of
the drop in exports would affect profits and not the wage bill. Since the off-shoring index is
defined as the share of imported non-energy inputs in total non-energy inputs, we apply the
IV effect of -0.073 percent from Table 5 to the value of non-energy inputs in developed coun-
tries imported from emerging countries, averaged over 2005-2014. This delivers 6.4 bn USD.
Regarding the employment effect, we apply the IV estimate of -0.459 percent from Table 6 to
the wage bill from the emerging economies averaged over 2005-2014. This delivers 4.8 bn
USD. In view of the a-priori expectations explained above, we conclude that both estimates
stand in a sensible relation.
1
When we run the IV regression in Table 7 using off-shoring with imports from all the countries we get a coef-
ficient of robots stock of -0.061, very close to their result.
IAB-Discussion Paper 7|2020 28You can also read