Lost in transition? The changing labour market and young people not in employment, education or training - May 2012 - Paul Sissons and Katy Jones
←
→
Page content transcription
If your browser does not render page correctly, please read the page content below
May 2012

Lost in transition?
The changing labour market and young people
not in employment, education or training

Paul Sissons and Katy Jones

The Work Foundation aims to be the leading independent, international authority on
work and its future, influencing policy and practice for the benefit of society through
rigorous research programmes targeting organisations, cities, regions and economies
in the UK and beyond. Organisations from across all industry sectors can sign up as
partners to gain access and active involvement in research, thinking and practice. For
further details, please visit www.theworkfoundation.com.
Executive summary

     The large numbers of young people who are NEET – not in employment, education
     or training – is one of the most serious social problems facing the country. Almost a
     million young people in England are NEET, more than one in every seven 16-24 year olds.
     While this in part reflects the impact of the recession, the number of NEETs was rising
     before this; the recession simply exacerbated the problem. The growing number of
     NEETs is a source of major concern and it represents a large economic and social cost.

     More young people are struggling to make the initial transition from education into
     sustained work. On leaving education, some 48 per cent of NEETs have no experience of
     paid work; this figure has increased from 41 per cent in 2001.1 2This lack of substantive
     work experience represents a significant barrier to work and highlights the real need
     for sustained support for young people in taking the initial (and hardest) step into
     employment.

     In order to address the NEET problem there is a need to better understand both the
     nature of the NEET cohort and their support needs. In this paper we highlight a number
     of key findings relating to this:

     The NEET cohort is a diverse group. Young people are NEET for a number of reasons,
     some are unemployed and looking for work, others have caring responsibilities, while
     others have long-term disabilities or health conditions. Durations spent NEET also vary
     significantly. We find that:

          •    Around half of NEETs are unemployed and actively looking for work. An
               additional 18 per cent are inactive and either looking for work, or in the majority
               of cases, are not looking but would like to work. This leaves a third of the NEET
               cohort who are unable or unavailable to work in either the immediate or the
               longer-term for a variety of reasons – including caring responsibilities and long-
               term sickness or disability.

          •    Some young people leave NEET very quickly, others remain NEET long-term;
               with just over half of all NEETs remaining outside employment, education or
               training for more than 12 months.

     NEETs face a number of barriers to work. In addition to the lack of work experience,
     there are a number of other barriers to work faced by significant numbers of NEETs.
     These include health problems and poor qualifications; before the recession around a
     quarter of NEETs had no qualifications.

     1 This figure excludes causal work and holiday work

3    Lost in transition?
Young people become NEET at different points. Some leave school with no
    qualifications and fail to find a foothold in the labour market, others go on to further
    education and/or training but fail to make the transition into work at this point. This
    makes it important that young people are supported at different ages and stages until
    they make the successful transition into work.

    Skills needs have changed in a way that makes it harder for some young people to
    access the labour market. Changes in the labour market in the past three decades
    have had significant impacts on the types of skills and capabilities which young people
    need to access employment. In particular far fewer young people now work in the
    manufacturing sector and more work in service sector employment. An important
    outcome of this shift is a change in the nature of skills that young people need. In
    particular, soft skills are increasingly important for young people to access and maintain
    employment, with customer facing skills often required for work in sectors which
    employ large numbers of young people such as retail, leisure and hospitality. There
    is also greater pressure for young people to be job-ready and able to perform from
    day one. For those young people with less developed soft skills, accessing the labour
    market is likely to have become more difficult as a result of these changes. Another
    important implication of these changes is that the youth labour market is increasingly
    less gendered, and young men and women increasingly compete for the same types of
    jobs. It is important that education and skills provision, as well as careers advice and
    guidance, reflects the changing nature of the labour market.

    NEET policy and provision must reflect the diversity of NEET young people, the reasons
    they are NEET and their potential routes back into employment, education or training.
    There are a number of areas that NEET policy must focus on:

         •    In the immediate term support is needed to help those who are already NEET.
              This includes working to provide clear and available pathways into employment;
              ensuring young people have suitable skills and work experience; and ensuring
              provision is flexible enough to meet the needs of the diverse NEET cohort.

         •    In the longer-term there is a need for more focus on NEET prevention. Support
              during precarious ‘transition’ periods is key:

              •    Support to access their first sustainable job is a core support need of young
                   people. The system must be geared up so that education and training
                   providers prioritise this outcome.

4   Lost in transition?
• There is scope to better coordinate local services to support young people.
There is also a need for schools, businesses and government to work much
more closely together to prepare young people for the labour market.
• The education system is critically important, and more young people leaving
with better qualifications can help to facilitate more successful transitions
into work.
• There is considerable scope for improving the routes into and progression
routes within some of the growing service sector occupations which tend to
employ young people. While growing apprenticeships should support this
aim, more needs to be done to ensure these offer sustainable and productive
careers with opportunities for progression.
This research is supported by the Private Equity Foundation. The Private Equity
Foundation (PEF) is committed to unlocking the potential of young people with limited
life chances. The charity is focused on the one million 16 to 24 year olds currently not
in education, employment or training (NEET).
There’s no silver bullet so PEF supports children and young people from age four
to 24, at home, through school and into the workplace. It provides the very best
youth interventions with funding and pro bono business expertise from the private
equity community to help them become more effective and to grow. Where the
right breakthrough programmes don’t exist, PEF has drawn on its research and
international experience to introduce its own.
PEF has created a ten point action plan to frame the work it does to enable greater
change on the ground. This includes a strong focus on prevention, case management
and fostering better links to employment (see Appendix A).
Since its creation in 2006, PEF has secured the backing of over 70 private equity firms
and their advisers, including banks, law firms, accountancy firms, consultants and
search firms and has organised over 32,000 hours of voluntary help, which in turn has
changed 60,000 young lives.
To find out more visit www.privateequityfoundation.org
5 Lost in transition?Contents
Executive summary 3
1 Introduction 8
2 The growing NEET problem 13
3 NEETs and the changing labour market 19
4 The diverse NEET cohort 25
5 Policy for NEETs 34
6 Conclusions and policy recommendations 39
Annex A Private Equity Foundation ‘manifesto for action’ 44
6 Lost in transition?List of boxes, figures and tables
Box 1 NEET vs Youth Unemployment 10
Box 2 Long-term NEETs 17
Box 3 Wolf Review 36
Box 4 Youth contract 37
Figure 1 Change in the number of NEETs, 2000-2011 14
Figure 2 Change in the NEET rate, 2000-2011 14
Figure 3 Outflows from NEET into employment, 2006-2010 15
Figure 4 Outflows from NEET into education, 2006-2010 16
Figure 5 The geography of NEETs in the UK’s cities, 2009-2010 18
Figure 6 Working Futures projections for employment change by
occupation (thousands), 2010-2020 23
Figure 7 16-24s who are not in employment or full-time education by
whether they have had a paid job or not, 1993-2012 32
Table 1 Employment of 16-24 year olds by industry, % 20
Table 2 Occupations of employed 16-24 year olds, % 21
Table 3 NEETs by age group 25
Table 4 NEETs by age group 2011, % 25
Table 5 NEETs by economic activity % 27
Table 6 NEETs and EETs by disability, % 27
Table 7 NEETs who report a health condition by main health problem, % 28
Table 8 NEETs by highest qualification, % 29
Table 9 NEETs by whether seeking work, % 30
Table 10 NEETs by period since leaving last job, % 31
Table 11 NEETs by reason for leaving last job, % 32
7 Lost in transition?1 Introduction
In the third quarter of 2011, the number of young people who were outside employment,
education or training (NEET) in England reached over a million (1,163,000). 2 Many
commentators saw this as a result of the 2008/2009 recession, in which young people
had been disproportionately impacted. However while the recession has undoubtedly
worsened the situation for young people, the number of young people who were NEET
had started rising some years before this.
Young people who are NEET clearly face a number of major short-term challenges. They
have a difficult labour market to navigate, with high unemployment amongst the wider
population alongside reduced opportunities for young people. Public sector cuts have
begun to impact on youth services and the financial incentives to remain in education
have also been reduced and restructured. 3
Yet NEETs are not a single, homogenous group – but a diverse group of young people
with different experiences and characteristics. The term NEET is a broad one, some
have argued so broad that its use is problematic. 4 It includes young people who are
actively unemployed and searching for work, but also those who are economically
inactive for a number of reasons, including long-term sickness or having caring
responsibilities. They are a diverse group of young people facing a number of different
issues which may require somewhat different policy responses.
The durations which young people stay NEET also vary considerably. Many young people
are NEET for only a relatively short period of time. Yet others will face long-term labour
market difficulties, as a period NEET at an early age can result in reductions in wages
and higher chances of unemployment in their later life.
Changes in the structure of the economy and shifting patterns of education and the
skills required to enter the workplace have changed the pathways required to make the
transition from school into the labour market. Most young people still manage the move
from school to work successfully, but a significant and growing group of young people
are getting ‘lost in transition’.
This report considers how the changing economy and the changing characteristics of
young people in the labour market have influenced those who are lost in transition. It
asks the following questions:
2 Quarterly Labour Force Survey; Statistical Release: NEET Statistics – Quarterly Brief (February 2012) Department
for Education
3 ACEVO (2012). Youth unemployment: the crisis we cannot afford. London, ACEVO
4 Yates, S. and Payne, M. (2006) ‘Not so NEET? A critique of the use of ‘NEET’ in setting targets for interventions
with young people,’ Journal of Youth Studies, 9:3, pp.329-344
8 Lost in transition?1. How has the changing labour market affected the school to work transition and
young people who are NEET?
2. How have the characteristics of young people who are NEET changed over time?
3. What are the policy implications of these changes?
We also review good practice in addressing the NEET issue and suggest which policy
interventions are most likely to be effective.
In our analysis, we use the Labour Force Survey (LFS) to describe the characteristics
of today’s NEET group along with how these have changed over the past decade. For
the analysis of characteristics we present yearly averages. The NEET numbers are
calculated using the Department for Education NEET syntax. The definitions are directly
comparable for the three time points of interest – 2001, 2007 and 2011. These years were
chosen to represent the time before the large growth in the number of NEETs (2001), the
time after the NEET growth which occurred while the economy was growing (2007) and
the period after the recession (2011). We also provide some evidence on NEET flows and
on NEET durations. These data are calculated using the longitudinal LFS. The flows data
draws on the two-quarter datasets; the durations analysis on the five-quarter datasets.
Throughout the report cell numbers are rounded meaning that columns may not sum
to one hundred. Due to the devolved nature of much of the policy which can impact on
NEETs, throughout this paper we present analysis for England only.
Some analysis of NEETs uses the 16-18 age range, however here we use the broader
definition of 16-24 year olds as this more accurately captures the transition into the
labour market at different points of time. The concept of the transition refers to young
people moving from the education and training system/s and into the world of work. This
requires getting an initial foothold in the labour market (through a first paying job) and
then being able to sustain (and build on) this. This transition is an important period in
an individual’s life and a difficult transition can impact on labour market performance
over the longer-term. Worryingly the evidence that we present here suggests that more
young people are finding this transition increasingly difficult.
9 Lost in transition?Box 1. NEET vs Youth Unemployment
NEETs and youth unemployment are related concepts, but there are important
differences between the two.
The unemployment rate is a measure of those who are out of work, but have looked
for work in the past month and are able to start in the next two weeks - as a proportion
of the economically active. This can include individuals who are in education.
The definition of NEET excludes all those people who are in employment, education or
training, but includes some of the economically inactive. The NEET rate is lower than
the youth unemployment rate because it is a proportion of the whole cohort of 16-24s,
whereas the unemployment rate uses the economically active 16-24 population (ie.,all
those either in work or unemployed) as the denominator.
There is a 520,000 overlap between the NEET and the youth unemployment populations
(in Quarter 4 2011).
The consequences of young people being NEET
There are a number of costs which are associated with growing numbers of young
people being NEET. Some of these costs are borne by young people themselves, but
there are also wider social and economic costs. For the individual, the costs include:
• Wage scarring – A period of unemployment at an early age can result in
reduced wages over a long period. Gregg and Tominey estimate that youth
unemployment can reduce an individuals’ wages by between 13 and 21 per cent
by the age of 42. 5
• Increased participation in crime 6 – Youth unemployment has been seen to
increase the risk of problematic behaviour and delinquency. Whilst representing
a considerable cost to the criminal justice system, this also impacts greatly at
an individual level as having a criminal record is a barrier to employment and
impacts negatively on subsequent labour market experiences.
5 Gregg, P. and Tominey, E. (2005) ‘The wage scar from youth unemployment’, Labour Economics, 12:4: 487-509
6 The Prince’s Trust (2007) The Cost of Exclusion: Counting the cost of youth disadvantage in the UK, The Prince’s
Trust
10 Lost in transition?• Reduced employability – Lack of labour market contact inhibits the
development of key ‘employability’ and ‘soft’ skills including self-motivation,
time management and communication skills. Employers have highlighted a
growing shortage of these skills amongst young people. 7
• Poorer well-being – Being out of work can lead to stress, lower self esteem,
and depression. 8 This in turn may increase the strain on families, communities
and the NHS. In a recent UK survey of young people a quarter of those who were
or had been unemployed said that being unemployed caused arguments with
their family; and more than one in ten said that being unemployed drove them to
drugs or alcohol. 9
• Reduced self-confidence – More than one-in-five NEETs surveyed in 2009
reported that they had lost the confidence to go to job interviews. 10
Beyond the personal costs, more young people not in employment, education or training
represents a cost to public finances (through additional benefit payments, lost tax
revenues, healthcare costs and so on). Alongside this there is a wider economic cost
in reduced economic productivity. A number of studies have attempted to estimate the
costs associated with young people who are NEET.
• It has been estimated that the average total cost to public finances of 16-18 year
olds who are currently NEET is £56,000 over the course of their lifetime. The
current estimated aggregate public finance costs of 16-18 year old NEETs range
from £12bn to £32bn. 11
• Recent research by the Prince’s Trust suggests that the November 2010 level of
NEETs amongst 20-24 year olds costs £22m per week in Jobseekers Allowance,
and between £22-133m per week in lost productivity. 12
7 Bell, D. and Blanchflower, D. (2010) Youth Unemployment: Déjà vu? Bonn: Institute for the Study of Labour;
ACEVO (2012). Youth unemployment: the crisis we cannot afford, London. AVECO
8 Audit Commission (2010) Against the odds: Re-engaging young people in education, employment or training.
London: Audit Commission
9 The Prince’s Trust (2010) YouGov Youth Index, The Prince’s Trust
10 Ibid
11 Coles, B., Godfrey, C., Keung, A., Parrott, S. and Bradshaw, J. (2010) Estimating the life-time cost of NEET: 16-18
year olds in Education, Employment or Training: Research undertaken for the Audit Commission, University of
York
12 The Prince’s Trust (2010) The Cost of Exclusion: Counting the cost of youth disadvantage in the UK, The Prince’s
Trust. The lower bound of the cost-range (£22m pa) assumes a productivity cost equal to the JSA cost; the
upper bound (£133m pa) is the average productivity of their wage group (20-25 years old)
11 Lost in transition?• The cost of youth crime (including imprisonment of children and young people) is
estimated to be £23m a week - £1.2bn per year. 13
The scale of these costs emphasises the importance and urgency of the issue. Yet the
NEET problem remains poorly understood. This report provides evidence for three key
observations around the rising numbers of NEETs. The first highlights the diversity of
the NEET cohort and their varying barriers to work. The second and third both relate
to the school to work transition – longer-term labour market change has changed the
types of skills some young people need to access work; and, more young people are
finding the initial transition to work increasingly difficult. To develop these arguments
the remainder of the report is structured as follows:
• Section 2 - provides details of the growing NEET problem, examines what
happened to NEET flows during the recession and describes the varied
durations which young people spend NEET.
• Section 3 – describes the longer-term industry and occupational changes
which have impacted young people in the labour market. In particular, growing
numbers of jobs require either high level academic skills and/or well developed
soft and customer facing skills.
• Section 4 – presents a detailed analysis of the characteristics of the NEET
cohort and how this has changed over time. The chapter highlights the diverse
nature of the group.
• Section 5 – reviews policy and good practice in addressing the issues faced by
those who are NEET.
13 The Prince’s Trust (2010) The Cost of Exclusion: Counting the cost of youth disadvantage in the UK, The Prince’s
Trust
12 Lost in transition?2 The growing NEET problem
In this section we consider the growth in the number of NEETs over time, both before
and during the recession. We then go on to describe the rather fluid nature of the NEET
group, with around a quarter of young people leaving NEET from one quarter to the next.
We also show that for a large number of young people (around 55 per cent) being NEET
becomes a long-term situation. Finally, we detail the geography of NEETs and show that
the problem is most concentrated in many former industrial cities which have tended
to perform comparatively poorly for a long time now across a range of economic and
labour market indicators.
Increasing numbers of young people are NEET
The scale of the NEET problem has been growing over the last decade. While there was
a clear spike in the number of NEETs as a result of the recession, this is a longer-term
problem. The number of NEETs rose significantly during the 2000s before the impact of
recession was felt. Figure 1 provides information on the total number of NEETs covering
the period 2000-2011. The diamond shaped data points are the quarterly estimates
which are derived from the Labour Force Survey. As NEET estimates fluctuate so much
quarter-on-quarter because of academic cycles (they peak in quarter 3), a moving 4
quarter average is also shown (the smooth line on the graph).
The graph shows two distinct periods when the number of NEETs was growing. Between
2004 and 2006/7 there was a substantial growth in the number of NEETs (of around
150,000). During this period youth unemployment also grew. 14 There is then a second
period of sharp growth which is related to the impact of the recession from 2008
onwards. We can also see that NEET numbers appeared to have stabilised and even
slightly declined in 2010 before rising again in 2011 (though it is too early to suggest that
this is a trend). Over the 11 year period the average has increased by around 300,000.
The absolute figures can be influenced by change in the size of the cohort so the NEET
rates (as a proportion of all 16-24 year olds) are provided in Figure 2. Again the pattern
is the same with two distinct periods of growth – one which is linked to the impact of
recession, and one in the mid 2000s which is not. Over the whole decade the NEET rate
average has grown from around 13 per cent to more than 16 per cent, meaning that more
than one in every seven young people are now NEET.
14 See Goujard,A. Petrongolo, B. and Van Reenan, J. (2011) ‘The Labour Market for Young People’ in Gregg, P and
Wadsworth, J The Labour Market in Winter: the state of working Britain
13 Lost in transition?Figure 1. Change in the number of NEETs, 2000-2011
1200
1100
1000
900
NEETs 16-24 (thousands)
800
700
NEETs
4 per. Mov. Avg. (NEETs)
600
500
400
Source: Labour Force Survey: Department for Education.
Figure 2. Change in the NEET rate, 2000-2011
20
18
16
NEETs 16-24, %
14
12
NEETs, %
4 per. Mov. Avg. (NEETs, %)
10
8
6
Source: Labour Force Survey: Department for Education.
14 Lost in transition?NEETs in the recession
We have already seen that the number of NEETs rose significantly during the recession.
This was the result of both reduced outflows from NEET and increased inflows. Figure
3 shows the proportion of NEETs who enter employment each quarter. As can be seen
the recession saw a drop in the proportion of NEETs leaving to enter employment from
around 13 per cent to around 10 per cent, that equates to roughly 30,000 fewer young
people leaving NEET for employment each quarter. This highlights the increased
difficulty which young people faced in accessing employment during the recession and
into the early recovery.
On the other hand outflows into education among NEETs did increase during the
recession (though not by as much), rising from an average of around 11 per cent up to
12 per cent (Figure 4). 15 These flows into education do though appear to have declined
since.
Figure 3. Outflows from NEET into employment, 2006-2010
20
18
16
Proportion of NEETs moving into employment
14
12
10 % of NEETsofmoving
Proportion NEETsinto employment
moving into employment
4 per. Mov. Avg. (Proportion of NEETs moving
8 into employment)
6
4
2
0
Source: Labour Force Survey, two-quarter longitudinal datasets
15 Other studies have argued that young people ‘substituted’ into full-time education in response to the difficult
labour market conditions during the recession. See ACEVO (2012) Youth unemployment: the crisis we cannot
afford. London, ACEVO
15 Lost in transition?Figure 4. Outflows from NEET into education, 2006-2010
22
20
18
% of NEETs moving itno education
16
14
% of NEETs leaving for education
12
4 per. Mov. Avg. (% of NEETs leaving for
education)
10
8
6
4
Source: Labour Force Survey, two-quarter longitudinal datasets
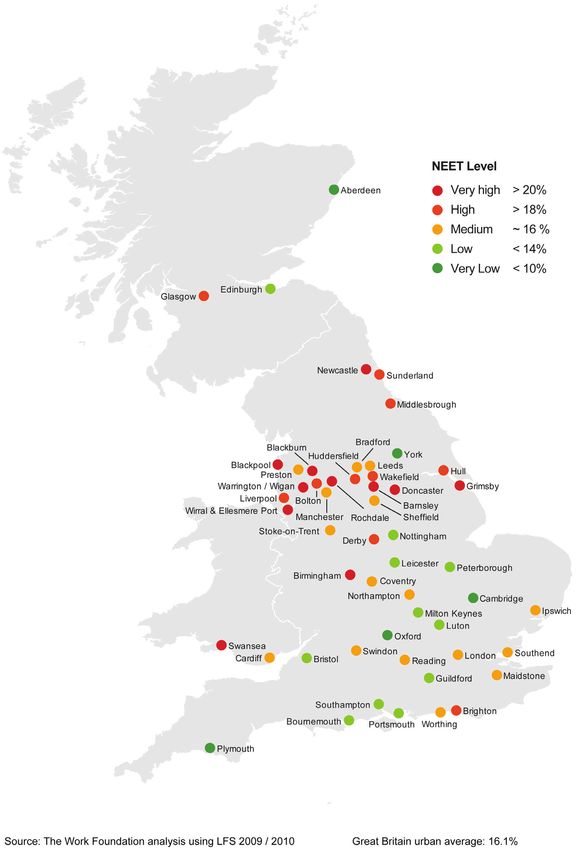
The Geography of NEETs
The NEET group is not evenly spread. High NEET rates tend to be concentrated in
particular types of areas. The proportion of NEETs is particularly high in towns and
cities, primarily in the north, that have struggled to revive themselves from the damage
caused by deindustrialisation, as well as in some inner London Boroughs. Figure 5
provides data for the proportion of NEETs in UK cities. 16 The high NEET rates tend to
be concentred in the industrial cities of the North West, Yorkshire and Humberside and
the North East. Generally the areas with high NEET rates are those which have weaker
labour markets and which also perform comparatively poorly on other measures of
labour market disadvantage. The map should not be taken to imply there is not an issue
with NEETs in some of the lower NEET areas; even in our low NEET cities the figures are
still greater than one in ten. Rather, it should illustrate the scale of challenge faced by
some cities.
16 For details on the methodology see Lee, N. and Wright, J (2011) Off the map? The geography of NEETs, London,
The Work Foundation
16 Lost in transition?Box 2. Long-term NEETs
The time durations which young people spend NEET vary widely. Some young people
spend very short periods of time NEET while they find the right job or course, for
others being NEET is a much longer-term situation. There is therefore a considerable
degree of turnover among the NEET group (people moving from EET into NEET and
vice versa). On average around one-in-four NEETs enter employment, education
or training from one calendar quarter to the next. 17 A sizeable proportion of NEET
however remain outside employment, education and training for an extended period.
More than half of all NEETs (around 55 per cent) remain outside employment,
education or training for a year or longer. 18
This section has provided detail on the growth in the number of NEETs, the durations
which young people spend NEET and the geographical distribution of the problem. In the
following section we begin to address the impact of longer-term change in the labour
market.
17 Figures are calculated from the two-quarter Labour Force Survey longitudinal datasets. They
represent those flowing from NEET into employment, education or training between two quarters
as a proportion of the NEET cohort. The figure is an average of quarter on quarter flows between
Q4 2007 and Q4 2010
18 Figures are calculated from five-quarter Labour Force Survey longitudinal datasets. They are
the average of eight datasets covering flows between Quarter 2 2008 and Quarter 1 2011. The
recession has relatively little impact on the proportion of long-term NEETs
17 Lost in transition?Figure 5. The geography of NEETs in the UK’s cities, 2009-2010 18 Lost in transition?
3    NEETs and the changing labour market

       As we set out in Section 2, there have been long-term changes in the number of young
       people who are NEET. In this section we investigate how long-term labour market
       changes are affecting young people moving into employment by asking:

            •    Have the industries and occupations in which 16-24 year olds are employed
                 changed?

            •    How have these changes altered the transition from school to work?

            •    Are these changes likely to continue in future?

       Changes in the nature of employment

       Over the last three decades the labour market has changed considerably. Globalisation,
       technological change and an increasingly highly educated population have changed
       the nature of production. Routine mass-production has become less important, and
       manufacturing has declined as a proportion of employment and increasingly focuses on
       high-value added, specialised production.

       Services have become increasingly important. Driving this has been the rise in
       employment in ‘knowledge-based’ services – a diverse group of sectors ranging from
       business services to parts of the public sector. At the start of the 1970s, less than a third
       of employment was in knowledge-intensive services; now the figure is closer to half. The
       type of jobs available have reflected these trends. New jobs have been created in large
       numbers in high-skill, high-wage professional and managerial occupations.

       Yet not all employment growth has been in high-skill, knowledge intensive occupations.
       The last two decades have also seen growth in lower wage service occupations,
       combined with a reduction in middle-wage occupations, leading to concerns of
       employment polarisation, a gradual ‘hollowing out’ of the labour market. 19

       The type of sector in which young people work has been changing. Table 1 looks at
       changes in the industries that young people work in between 1981 and 2011. 20 There has
       been a sharp decline in the importance of manufacturing for young people in the last
       three decades, declining from almost a quarter of total employment to just 8 per cent.
       The data also show the considerable importance of employment in distribution, hotels
       and restaurants for young people, with almost 40 per cent employed in these industries

       19 For example see Goos, M. and Manning, A. (2003) Lousy and lovely jobs: the rising polarization of work in
           Britain CEP Working Paper; Goos, M., Manning, A. and Salomons, A (2010) Explaining job polarization in Europe:
           The roles of technology, globalization and institutions CEP Discussion Paper No. 1026
       20 The data are not directly comparable because of changes to the Standard Industrial Classification over time;
           however they do show the broad industrial shifts away from production and towards services

19     Lost in transition?
(up from 24 per cent in 1981). Others services now employ 27 per cent of young people
(including 18 per cent working in the public sector). An important implication of these
shifts is that youth labour markets are increasingly less segmented on the basis of
gender, and young and men and women are increasingly competing for the same types
of work.
Table 1. Employment of 16-24 year olds by industry, %
Employment by Industry 1981 2011
Agriculture, Forestry and Fishing 2 1
Energy and Water 7 1
Manufacturing 24 8
Construction 7 7
Distribution, Hotels and Restaurants 24 39
Transport and Communication 5 5
Banking and Finance 11 13
Other Services 19 27
Source: Labour Force Survey. Because of changes in the classification columns are not directly comparable. 1981
data are Standard Industrial Classification (SIC) revision 1980; 2011 data are SIC 2007
Alongside changes in the sectors in which young people work, so the occupations
performed by young people have altered over time. Table 2 gives the most common
occupations for 16 – 24 year olds in 2011. The table shows the importance of sales and
customer service employment for young people, employing more than one in every five
young people who are working. There are also large numbers working in elementary
occupations, those requiring the fewest qualifications as well as a significant number
employed in caring, leisure and other service occupations.
20 Lost in transition?Table 2. Occupations of employed 16-24 year olds, %
Main occupation: 16-24 year olds 2011
Managers, Directors And Senior Officials 3
Professional Occupations 7
Associate Professional And Technical Occupations 10
Administrative And Secretarial Occupations 10
Skilled Trades Occupations 11
Caring, Leisure And Other Service Occupations 12
Sales And Customer Service Occupations 22
Process, Plant And Machine Operatives 4
Elementary Occupations 22
Source: Labour Force Survey.
The changes in the labour market in types of sectors in which young people work have
a number of important implications for the NEET group. In particular soft skills are now
increasingly important to gain access to employment. For those young people with less
developed soft skills, accessing the labour market is likely to have become more difficult
as a result of these shifts.
Common occupations amongst 16-24 year olds such as sales and other service
occupations often prize soft skills such as communication, time management and self-
motivation, and demand for these skills has been increasing over time. Service sector
jobs, for example, have increasingly required higher levels of soft skills both in low level
‘shop floor’ occupations as well as higher managerial positions. 21 However, numerous
business surveys have consistently highlighted gaps in softer ‘employability’ skills, in
particular amongst young people. 22 In a recent survey of 150 employers, 71 per cent
cited good “social skills” as being and an important skillset they look for. 23 In a national
survey of employers by the UK Commission for Employment and Skills, shortages in
customer-handling skills (41 per cent), problem solving skills (38 per cent) and team
working skills (37 per cent) were reported to be the key factors hindering recruitment. 24
These skills shortages have been recognised by the Government’s Skills for Sustainable
Growth strategy as real barriers to labour market entry and sustainability, impacting
disproportionately on young people due to their lack of experience in the workplace. 25
21 Birdwell, Grist and Margo (2011) The forgotten half, London, DEMOS
22 For example see, CBI (2007) Time well spent: embedding employability in work experience, CBI.
23 Working Links (2011) Learning a living: a research report into Apprenticeships and reducing youth unemployment
24 UKCES (2010) National Employer Skills Survey for England 2009: Key Findings Report
25 BIS (2010) Skills for Sustainable Growth
21 Lost in transition?While there are concerns about young people having the right skills employers need,
there is also a concern about the extent to which young people are able to use and build
on the skills that they have in some of the jobs which have been growing in number. 26
More broadly, there is a real need in many service sector jobs to build effective career
ladders within work to show young people that they offer a career and chances for
progression rather than being ‘just a job’.
Changes in the labour market have also meant that qualifications are now an even
more important determinant of employment experiences for young people. Graduates
continue to earn a significant wage premium from their qualifications. 27 For those with
few or no qualifications the labour market is more difficult to navigate. Those with no
qualifications are less likely to be in work, and when they are in work they are less likely
to experience progression. 28
The recovery will see a continuation of these trends
How will the recovery impact on these long-term changes in the labour market? Clearly,
any projections of employment forecast in the future are subject to measurement error.
However, detailed forecasts of economic change and the labour market do exist. In the
following, we draw on data from Working Futures - a set of economic and employment
projections for the period 2010 – 2020 produced for the UK Commission for Employment
and Skills.
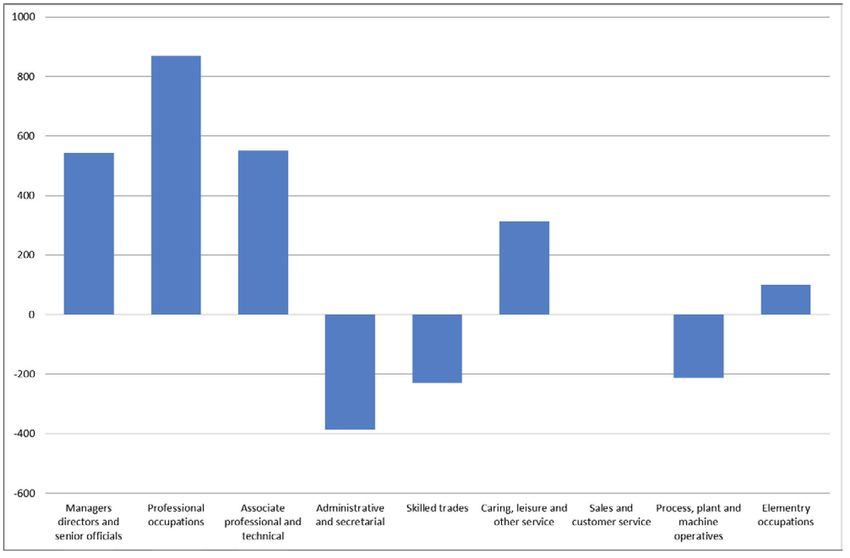
The projections suggest that employment growth will continue to be concentrated
in higher skill occupations. The Working Futures data suggest a continuation of
existing trends in net employment, with evidence of a polarising labour market with
strong employment growth at the top, some employment growth at the bottom, and
a contraction in the middle. Figure 6 provides the data on projected net change in the
number of people employed by occupation. The strongest growth is projected to be in
professional jobs, these are jobs that require people that are highly skilled and tend
to require qualifications of at least a degree or equivalent. These jobs tend to employ
a relatively small proportion of young people, and those that are employed tend to be
those who are qualified to graduate level.
26 Wright and Sissons (2012) The Skills Dilemma: Skills Under-Utilisation and Low-Wage Work, London, The Work
Foundation
27 Hansson, B. (2007) Effects of Tertiary Expansion: Crowding-out effects and labour market matches for the
higher educated, OECD Education Working Papers, No. 10, OECD Publishing; Machin, S and McNally, S. (2007)
Tertiary education systems and labour markets Paris, OECD
28 Sissons, P. (2011) The hourglass and the escalator: labour market change and mobility. London, The Work
Foundation
22 Lost in transition?There is also projected to be relatively strong growth in managerial posts as well as
in associate professional and technical posts; these posts tend to require high level
vocational qualifications and employ around 10 per cent of young people who are in
work. Caring, leisure and other service occupations, which employ around 12 per cent
of employed young people, are projected to see fairly strong growth and this should
open up opportunities for young people. There will also be some growth in elementary
occupations, those which tend to require the fewest skills, and on-going loss of jobs in
skilled trades, process, plant and machine operatives and administrative and secretarial
jobs.
Figure 6. Working Futures projections for employment change by occupation
(thousands), 2010-2020
Source: Working Futures, 2010-2020
It should be noted that these trends are net jobs growth. However there will also be
large numbers of opportunities opened-up to young people through replacement
demand. Replacement demand is the job vacancies that arise from the sum of workforce
losses due to retirements and mortality, net occupational mobility and geographical
mobility. There will be considerable demand from all occupations through replacement
demand in the next decade.
23 Lost in transition?While the aggregate trends described are important for the overall youth labour market
the most important thing locally is that services aimed at supporting NEETs into work
are responsive to the demands in their local labour markets, and help to provide young
people with the skills (including soft skills and vocational skills) which will enable them
to access the types of work which are available (or which supports them to access job
opportunities elsewhere).
24 Lost in transition?4 The diverse NEET cohort
The NEET group includes all those who are not in education, employment or training
and who fall between the ages of 16 to 24. However, this label has often been criticised
for being too broad as it fails to take account of significant variations within this group.
In this section we provide an in-depth analysis of the characteristics of the NEET group,
and consider how these have changed over the past decade as well as during the recent
recession.
Demographics
NEETs are aged between 16 and 24 but the majority are aged 20 or older. This reflects
the greater likelihood that those in the younger age group (16-19) are in education. In
part this is because of and reflects the efforts of policymakers and education providers
over the past few decades to keep young people in some form of education after the
current compulsory participation age of 16. As can be seen in Table 4, NEET proportions
tend to increase from 16-20 before being broadly stable.
Table 3. NEETs by age group
Age Group 2001 2007 2011
16-19 35 36 29
20-24 65 64 70
Source: Labour Force Survey
Table 4. NEETs by age group 2011, %
Age (years) Per cent of total
16 6
17 4
18 8
19 11
20 14
21 13
22 14
23 15
24 15
Source: Labour Force Survey
25 Lost in transition?The NEET group is becoming increasingly balanced between the sexes. Differences in
the proportion of males and females who were NEET have declined since 2001 when the
proportion of NEET who were women was above that of NEET men (60 per cent and 40
per cent respectively). This gap narrowed to 6 per cent in 2011. In part this is explained
by a more marked rise in male youth unemployment since 2004. Nevertheless the
persistence of the gender gap (albeit significantly reduced) indicates continued barriers
to employment, education or training for young women – these are primarily associated
with the greater likelihood of young women to be carers. 29
Economic Activity
The term NEET conceals significant variation in the economic position of young people
who are not in employment, education or training. This is important because policy
which targets NEETs needs to reflect the differing distance from the labour market
and barriers to work which are associated with this. The support needs of those who
are inactive because of caring responsibilities, or because of long-term sickness or
disability, are clearly quite different from those of a new graduate who has only been
looking for work for a short period of time.
In 2011 we can see that more than half of the NEET cohort were unemployed and looking
for work 30 (Table 5). While this represents the largest category of the cohort it also
highlights the fact that youth unemployment and NEETs are not inter-changeable terms.
The proportion of NEETs who are unemployed has grown over the last decade, from 41
per cent in 2001.
The next largest category of NEETs is those who are inactive because they are looking
after family or home. This category represented 20 per cent of NEETs in 2011, around
a quarter of whom were not actively seeking work but would like employment. Within
this group are likely to be a diversity of experiences including those who have been
in employment and are taking a career break to raise children, as well as those with
caring responsibilities for other family members. The vast majority of this group are
young women. A smaller proportion (around 6 per cent) are NEET because of long-term
sickness or disability.
29 ACEVO (2012). Youth unemployment: the crisis we cannot afford. London, ACEVO
30 The unemployment figure is based on the standard International Labor Organization (ILO) definition of
unemployment
26 Lost in transition?Table 5. NEETs by economic activity, %
Economic Activity 2001 2007 2011
ILO unemployed 41 44 51
Inactive looking after family/home 33 26 20
Inactive long-term sick/disabled 6 8 6
Inactive short-term sick disabled 3 2 6
Other inactive* 15 20 18
Source: Labour Force Survey. *Other inactive includes discouraged workers, and those who did not give a reason
Health
As would be expected, rates of reporting a disability are higher among the NEET cohort.
Some 20 per cent of NEETs report a Disability Discrimination Act (DDA) and/or a work-
limiting disability, compared to 9 per cent of young people who are in employment,
education or training (Table 6). The overall disability rate among NEETs has been
essentially unchanged since 2001.
There is evidence of increasing incidence of mental health problems among NEETs.
As can be seen from Table 7, the proportion of those reporting a health problem who
cited depression/bad nerves almost doubled across the period examined, rising from
8 per cent in 2001 to 15 per cent in 2011. The proportion of those with a health problem
reporting other mental illnesses, phobias or panics also rose during this period (from 6
per cent to 10 per cent). The growth in the size of the NEET cohort over this time means a
large growth in the absolute number of NEETs reporting mental health problems.
Table 6. NEETs and EETs by disability, %
NEETs by Disability 2001 2007 2011
NEET EET NEET EET NEET EET
DDA disabled and work-limiting disabled 14 3 13 3 13 4
DDA disabled 3 2 2 2 3 3
Work-limiting disabled only 5 3 4 2 4 2
Not disabled 79 92 81 92 81 91
Source: Labour Force Survey
27 Lost in transition?Table 7. NEETs who report a health condition by main health problem, %
Main health problem 2001 2007 2011
Back or neck 10 5 6
Chest, breathing problems 26 18 15
Depression, bad nerves 8 10 15
Learning difficulties 6 14 13
Mental illness, phobia, panics 6 10 10
Other problems, disabilities 11 10 11
Total 67 67 70
Source: Labour Force Survey
Education and qualification levels
Education and qualification levels have a strong influence on a young person’s ability
to gain and maintain employment. Table 8 provides details of the highest level of
qualifications held by NEETs.
The proportion of NEETs with higher qualification levels tends to be relatively small,
though not insignificant. In 2007, before the impact of recession, around 7 per cent
of NEETs had graduate level qualifications (or equivalent), and a further 13 per cent
had A-levels or equivalent. The recession has though impacted on those with higher
qualifications and, in 2011 more than a quarter of NEETs had qualifications at A-level or
above. The majority of NEETs however continue to have lower level qualifications than
this. Before the recession around a third had some GCSEs at grade A-C (or equivalent),
18 per cent had ‘other qualifications’ 31, and more than a quarter (26 per cent) had no
qualifications (though this proportion declined to 18 per cent in 2011, largely as a result of
a growing cohort).
The large numbers of NEETs with low or no qualifications are important because whilst
higher qualifications are no guarantee of employment, the penalty attached to having no
qualifications has grown due to a better skilled and more competitive labour market.
It is worth highlighting however that many NEETs do have qualifications gained in
post-compulsory education. In addition to those going on to do A-levels and degrees,
in excess of a third of those with GSCE grades A-C or equivalent as their highest
31 These tend to be relatively low level qualifications
28 Lost in transition?qualification have vocation qualifications (for example NVQ Level 2 or BTEC first
diploma). This illustrates the need to focus not just on school leavers but also transitions
of those who have gone on to do additional education or training.
Table 8. NEETs by highest qualification, %
NEETS by Highest Qualification Level 2001 2007 2011
Degree or equivalent 6 7 8
Higher education 1 2 2
GCE A Level or equivalent 12 13 19
GCSE grades A-C or equivalent 33 34 34
Other qualifications 18 18 16
No qualification 29 26 18
Source: Labour Force Survey (don’t know not shown)
Distance from the labour market
In this section we use a range of indicators to examine the distance of the NEET group
from the labour market; using data on previous work experience and current job seeking
activities including economic activity, the period since, and reasons for, leaving previous
employment.
As detailed previously, around half of the NEET cohort is unemployed and looking for
work, and this proportion has risen in the past decade. An additional 16 per cent were
inactive and either looking for work or, in the majority of cases, not looking for work
but would like work (Table 9). This leaves around a third of the NEET cohort who are
not looking and not available to work for a number of reasons including looking after
children or family, or being long-term sick or disabled. The data suggest therefore that
the potential labour pool from NEETs is wider than just those who are actively looking
for work. It is important then that NEET policies and interventions offer a range of
opportunities around supporting access to employment (including potentially supported
employment) as well as access to flexible provision around education and training needs
that recognises the different abilities and constraints within the cohort.
29 Lost in transition?Table 9. NEETs by whether seeking work, %
Economic activity 2001 2007 2011
ILO unemployed 41 44 51
Inactive and Seeking 3 2 2
Inactive- not seeking, would like 21 16 14
Inactive- not seeking, not like 36 37 33
Source: Labour Force Survey
Within the NEET group, many of those who have worked previously are only short-
term out of work. Around one quarter left their last job within the past 12 months- we
would expect most of these to find their way back into the labour market relatively
quickly under normal circumstances although this is more difficult at a time of high
unemployment and slow employment growth.
More worrying is the very significant and growing proportion of NEETs who have not
made the transition into employment after leaving education. As Table 10 shows, the
proportion of NEETs aged 16-24 who have never had a paid job has increased from 41
per cent in 2001, to 48 per cent in 2007 and 2011. It should be noted that in the Labour
Force Survey the definition of never having a paid job excludes ‘casual work’ and ‘holiday
jobs’; it does not therefore measure the absolute absence of work experience, but rather
whether someone has experience of entering and getting a foothold in the labour market
at the start of their career. The figures suggest that over the last decade it has become
more difficult for young people who are NEET to get an initial foothold in the labour
market, with more young people not being able, or taking longer, to make the transition
from education into work. This highlights the real need to support the initial step into
employment. 32
32 This is not to suggest that the issue of young people ‘cycling’ between employment and benefits is not a
problem which policy needs to work to address, rather to highlight that the recent growth in NEETs appears
to be more linked to initial entries to the labour market
30 Lost in transition?Table 10. NEETs by period since leaving last job, %
When left last job 2001 2007 2011
Less than 12 months 31 26 24
1 -3 years 18 16 17
3 - 5 years 8 6 7
5 years or more 3 4 3
Never had paid job 41 48 48
Source: Labour Force Survey
The increased difficulty for young people getting a foothold in the labour market is
also supported by the data presented in Figure 7. 33 The graph shows the proportion of
worklessness among 16-24s which is accounted for by those who have been in paid work
and those who have not (again the definition excludes causal and holiday jobs). It should
be noted that the definitions used in the graph are not directly comparable to the NEETs
figures reported elsewhere as while the figures exclude full-time students they include
those in education part-time who are not included in the NEET figures. The graph shows
that where the size of the workless cohort grows in the period before the recession, this
growth is almost entirely the result of increasing numbers who have not managed to get
a first job (since leaving education) . 34
When young people who are NEET have entered and subsequently left the labour market
it is most commonly for family or personal reasons (Table 11). This reflects the higher
likelihood of becoming NEET for young parents or carers. 35 An increasing number of
young people are becoming NEET following completion of a temporary contract; from
12 per cent in 2001, by 2011 this had risen to 19 per cent. Alongside this there has been
a growth in the proportion of those made redundant by their last employers; since a
low of 7 per cent in 2001, it reached 14 per cent in 2011 as employers shed labour in the
recession.
33 These figures are based on analysis by Bill Wells and reported in Wells (2012) The history of the claimant
count. Presentation to the Annual Labour Market Statistics User Group. The source data is the Labour Force
Survey
34 There are slightly different trends when looking at overall worklessness and looking solely at unemployment.
For the ILO unemployed group the rise in youth unemployment is somewhat more evenly distributed between
those who have had and those who have not had work
35 ACEVO (2012). Youth unemployment: the crisis we cannot afford. London, ACEVO
31 Lost in transition?Figure 7. 16-24s who are not in employment or full-time education by whether they
have had a paid job or not, 1993-2012 (four quarter average)
1,000
800
600
Thousands
400
HAD A JOB (Inc. Missing Values)
HAD A JOB (Exc. Missing Values)
NEVER HAD A JOB (Inc. Missing Values)
NEVER HAD A JOB (Exc. Missing values)
200
0
Source: Labour Force Survey. Analysis from Wells (2012). For several quarters, particularly around 2001, there
are relatively large numbers of missing values; the data are therefore presented both with and without missing
values.
Table 11. NEETs by reason for leaving last job, %
Reason for leaving last job 2001 2007 2011
Made redundant 7 7 14
Dismissed 7 8 8
Temp job ended 12 13 19
Resigned 17 24 16
Gave up for health reasons 9 8 7
Gave up for family or personal reasons 35 28 22
Other 13 12 14
Source: Labour Force Survey
32 Lost in transition?This section has outlined the key demographic characteristics of the NEET group
alongside their changing qualification levels and their distance from the labour market.
It has found that the NEET group is diverse and would be expected to have varying
support needs.
• Over half of the NEET group are seeking employment. Of those who are not
looking for work, many have caring responsibilities or are long term sick/
disabled.
• Today’s NEET group are generally somewhat better qualified compared to
previous waves, however a high proportion continue to have no qualifications.
Whilst there is now a high penalty attached to having no qualifications in a highly
competitive labour market, our data illustrate that qualifications alone do not
guarantee that a young person will not become NEET.
• A large proportion of NEETs (48 per cent) have not been able to find employment
since leaving education. This number has grown over the past decade indicating
that young NEETs are finding it increasingly difficult to access the labour
market.
33 Lost in transition?5 Policy for NEETs
Successive governments have sought both to prevent and reduce the number of
NEETs through early intervention, information advice and guidance through schools
and careers services, work experience placements and so on. However the evidence
suggests that so far success has been limited. A major failing around NEET work
has often been a lack of coordination. In particular, across successive governments
there has been a tendency to divide learning and employment programmes. 36 Service
provision has often been patchy and inconsistent, often making it difficult for young
people to navigate their transition from school to work.
Policies aimed at addressing the NEET problem largely fall into one of two categories:
• Prevention – early intervention, creating effective transitions and intensive
support to stop young people becoming NEET in the first place are very
important. These policies are the central means of moving to a lower NEET rate
in the longer-term.
• Reintegration – given the very large NEET cohort that already exists, as well as
the fact that a proportion of young people are likely to continue to fall through
the gaps for a number of reasons, there is also a need for policies which provide
ways for young people to reintegrate (second and third chances).
Both these policy strands are important if we are to reduce the numbers who are NEET
over the short and medium term.
Current NEET policy
Current policy for NEETs spans three government departments – the Department for
Education, the Department for Business Innovation and Skills, and the Department for
Work and Pensions (DfE, BIS, DWP).
The Coalition Government’s approach to addressing the NEET issue is set out in their
16-24 Participation Strategy. 37 This sets out five strategic priorities to help to reduce
the high NEET rate. Alongside aims to create conditions for balanced and sustainable
growth, these are:
36 Bivand, P. (2012) Generation lost: youth unemployment and the youth labour market, London: TUC
37 HM Government (2011) Building engagement, building futures: our strategy to maximise the participation of 16-24
year olds in education, training and work, HM Government
34 Lost in transition?You can also read