Used vehicle trade and fleet composition in Europe - Ecologic ...
←
→
Page content transcription
If your browser does not render page correctly, please read the page content below
Used vehicle trade and fleet
composition in Europe

 Eike Karola Velten (Ecologic Institute)
 Clemens Brauer (Fraunhofer ISI)
 Jan-Erik Thie (Ecologic Institute)

 Final report

 February 2019

 This document has been prepared for the European Environment Agency (EEA); however
 the opinions expressed are those of the Contractor only and do not represent the Agency’s
 official position; the EEA cannot be held responsible for any use which may be made of the
 information contained therein.

Ecologic Institute
Used vehicle trade and fleet composition in Europe

Contact
Eike Karola Velten
Fellow
Ecologic Institute
Pfalzburger Straße 43/44
10717 Berlin
Germany
E-Mail: eike.velten@ecologic.eu>

Contractor
European Environment Agency
Kongens Nytorv 6
1050 Copenhagen K
Denmark
Tel.: +45 33 36 71 00
Web: eea.europa.eu
Enquiries: eea.europa.eu/enquiries

Suggested citation
Velten, Eike Karola; Clemens Brauer, Jan-Erik Thie (2020): Used vehicle trade and fleet
composition in Europe. Final report of the project “Used vehicle trade and fleet composition in
Europe” on behalf of the EEA. Ecologic Institute and Fraunhofer Institute for Systems and
Innovation Research ISI: Berlin, Karlsruhe.

Acknowledgement
Special thanks goes to Katharina Umpfenbach for her helpful review as well as Jonathan Köhler
for his language check. We also want to thank Janna Vakili, Fabiana Ferro, Darja Stepanova,
Ramiro De la Vega, Yannis Geiger, and Julius Buschle for the country data research.

Information about the contract
This document is the final report of the project “Used vehicle trade and fleet composition in
Europe” carried out by Ecologic Institute and Fraunhofer ISI from August 2019 to February 2020
on behalf of the European Environment Agency (EEA) within the framework service contract
EEA/ACC/18/001/LOT1 with a funding of 49,900.00 €.

1
Used vehicle trade and fleet composition in Europe

Executive summary

Road transport constitutes a major challenge for European countries as road vehicles’ air pollutant
and CO2 emissions significantly contribute to local air pollution and to the climate crisis. The
characteristics of a vehicle such as age, engine type, size, and power, and the mass have a strong
impact on its CO2 and air pollutant emissions. However, we know relatively little about the
characteristics of used vehicles that make up the current vehicle stock and trade between European
countries. Only newly registered vehicles are subject to monitoring and environmental regulation
with respect to air pollutant and CO2 emissions. There is no framework (beyond the road-
worthiness testing and Regulation 715/2007 requiring manufacturers to check in-service conformity
for a period of up to five years or 100,000 km) to limit environmental impacts of used vehicles when
re-registered after purchase by another owner as well as imported and exported vehicles.
This report estimates the environmental impact of used vehicles in Europe and those that are
traded within Europe focusing on air pollutants and CO2 emissions. It covers the European Union
(EU) Member States, the additional EEA member countries which are Iceland, Lichtenstein,
Norway, Switzerland and Turkey as well as the cooperating countries Albania, Bosnia and
Herzegovina, Montenegro, North Macedonia and Serbia as well as Kosovo under UN Security
Council Resolution 1244/99. 1 The report also covers the United Kingdom, as the data used
predates its withdrawal from the European Union. Data collection focussed on publically available
Europe-wide central data sources as well as on national data sources containing information about
the characteristics of vehicle stocks and used vehicle trade for the time period from 2000 to latest
available data.

Key findings
Overall improvement of the environmental performance of used vehicles
Since 2000, the vehicle stocks of all European countries increased in size as well as the used
vehicle trade within Europe increased in terms of numbers and value. In countries with a rapid
economic growth like Poland, Czechia and Estonia, the increase of stocks was especially
pronounced. Although the average age of the vehicle stocks increased overall, the environmental
performance of the vehicles in the stocks and traded used vehicles improved with respect to air
pollutants and CO2 emissions. This can be traced back to EU regulations and in most countries
also national regulatory frameworks including taxation which favour environmental friendly vehicles
over environmental harmful vehicles as well as to a technological progress reducing the specific
energy consumption as well as air pollutants and CO2 emissions. For instance, more than half of
the analysed countries consider the air pollutants and/or CO2 emissions in the calculation method
of their registration tax. In addition, some countries such as Bosnia and Herzegovina, Finland,
Hungary, Serbia and Turkey also introduced import bans for old vehicles or for vehicles with
particularly high air pollutants.

1 This designation is without prejudice to positions on status, and is in line with UNSCR 1244/99 and the ICJ Opinion
 on the Kosovo Declaration of Independence.

 2
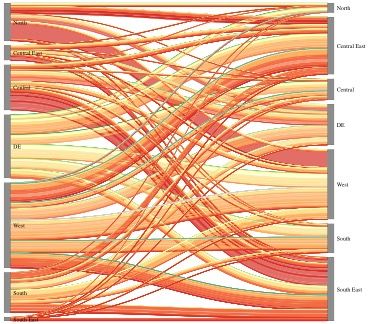
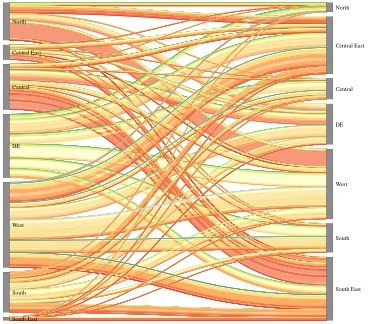
Used vehicle trade and fleet composition in Europe

Regional differences remain in the stocks and used vehicle trade
Besides the overall progress, regional differences of the environmental performance of vehicles in
the stocks and in the trade flows of used vehicles remain with high income countries having on
average relatively new vehicles with comparably lower air pollutants and CO2 emissions and low
income countries having rather old vehicles with comparably higher air pollutants and CO2
emissions (see Figure 1). This is also reflected in the trade flows with high income countries
exporting more used vehicles than they import while at the same time importing rather
environmental friendly vehicles and exporting vehicles with rather high air pollutants and CO2
emissions (see Figure 2).

Figure 1: Age of the car stocks

 13 Central-
 East
Average age of the car stock in years

 12 Central

 11 North

 10 South

 9 South East
 8
 West
 7
 Europe
 Average
 6
 2000

 2001

 2002

 2003

 2004

 2005

 2006

 2007

 2008

 2009

 2010

 2011

 2012

 2013

 2014

 2015

 2016

 2017

Source: own calculations based on Eurostat, 2019a.

The Northern, Central and Western country groups 2 have the most environmental friendly
vehicle stocks, with vehicles having on average the lowest air pollutants and CO2 emissions. The
countries have a much higher share of new vehicles and have a comparably younger vehicle stock
when compared to the European average. In these countries, the impact of regulations for new
vehicles have a much stronger and direct impact on the vehicle fleet. One exemption is Finland as
the country has one of the oldest vehicle stocks with an average of 11.5 years. Imports of used
vehicles play a crucial role in that country as it imported the most significant number of used cars
when compared to the stock.
The relatively high share of new vehicles also results in the fact that the Northern and Central
country group exported much more used vehicles than they imported (for trade flows in 2017 see
Figure 2); the trade surplus was less pronounced for the Western country group. All three country
groups exported lower-value vehicles classified with a low environmental performance while they
imported higher-value vehicles with a relatively good environmental performance. The vehicles
exported by the Northern country group with particularly high CO2 emissions were sold to the

2 The Northern country group consists of Denmark, Finland, Norway, Sweden and Iceland.
 The Western country group consists of Belgium, France, Ireland, the Netherlands and UK.
 The Central country group consists of Austria, Germany, Liechtenstein, Luxembourg, Slovenia and Switzerland.

3
Used vehicle trade and fleet composition in Europe

Central Eastern country group 3 while vehicles with particularly high air pollutants (i.e. diesel
vehicles with a very low value) went to the Western country group. The Central country group
exported mainly large diesel passenger cars with a low average trade value and therefore with
particularly high air pollutants to the South-Eastern group. The Western country group exported its
used vehicles basically to all country groups while it imported rather environmental friendly used
vehicles, in particular in terms of CO2 emissions. The vehicles came mainly from within its group
followed by Germany and the Northern country group. For instance, Germany exported a large
share of diesel vehicles with a medium engine capacity and an average trade value between
EUR 15,001 and EUR 20,000 while a large share of low-value diesel vehicles came from the
Northern country group with particular high air pollutants.

Figure 2: Amount and environmental performance of traded used vehicles in Europe in 2017

 Environmental
 friendly

 Environmental
 harmful

 Not specified

Source: own calculations based on Eurostat Comext (2019). The figure shows the trade flow from exporting to
importing country groups. The width of arrows reflects the amount of traded used vehicles; the colours reflect the
environmental performance as an average for CO2 emissions and air pollutants; green lines indicate the trade of
electric vehicles which have no direct air pollutants and CO2 emissions while on contrast red lines indicate the trade
of vehicles with high air pollutant and CO2 emissions i.e. low-value diesel or petrol vehicles with a large engine.

3 The Central Eastern country group consists of Czechia, Hungary, Poland and Slovakia as well as of the Baltic
 countries Estonia, Latvia and Lithuania.

 4
Used vehicle trade and fleet composition in Europe

Vehicles in the South-Eastern, Central-Eastern and Southern 4 country groups have particularly
high air pollutants and CO2 emissions when compared to the other country groups. Their vehicle
stocks consists of vehicles with an average age of above 11 years and the share of new vehicles
is particularly low. The means that in 2017, most of the vehicles originated from years before
significant improvements of EU regulation for limiting air pollutants and CO2 emissions from new
vehicles.
The South-Eastern and Central-Eastern country groups imported much more vehicles than they
exported – the vehicles mainly from the Western and Central (incl. Germany) country groups. For
instance, a large amount of more environmental friendly vehicles is imported from Germany. The
vehicles imported to the South-Eastern country group have a very low environmental performance
while the vehicles imported to the Central Eastern country group perform better in terms of air
pollutants and CO2 emissions. Some of the countries in the South-Eastern country group addressed
the problem of imports of vehicles with particularly high air pollutants by introducing a ban on
imports of old vehicles and vehicles with low European emission standard for air pollutants such
as Bosnia-Herzegovina, Serbia or Turkey.

Factors influencing the environmental performance of used vehicles in stocks and trade
One of the key factors for the differences in the stocks and trade of used vehicles is the available
household income which differs significantly between the country groups but which determines
what a household is able to pay for a vehicle. In addition, national regulations and taxation schemes
can influence the purchasing decision e.g. when the registration tax rapidly increases as a function
of rising air pollutants and/or CO2 emissions, thus somewhat closing the financial gap between a
low-value but environmental harmful vehicle and a higher-priced vehicle with better environmental
performance.
Import bans on old or on vehicles with low European emission standard (i.e. high air pollutants),
however, did not lead to the import of higher-value vehicles in Serbia, Bosnia-Herzegovina or
Hungary. It might be the case that for those countries the underlying assumption that low-value
vehicles have high emissions is not valid but that these countries in particular import vehicles
having a low price but still a medium emission intensity (e.g. because of high kilometre driven or
other drawbacks of a vehicles reducing its price). However, further research is required to better
understand the influences of the import ban on the vehicle stock.
A new important driver is also the introduction of electric vehicles which do not directly emit air
pollutants nor CO2. Although the market for electric vehicles is relatively new and hence, the share
of used electric vehicles is still small, the increasing share of electric vehicles in the sales of new
cars since 2010 also improves the environmental performance of the vehicle stocks. In addition,
these vehicles also enter the used vehicle market and trade statistics show that the electric vehicles
are also traded amongst the country groups with a somewhat rising share over the past five years.
In 2017, these vehicles were traded amongst all country groups without clear direction. The stock
as well as the trade of electric vehicles is likely to increase as a result of the European CO2 targets
for new vehicles and national plans to ban the sale of new internal combustion engine cars in e.g.
Norway, the Netherlands, Ireland, Slovenia, France and the UK (see e.g. Velten et al. 2019). The

4 The South-Eastern country group consists of Albania, Bosnia and Herzegovina, Bulgaria, Cyprus, Greece,
 Montenegro, North Macedonia, Romania, Serbia, Turkey and Kosovo under UN Security Council Resolution
 1244/99
 The Southern country group consists of Croatia, Italy, Malta, Portugal and Spain

5
Used vehicle trade and fleet composition in Europe

increase of new zero-emission vehicles in the market will also result in the increased availability of
these vehicles to used vehicle buyers. This also means that country groups with a high share of
used vehicle imports also start to import zero-emission vehicles. This means that irrespectively of
the vehicle age, the countries can improve the environmental performance of their vehicle stocks.

Data gaps
The available statistics from Eurostat as well as from national sources are partly incomplete,
inconsistent and not sufficient to allow an in-depth and detailed analysis of the environmental
compatibility of used vehicles in the different European countries over the defined timeframe. This
was partly unexpected as the transport sector, and particularly road transport are at the heart of
current discussions to mitigate the climate crisis and local air pollution.
In particular, our data collection showed that there is no comprehensive data available from
Eurostat and from national sources on the environmental characteristics of vehicles. Data on air
and CO2 emissions of the vehicle stock or of traded vehicles is only available for a few countries.
A drawback is also that Eurostat provides characteristics largely independent from each other e.g.
no combination of engine type and age structure. The databases include breaks in reporting and a
range of countries does not report regularly for all (sub)indicators, and report data that is not
consistent over the time period covered. Finally, the trade statistics (Eurostat Comext) do not
include all vehicle imports and exports as reporting countries can exempt small- and medium
enterprises (SMEs) from the reporting. The data compilation included a synthesis of available data
sources where possible to close data gaps and reduce inconsistencies over the timeframe. Any
further missing data for specific years in a time series were closed by linear interpolation over a
related time frame. We also corrected obvious inconsistencies such as the reporting of full numbers
instead of thousand. We could, however, not fill in gaps related to a whole characteristic, such as
the age structure.
Due to missing data, we had to derive the environmental characteristic (i.e. air and CO2 emissions)
of the stock and trade of used vehicles based on the available characteristics. For the stock, we
used the engine type and capacity as well as the age structure; for trade, we used the engine type
and capacity as well as the average value of the traded vehicles in any given subcategory. For the
stock, we thus also had to combine available age structures and engine types (including capacity
where available). The classification of a vehicle in terms of its air pollutant and CO2 emissions is
based on a 10 scale, ranking the vehicles from 1 (no emissions) to 10 (very high emissions) based
on specific characteristics of the vehicle such as engine type, age, average trade value and engine
size.
Due to the data gaps and the applied methodology to derive the emission classification, the results
are to be considered as rough estimates and are used for showing the general trends and order of
magnitude. A more comprehensive database would facilitate the analysis of policy interventions
that should have an effect on motorised road vehicles.

 6
Used vehicle trade and fleet composition in Europe

Table of contents

Executive summary....................................................................................................................... 2

1 Introduction ............................................................................................................................ 8

2 Data collection and compilation .......................................................................................... 9
 2.1 Indicators to describe vehicle characteristics ......................................................... 9
 2.1.1 Countries........................................................................................................................ 9
 2.1.2 Year ............................................................................................................................. 10
 2.1.3 Vehicle class ................................................................................................................ 10
 2.1.4 Engine type .................................................................................................................. 10
 2.1.5 Engine capacity ........................................................................................................... 10
 2.1.6 Air pollutants and CO2 emissions ................................................................................ 11
 2.2 Data sources .............................................................................................................. 12
 2.2.1 Stock data .................................................................................................................... 12
 2.2.2 Trade data.................................................................................................................... 13
 2.3 Data gaps and inconsistencies ................................................................................ 15

3 Derivation of environmental characteristics .................................................................... 16

4 Environmental characteristics of used vehicles.............................................................. 20
 4.1 Regulatory background of vehicle stocks and trade ............................................ 20
 4.1.1 Regulations for registering a vehicle ........................................................................... 20
 4.1.2 Taxation for incentivising efficient and low-emission vehicle stocks........................... 20
 4.1.3 Regulation and taxation during the trade of vehicles .................................................. 24
 4.2 Characteristics of European countries’ vehicle stocks ........................................ 26
 4.3 Characteristics of European countries used vehicle trade .................................. 31

5 Conclusions ......................................................................................................................... 38

6 Indexes ................................................................................................................................. 40
 Figures .................................................................................................................................. 40
 Tables ................................................................................................................................... 40
 Boxes .................................................................................................................................... 41
 Abbreviations ....................................................................................................................... 41

7 Literature .............................................................................................................................. 42

7
Used vehicle trade and fleet composition in Europe

1 Introduction

Road transport poses a major challenge for European countries as road vehicles’ air pollutants and
CO2 emissions significantly contribute to local air pollution and to the acceleration of the climate
crisis.
Age, engine type, capacity and power, and the mass of a vehicle have a strong impact on its CO2
emissions and air pollutants (see e.g. EEA, 2019a). The age seems particularly important as EU
regulations got stricter over the past decade setting targets for CO2 emissions and maximum levels
of air pollutants for new vehicles (see also Chapter 2.1.6). As these regulations only apply to new
vehicles, they do not have an immediate impact on already used and the registration of used
vehicles. In countries with a low share of new vehicle registrations each year, the current EU
legislation can therefore only have a very limited or delayed impact.
In this context, previous studies 5 demonstrated that there are several EU Member States where
imported used vehicles from other EU Member States far exceeded the number of new vehicles
sales. However, there are no EU-wide criteria regarding the environmental performance of imported
or exported used vehicles. Some European countries, however, have introduced specific legislation
(see Chapter 4.1.3).
In order to achieve European and national climate targets and to reduce air pollution in the EU, it
is thus crucial to understand a) the composition of the vehicle stock as well as b) the scale,
directions and what types of vehicles are traded between European countries. This includes most
importantly also the environmental friendliness of the vehicle stock and of the traded vehicles e.g.
in terms of average air pollutants and CO2 emissions per km driven. At present, there is however
no EU-wide regulation or framework on the monitoring of existing or used vehicles environmental
characteristics in the stock or trade. A monitoring procedure has been set up only for the
registrations of new vehicles 6 and Eurostat7 only collects more general vehicle characteristics.
In this context, this project aims at a better understanding of the environmental impact of the stock
and trade of used vehicles in Europe with a focus on air pollutants and CO2 emissions based on
existing statistics for vehicle stocks and trade. Thus, a key part was the collection and compilation
of respective available information from central and national sources (see Chapter 2). However,
the data availability was limited so that the environmental characteristics of used vehicles had to
be derived from available characteristics (see Chapter 3). The results are presented in Chapter 4
starting with a presentation of the regulatory background followed by the analysis for the stock and
trade of used vehicles. We conclude with our findings in Chapter 5 focussing on options to reduce
the emission intensity of the vehicle stocks.

5 Öko-Institut et al. 2011; GFK and CE 2016
6 For cars and vans: Regulation (EU) 2019/631 repealing Regulations (EC) No 443/2009 and Regulation (EU) No
 510/2011; for busses and lorries: Regulation (EU) 2018/956
7 The main role of Eurostat is the compilation, harmonisation and publication of European statistics which are

 collected and handed over by the European countries based on the Regulation (EC) No 223/2009 of the
 European Parliament and of the Council of 11 March 2009 on European statistics.

 8
Used vehicle trade and fleet composition in Europe

2 Data collection and compilation

Data collection focussed on vehicle characteristics such as age, engine type and capacity, mass,
air pollutants and CO2 emissions for Europe based on Europe-wide central data sources as well
as on national data sources containing information about used vehicle stocks and trade.

2.1 Indicators to describe vehicle characteristics

The compilation and summary of data was carried out along the following indicators:

2.1.1 Countries
This indicator describes the respective countries where the corresponding vehicle stock is
registered as well as the exporting and importing country for trade flows. The report covers the
European Union (EU) Member States, the additional EEA 32 member countries which are Iceland,
Lichtenstein, Norway, Switzerland and Turkey as well as the cooperating countries Albania, Bosnia
and Herzegovina, Kosovo under UN Security Council Resolution 1244/99, Montenegro, North
Macedonia and Serbia. The report also covers the United Kingdom, as the data used predates its
withdrawal from the European Union. In the following, we refer to these countries as ‘Europe’.
In order to give a better overview, the countries are merged into the following country groups:

Table 1: Overview on regions and countries and their abbreviation code covered by this report

 Abb. Name Abb. Name Abb. Name
 Region: Central Region: Central-East Region: North
 AT Austria CZ Czechia DK Denmark
 CH Switzerland EE Estonia FI Finland
 DE Germany HU Hungary IS Iceland
 LI Liechtenstein LV Latvia NO Norway
 LU Luxembourg LT Lithuania SE Sweden
 SI Slovenia PL Poland
 SK Slovakia
 Region: South Region: South-East Region: West
 ES Spain AL Albania BE Belgium
 HR Croatia BA Bosnia and Herzegovina FR France
 IT Italy BG Bulgaria IE Ireland
 MT Malta CY Cyprus NL Netherlands
 PT Portugal EL Greece UK United Kingdom
 ME Montenegro
 MK North Macedonia
 RO Romania
 RS Serbia
 TR Turkey
 Kosovo under UN Security
 XK
 Council Resolution 1244/99

Source: own compilation of country groups; country abbreviations based on EEA (2020).

9
Used vehicle trade and fleet composition in Europe

2.1.2 Year
This indicator describes the respective year for which the stock or trade is given. The report covers
the period from 2000 to 2017 for the stock (for some also 2018/2019) and 2000 to 2018 for trade.

2.1.3 Vehicle class
This indicator describes the type of vehicle for which additional indicators are given. We use four
categories which are passenger cars (i.e. M1-type vehicles) and busses (M2+M3) as well as vans
(N1) and lorries and road tractors (N2+N3).

Table 2: Overview of vehicle classes covered by this report

 Abb. Full meaning
 M1 Passenger car for the transport of maximum 8 persons in addition to the driver’s seat
 M2+3 Passenger vehicle for the transport of at least 9 persons in addition to the driver's seat
 N1 Goods vehicle with a mass of below 3.5 tons
 N2+3 Goods vehicle with a weight of more than 3.5 tons

Source: Annex II of Directive 2007/46/EC on the definition of vehicle categories and vehicle types

As passenger cars (M1) represent the majority of motorised vehicles, the analysis in Chapter 4
focusses on this vehicle group. Nevertheless, busses and cargo vehicles also constitute an
important lever for emission reduction because of their high mass and annual mileage.
In the report, we use the following wording for the different vehicles classes:

 vehicle: all vehicles of the classes M1 - M3 and N1 - N3
 car: only vehicles of class M1
 bus: only vehicles of classes M2 + M3
 van: only vehicles of class N1
 lorry (including road tractors): only vehicles of classes N2 - N3

2.1.4 Engine type
This indicator describes the respective engine type given as standard fuel type. We use five
categories for the engine type including “Diesel”, “Petrol”, “Gas fuels”, “Electric” and “Other”. The
categories “diesel” and “petrol” include also hybrids thereof. The category “Gas fuels” includes
compressed natural gas (CNG), liquefied natural gas (LNG) and liquefied petrol gas (LPG; also
called autogas). This category is determined by LPG-fuelled vehicles: in 2016, there were roughly
60 times more LPG-fuelled cars when compared to CNG/LNG; for vans and lorries, LPG is used
roughly 3 and 2 times more, respectively. The category “Other” covers a variety of fuel types
including for example not specified fuel types, hydrogen, bifuel and alternative.

2.1.5 Engine capacity
This indicator describes the respective cylinder capacity given in cubic centimetre (cc). We use
here the same categories as Eurostat. The following table shows the categories for the different
engine types:

 10
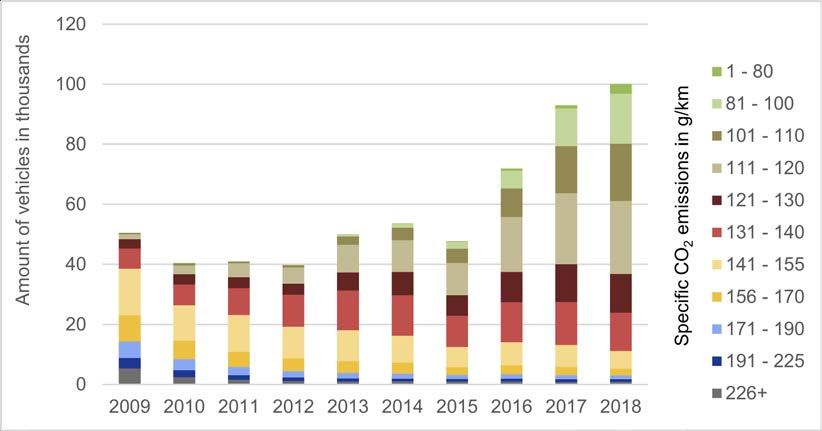
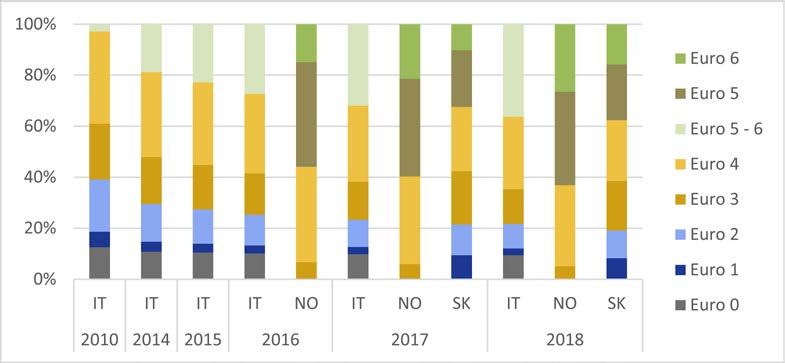
Used vehicle trade and fleet composition in Europe

Table 3: Overview of vehicle classes and related cylinder capacity

 Stock database Trade database
 Vehicle
 class Engine type [as fuel type] and capacity [in cc] Engine type [as fuel type] and capacity [in cc]

 Diesel: ≤1500; >1500 - ≤2500; >2500
 Diesel/Petrol: 1000 - ≤1500; >1500 - ≤3000; >3000
 Gas fuels/Electric/Other: n/a
 Other: n/a

 Diesel: ≤2500; >2500
 M2+3 n/a
 Petrol: ≤2800; >2800
 Diesel: ≤2500; >2500
 N1 n/a
 Petrol: ≤2800; >2800
 N2+3 n/a n/a

Source: Own compilation based on Eurostat (2019) and Eurostat Comext (2019).

2.1.6 Air pollutants and CO2 emissions
These two indicators describe the environmental performance of the vehicles.
For air pollutants, vehicles are classified according to the European emission standard. For cars
and vans, the standard defines the maximum amount of air pollutants per km for new approvals
and new registrations for cars and vans (Regulation (EC) No 715/2007); for busses and lorries, the
standard defines maximum values for the engine energy output (Regulation (EC) No 595/2009).
The EU introduced the first European emission standard in 1992 for cars and vans (generally
referred to as Euro 1) as well as for busses and lorries (generally referred to as Euro I). Euro 1 for
cars and vans required e.g. the complete switch to unleaded petrol and that all new cars have
catalytic converters. Since 1992, the EU has added new air pollutants and tightened the maximum
values. Important developments included the introduction of maximum values for particle numbers
besides particulate mass with Euro 5b in 2011 for new approvals and 2013 for all new registrations
and a significant reduction of the maximum values for nitrogen oxides (NOx) from diesel cars and
vans with Euro 6b in 2014 / 2015. For busses and lorries, a maximum value for particle number
and a significant reduction of NOx emissions was introduced with Euro VI in 2012 / 2013 (see e.g.
AECC, 2019).
The current Euro 6d for cars and vans and Euro VI for busses and lorries includes maximum values
for carbon monoxide (CO), total hydrocarbons (THC), non-methane hydrocarbons (NMHC),
nitrogen oxides (NOx), particulate mass (PM) and particle number (PN). It does not include GHG
emissions from vehicles.

The CO2 emissions of vehicles are measured in grams CO2 per km. The EU introduced a CO2
target for new registered vehicles by setting targets for the car fleet of each car manufacturer
(Regulation 443/2009) as well as for vans (Regulation (EU) No 510/2011); Regulation (EU)
2019/631 replaces both regulations setting new targets for the post-2020 period while also requiring
a new testing method. Regulation (EU) 2019/1242 addresses new registered lorries and busses
also setting an average CO2 performance standard for the fleet of a manufacturer (see DG CLIMA,
2020). In this context, car manufacturers report on the newly registered vehicle’s CO2 emissions in
each Member State since 2010 (see EEA, 2019b,c).

11
Used vehicle trade and fleet composition in Europe

2.2 Data sources

Central and national data sources provide information about the characteristics of vehicles in a
country’s vehicle stock and in trade; however, information about environmental characteristics are
largely missing. An overview is given in the following.

2.2.1 Stock data
The main central source of information for European countries is Eurostat. 8 For vehicle stock,
Eurostat provides a range of databases covering a range of vehicles’ characteristics (see Table 4)
for the EU Member States, the additional EEA member countries and partly also for the cooperating
countries. The databases, however, include breaks in reporting and a range of countries do not
report regularly for all (sub)indicators or report data that is not consistent over the time period
covered. In addition, data for most indicators is not connected so that there is, for example, no
combination of engine type and age structure available. Finally, most important indicators to assess
the environmental impact of the vehicle stock (i.e. air pollutants and CO2 emissions) are not
available at all.

Table 4: Eurostat data coverage for the stock of vehicles

 Eurostat databases Vehicle class Characteristics Time period

 road_eqs_carmot M1 Engine type (only diesel and petrol) Up to 2017
 and engine capacity
 road_eqs_caralt M1 Engine type Up to 2012
 road_eqs_carpda M1 Engine type 2013 - 2017
 road_eqs_carage M1 Age classes Up to 2017
 road_eqs_unlweig M1 Mass Up to 2017
 road_eqs_busmot_h M2-3 Engine type Up to 2012
 road_eqs_busmot M2-3 Engine type 2013 - 2017
 road_eqs_busage M2-3 Age classes Up to 2017
 road_eqs_lormot_h and N1-3 Engine type Up to 2012
 road_eqs_roaene_h
 road_eqs_lormot and N1, N2-3 Engine 2013 - 2017
 road_eqs_roaene
 road_eqs_lorroa_h N1-3 Age classes Up to 2012
 road_eqs_lorroa N1, N2-3 Age classes 2013 - 2017
 road_eqs_lornum N1-N3 Mass 2013 - 2017

Source: Own compilation based Eurostat (2019) on available data in November 2019

In addition, national sources provide statistics on the stock of vehicles in the given country.
However, most of the sources provide the same data as also reported to Eurostat (or less) and
sources that have additional data provide these only for the most recent year(s).

8 Other central sources for vehicle’s characteristics include the European Automobile Manufacturers' Association
 (ACEA) and the International Council of Clean Transportation (ICCT). However, both do not provide additional
 online information beyond Eurostat on the stock or trade of vehicles.

 12
Used vehicle trade and fleet composition in Europe

Only four countries (Germany, Spain, Finland and Italy) report on the combination of age class and
engine type. For the combination of age and mass, data could only be found for Spain. The
combination of age and engine capacity was available from Spain and Liechtenstein. Germany
provides the data for a range of years, Spain only for 2017 and 2018, Finland only for 2019, Italy
for cars in selected years, and Liechtenstein since 2013 but also only for passenger cars.
The reporting on air pollutants and/or CO2 emissions is particularly limited. Only five countries
provide information about vehicle’s air pollutants for at least one year. Germany, Italy, Norway and
Slovakia provide the number of vehicles in each air pollution category in combination with the
engine type for each vehicle class; however, Germany provides no data for busses and Italy only
for cars. Germany, Italy and Norway provide the data for various years, Slovakia only for the last
two years. Spain provides only emission category for cars in the years 2017 and 2018. The data
about the CO2 emissions of the vehicle stock is even thinner. There are three countries (Ireland,
Liechtenstein and UK) providing at least some information on passenger cars while there is no data
on the other types of vehicles. Ireland provides data for CO2 emission categories in combination
with the engine capacity for the years 2010-2019 but not for the engine type. Liechtenstein has
information about the CO2 emission categories in combination with the age structure for 2015 and
UK provides only the CO2 emission categories for 2015. We did not consider data on CO2
emissions of new registered cars and vans which is available since 2010 (see EEA, 2019b,c) as
new registrations make up only a small share of the overall vehicle stocks and the data is only
available since 2010 which means that it could only provide information for the younger age classes
for the latest years. In addition, to determine the influence of new registered vehicles on the vehicle
stock in a country would require some sort of “stock modelling” including all in- and outgoing
vehicles such as from imports, exports and scrapping and such an exercise was not subject to this
project.

2.2.2 Trade data
The main central source for the trade of vehicles is Eurostat Comext. The database provides the
total amount, total value and total mass of the traded used vehicles for a given year and for the
specific engine types in combination with the engine capacity (see also Table 5). Notably, the
statistics do not include all engine types as given above but only include petrol, diesel and plug-in
hybrids as well as electric vehicles. CNG, LPG and LNG as well as other engine types are not
defined in the combined nomenclature (CN) (see Commission Implementing Regulation (EU)
2019/1776). The database provide no information about the age or the environmental
characteristics of the traded vehicles.

Table 5: Eurostat data coverage for the trade of vehicles

 Eurostat databases Vehicle class Characteristics Time period

 Comext M1, M2+3, Engine type; engine capacity for Up to 2018
 N1, N2, N3 M1; amount; total mass; value

Source: Own compilation based Eurostat Comext (2019) on available data in December 2019

Most importantly, the trade statistics do not include all vehicle imports and exports as reporting
countries can exempt small- and medium enterprises (SMEs) from the reporting to reduce the
administrative burden for them as long as at least 97 % of their total intra-EU exports and 93 % of
total intra-EU import is covered. For example, in Germany, the exemption threshold related to a
company’s turn-over was EUR 800,000 for intra-EU imports and EUR 500,000 for intra-EU exports
in 2016 (see Eurostat, 2019b and further explanation also in Öko-Institut et al., 2011). Small sellers
importing or exporting used vehicles are thus not included in the foreign trade statistics.

13
Used vehicle trade and fleet composition in Europe

In Germany, more complete data on used vehicle exports are provided by the KBA's working
statistics on re-registrations of used vehicles in other countries. According to BMU (2019), the
number of exported vehicles from the re-registration statistics exceeds the export figures reported
in Comext six times. In 2017, the used vehicles re-registered in another EU country amount to
roughly 1.9 million vehicles (BMU, 2019: Tab.7) while the foreign trade statistics report an amount
of roughly 300 thousand vehicles (Eurostat Comext, 2019) (see Figure 3).

Figure 3: Differences in the exports from Germany to the EU according to trade and re-registration statistics

 2,5 Other
 Exports in million vehicles

 PL
 2
 RO

 1,5 NL
 FR
 1

 0,5

 0
 Re-reg. data Comext Re-reg. data Comext Re-reg. data Comext Re-reg. data Comext
 2014 2015 2016 2017

Source: own compilation based on Eurostat Comext (2019) and BMU (2019).

The KBA’ statistics on re-registration in other countries were not taken into account for this project
as these only provide the total number of exported used vehicles to other countries without
providing any information about vehicle characteristics and are not available online nor free of
charge. In addition, we could not find similar data for the other European countries. 9
Under the assumption that the coverage of Comext compared to the data given in the re-registration
statistics look similar for other countries, the Comext trade statistics reflect roughly 1/6 of all trade
volumes. This does not constitute a drawback per se. We consider that the trade statistics can be
used to assess the changes in the trade flows when compared over several years as well as that
the statistics can provide an indication on the environmental friendliness of the traded vehicles.
The re-registration statistics, however, constitute a suitable source of information for further
research – in particular if the KBA and other authorities would also provide the related
characteristics for the re-registered vehicles.
National sources mainly present the same (or even less) data as reported to Eurostat. In fact, only
for Finland, Ireland and Poland additional information is available from a national governmental
agency (the Finnish Transport and Communications Agency) or from the Irish and Polish
automotive industry associations. The dataset on Finland includes the imports from all European
countries with the respective amount given for a combination of vehicle class, engine types and
age structure. The data on Ireland shows the total imports of passenger cars in the different CO2

9 Council Directive 1999/37/EC of 29 April 1999 on the registration documents for vehicles stipulates a data
 exchange only for internal use of the competent authorities and do not request the official publishing of such
 data in a suitable way e.g. as sums so as not to allow for misuse or disclosure of confidential information.

 14
Used vehicle trade and fleet composition in Europe

emission classes for various years. The data on Poland includes passenger car imports in various
years in the different age classes. For 2018, there is also data on air pollutant categories which is,
however, not combined with the age structure given in the other dataset.

2.3 Data gaps and inconsistencies

Previous studies and reports about characteristics and trade flows of used cars already highlighted
problems about lacking data in many European countries (e.g. Öko-Institut et al. 2011; GFK and
CE 2016). The data analysis in this study confirms this for passenger cars as well as for the other
vehicle classes.
For the Eurostat databases, data gaps and inconsistencies vary among and within the datasets
with some of these gaps and inconsistencies being less relevant than others. To give some
examples: there is a lack of data only for single years in a times series; sometimes there is no data
of a country for a whole dataset or subcategories are not reported. Inconsistencies include reporting
errors such as typos (i.e. adding two times a number in the sequence of a number), unit errors (i.e.
reporting of full number although the unit is given in thousand vehicles), definition difficulties (e.g.
definition of a lorry, heavy-duty vehicle and a road tractor and respective vehicle class N1 to N3),
definition errors (i.e. reporting of road tractors under lorries) and changes in the definition of a
(sub)category.
The national online available databases cannot compensate for Eurostat data gaps and
inconsistencies as these generally contain the same figures or even less information.
Due to the strong variety of data gaps, there is no common methodology appropriate to fill all of
them. In general, the first step consists in the synthesis of available data sources but as mentioned,
national datasets generally reflect the shortcomings of central databases. Missing data for specific
years in a time series were closed by linear interpolation over the missing time frame. For example,
data on the stock of passenger cars (M1) differentiated by age structure for France is missing for
the years 2008 and 2009 in Eurostat. Reporting from France cannot be used as it is provided in
another format (i.e. other split of age structure). In this case, a linear interpolation differentiated by
age structure between 2007 and 2010 is used to fill the respective gap. In the case of not specified
engine size of passenger cars, we assumed that these vehicles belong to the medium size category
which by far contains the largest share of cars. We also corrected obvious inconsistencies such as
the reporting of full numbers instead of thousand. We could, however, not fill-in gaps related to a
whole category, such as the age structure which is the case for Greece or Bulgaria.

15
Used vehicle trade and fleet composition in Europe

3 Derivation of environmental characteristics

The limited availability of data on the environmental characteristics of used vehicles in the stock
and trade in almost all of the European countries makes the assessment of them dependent on
further assumptions beyond pure inter- or extrapolation.
For this study, the chosen approach focusses on deriving environmental characteristic (i.e. air and
CO2 emissions) based on a combination of available vehicle characteristics:

 for the stock, the environmental characteristics are derived from the engine type and
 capacity as well as from the age structure;
 for trade, the environmental characteristics are derived from the engine type and capacity
 as well as from the average value of the traded vehicles.

The decision to use the engine capacity instead of the engine power, which seems more useful in
accordance with EEA (2019a), is a result of the missing data on engine power. For the stock, we
also faced a limited availability of the combination of single characteristics (such as engine type,
engine capacity, and age structure) which was deemed necessary to derive a classification of
vehicles in terms of air pollutants and CO2 emissions. As a work-around, we chose to combine
available age structures and engine types (including engine capacity where available) based on an
equal distribution in the respective year. This approach has its drawbacks in particular in terms of
varying diesel and petrol shares of new registrations over the years; however, it provides enough
clarity if data is compared over a longer timeframe and seems accurate enough to use it as a
starting point for the evaluation of likely air and CO2 emissions of the vehicle stocks. We checked
this approach for some countries and found little divergence.

Figure 4: Assumptions for classification of used vehicles in terms of air pollutants and CO2 emissions

 Fuel Type Engine size [in cc] Year of Average value
 Emissions Scores Air CO2 Stock Trade registration [in EUR]

 Very 10 Diesel Petrol > 2,000 > 3000 1985 < 1,000
 high
 9 Petrol, Gas fuels
 Gas > 2800 1,000 - 2,500
 fuels
 8 Diesel > 2500 2,501 - 5,000
 7 ≤ 2800 5,001 - 7,500
 6 ≤ 2500 7,501 - 10,000
 5 1,400 -
 1500 - 3000 10,001 - 15,000
 2,000
 4 1500 - 2500 15,001 - 20,000
 3 1000 - 1500 20,001 - 25,000
 2 ≤ 1500 25,001 - 30,000
 Low 1 Electric Electric < 1,400 ≤ 1000 2016 > 30,000

Source: own representation based on EEA (2019) and ICCT (2018), ICCT (2012), Wietschel et al. (2019), Synák
et al. (2019) and Heidt et al. (2013) as well as on online vehicle sales platforms.

The classification of a vehicle in terms of its air and CO2 emissions is based on a 10 scale, ranking
the vehicles from 1 (no emissions) to 10 (very high emissions) for air pollutants and for CO2

 16
Used vehicle trade and fleet composition in Europe

emissions. 10 The classification is calculated based on the following valuation of each characteristic
(see Figure 4) and their weighting depending on the relative importance (see Formula 1 to Formula
4).
The four different fuel types analysed are diesel, petrol, gas fuels and electric. Vehicles
categorized as "Other" are not included in this analysis, due to the diverse composition and as it
contains vehicles that are not specified which means that no robust assignment to environmental
characteristics is possible. The fuel category “Gas fuels” includes both natural gas and liquefied
propane gas (LPG), in some countries commonly called autogas. Those two fuels differ significantly
in terms of chemical composition and environmental impact. As the category is numerally
dominated by LPG cars (see Chapter 2.1.4) the assessment of this fuel type is based on the
environmental characteristics of LPG.
The environmental performance of diesel, petrol, gas fuels and electric vehicles in relation to both
CO2 emissions and air pollutants is expressed by different scores as reflected in Figure 4. Electric
vehicles have no direct air pollutants and CO2 emissions and therefore get the best rating (1 point).
In terms of CO2 emissions, petrol vehicles have the highest CO2 emissions (10 points), followed by
LPG (9 points) and diesel (8 points) vehicles (see Table 6).

Table 6: CO2 emissions classification

 CO2 Emissions Petrol Diesel LPG
 Classification
 CO2 emission factors 2.34 kgCO2/l 2.68 kgCO2/l Emission data for vehicles with
 Average CO2 emissions gaseous fuels are not available as
 5.1 l/100km 4.1 l/100km
 for compact cars → 120 g/km → 110 g/km standardised as for diesel and petrol
 cars. Publications on the topic do not
 Average CO2 emissions give clear numbers but correspondently
 7.5 l/100km 6.0 l/100km
 indicate that LPG emits more CO2 per
 for luxury cars → 175 g/km → 160 g/km
 km than diesel, but less than petrol

Source: own compilation based on ICCT (2012) for CO2 emission factors; Wietschel et al. (2019) for average CO2
emissions for compact and luxury vehicles; Synák et al. (2019) and Heidt et al. (2013) for evaluation of LPG.

In terms of air pollutants, diesel vehicles have the highest emissions followed by petrol and LPG
vehicles. From the introduction in 1992, the European emissions standards for petrol vehicles were
stricter than those for diesel vehicles. Even though the emission standards for diesel were adjusted
over the years, still a large quantity of vehicles with lower emission standards are on the road and
in road test diesel vehicles emit more NOX and PM than petrol vehicles (see Chapter 2.1.6 and
Bernard et al. 2018). Therefor a score of 10 was assigned to vehicles with diesel engine and a
score of 9 to vehicles with petrol engine. It is discussed controversially if LPG is cleaner in terms of
air pollutants as petrol cars. The used publications reached no coherent conclusion. As vehicles
fuelled with LPG are subject to the same European Emission standards as petrol vehicles, gas
fuels are assigned the same score (9 points) (see e.g. Bielaczyc et al. 2016; Ristovski et al. 2005).
The engine capacity directly influences the environmental performance of a petrol and diesel
vehicle in terms of its CO2 emissions while it is less important for air pollutants as all cars,
irrespectively of their engine size have to comply with the European emission etandards (see

10 These are direct air pollutants and CO2 emissions arising from internal combustion and do not take into account
 particle emissions from tyre and brake wear, embedded emissions or emissions from electricity generation for
 electric vehicles.

17
Used vehicle trade and fleet composition in Europe

Chapter 2.1.6). Electric vehicles and vehicles running on gas fuels are not evaluated within this
subcategory since the engine capacity is not available or applicable here. For the stocks, no engine
capacity was available for busses, vans and lorries.
The evaluation in terms of the engine capacity is based on the fact that vehicles with a smaller
engine capacity (but the same type of fuel) emit less CO2 emissions when compared to a vehicles
with a large engine capacity (see e.g. EEA, 2019 and ICCT, 2018). The smallest engine capacity
(evaluated with 1 point) in the stock database is smaller than 1,400 cc while it is smaller than
1,000 cc in the trade database. The biggest engine capacity category (evaluated with 10 points) is
the category of larger than 2,000 cc in the stock and larger than 3,000 cc in the trade database.
The other categories in between are distributed accordingly.
The age structure is only given for vehicle stocks. It is categorised as younger than two years, two
to five years, five to ten years, and older than ten years. In order to obtain a stable value over the
years, we have allocated a registration year to each vehicle by taking the average value from one
age category (i.e. a vehicle within the category two to five years was classified as a three and half
year old vehicle; vehicles older than ten years are assumed to be on average 15 years old). This
means that the oldest vehicle is registered in 1985 as it is in the category of “older than ten years”
in the year 2000 (evaluated with 10 points). A data entry of a vehicle in 2017 within the age structure
of “younger than two” is assumed to be registered in 2016 and is therefore the youngest vehicle in
the data set (evaluated with 1 point) (see Figure 4). The other registration dates in between are
distributed accordingly.
The average values of a vehicle is used to evaluate the environmental performance of traded
used vehicles as data on age structure is missing. It is based on the assumption that lower-value
vehicles emit more than high-value vehicles which can be justified when checking e.g. online
vehicle sales platforms. However, there are other vehicle characteristics (besides the age and
environmental performance) that influence the value of a vehicle, in particular the brand, the
interior, and most importantly the driven kilometres. Thus, the given evaluation (see Chapter 4.3)
can only serve as a rough estimate of the environmental performance of traded vehicles. In
addition, when compared to the stock database, the use of different characteristics (age vs.
average value) can lead to disparities in the emissions outcomes between both databases, i.e. that
vehicles in the trade database might occur as emission intensive vehicles, because they were
traded for a small price but are rather new and have a good emission performance. In the stock
database, the same car would occur as a rather well performing vehicle in terms of its emission
intensity. Besides these drawbacks, we consider the average value as a good mean to evaluate
the traded vehicles in terms of their environmental performance – at least for Ireland results are
similar to the data provided for the CO2 emission classification of its imports (see Box 4).
We defined ten categories ranking the average value from less than EUR 1,000 (10 points) to an
average value larger than EUR 30,000 (1 point) (see Figure 4 for intermediate steps).
For the final scoring, each characteristic is weighted depending on the relative importance. For
the stock, the classification system for air pollutants addresses age structure and engine type with
the weights being 0.7 for age and 0.3 for the engine type; to evaluate the CO2 emissions, the
weights are 0.5 for age, 0.3 for the engine type and 0.2 for the cylinder capacity.

 18
Used vehicle trade and fleet composition in Europe

The following equations summarise the evaluations scheme for the vehicle stocks for air pollutants
and CO2 emissions:

 for air pollutants: = ∗ 0.2 + ∗ 0.8 Formula 1

 for CO2 emissions: = ∗ 0.3 + ∗ 0.5 + ∗ 0.2 Formula 2

 with EP = evaluation points
 ET = engine type
 RD = registration date
 EC = engine capacity
This classification gives a maximum of ten points in terms of air pollutants to a diesel vehicle which
was first registered in 1985 and a maximum of ten points in terms of CO2 emissions to a petrol
vehicle first registered in 1985 with an engine capacity of more than 2,000 cc. Electric vehicles are
assumed to be the top-performer with an overall scoring of 1 point.
For trade, the classification is based on the engine type and average value of the traded used
vehicle to derive the classification of air pollutants as well as on the engine capacity for CO2
emissions. Notably, there is no category for gas fuelled vehicles in the trade statistics. The following
equations summarise the evaluations scheme for the traded vehicle in terms of their air pollutants
and CO2 emissions:

 for air pollutants: = ∗ 0.5 + ∗ 0.5 Formula 3

 for CO2 emissions: = ∗ 0.3 + ∗ 0.5 + ∗ 0.2 Formula 4

 with EP = evaluation points
 ET = engine type
 AV = average value
 EC = engine capacity
This classification gives a maximum of ten points in terms of air pollutants to a diesel vehicle with
an average trade value below EUR 1,000 and a maximum of ten points in terms of CO2 emissions
to a petrol vehicle with an average trade value below EUR 1,000 and an engine capacity of more
than 3,000 cc. Electric vehicles are assumed to be the top-performer with an overall scoring of
1 point.

Due to the data gaps and the methodology to derive the air pollutants and CO2 emission
classification of vehicle stocks and used vehicle trade within the analysed statistics, the results
are to be considered as rough estimates and are used for showing the general trends and order
of magnitude.

19
Used vehicle trade and fleet composition in Europe

4 Environmental characteristics of used vehicles

The estimates of the environmental performance of used vehicles in the stock and trade of
European countries are presented in the following. As the regulatory framework may impact
purchasing decisions, we give an overview of relevant European and national regulations and taxes
for the trade as well as for the registration of used vehicles which also fed into the analysis.
In principle, we cover all European countries in this chapter beside some countries which do not
provide sufficient information with respect to their vehicle stock. For trade, every European country
participated in the trade of used vehicles with varying intensity and direction. The focus year is
2017 as for the vehicle stocks no comprehensive data was available for 2018.

4.1 Regulatory background of vehicle stocks and trade

This section gives an overview of the applicable regulations and taxation when registering a vehicle
to be used on public roads as well as regulations and taxation when vehicles are traded. This
mainly serves as background information to better understand differences in the stock and trade of
used vehicles beyond other indicators such as economic activity or average household income.

4.1.1 Regulations for registering a vehicle
Directive 2014/45/EU regulates the registration and roadworthiness of motor vehicles in the EU
and European Economic Area) countries. The primary objective of the roadworthiness testing is to
ensure that vehicles are safe during their use. Thus, each vehicle in the EU has to undergo a
regular mandatory check-up according to EU and national technical, safety and environmental
requirements. The Directive’s preamble states that a periodic testing of roadworthiness contributes
to improving the environment by maintaining vehicles in good condition; however, this does not
mean that the Directive and its national implementations ban old vehicles with high emissions from
public roads. It basically requires the vehicle to work properly according to its original conditions.
In addition, for vehicles registered in 2006 or later, the Directive 2014/45/EU allows to perform the
emission test by checking only the on-board diagnostics (OBD). This means if the OBD reports no
malfunction of the exhaust-system, the emissions test is deemed to be passed without any physical
test (e.g. Schröder et al. 2015). However, test series show that a significant share, especially of
older vehicles, pass this test procedure that would not have passed a tailpipe test (Supnithadnaporn
et al. 2011). In this regard, e.g. Germany introduced a tailpipe test for all vehicles in 2018 and
considers to introduce a particle emissions test starting in 2021 (ADAC 2019).

4.1.2 Taxation for incentivising efficient and low-emission vehicle stocks
Fees and taxes are widely used policy instruments, especially in environment-related fields. By
internalising external costs, individual and institutional market participants can be pushed towards
a more desirable behaviour without any hard prohibitions. As the composition of national vehicle
fleets in regards to motorisation and emissions has a direct impact on air quality and the
achievement of climate mitigation goals, fees and taxes aim to motivate vehicle buyers to choose
a smaller, fuel efficient and low-emission vehicle. Of course, governments can also use taxes and
fees to influence a vehicle buyer's decision, whether he or she buys an old or new car.
Taxes and fees are linked to a range of different activities: acquisition, registration, ownership,
refilling and road use. In addition, in some countries bonuses or tax reimbursements are paid for
scrappage or export of used cars. Even though all of these presumably have an influence on car

 20
You can also read