Measures to contain private car growth in selected places
←
→
Page content transcription
If your browser does not render page correctly, please read the page content below
Information Note
                                      Measures to contain private car
Research Office
Legislative Council Secretariat
                                      growth in selected places

                                                                                         IN21/18-19

   1.          Introduction

   1.1       While Hong Kong has an efficient public transport system with
   diverse transport choices, the number of private cars in Hong Kong has climbed
   significantly in recent years. Between 2009 and 2018, the number of private
   cars on the road has grown at an average annual rate of 3.97%, outpacing the
   average annual real Gross Domestic Product ("GDP") growth per capita of
   about 2.1% during the same period. By end 2018, the number of private cars
   has already exceeded 560 000, which was at least 40% above the 2008 level.1
   Currently, seven out of 10 licensed vehicles in Hong Kong are private cars.
   There are concerns that increasing number of cars will exert pressure on
   limited road capacity, worsen traffic congestion, lengthen journey time and
   aggravate air pollution. 2 To deal with these problems, the Government is
   studying an electronic road pricing ("ERP") scheme to relieve congestion.

   1.2       At the request of Hon LAM Cheuk-ting, the Research Office has
   conducted this study to examine the policies and measures adopted in
   overseas places to suppress both private car ownership and use, and their
   effectiveness in achieving the intended outcomes. Two places namely
   Singapore and London of the United Kingdom ("UK") are chosen. The former
   is the world's pioneer in restricting car ownership through a vehicle quota
   system launched since 1990, and has recently set a target of zero car growth
   under the system. The latter has taken a number of measures in the past two
   decades to reduce car dependence. In addition to the usual fiscal measures
   to increase the upfront cost of ownership, it also focuses on controlling car use
   through congestion charging, and making alternatives to driving more

   1
        All cars must be licensed before they can be driven on road and registered with the Transport
        Department ("TD") when they are imported for use in Hong Kong.
   2
        Vehicle journey speed declined by about 2.4%, 15.4% and 14.2% in Hong Kong Island, Kowloon
        and the New Territories respectively from 2008 to 2017 based on data from TD's Annual
        Transport Digests.
appealing, accessible and affordable. Appendix I summarizes the measures
taken in Hong Kong and the two selected places.
2. Controlling car growth in Hong Kong
2.1 Like other major economies, Hong Kong's car growth has been mainly
driven by both economic and population growth. In the past four decades
(1979-2018), the annual growth rate of private cars was 3.86% on average,
well above population growth of 1.18%. Car growth slowed in the period of
1999-2008, but accelerated in the 2010s (Figures 1a and 1b). There were
over 565 000 private cars in Hong Kong by end 2018, 2.8 times more than in
1979 and 70% higher than in 2000. Given the small size and hilly terrain of
the city that have constrained the provision of road and parking
infrastructure, 3 the persistent rise of car ownership and their use remain
socio-economic and environmental concerns. 4
Figure 1a — Number of licensed cars from 1979 to 2018 in Hong Kong
600 000 565 213 (2018)
500 000
400 000 332 379 (2000)
300 000
200 000
100 000 148 867 (1979)
1979 1982 1985 1988 1991 1994 1997 2000 2003 2006 2009 2012 2015 2018
Source: Transport Department.
3
The road area constitutes 3.7% of the land area in Hong Kong, compared to 12% in Singapore.
4
According to the report of the Transport Advisory Committee ("TAC") on road traffic congestion
issued in 2014, rising car number is positively related to increasing car use. Between 2000 and
2017, the total annual mileage travelled by cars rose by 34%, compared to a 17% rise in mileage
of all vehicles.
2Figure 1b — Annual licensed car growth rate from 1979 to 2018 in Hong Kong
20.00% 15.30%
(1980)
15.00%
10.00%
2.26%
5.00% (2018)
0.00%
-5.00%
-10.00% -7.44% (1984)
1979 1982 1985 1988 1991 1994 1997 2000 2003 2006 2009 2012 2015 2018
Source: Transport Department.
Characteristics of car ownership in Hong Kong
2.2 There are about 76 cars per 1 000 population by end 2018, compared
to the ownership rate of 50 cars per 1 000 in 2000. Despite that, Hong Kong
has never been a car-dense city as compared with some other developed
economies.5 About 77% of the cars in Hong Kong were owned by individuals,
while the rest by companies in 2018. 6 According to the Travel Characteristics
Survey ("TCS") of the Transport Department ("TD") in 2011, about 14% of
households in Hong Kong owned at least one car. 7 The report also indicates
that there were district variations of household car ownership, with traditional
better off districts (e.g. Wan Chai) and newly developed districts (e.g.
Ma On Shan) having higher than average ownership rate. After 2011, TD has
not published further survey results on the ownership characteristics. 8
2.3 While about 40 000 cars were newly registered annually in the past
few years, there were about 100 000 transactions of car ownership transfer
each year, indicating a strong demand for cars in the used car market. 9 Small
to medium sized cars are the most popular cars, with most running on petrol
5
The number of cars per 1 000 population is 110 in Singapore (2018), 303 in London (2018) and
187 in Tokyo (2017).
6
The ratio has been steady between 2009 and 2018, according to figures obtained from the
Transport Department.
7
The last survey conducted was in 2011 and the final report was issued in 2014. According to
the survey report, those with higher income and living in private housing or distant location from
urban centres are more likely than others to have cars. See Transport Department (2014).
8
Data obtained from TD however indicated a declining trend in the proportion of youngsters
among the total number of people holding private car driving licence in the past decade.
9
The private car fleet is ageing too, with 36% of cars at or older than 10 years in 2018, compared
to 24% in 2009. The figures are compiled from data obtained from TD on the manufacturing
year of cars in each of the past 10 years.
3and only a minority on diesel and electric power. 10 Nevertheless, the report
of the Transport Advisory Committee on road traffic congestion issued in 2014
pointed out that private cars accounted for about 40% to 70% of the total
traffic flow on most of the major roads, but only carried 16% of the total daily
road-based passenger boarding. This was in contrast to the corresponding
figures of 5% to 25% and 71% for both buses and light buses. Private cars are
therefore considered a much less efficient passenger carrier and there are
views to control its growth so as to free up more road space.
Key measures to control car growth in Hong Kong
2.4 While the study of an electronic road pricing scheme to relieve
congestion remains underway, 11 the Government is used to relying primarily
on fiscal tools, namely the first registration tax ("FRT") and annual licence fee
("ALF"), to control car ownership. 12 Introduced in 1961, FRT was levied as a
form of "purchase tax" at 10% to curb the hastily growing demand for cars at
that time. 13 The tax rate was later adjusted in 1974 to 15% in order to raise
revenue to finance capital projects. In 1978, the FRT structure was also
reformed which made higher value cars subject to higher tax rates and the
rates and tax structure had since undergone adjustments a number of times
until 2011 (Figure 2). The biggest ever FRT increase was implemented in 1982
when FRT rates were doubled. Currently, FRT rates range from 40% to 115%
(See Appendix II).
10
About 53% of newly registered cars in 2018 were of taxable values above HK$100,000 but under
HK$300,000, according to figures obtained from TD. Moreover, about 76% of registered cars
by 2018 were of smaller engine sizes under 2 500 cc. Cars with engine sizes over 3 500 cc
accounted for 5.9%.
11
Back in the 1970s, the Government had already started to consider introducing a road pricing
scheme to control vehicle use. However, the plan had never been materialized despite
repeated studies. Recently, the Government has proposed a pilot scheme in Central Core
District and the proposal has been discussed by the Central and Western District Council.
12
Under the Road Traffic Ordinance (Cap. 374), the Chief Executive in Council also has power to
limit the number of vehicle of all classes to register. But there is no known record this has ever
been exercised. The law itself also does not spell out the circumstances where the
Chief Executive in Council can exercise the relevant power.
13
See Legislative Council Official Report of Proceedings, 1 March 1961.
4Figure 2 — First registration tax and annual licence fee adjustments
introduced, and newly registered cars from 1978 to 2018*
1978 1978: first registration tax was raised
1981
1979 and 1982: first registration tax and annual
1984 licensing fee were raised
1987
1983-1989: annual licensing fee was raised
1990
1990 and 1991: first registration tax and annual
1993
licensing fee were raised
1996
1994: first registration tax was adjusted
1999
2002
2003: first registration tax was raised
2005
2008
2011 2011: first registration tax was raised
2014
2017
12 000 24 000 36 000 48 000
Number of newly registered cars
Note: (*) See Appendix II for details on tax and fee adjustments.
Source: Legislative Council papers.
2.5 The 2014 report by TAC on traffic congestion considers that increases
in FRT and ALF were the most direct and effective means to suppress car
growth. Yet, the effects appeared to be rather short-lived and depended on
the level of increase. For instance, the number of newly registered cars
plunged immediately following the doubling of FRT and tripling of ALF in 1982
(Appendix II). Yet, the number began to rebound in 1985. 14 However, FRT
increases, along with ALF rises, in 1990 and 1991 did not lead to any reduction
in new car registrations (Figure 2). The last FRT increase in 2011 only slowed
the growth. Its effect was considered to be eroded by the concurrent tax
concession offered for environmental friendly cars. 15
2.6 The effects of ALF alone are much less obvious than FRT. It also
appears that ALF bears little relationship with car registration. For instance,
while ALF was adjusted upward in the range of 4% to 25% in each year from
1983 to 1991, car registration continued to climb (Figure 2 and Appendix II).
14
The FRT and ALF rises in 1982 contributed to a shrinkage in car ownership, hence reducing the
need for introducing a proposed electronic road pricing scheme. In the early 1980s, the MTR
Island Line was also opened, easing traffic congestion. See Transport Department (2001).
15
The concession for newly registered environment-friendly petrol private cars increased from
30% (with a cap at HK$50,000 per car) in 2007 to 45% (with a cap at HK$75,000 per car) in 2011.
The concession was ended in 2015.
5Despite its insignificant effects, ALF hikes used to be as controversial as FRT
increases. In 2001, when the Legislative Council Members discussed a
proposed 10% increase in ALF to raise government revenue, it was concerned
that the proposed hike would result in car owners ditching their cars and
hence affecting the livelihood of thousands of people in the car industry. The
proposal was finally voted down though the Government considered that the
raise would not put heavy burden on car owners.16 The last AFL increase was
in 1991. 17
2.7 Apart from tax measures, restrictions in parking provision may also
discourage car ownership. While the Government does not deliberately
restrain parking supply to manage car ownership, priority in the provision of
parking spaces is accorded to meeting the demand of commercial vehicles.
The Hong Kong Planning Standards and Guidelines sets minimum standards for
parking provisions in different land uses, and requires a 15% or 25% discount
of parking provision in new housing developments within 500 metres from a
railway station. As a result, despite 53% growth in private cars during
2006-2018, parking lots increased only by 11% over the period. 18 Whether
continued tight supply of parking spaces will slow the growth in private cars in
the long run remains to be seen. Meanwhile, it has been the policy of the
Government to use rail as a backbone for public transport and at least 70% of
the population has been within the catchment area of railway stations.19
Despite this, the issues of reliability, capacity and fares of rail service have
drawn much criticism in recent years, which might have reduced the
effectiveness in lowering car demand.
3. Overseas trends of car ownership and use
3.1 Globally, the estimated number of cars stands at about 1.1 billion.
It is expected to rise to 1.5 billion by 2025 and 2 billion in 2040. 20 In 2017,
about 70.8 million new cars were sold worldwide, compared to 45.4 million in
2005. China is now the biggest car buyer in the world, accounting for 35% of
16
See Legislative Council Official Record of Proceedings, 20 June 2001.
17
ALF for a private car ranges from HK$3,815 to HK$11,215 depending on the cylinder capacity.
18
Reflecting significant car growth over the years, the ratio of the number of public parking lots for
private cars to the number of registered private cars has dropped from 1.51 to 1 in 2006 to 1.10
to 1 in 2018. See Audit Commission (2019).
19
See Transport and Housing Bureau (2014).
20
See World Economic Forum (2016).
6world car sales or registration of cars in 2017, up from 8.7% in 2005. 21 In
contrast, car sales in developed economies like the United States, Japan and
Europe, have reportedly slowed during the same period.
3.2 There are studies suggesting that developed economies like the
United States and the UK have entered a stage of stagnant or even declining
car ownership and use. 22 Continuing urbanization that favoured high-density
development, improved provision of mass public transport, and rising cost of
car ownership are some of the factors that could have explained the
phenomenon. There are also suggestions that people, especially the youth,
are becoming less dependent on car with the growing popularity of ride-hailing
and car-sharing services, and the substituting effect of smartphones and
e-commerce. 23 These developed economies are also increasingly providing a
transport environment with diverse mobility choices so that people can
become more willingly and easily to ditch their cars.
3.3 Car ownership in developing economies however has taken a
different growth path, with many authorities already taking policy intervention
to curb the adverse economic and environmental impacts of an exponential
car growth fuelled by economic progress. In Beijing, for example, car use
restriction measures, such as the "odd-even scheme", 24 were introduced prior
to the Beijing Olympic Games in 2008. While similar measures remain in
force, they have not been adequate to suppress the growing demand for cars.
As such, in 2011, Beijing rolled out a vehicle quota system mostly based on
lottery. The measure has been effective in controlling car growth. In 2017,
the small passenger cars growth rate was 2.9%, compared to 26.5% in 2010. 25
Other Mainland cities like Shanghai, Guangzhou and Shenzhen have also in
place a similar vehicle quota system, with car quota allocated by way of
auction or a combination of auction and lottery.
21
See International Organization of Motor Vehicle Manufacturers (2019).
22
For example, car use was unchanged in France since 2003, while car use in Japan has been
declining since 1999. In the US, the decline occurred since around 2005 or even earlier.
These changes however are not uniform across all age groups. It was reported that young
adults in the US and UK had made fewer car trips than other cohorts, and had delayed getting
driving licences. See International Transport Forum (2013) and Rand Corporation (2014).
23
See Schroders (2015).
24
Under the odd-even scheme, cars are allowed on the road on alternating days, according to
whether the last digit of the licence plate is odd or even.
25
See《 2018 年 北 京 交 通 發 展 年 報 》 。
73.4 Measures to restrain car use are also seen in other emerging
economies in Asia. In Jakarta, the capital of Indonesia, it has implemented an
"odd-even" scheme for road rationing in two streets in the Central Business
District ("CBD") in 2016. Reportedly, it is also planning to launch a road
pricing scheme as early as in 2019. 26 Bangkok is mulling solutions to its smog
problems partly caused by its growing vehicle population. 27 It was reported
that the Bangkok authority had once considered introducing a similar measure
adopted in some parts of Japan where no one can register their cars without a
proof of parking space. 28 While such a demand management policy is not
adopted, its government is currently carrying out a five-year project to ease
traffic congestion at major roads with the use of artificial intelligence and big
data technology. 29
4. Controlling car growth in Singapore
4.1 Similar to the situations in other developing cities, Singapore had
already faced the pressure of road congestion during the 1960s when its road
infrastructure and public transport remained under-provided. Due to the lack
of land, the Singapore government was quick to recognize the necessity of
controlling vehicle growth for economic development unimpeded by
worsening road congestion. At that time, it had already imposed taxes to
suppress car ownership. During the 1970s, not only taxes were adjusted
upwards, but other road use restriction measures like congestion charging
were also introduced. Yet, the short-lived effect of the tax measures against
car ownership finally prompted the government to directly cap vehicle growth
through a vehicle quota system ("VQS") that awards the right to own a car to
people who offer the highest monetary bids. In recent years, Singapore also
aspires to become a "car-lite" place where its residents can have access to
different forms of active mobility from cycling, walking, personal mobility
devices and public transport.
26
See Jakarta Post (2019).
27
Thailand's car ownership was also heavily influenced by government policies for local car
industry. For instance, the Thai government had introduced a first-time car buyer scheme to
boost car sale between 2012 and 2017. See Bangkok Post (2015) and (2019).
28
The proof of parking policy in Japan was said to aim to prevent illegal off-street parking and not
an intended measure to control car ownership. See Barter (2011).
29
See Thai PDS World (2018).
8Characteristics of car ownership in Singapore
4.2 At present, there are about 550 000 private cars in Singapore, which
doubles the level in 1990 (Figure 3a and 3b). Among the cars, less than 5%
are registered as company cars. Although Singapore has implemented more
measures to restrict car growth and use, it has a car density of 110 cars per
1 000 population which is higher than that of Hong Kong. Similar to
Hong Kong, most car owners in Singapore have cars of small engine size below
or at 2000 cc, which accounts for 85% of the total. About 83% of the cars
were at or below 10 years in 2018, which however, were lower than 96% in
2008, indicating that more cars were used beyond 10 years in recent years. 30
Cars accounted for 27% of all journeys made in 2016. 31
Figure 3a — Number of cars from 1962 to 2018 in Singapore
700 000 551 575
600 000 (2018)
500 000
400 000
300 000
200 000 271 174 (1990)
77 379 (1962)
100 000
1962 1966 1970 1974 1978 1982 1986 1990 1994 1998 2002 2006 2010 2014 2018
Source: Land Transport Authority.
Figure 3b — Annual car growth rate from 1962 to 2018 in Singapore
15.0% 10.4% (1962)
10.0%
0.9%
5.0% (2018)
0.0%
-5.0%
-10.0%
-15.0%
-20.0%
-24.1%
-25.0% (1974)
-30.0%
1962 1966 1970 1974 1978 1982 1986 1990 1994 1998 2002 2006 2010 2014 2018
Source: Land Transport Authority.
30
See Land Transport Authority (2019a).
31
See Land Transport Authority (2018b).
9Measures to control car growth
4.3 Singapore has taken a multi-pronged approach, from fiscal to
planning measures, to control car ownership and manage car use.
Summarized below are the major measures adopted. Among them, VQS
directly caps car growth while motor vehicle taxes and parking measures
increase the costs of car ownerships to lower demand for car. To reduce car
use, Singapore also imposes more measures like congestion charging, while at
the same time seeks to improve alternative mobility options.
Cap on car growth
4.4 VQS has been introduced since May 1990, following a report by the
Select Committee on Land Transport of the Parliament of Singapore. 32 At
that time, the Committee was concerned that the effectiveness of raising the
cost of car ownership through tax measures could be weakened by faster
income growth of the residents over time. Since the tax measures could not
provide a certainty on car growth, the Committee's report concluded that a
quota system was necessary to keep vehicle growth at the intended and
acceptable level.
4.5 To restrain car growth, VQS incorporates three core designs for its
implementation: (a) universality: the system applies to all vehicles except
public buses. For cars, those with engine size at or below and above 1 600
are put under two separate categories of quota; (b) rationing by market-based
pricing: the price (known as quota premium) paid for owning a car is
determined by the market through a regular auction of Certificate of
Entitlement ("COE"). The online COE bidding is run every month; and
(c) time-limited right: those successfully bid for COE can only keep the right for
a 10-year period. Upon expiry, car owners may extend by paying the
prevailing premium or deregister their cars. If a car is deregistered before the
10-year period, a partial rebate of ARF and COE premium is offered to the car
owners.33 A COE can only be transferrable with the car together.
4.6 The Singapore government decides the number of vehicle quota
available each year by considering the intended target of annual growth rate of
newly registered cars, the amount of deregistered cars and unallocated quota.
The target growth rate is determined by the policy objectives which now aim
to make Singapore "car-lite". Hence, between May 2009 and February 2015,
32
See Parliament of Singapore (1990).
33
See Fang (2016).
10the target growth rate was reduced five times from 3% to 0.25%. In early
2018, the rate was further reduced to zero. 34
4.7 Reflecting the quota supply and market demand, the quota premium
of COE has fluctuated over the years. 35 During the 2000s, extra quota was
supplied after the initial success of electronic road pricing. The increase in
supply helped drive the premium to as low as an annual average of S$11,000
(HK$53,790) in 2006. However, this situation was reversed after 2010, amid
higher population growth and delays of rail expansion project. That
eventually saw a sharp hike of premium after 2010 as the authorities held back
quota supply (Figure 4). 36 The surge in premium resulted in rising cost of car
ownership to the extent that 52% of the acquisition cost of a mid-range car in
2012 was attributed to COE premium which was even higher than the total
operating cost of a car with seven-year usage.37 Nevertheless, the Singapore
government completed a review in 2013 which found that there was a general
consensus that the COE system remained fundamentally sound and effective in
managing vehicle growth, despite inadequacies identified in the bidding
mechanism. The market-based approach is considered the most appropriate
way to allocate COE for that car ownership is a non-basic good, which could
not be treated the same way as necessities such as housing and health. 38
Figure 4 — Annual average car quota, bids and premium 2002-2018*
Singapore dollar Number of quota/bids
S$74,690
$80,000 (HK$463,078) 100 000
79 446
80 000
$60,000
59 436
53 966 60 000
$40,000
38 872
40 000
S$33,038
$20,000 S$11,187 16 960 (HK$191,951)
(HK$54,704) 20 000
8 534
2002 2003 2004 2005 2006 2007 2008 2009 2010 2011 2012 2013 2014 2015 2016 2017 2018
Average quota premium Total annual quota Total bids received
Note: (*) Cars refer to cars with engine size below or at 1 600 cc.
Sources: Land Transport Authority and SGCharts.
34
See Land Transport Authority (2019d).
35
The quota premium once reached the low of S$2 (HK$10.3) in November 2008 and hit the
highest of S$92,100 (HK$581,000) in January 2013.
36
See Hamnett et al. (2019) and Ministry of Finance (2002).
37
See Huang et al (2016).
38
See Fang (2016).
11Increasing cost of car ownership
4.8 Singapore has imposed multiple motor vehicle taxes to discourage
car ownership. These taxes include (a) import duty; (b) registration fee;
(c) additional registration fee ("ARF"); (d) annual road tax (equivalent to HK's
vehicle licensing fee); and (e) used car surcharge. 39 The most significant cost
among them is ARF, which is equivalent to HK's FRT. ARF had already been
imposed as early as in 1968 when the rate was initially set at 10% of the car
value. Since then, it had been raised a number of times to the peak of 175%
in 1983 to curb the continued car growth. The import duty, ARF and road tax
were reduced in the years following the introduction of vehicle quota system
and electronic road pricing in the 1990s. In particular, the most costly ARF
was progressively reduced from 175% to 100% in 2008 until 2013 when a
tiered structure of ARF replaced the ARF flat rate applied on the value of car. 40
4.9 As to parking provision, it was the Singapore government's policy in
the past to supply sufficient parking in each development to minimize the need
for cars queuing and circulating on roads. 41 Yet such a policy of parking
supply has been gradually changed. Parking provision has been increasingly
lowered to restrict car use in wider area. For example, since 2005, the
parking policy has been adjusted to allow the number of parking lots in a
development close to a railway station be reduced by up to 20% of the
minimum standard upon approval by Land Transport Authority ("LTA"). In
addition, to relieve congestion, the government had in the older days imposed
a surcharge on non-residential parking places to discourage driving into the
city centre. 42
4.10 In March 2018, to support the "car-lite Singapore" vision, the law was
amended to allow the authorities to specify parking provision and set out
not just the minimum provision but also the maximum provision as well.
Since February 2019, LTA designated five car-lite new growth precincts in
which application for parking provision by developers will even be determined
39
A S$10,000 (HK$58,100) surcharge is imposed on cars older than three years imported to and for
use in Singapore.
40
See Chia (2001).
41
See Fang (2016). There are currently about 690 000 public parking places for cars managed by
the Housing & Development Board and the Urban Renewal Authority, compared to nearly
620 000 car population including private cars, private hire cars, and others.
42
In 1975, the Parking Places (Surcharge) Act was passed to allow the government to impose a
surcharge on a non-residential parking lot within a designated zone. Initially, the surcharge
was S$20 (HK$41.6) per lot in the core of the zone and was last revised to S$60 (HK$240) in
1989. It was reported the charge has been dropped, though the law remains. See Barter
(2011).
12on a case by case basis due to greater connectivity of these areas to public
transport.43 While the government is reducing new supply of car parking, the
two largest public car park providers in Singapore, i.e. the Housing &
Development Board ("HDB") and Urban Redevelopment Authority, currently
provide as many as 690 000 parking lots, representing about 1.2 public parking
lots to one private car. 44
Barriers to car use
4.11 Singapore introduced the world's first road charging schemes, known
as area licensing scheme for CBD area, 45 and road pricing scheme for
expressways in 1975 to relieve traffic congestion. In 1998, the schemes were
upgraded as an ERP scheme, using technology to charge and monitor traffic
into the charging zone. 46 In its initial years of operation, the scheme
successfully reduced traffic by as much as 44%, including a 73% reduction in
cars entering the zone, amid significant rise in car population in the absence of
VQS at that time. 47 However, since the road pricing scheme aims to optimise
road usage, it is considered effective in reducing car use and relieving
congestion only in congested areas where charging applies, 48 and its impact
on car ownership appears not significant given the presence of VQS.
Improving alternative mobility options
4.12 As VQS delayed car demand, the Singapore government has also
stepped up efforts to upgrade its public transport system as a substitute for
43
See Land Transport Authority (2018a).
44
The Singapore's car parking space ratio is derived from dividing the number of public parking lots
for cars by the total number of cars excluding private hire cars and company cars. Meanwhile,
the parking fee in Singapore is markedly lower than in Hong Kong. For example, the monthly
season parking fee for a HDB parking lot was S$80 (HK$465) for the resident's first car, and
S$90 (HK$523) for the second car or a non-resident's car, whereas the lowest monthly rate of a
car parking lot provided by the Housing Authority in Hong Kong is HK$1,150. In 2016, the
government raised the parking fee for the first time in 14 years. See Housing & Development
Board (2016).
45
The scheme was a manual version of ERP under which drivers had to buy a licence to enter into a
restricted area with a size of 720 hectares.
46
Depending on the time of entry, the charge for a private car ranges from S$0.5 (HK$2.9) to
S$3 (HK$17.4) as at July 2019 for entry to CBD through one of the ERP gantries. See
Asian Development Bank (2015).
47
See US Department of Transportation (2008).
48
The Singapore government is planning to upgrade the ERP system using global satellite
navigation technology which will enable distance-based charging in 2020.
13car. Its goal is to develop an integrated public transport system which can
offer seamless transfer, easily accessible service, reliable and comfortable
travel journey at affordable fares. The expansion of the rail system has
enabled 60% households reaching a railway station within a 10-minute walk in
2016 and the coverage is planned to reach 80% by 2030. 49 In terms of bus
service, since 2016, it has adopted a bus contracting system that allows the
government to directly determine the bus service provided and the service
standards, 50 thereby enabling quicker response to transport demand than the
previous privatized industry model. The government has also increased the
bus fleet by 35% between 2012 and 2017, and focused on introducing more
new feeder bus service connecting to railway stations to reduce the waiting
time of such service from over 10 minutes to six to eight minutes. 51
4.13 To increase and diversify mobility choices, Singapore has recently
also launched a pilot on "on-demand public bus" service, with routes and
schedules based on real-time commuter demand, instead of following fixed
routes and pre-determined timetables. 52 In addition, the Singapore
government has allowed the continued expansion of ride-hailing services amid
a pending regulatory system change, and has formalized the regulations of
personal mobility devices like electric scooters used on footpaths. The cycling
network and sheltered walkways are also being expanded to facilitate non-car
travel. 53
Effectiveness of the measures and issues of concern
4.14 Among the above measures, VQS has made car growth more
manageable and the car fleet size effectively capped at a level desired by the
Singapore government. Without VQS, the Singapore government estimated
that the number of car could have hit 1 million by 2014, far exceeding the
number of 600 000 at that time. It would have led to worsening congestion,
49
The rail network has increased from about 90 km in length in 2002 to 200 km in 2017.
50
Under the system, bus companies bid to run packages of bus routes while LTA retains the
ownership and control of the bus assets and infrastructure, and sets the bus fares.
51
See Ministry of Transport (2019a).
52
Using a mobile application, commuters can book a bus ride by requesting to be picked up and
dropped off at any bus stop within defined areas in CBD. The trial lasted six month until
mid-June 2019. By May 2019, there were 26 000 trips booked. However, LTA has not
planned to expand the scheme due to cost issues.
53
See Centre for Liveable Cities Singapore (2016).
14shortage in parking places and environmental side effects. 54 Probably
because of gradual reduction in car growth target under the vision of a
"car-lite" city together with continued expansion of public transport network,
amid population increase, the household car ownership rate has declined in
recent years to 33.5% in 2018, compared to 41% in 2012. 55
4.15 One of the often cited concerns about VQS is whether the system
favours the rich, thus concentrating the car ownership in the hands of the well
off. However, car ownership among different income groups showed a less
acute picture. According to government statistics, car ownership rate among
the top 10% income households has declined modestly from about 65% in
2006 to 60% in 2018, while the corresponding rate among the bottom 10%
income households has maintained at around 11%. 56 At the same time, it
was reported that more households living in government-subsidized housing,
i.e. HDB flats, own multiple cars, 57 probably due to their relatively lower
housing cost burden. Nevertheless, the average mileage per car has fallen
persistently from about 20 800 km in 2007 to 16 700 km in 2016, indicating an
overall reduction in car usage. 58 Over the same period, rail patronage has
doubled to over 3 million a day. Increase in public transport has however
resulted in higher congestion in trains and buses. Hence, while diverting
more people to use public transport, the Singapore government has to deal
with the challenge of rail capacity and peak-hour transport demand.
5. Controlling car growth in London, the United Kingdom
5.1 Like elsewhere in the UK, traffic congestion has been one of the most
concerned transport issues in London. By end 2018, eight out of 10 vehicles
in London were private cars. In the past, increasing provision of roads had
helped relieve congestion but it has become less and less effective as more
roads tended to induce more traffic. While car ownership rose and
contributed to congestion, the UK government stated in a white paper in 1998
54
See Ministry of Transport (2019b). Indeed, the Singapore government had also implemented a
Weekend Car Scheme in 1991, which was later revised as an Off-Peak Car Scheme in 1994, and
Revised Off-Peak Car Scheme in 2010, for people to enjoy car ownership without contributing to
congestion. These cars can only be driven during certain non-peak period and time. In 2018,
there were still 14 000 such cars, compared to 50 000 in 2010.
55
See Department of Statistics (2019).
56
Ibid.
57
The number of such households grew by 77% between 2005 and 2011. See Strait Times (2017).
58
Ibid.
15that it did not want to restrict car ownership as the UK people should be able
to share the fruits of economic prosperity. 59 Instead, it called for an
integrated transport planning that could provide diverse and sustainable
commuting choices to the public. Following the establishment of the Greater
London Authority in 2000, the city has also largely followed this approach to
minimize car use to counter the negative impacts of rising car ownership. In
its latest Transport Strategy 2018, the Mayor of London pledged to adopt a
system of policies and strategies to help Londoners use cars less, and walk,
cycle, and use public transport more. 60
Characteristics of car ownership in London
5.2 London's car growth has not only been flattened in recent years but
also growing at a slower pace than the rest of the UK. Based on the available
statistics, between 2009 and 2018, the average annual growth rate of car was
just 0.26%, falling behind both population and economic growth. At present,
there are about 2.66 million licensed cars, compared to 2.26 million in 1995
(Figure 5a and 5b). While car ownership per 1 000 population has declined
from 334 in 2000 to 303 in 2017, household car ownership has been rather
steady in the past decade, with 59% households owning at least one car.
5.3 In London, household car ownership rises with household income but
it flattens when the income reaches a higher level. 61 According to the London
authority, there is no single reason for owning a car and car ownership usually
reflects "a combination of practical and emotional reasons." For example,
residents with children are more likely to own a car across all income groups,
than those without children. There are also spatial variations of car
ownership, with inner London borough residents, including those who are
wealthier, are less likely to own a car.62
59
See UK Government (1998).
60
The London authorities promote a "healthy streets" approach, by making it more comfortable
and easier for people to ditch the unhealthy travelling behaviour and take up walking, cycling or
public transport in their daily commuting.
61
See Mayor of London (2015).
62
Ibid.
16Figure 5a — Number of cars from 1995 to 2018 in London
Thousand
2 700
2 600 2 661
(2018)
2 500 2 578
(2007)
2 400
2 300
2 200 2 260
(1995)
2 100
2 000
1995 1997 1999 2001 2003 2005 2007 2009 2011 2013 2015 2017
Source: Greater London Authority.
Figure 5b — Annual car growth rate from 1995 to 2018 in London
4.00%
3.36% (1996)
3.00%
2.00%
1.00%
0.00%
-0.18%
-1.00% (2018)
-1.46% (2009)
-2.00%
1995 1997 1999 2001 2003 2005 2007 2009 2011 2013 2015 2017
Source: Greater London Authority.
Measures to control car growth
5.4 Unlike Singapore, there is no direct quota system employed by the
UK government or the Greater London Authority to limit car growth at an
intended rate. The car growth suppression measures are primarily taxation in
nature. Yet, there are also other measures or initiatives that seek to
discourage both car ownership and car use, such as congestion charging, car
sharing and parking levy.
Increasing the cost of ownership
5.5 There are a variety of motor vehicle taxes in the UK, which raise the
acquisition and ownership cost of a private car. All car purchase for private
17use is subject to the value-added tax ("VAT") which now stands at a rate of
20% of the car cost. 63 In addition, all cars first registered in the UK must be
charged the Vehicle Excise Duty ("VED"), also known as road tax, before they
can be driven on roads. 64 The VED level ranges from £25 (HK$262) to £2,070
(HK$21,652) for the first 12 months for cars, depending on the level of carbon
emission levels. The annual road tax from the second year onward will be a
standard rate of £140 (HK$1,464) or £450 (HK$4,707). 65
Barriers to car use
5.6 Congestion charging is considered as an effective measure to control
vehicle use by levying a fee upon driving into a designated area within
specified time. Since 2003, London has implemented such a scheme with an
initial charge of £5 (HK$63.7) per day, with discounts/exemption given to
eligible users (e.g. residents' cars and vehicles with nine or more seats). It
was reported that the charging scheme has successfully reduced the number
of car entering into the zone encompassing parts of seven London boroughs by
33% in the first year of operation. 66 In addition, the mileage travelled by cars
between 2002 and 2004 has also declined within London. 67 There was also a
marked increase in the number of people taking bus entering into the zone
between 2000 and 2014. 68 The decreasing traffic trend has remained, as
evidenced in the recent traffic monitoring that car traffic in 2018 in Greater
London was still about 15% below 2000.
5.7 However, at the time of introduction, congestion charging was not
viewed as a single, stand‐alone policy which would solve London's transport
problems on its own. It was made as part of an integrated package of
transport to improve the overall traffic management. 69 After the scheme's
operation for 15 years, political opposition to the scheme has reportedly
become minimal and public support is now widespread. Yet, whether the
scheme had any impacts on car ownership remained uncertain and less
63
The rate has come into force since January 2011. The previous rate was 17.5%. This tax is
applied to all vehicles in addition to the first registration fee of £55 (HK$575).
64
The tax was introduced in 1920 for raising fund for road construction and maintenance.
Formerly based on horsepower, the tax is now based on carbon emission of the vehicle.
65
See Automobile Association (2019).
66
See Transport for London (2006).
67
There were decreases of 6.4% and 3.3% in the seven London boroughs and within Greater
London. See Department for Transport (2019).
68
There was a one-third increase between 2000 and 2004, due to the charging, an increase in
distance operated by buses, and a decrease of bus fares. See Department for Transport (2019).
69
See Robert Schalkenbach Foundation (2012).
18discussed. Indeed, the car growth rate dropped to around zero in 2006, after
the charge was raised to £8 (HK$113) in 2005, but rebounded in 2007.
Although the charge was further increased to £10 (HK$125) in 2011, the car
growth rate continued to climb in the subsequent years (Figure 6). This may
suggest that congestion pricing is not a dominant factor affecting car
ownership. For instance, there was a negative car growth in 2009, after the
start of the global financial crisis in 2008.
Figure 6 — Annual car growth rate and adjustments of congestion charge
4.00% Congestion charge level
3.36%
Global financial crisis in 2008
3.00%
2.00% £11.5
£8
1.00%
£5
0.00%
-0.18%
£10
-1.00%
-1.46%
-2.00%
1995 1997 1999 2001 2003 2005 2007 2009 2011 2013 2015 2017
Source: Transport for London.
5.8 Apart from imposing a fee on road use, under the Greater London
Authority Act 1999, all London boroughs and Transport for London are
empowered to introduce a workplace parking levy. Such a levy can be
imposed on any employer who provides free parking to their employees in
order to discourage driving to work. 70 No local authority in London has ever
attempted to implement the levy until recently in Hounslow where a public
consultation has just been completed for introducing a levy in 2020.
A decision is pending within 2019. According to Hounslow Borough Council,
car travel accounts for about 50% of all employment trips in Hounslow which
has resulted in severe traffic congestion.71 One of the levy options is charging
an average of £3 (HK$31.4) per day per space and the levy revenue collected
will be used to improve public transport. It is reported that several other
boroughs like Camden and Merton are also considering the levy. Workplace
70
So far only the city of Nottingham in the UK is implementing workplace parking levy introduced
since 2012. The city charged employers with at least 11 parking places at an annual levy of
£415 (HK$4,341) per space in 2018. The levy generated gross revenue of £9.2 million
(HK$109 million) in 2014-2015 which was used to improve public transport. Half of the
employers passed the levy to their employees. See Nottingham City Council (2019).
71
See London Borough of Hounslow (2019).
19parking levy has now been recognized as part of the traffic reduction strategies
under the London Transport Strategy. Apart from the levy, the Strategy also
sets out to restrict car park provisions in new developments in certain districts
to promote a car-lite environment.
Improving alternative mobility options
5.9 As there are cost barriers to frequent car use, there is a growing
popularity of car clubs in London, a kind of innovative member-based
car sharing service charged on a pay-as-you-drive basis. The idea of car club
is built on the argument that a private car is often left to be idled most of the
time. Hence, a car sharing system can eliminate this inefficiency, and help
members save costs of car ownership. There are about 10 car clubs in
London, with over 190 000 members and about 3 000 cars. 72 According to a
survey to evaluate the impacts of car clubs, a shared car can remove up to
10 cars off the road, and car ownership among members also declined after
joining the club. 73 Despite their potential benefits, their developments are
often constrained by land resources, planning red tapes and funding support.
The Car Club Coalition, which consists of Greater London Authority, Transport
for London and London boroughs, has been formed to support their
development and published a Car Club Strategy with a commitment to
increase the number of car club members to 1 million by 2025. As part of the
implementation plan under the Transport Strategy 2018, some London
borough authorities have pledged funding and assistance in planning for
parking provisions. 74
5.10 Public transport is also seen as an essential component in London's
transport strategy to reduce car dependency. According to the Mayor's
transport strategy, 71% of the private vehicle trips made by London residents
each day can be feasibly replaced by one of three alternatives namely public
transport, walking and cycling. 75 To enhance its attractiveness to commuters
and make rides more affordable, transport fares have been frozen since
2016. 76 As part of a range of measures to encourage people to switch from
their cars to public transport, a "Hopper fare" was introduced in
72
See Greater London Authority (2017) and Transport for London (2019a).
73
See Carplus (2017).
74
See Mayor of London (2018c). Funding has also been awarded by Mayor of London on setting
up an electric vehicle car club in Westminster.
75
See Transport for London (2018).
76
The freeze will last for four years until 2020. Prior to 2016, the fare has only been adjusted in
line with inflation for consecutive eight years. See Mayor of London (2018a).
20September 2016 to allow unlimited travel on bus and trams within an hour for
the price of one single journey at £1.5 (HK$15.7). The first two years saw the
number of Hopper journeys hit a total of 220 million or an average of 440 000
on a weekday. 77 Apart from that, the night service of the London
Underground was also expanded. The London authority is also stepping up
investment to reverse the declining bus patronage trends in recent years by for
examples introducing 170 more bus lanes schemes, and adjusting traffic signals
to save passengers time. 78 Tapping the benefits brought by smartphone
communication technology, the Transport for London has also introduced a
one-year trial of "on-demand bus service" in Sutton Borough. 79 In addition,
like Singapore, ride-hailing services are expanding in London in recent years,
while the London authorities have plans to improve the overall environment
for pedestrian and cyclists in streets.
Effectiveness of the measures
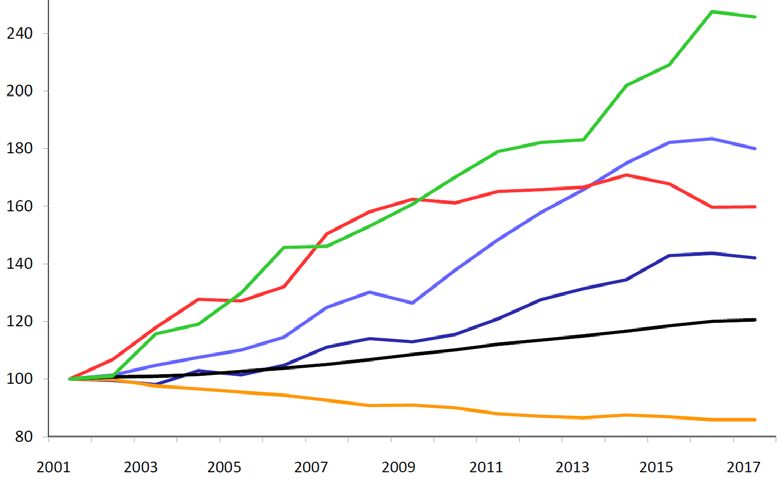
5.11 The measures taken by the London authorities aim to reduce car use
of the Londoners. According to the survey of Transport for London, car
owners have made 34% fewer trips on a daily basis between 2005-2006 and
2017-2018. 80 In addition, the number of cars crossing Central London and
Inner London boundary (areas with most traffic) has also decreased 35%
between 2000 and 2017 and 17% between 2000 and 2016 respectively.
Overall, private transport, principally by car, accounted for 36% of total
number of trips made by Londoners in 2017, down remarkably from 46% in
2001. In sum, demand for public transport has seen strong growth while car
usage has seen continued reduction (Figure 7). By implementing its
Transport Strategy outlined in 2018, the Mayor of London targets by 2041 to
cut 3 million more car trips per day in London, lower car trips share to 20% by
2041, and also reduce the number of cars owned in London by a
quarter million.
77
See Mayor of London (2018b).
78
See Mayor of London (2017).
79
See Transport for London (2019b).
80
See Transport for London (2018).
21Figure 7 — Growth in journeys by different modes 2001-2017
Index: 2001=100
Cycling
Rail
Bus
Underground
Population
Car
Source: Transport for London.
6. Concluding remarks
6.1 Hong Kong has seen 3.97% annual growth of private cars in the past
decade from 2009-2018, compared to just 1.88% annually in the previous
decade. Growing number of cars, which has exceeded 565 000 now, has
sparked public concerns over worsening traffic congestion and other
environmental adversities. The Government has relied on fiscal and tax
measures to keep the car growth at bay, but its deterrent effect appeared to
be rather short-lived and the level has remained constant for years. As
private car is considered a less efficient passenger carrier, there are views that
its growth should be contained to ensure efficient use of road space.
6.2 In Singapore, car growth has been restricted for decades through
various means in a multi-pronged approach. The most notable is VQS which
has come into play since 1990 in view that the tax measures were not
adequate enough to suppress car growth. VQS has effectively limited car
number at an intended level. However, there are controversies over whether
it is an equitable policy as richer people can often afford to pay higher price to
secure the right to own COE. To reduce dependency on cars, Singapore is
also a pioneer in road pricing scheme which helps make car driving in
high-traffic areas more costly. With these measures in place, Singapore has
22in recent years pledged to become a "car-lite" city, by for example tightening
supply of car parks in areas with high connectivity. While these constraining
measures are effective in reducing car use, it at the same time poses pressure
on the government to improve, expand and innovate the public transport
services to ensure reliability and accessibility.
6.3 The approach taken by London is softer in general, and has focused
more on car use, than ownership. Its tax measures on car ownership, such as
registration or licensing fees, are also less harsh than Singapore and Hong Kong.
The city has also been relying on the congestion charging scheme to discourage
driving into the city centre and has resulted in less car trips made within the
city. In recent years, frozen public transport fares have incentivized greater
usage. Together with continued improvement of public transport network
and cycling track, there has been a gradual shift of behaviour with reduced use
of car in the city. London also has the biggest car sharing network in the UK.
Under its latest Transport Strategy, the new mobility solution is seen as an
alternative to private car ownership and will be increasingly supported by local
authorities in the years ahead.
Prepared by Cheung Chi-fai
Research Office
Information Services Division
Legislative Council Secretariat
11 September 2019
Tel: 3919 3583
-------------------------------------------------------------------------------------------------------------------------------------------------------------------
Information Notes are compiled for Members and Committees of the Legislative Council. They are not legal or other
professional advice and shall not be relied on as such. Information Notes are subject to copyright owned by The
Legislative Council Commission (The Commission). The Commission permits accurate reproduction of Information Notes
for non-commercial use in a manner not adversely affecting the Legislative Council, provided that acknowledgement is
made stating the Research Office of the Legislative Council Secretariat as the source and one copy of the reproduction is
sent to the Legislative Council Library. The paper number of this issue of Information Note is IN21/18-19.
23Appendix I
Key characteristics of car growth controlling measures in Hong Kong, Singapore and London
Hong Kong Singapore London
City characteristics
City size (land) • 1 106 sq km. • 721.5 sq km. • 1 572 sq metre.
Population • 7.451 million (2018). • 5.638 million (2018). • 8.8 million (2017).
GDP per capita • HK$359,996 (2017). • S$87 108 (2018) (HK$506,100). • £48,857 (2017) (HK$491,000). 1
Length of road network • 2 123 km (2018). 2 • 3 500 km (2017). • Major roads: 1 807 km (2018).
• Minor roads: 13 000 (2018).
Car ownership characteristics
Cars per 1 000 people • 76 (2018). • 110 (2018). • 303 (2018). 3
Share of households owning car • 14% (2011). • 33.5% (2018). • 59% (2016-2017).
Year-on-year car growth rate • 2.26% (2018). • 0.53% (2018). • -0.146% (2018).
Average car mileage • 10 990 km (2017). 4 • 16 700 km (2016). • 8 467 km (2017). 5
1
The figure refers to gross value added ("GVA") of London, which is similar to GPD but it excludes subsidies and taxes.
2
The length of road network in Hong Kong in 2018 is 10% more than in 2000.
3
The figure is derived by dividing the number of cars by population of the year (mid-year).
4
The figure is derived from dividing the aggregate private car mileage by the number of licensed cars in 2017.
5
The figure is derived from dividing the aggregate private car mileage by the number of licensed cars in 2017.
24Appendix I (cont'd)
Key characteristics of car growth controlling measures in Hong Kong, Singapore and London
Hong Kong Singapore London
Motor vehicle taxes and fees
Import duty • No. • 20% on open market value. • Yes (from non-EU origin).
Sales tax/value-added tax • None. • 7% GST on total cost. • VAT: 20%.
Registration fee • HK$100 (administration fee). • S$220 (HK$1,263). • £55 (HK$575).
First registration tax rate • 40%-115%. • Additional Registration Fee: • n.a.
100%-180%. 6
Annual licensing fee/road • Based on engine size, the fee • Based on engine size and car age, • £25-£2,070 (HK$262-HK$21,652)
tax ranges from HK$3,929 the road tax ranges from S$684 (first year), and annual £140 or £450
(below 1 500 cc) to (HK$3,926) for a car with engine (HK$ 1,464 or HK$4,707) (after first
HK$11,329 (over 4 500 cc). size under 1 500 cc and age below year) depending on the value of the
10 years to S$7,102 (HK$40,765) car upon first registration.
for a car with engine size over
4 500 cc and age over 14 years. 7
Fuel duty (unleaded petrol) • HK$6.06 per litre. • S$0.54-S$0.64 (HK$3.09-HK$3.67) • 57.95 pence (HK$6.06) per litre.
per litre.
6
The tiered rates are: 100% for the first S$20,000 (HK$116,200) open market value of the car; 140% for next S$30,000 (HK$174,300) and 180% for value above
S$50,000 (HK$290,500).
7
A surcharge on the road tax is imposed according to the car age. For cars over 14 years old, the surcharge is equal to 50% of the road tax. In its 2019 budget,
the Singapore government offers rebate of road tax to car owners from 1 August 2019 onwards.
25Appendix I (cont'd)
Key characteristics of car growth controlling measures in Hong Kong, Singapore and London
Hong Kong Singapore London
Road pricing scheme and other measures
Vehicle quota system • No. • Since 1990. • No.
Road pricing/congestion • Under study. • Since 1998. • Since 2003.
charging
Parking place levy • No. • Legally allowed but not • One borough plans to introduce.
introduced any more.
Car Club • No available information. • 300 cars in 1 000 locations. • 10 car clubs with 3 000 cars.
26Appendix II
The first registration tax and annual licensing fee adjustments and car growth rates
First registration tax (HK$) Annual licensing fee (HK$)* Annual car growth rates
Rates Tax structure Range of fees Fee growth rates
1978 30%-40% Flat rates on import value: $350-$1500 n.a. n.a.
1979 35%-45% (a) below $20,000; $400-$1,800 20% 13.36%
1980 (b) $20,000-$30,000; and No change 15.30%
1981 (c) over $30,000. No change 10.87%
1982 70% -90% 200% -3.01%
1983 $1,800-$5,400 24.1%-27.8% -0.56%
1984 $2,300-$6,300 8.7%-11.1% -7.44%
1985 $2,500-$7,400 4%-4.8% -1.96%
1986 $2,600-$7,700 4.6%-5.8% -3.92%
1987 $2,750-$8,100 6% 4.86%
1988 $2,915-$8,585 7.9%-8.1% 10.13%
1989 $3,150-$9,270 10% 12.21%
1990 80%-100% Flat rates on import value: $3,465-$10,195 10%-10.1% 9.81%
1991 90%-120% (a) below $30,000; $3,815-$11,215 20% 7.16%
1992 (b) $30,000-$60,000; and 11.80%
(c) over $60,000.
1993 9.64%
Note: (*) The level of annual licensing fee depends on the cylinder capacity of the private car.
27Appendix II (cont'd)
The first registration tax and annual licensing fee adjustments and car growth rates
First registration tax (HK$) Annual licensing fee (HK$)* Annual car growth rates
Rates Tax structure Range of fees Fee growth rates
1994 40%-60% Flat rates on published retail price: $3,815-$11,215 No change 7.52%
1995 (a) below $100,000; 2.16%
1996 (b) $100,000-$200,000; 2.77%
1997 (c) $200,000-$300,000; and 7.31%
(d) over $300,000.
1998 1.05%
1999 1.09%
2000 3.35%
2001 2.46%
2002 0.08%
2003 35%-100% Tiered rates on published retail price: -0.56%
2004 (a) for the first $150,000; 1.71%
2005 (b) the next $150,000; 1.75%
2006 (c) the next $200,000; and 2.76%
(d) on the remainder.
2007 3.27%
2008 2.94%
2009 2.79%
2010 5.37%
2011 40%-115% 4.79%
2012 4.57%
2013 4.63%
2014 4.05%
2015 5.42%
2016 2.72%
2017 3.11%
2018 2.26%
Note: (*) The level of annual licensing fee depends on the cylinder capacity of the private car.
28You can also read