The Role of Regional-Scale Weather Variables in Predicting Bat Mortality and Bat Acoustic Activity: Potential for Use in the Development of Smart ...
←
→
Page content transcription
If your browser does not render page correctly, please read the page content below

The Role of Regional-
Scale Weather
Variables in Predicting
Bat Mortality and Bat
Acoustic Activity:
Potential for Use in the
Development of Smart
Curtailment Algorithms
Prepared by:
Andrew Farnsworth, Kyle Horton, Kevin Heist,
Eli Bridge, Robb Diehl, Winifred Frick, Jeff
Kelly, Phil Stepanian

July 26, 2021

AN AWWI TECHNICAL REPORT
The Role of Regional-Scale Weather Variables in Predicting Bat Mortality and Bat Acoustic Activity

AWWI Technical Report:

The Role of Regional-Scale Weather Variables in
Predicting Bat Mortality and Bat Acoustic Activity:
Potential for Use in the Development of Smart
Curtailment Algorithms
Wind Wildlife Research Fund
c/o American Wind Wildlife Institute
1990 K Street NW, Suite 620
Washington, DC 20006
www.awwi.org

July 26, 2021

The Wind Wildlife Research Fund is an industry-led initiative that pools resources to advance collaborative,
priority research to produce scientifically robust solutions that enable the continued expansion of wind
energy while advancing wildlife conservation. The Fund is managed by the American Wind Wildlife Institute
(AWWI), an independent 501(c)3 organization. Learn more at www.awwi.org/wind-wildlife-research-fund.

Find this document online at: https://awwi.org/resources/wwrf-regional-scale-weather-variables-in-
predicting-bat-mortality-and-acoustic-activity/

Acknowledgments
Thank you to the Wind Wildlife Research Fund for funding this research project. Thank you also to data
contributors to the American Wind Wildlife Information Center (AWWIC) and to all of the field teams that
were involved with collecting these data. Thank you to the three independent anonymous reviewers for
their review and comment on this report as well as AWWI staff for technical feedback and project
management support. Additional support was provided for report authors: thank you to the Leon Levy
Foundation and NSF ICER-1927743 for providing additional support for A. Farnsworth's efforts, and thank
you to the Edward W. Rose Postdoctoral Fellowship and NSF IIS-1633206 for providing additional support
for K. Horton's efforts.

Prepared By
Andrew Farnsworth, Cornell Lab of Ornithology, Cornell University
Kyle Horton, Colorado State University
Kevin Heist, Western EcoSystems Technology, Inc.
Eli Bridge, University of Oklahoma
Robb Diehl, U.S. Geological Survey, Northern Rocky Mountain Science Center
Winifred Frick, Bat Conservation International and UC Santa Cruz
Jeff Kelly, University of Oklahoma
Phil Stepanian, University of Notre Dame

Suggested Citation Format
Farnsworth, A., K. Horton, K. Heist, E. Bridge, R. Diehl, W. Frick, J. Kelly, P. Stepanian. 2021. The Role of
Regional-Scale Weather Variables in Predicting Bat Mortality and Bat Vocalizations: Potential for Use in
the Development of Smart Curtailment Algorithms. AWWI Technical Report. Washington, DC. Available at
www.awwi.org. ©2021 American Wind Wildlife Institute. This report is a product of the Wind Wildlife
Research Fund.

July 26, 2021                                                                                               1
The Role of Regional-Scale Weather Variables in Predicting Bat Mortality and Bat Acoustic Activity

Contents
Summary .............................................................................................................................................................. 5

Introduction .......................................................................................................................................................... 6

Methods ............................................................................................................................................................... 7

    Data .................................................................................................................................................................. 7

Results ................................................................................................................................................................ 11

    Bat Echolocation Activity and Models ......................................................................................................... 13

    Bat Mortality .................................................................................................................................................. 18

Discussion .......................................................................................................................................................... 19

Literature Cited .................................................................................................................................................. 22

Appendix S1. Supporting Information .............................................................................................................. 26

July 26, 2021                                                                                                                                                              2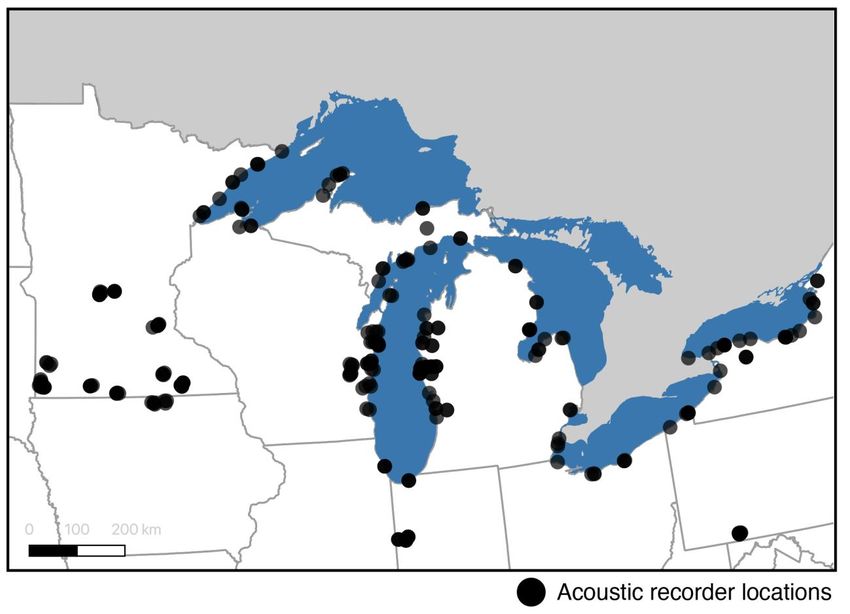
The Role of Regional-Scale Weather Variables in Predicting Bat Mortality and Bat Acoustic Activity
Tables
Table 1. Observed mortality as recorded during fatality searches at wind energy facilities
in the Great Lakes region for a subset of bat species as reported in the American
Wind Wildlife Information Center Bat Technical Report (AWWI 2020). .................................... 8
Table 2. Spatial distribution of study sites where fatality monitoring data were collected.
Number of sites and search days available for analysis by EPA Level III Ecoregion.
Monitoring studies in this subset were conducted between 2006 and 2016 with
searches scheduled spring through fall unless climate allowed for year-round
searches. .................................................................................................................................... 12
Table 3. Acoustic activity groupings and echolocation call totals (passes) from Great
Lakes monitoring programs. ..................................................................................................... 14
Table 4. Atmospheric and temporal variables used as model predictors for Figures 4 and
5. Note, only atmospheric, date, and time through the night predictors were held
constant, whereas landcover variables were allowed to naturally vary according to
2011 NLCD measures. ............................................................................................................... 15
Table 5. Reported bat fatality incidents in carcass searches from 71 sites across the
United States included in the analysis. Bat fatalities are defined in text and
assumed to have occurred the night before the survey. See Table 2 for regional
distribution of studies. ............................................................................................................... 18
Figures
Figure 1. Locations of acoustic recorders collecting bat echolocation activity. These data
are publicly available (batamp.databasin.org). Data used in this analysis were
collected during spring (May 4 to June 12) and fall (July 28 to September 26)
between 2010 and 2017. This analysis excludes data collected in early spring and
late fall when fewer detectors were deployed simultaneously. .............................................. 12
Figure 2. a.) Scatterplot of bat acoustic activity predicted by the all-species model (x axis)
versus recorded (i.e., actual) echolocations (y axis). Data plotted were withheld
from the model training process. b.) Predictor variable importance ranked in
descending order. For additional detail on linear relationships between individual
variables, see Appendix S1, Figure 1 showing data and analyses from Heist et al.
in preparation). ........................................................................................................................... 15
Figure 3. (left column) Scatterplots of predicted versus observed bat acoustic activity for
species (Hoary bat) or species groups (Myotis species, migratory tree roosting
species, big brown bat and silver-haired bat). Data plotted were withheld from the
model training process. (right column) Predictor variable importance ranked in
descending order for each species or species group models. ............................................... 16
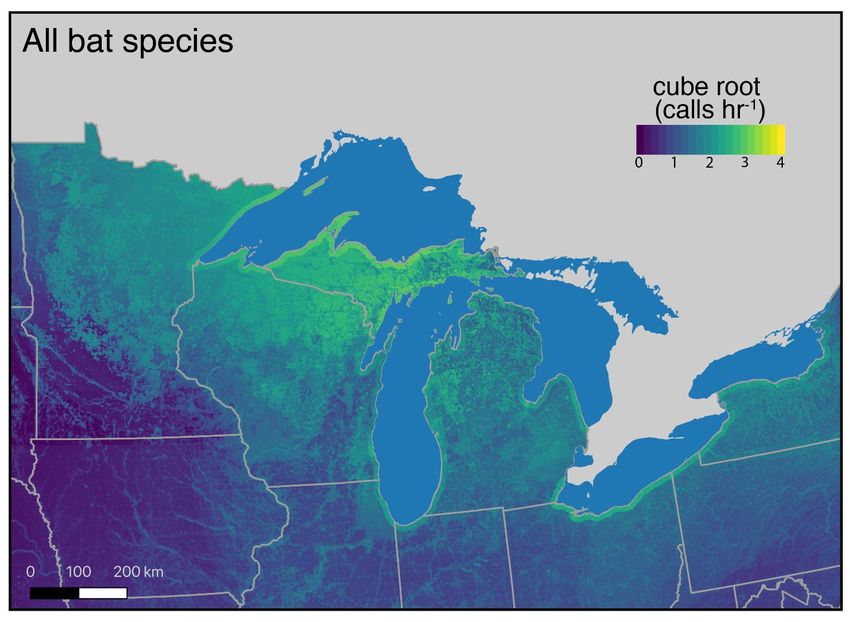
Figure 4. Predictive map generated from all-bat species acoustic activity model for July
19th with an average, assumed and uniform atmosphere across the entire region
(See Table 4 for specific values and variables held constant). For this proof-of-
concept, we only explored static depictions of what defined an “average” night of
atmospheric conditions. ............................................................................................................ 17
July 26, 2021 3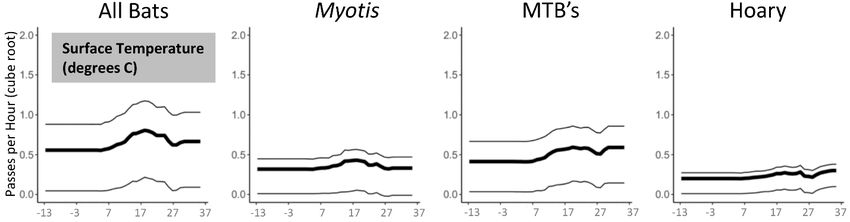
The Role of Regional-Scale Weather Variables in Predicting Bat Mortality and Bat Acoustic Activity
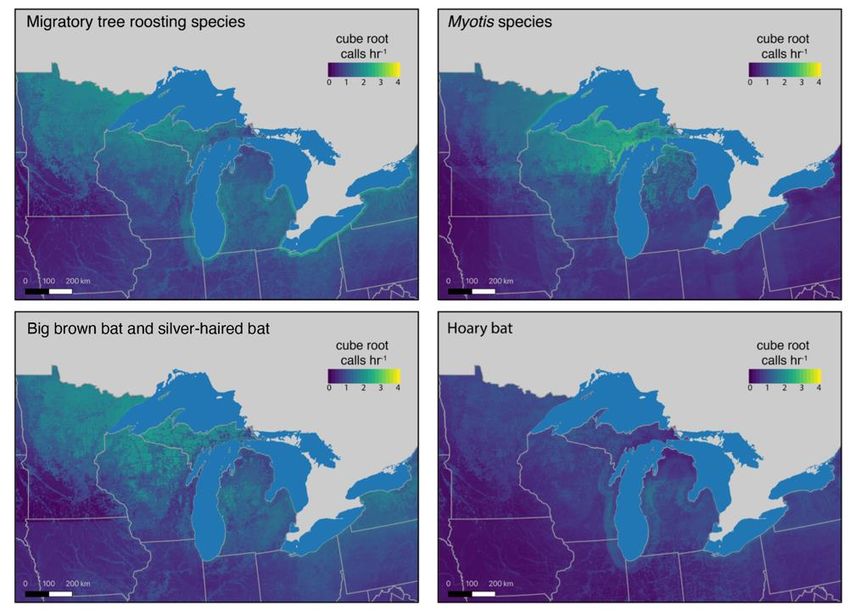
Figure 5. Predictive maps generated from species and species group acoustic activity
models for July 19th with an average, assumed and uniform atmosphere across
the entire region (See Table 4 for specific values and variables held constant). For
the proof-of-concept, we only explored static depictions of what defined an
“average” night of atmospheric conditions. ............................................................................. 18
Figure 6. a.) Scatterplot of predicted versus reported bat carcasses. We withheld data
plotted from the model training process. b.) Predictor variable importance ranked
in descending order. .................................................................................................................. 19
Appendix S1. Supporting Information
Table S1.A. Full list of candidate variables. * Denotes top 20 covariates used in final models. .............. 26
Figure S1.B. Partial dependence plots for 20 covariates used in predictive models. Partial
dependence plots depict the expected response in bat activity attributable to
values of a single covariate, marginalizing over all other covariates. Bold lines
represent the mean response. Thin lines represent the middle 50% of predicted y-
values.......................................................................................................................................... 28
July 26, 2021 4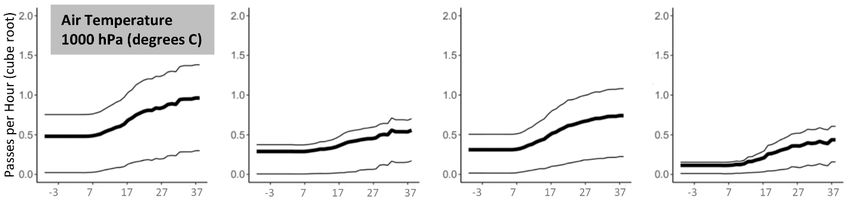
The Role of Regional-Scale Weather Variables in Predicting Bat Mortality and Bat Acoustic Activity

Summary
The primary objective of this study was to explore the use of regional-scale, i.e., synoptic, meteorological
variables to predict broader-scale movements of bats to further the goal of reducing bat fatalities at wind
energy facilities. This effort represented a preliminary, proof-of-concept approach for future exploration,
and its intent was not for operational use in the near-term. We investigated the feasibility of decision
support tools for bat fatality reduction that employ machine learning approaches, more specifically
gradient-boosted linear regression trees. We modeled bat mortality and bat activity, estimated as bat
echolocations derived from audio recordings of echolocation activity, with 31 predictor variables
including: atmospheric conditions at surface and pressure-level measures of wind speed; air temperature
and turbulent kinetic energy (a measure of wind velocity fluctuation); landcover characteristics (USGS
2011 National Landcover Database, 30 m resolution) at 100 m and 2 km surrounding acoustic recording
sites; temporal data (e.g. ordinal date); and geographic data (e.g. latitude). The intent of our modeling
effort was to produce a model for forecasting when, where, and under what conditions bats would occur
in close proximities to wind turbines.

We explored the potential application of the most current modeling methodologies for forecasting bird
migration based on weather variables (e.g., BirdCast) for predicting bat acoustic activity and collision risk.
We chose to focus this initial effort on the Great Lakes region because of the density of available data
and accessibility with respect to bat distribution information, existing mortality and acoustic data, and
predictor variables, with a plan to develop additional region-specific models for bats for future testing at
multiple wind facilities. We used gradient-boosted regression trees to generate two models: 1) a regional
model using acoustic recordings of echolocation activity in the Great Lakes region to predict bat
echolocation based on weather, habitat, and geographic variables; and 2) a broader but more diffuse
model with samples from bat fatalities at wind energy facilities to predict periods of heightened bat
collision risk from weather and geographic variables. At present, there is no model to directly relate pre-
or post-construction acoustic activity and bat fatalities at wind facilities. To evaluate the efficacy of using
weather variables with the power embodied in the BirdCast migration forecasts that are extensible across
the contiguous United States, we separately modeled these distinct and different data representing bats.

The best all-species gradient-boosted regression tree model explained 73.0% of the variation (R2=0.73) in
bat echolocation activity from acoustic data from nearly 120,000 recording periods and produced
explanatory predictions for areas that were not directly sampled. This acoustic activity model was based
on the following most important variables whose contributions we determined in terms of their gain in
predictive performance: 1) surface temperature; 2) % water within a 2 km radius; 3) hour after sunset; 4)
ordinal date; and 5) hour before sunrise. The best all-species mortality model explained 44% of the
variation (R2=0.44) in bat fatality data from post-construction fatality monitoring datasets, with the most
important variables being 1) longitude, 2) ordinal date, and 3) latitude; followed by 4) surface, and 5) air
temperatures. We did not include landcover predictors in the mortality model and did not have a
sufficiently broad geographic and spatial sampling of fatality search data (6,289 site-search days;
226,842 turbine-search days), or the necessary randomization in methods, to apply this model to areas
beyond locations with data – i.e., we could not expand to novel spatial and temporal extents because of a
lack of fatality search data.

Future research should clarify how predicted acoustic activity relates to mortality and at what geographic
scales. Model applications, including use of weather, habitat, and spatio-temporal variables to predict bat
activity and fatalities in places where monitoring may be limited, are still possible without assurances of a
strong relationship with fatality risk. Modeling for broader scale applications – e.g., greater geographic
extents, larger temporal periods, more sites and locations – requires randomly sampled data over greater
areas and longer periods of time (more hours of night, more nights per season, more years), while
maintaining high spatial and temporal resolution. Results from our efforts highlight some guidance with

July 26, 2021                                                                                                5
The Role of Regional-Scale Weather Variables in Predicting Bat Mortality and Bat Acoustic Activity

respect to potential expectations of model behavior, parameters, and accuracy, as well as important
caveats regarding availability and robustness for statistical efforts with existing data.

We produced proof-of-concept, generalizable models that predicted heightened bat echolocation activity
and number of fatalities from variables, including habitat type, atmospheric conditions, and indicators of
seasonality and geography. We used bat echolocation as a surrogate for bat activity, and bat collision risk
was estimated from bat fatalities collected during carcass searches. These two independent models
were spatially explicit in terms of their data inputs, predicting at a localized scale in their respective study
areas. Acoustic data were generally more accessible than mortality data, primarily because of experience,
expense, and availability of acoustic monitoring methods relative to searching for carcasses. The models
performed well, and results support further exploration to expand analysis with data from regions beyond
those encompassed by this study and could be considered for integration with smart curtailment
algorithms. Such consideration of application in operational environments will require additional research
guided by this proof-of-concept study. Our results complement efforts to increase the efficiency of bat
risk minimization strategies focused on individual projects, by providing a tool for predicting movements
or activity of bats and thus bat collision risk over larger spatial scales during migration, movements to or
from maternity roosts and hibernacula, or mass roost emergences (as witnessed in Mexican free-tailed
bats). Our efforts support further exploration of smart curtailment algorithms that account for weather
variables at a regional scale as opposed to relying on weather data from met towers located within
projects. Regional models could provide advanced warning of periods of increased risk to bats and allow
energy producers and managers of regional electric grids to plan for periods of reduced power
generation.

Introduction
Reducing bat mortality at wind turbine installations is a priority for wildlife agencies and energy producers
(Thompson et al. 2017; Slack and Tinsley 2015; Silva et al. 2017; Roemer et al. 2017; Muthersbaugh et al.
2019; Bennett and Hale 2018; Adams et al. 2015; Wellig et al. 2018; Burke and O'Malley 2011; Baerwald et
al. 2009; Arnett et al. 2011). A strategy to reduce risks to bats is curtailment, i.e., reducing turbine rotation
speed and/or operation during periods of high bat-mortality risk. To date, two general curtailment
strategies have emerged: 1) curtailment based on seasonal and diel timing of bat behavior, e.g.,
distribution, emergence, and wind speed; and 2) “smart curtailment” based on more temporally and
spatially specific weather data and bat behavior.

The first, and simplest strategy, involves curtailment during particular wind conditions wherein bat activity
is predicted to be higher, e.g., ~6 m s-1 and below (Baerwald et al. 2009; Arnett et al. 2011). This strategy
has proven effective at reducing bat mortality (Wellig et al. 2018; Whitby et al. 2021; Arnett et al. 2011),
but also entails down time for turbines when no bats are present, resulting in a unnecessary loss of
renewable energy production (Martin et al. 2017; Voigt et al. 2021; Davy, Squires, and Zimmerling 2021). A
second, more sophisticated strategy, “smart curtailment,” involves using other variables hypothesized to
affect bat collision exposure to guide curtailment decisions. Smart curtailment strategies have shown
some effectiveness by taking into account temperature (Martin et al. 2017), evaluating bat activity in the
immediate vicinity of turbines in real-time (Hayes et al. 2019), and refining the definition of exposed bat
activity when turbine blades are rotating (Hayes et al. 2019; Peterson 2020). Smart curtailment is believed
superior in terms of maximizing energy harvesting while reducing bat risk. However, its dependence on
real-time evaluations may provide little warning of the need to curtail turbine operations, which can
complicate electrical grid management strategies (Burke and O'Malley 2011; Saha et al. 2021; Guo et al.
2021). Thus, predictive forecasts over spatial scales consistent with grid management, with sufficient
lead-time, simple-to-acquire predictor inputs, and easily understood response outputs, may provide value.

Models based on factors presumed to predict collision risk with high accuracy and precision are
emerging, focusing on variables at the scale of the individual wind facility. There also is interest in

July 26, 2021                                                                                                  6
The Role of Regional-Scale Weather Variables in Predicting Bat Mortality and Bat Acoustic Activity

determining whether broader-scale movements of bats can be predicted by weather factors at regional
scales, both for the purposes of expanding the potential utility of forecasts in space and lengthening the
forecast window to provide greater advance warning of impending increases in bat activity and exposure
to collisions. Additionally, advances in machine learning allow for evaluation of larger datasets to inform
such forecasting approaches, highlighting a potentially valuable opportunity to create a third bat risk-
reduction strategy: to supplement “smart curtailment” approaches based on real-time data collection with
approaches based on longer-term forecasting for more advanced warning of increases in bat presence
and therefore collision risk.

We investigated the feasibility of creating extended forecasts by attempting to develop a regional-scale
decision support tool that employed statistical and machine learning approaches to model bat activity
(acoustic recordings of echolocation activity) and bat fatalities using weather, landcover, and geographic
data that, if successful, could inform targeted, proactive curtailments. For this pilot study we
implemented a similar approach to the BirdCast migration forecasting tool (Van Doren and Horton 2018).
We chose to use a model for predicting bird migration as a foundation rather than an existing model to
predict bat behavior for several reasons: 1) the BirdCast model is extensible across the contiguous United
States while maintaining high levels of model confidence across scales; 2) easy-to-access numerical
weather predictions are standardized and accessible; and 3) analysis of large datasets with machine
learning tools is effective and efficient using published software packages and methods. We assessed
available data and the relative importance or function of each data category and explored existing
development efforts for bird migration modeling (Cornell Lab of Ornithology and Colorado State
University), bat monitoring (University of Oklahoma, Bat Conservation International, USGS) and weather
forecasting (NOAA, NWS data). We tested the following hypotheses to understand and examine periods
of heightened risk:

1. Weather, habitat, and geographic data predict bat echolocation activity, as measured by acoustic
   detections.
2. Weather (e.g., air temperature, wind speed, barometric pressure, humidity) and geographic data
   predict bat fatalities at wind facilities.

Because these response variables (echolocation detections and fatalities) vary seasonally and nightly
and likely interact with a complex assemblage of atmospheric, geographic, and habitat characteristics,
we used a machine learning approach to reveal linear, multi-dimensional, and non-linear effects.

Methods
We modeled 1) acoustic activity from bat echolocation and 2) fatality data describing bat mortality from
collisions with wind turbines with an assemblage of predictor variables including weather, geographic
location, time, and habitat to produce and evaluate the efficacy of models that could predict activity and
mortality. Given that echolocation activity and mortality at wind energy facilities exhibit a poorly
understood relationship, we modeled these responses separately (Pickle, Bishop-Boros, and Solick 2017;
Hays, Solick, and Bishop-Boros 2019; Solick, Barclay, et al. 2020a; Solick, Barclay, et al. 2020b; Solick,
Pham, et al. 2020). We did not have a dataset that contained data appropriate to model acoustic activity
and fatalities together.

Data
Acoustic: Acoustic recordings of bat echolocation activity (Figure 1) are publicly available from the U.S.
Fish and Wildlife Service’s Great Lakes Avian Radar Project and on the acoustic data sharing platform
BatAMP (batamp.databasin.org). Data were aggregated from several different studies in a long-term
collaborative effort between the University of Minnesota that focused on patterns of acoustic activity in
spatial relation to various habitat and physiographic features, including several wind farms in the Upper

July 26, 2021                                                                                                7
The Role of Regional-Scale Weather Variables in Predicting Bat Mortality and Bat Acoustic Activity

Midwest, and the U.S. Fish and Wildlife Service that focused on bat migration near Great Lakes shorelines
(Cryan et al. 2014; Cryan, Stricker, and Wunder 2014). Echolocation activity was recorded using Wildlife
Acoustics SM2BAT+ detectors deployed at 228 sites to record echolocation activity of bats across the
Great Lakes basin, including coastal areas and sites up to 470 km inland. Species classification analysis
employed Kaleidoscope (Wildlife Acoustics, Maynard, MA) version 4.3.2 with a -1 (liberal) setting to
maximize the number of identifications. Only species with ranges overlapping the sites or bordering
within 50 km of the sites were included as candidates for species identification. Nights were generally
sampled from mid-March through the end of October from 2010 to 2017.

Detectors were deployed one meter above ground level. Microphones were protected from wind and
extraneous ground noise by PVC cups lined with sound-dampening material. Detectors operated nightly
from local civil sunset to civil sunrise defined as the temporal period when the sun is 6 degrees below
horizon. Expected detection range for this detector is between approximately 10 and 25 meters (Adams
et al. 2012) and likely depends on the frequency of the echolocation, with lower frequency bats, such as
hoary bats, being detectable at longer ranges. Compressed data files were saved every 15 minutes, and
recordings of potential bat passes were triggered at +/- 6dB in the 16–96 kHz range with a trigger window
of one second. Nights with more than two hours of detector operation were included in the dataset for
analysis. Deployment dates varied by site, and the amount of data collected per site within a spring
(March 15–June 15) or fall (August 1–November 15) season ranged from 10 to 61 detector nights. Data
were collected on SD cards and decompressed to disk using the WAC2WAV utility with the split triggers
option on.

Seven bat species have summer ranges extending across most or all the Great Lakes Region: big brown
bat (Eptesicus fuscus, EPFU), eastern red bat (Lasiurus borealis, LABO), hoary bat (Lasiurus cinereus,
LACI), silver-haired bat (Lasionycteris noctivagans, LANO), little brown bat (Myotis lucifugus, MYLU),
northern long-eared bat (Myotis septentrionalis, MYSE) and tricolored bat (Perimyotis subflavus, PESU).
Eastern red bats, hoary bats, and silver-haired bats are long-distance migrants that roost primarily in trees
year-round, but also account for considerable proportion of mortality at wind energy facilities (Thompson
et al. 2017; Thaxter 2017; AWWI 2020; Table 1).

Table 1. Observed mortality as recorded during fatality searches at wind energy facilities in the Great Lakes
region for a subset of bat species as reported in the American Wind Wildlife Information Center Bat
Technical Report (AWWI 2020).

                         Species                                  Percent Mortality

                         Eastern red bat                                39.9%

                         Hoary bat                                      28.2%

                         Silver-haired bat                              15.5%

                         Big brown bat                                  10.2%

                         Little brown myotis                            3.4%

                         Tri-colored bat                                0.6%

                         Other species and unidentified                 2.2%

July 26, 2021                                                                                                   8
The Role of Regional-Scale Weather Variables in Predicting Bat Mortality and Bat Acoustic Activity The remaining four species are considered short-distance or regional migrants that utilize caves for hibernation during the winter months (Wellig et al. 2018; Weller et al. 2016; Cryan et al. 2004; Cryan 2003). Species groupings used for analysis included passes identified as Myotids (little brown bat, northern long- eared bat), migratory tree-roosting bats (hoary bat, eastern red bat, and silver-haired bats), hoary bat, because it has become of special conservation concern (Frick et al. 2017), and an all-bats group that included echolocation passes from all seven species. Big brown bats and silver-haired bats have similar echolocation calls that can be difficult to differentiate. For that reason, an additional category including only these two species was used for species-group analyses and mapping. Passes identified as silver- haired bats may include misidentified big brown bat passes. In total, we present acoustic activity results from five groups: all species, Myotis species, migratory tree roosting species, big brown bat and silver- haired bat, and hoary bat. Mortality: We queried bat fatalities reported at the project level to the American Wind Wildlife Information Center (AWWIC) database of post-construction turbine fatality monitoring data (AWWI 2020). These data are managed by the American Wind Wildlife Institute and include publicly available and confidential data that we used with the data owner’s permission. Post-construction fatality monitoring studies employ a scheduled series of transect searches within a standard plot size at a subset of turbines, and record the date, species, and condition of each carcass discovery. For analysis, we included only fatalities estimated to have occurred the night prior to a scheduled search. This limited the dataset to studies that employed a daily search schedule (1,480 search days at 8 locations) or carcass finds reported with a time since death of 0-1 days (4,809 search days at 63 locations). Monitoring studies in this subset were conducted between 2006 and 2016 with searches scheduled spring through fall unless climate allowed for year- round searches. We summed the total number of reported (unadjusted for detection or scavenging) bat fatalities on each search day at each location across all bat species. We also included search days when zero bats were observed. To control for search effort, we modeled the number of carcasses per turbine searched. We did not account for other measures of effort such as search frequency or search area around each turbine because that information is not available for all studies. Because we did not have a large enough sample size to develop species-specific mortality models, a single all-species model is presented herein. Atmospheric predictor variables: We used the North American Regional Reanalysis (NARR; Mesinger et al. 2006) dataset of historical reanalysis of past weather conditions on a regular grid (32-kilometer spatial resolution) with 3-hour updates. This dataset is a standard tool for meteorological and atmospheric analyses used by nearly 3,000 studies since 2006, including studies in which gridded data to study behaviors in ecological communities are required (e.g., Mislan and Weathey 2011). These data are open access and available online. Additional detail is available in Appendix S1. For the acoustic model we used NARR data from the 3-hour sample and the 32-kilometer block nearest to the time and location of the acoustic detection. For the fatality model, since we did not have a specific time stamp for each fatality, we calculated average nightly measures for the 32-kilometer block where the wind energy facility was located. Predictor variables for acoustic modeling: We selected a total of 31 predictor variables that had either been shown previously to correlate with bat activity (e.g., habitat, wind speed, temperature), or were presumed to covary with acoustic activity and could potentially provide explanatory power to the model based on previous modeling results (Van Doren and Horton 2018). These included: spatial (latitude, longitude, distance to a Great Lake as recommended by USFWS Radar Project, distance to surface karst topography); temporal (ordinal date, hour after sunset, hour before sunrise); land cover (USGS 2011; National Landcover Database [NLCD]) characteristics (% forest cover, % water cover, % development) within radii of 100 m (immediate habitat) and 2 km (approximate home-range scale) of acoustic recording sites; and atmospheric conditions at surface (wind speed, snow cover, convective available potential energy – i.e., amount of energy gained by moving an air parcel aloft a specified distance, accumulated precipitation, visibility, total cloud cover, relative humidity, surface pressure, precipitation rate, temperature, and surface height); and pressure levels measures of wind speed (1000 hPa, 975 hPa, July 26, 2021 9
The Role of Regional-Scale Weather Variables in Predicting Bat Mortality and Bat Acoustic Activity

950 hPa, 925 hPa, and 900 hPa), air temperature (1000 hPa), and turbulent kinetic energy (mean energy
per unit mass associated with eddies in turbulent flow, 1000 hPa).

Predictor variables for mortality modeling: We selected a total of 21 predictor variables, including: spatial
(latitude, longitude); temporal (ordinal date); and atmospheric conditions at surface (wind speed, snow
cover, cape, accumulated precipitation, visibility, total cloud cover, relative humidity, surface pressure,
precipitation rate, temperature, and surface height) and pressure levels measures of wind speed (1000
hPa, 975 hPa, 950 hPa, 925 hPa, and 900 hPa), air temperature (1000 hPa), and turbulent kinetic energy
(1000 hPa). Note: habitat data were not included in these analyses. The data used for acoustic activity
were derived via a different workflow and were not available for modeling with the fatality data.

Modeling and statistical approaches: We used gradient-boosted trees (XGBoost; Chen et al. 2015, 2018) to
examine relationships between predictor variables and bat activity and collision mortality. Significantly
greater detail is available in Van and Horton (2018). We summarize our approach founded on a wide body
of literature herein.

The gradient-boosted tree method uses a tree ensemble model, which consists of a set of regression
trees, as applied in a supervised learning environment that relates a training dataset to a response
variable. We used this methodology to predict bat activity (e.g., echolocation activity) and collision
mortality from the aforementioned predictor variables by automatically detecting linear effects, non-linear
effects, and complex interactions among predictors. Within regression tree analysis, the interactions are
not explicitly defined as in a linear model or other parametric formulations. These regression trees are
based on linear regression and will detect a linear relationship among predictor and response variables if
one exists. All the predictors are additive in the construction; however, the trees will naturally build
interactions as needed as building a tree from multiple variables implies interacting the terms.
Interactions can be explicitly modeled in partial dependence plots. Note that previous studies, e.g., Heist
et al. (in preparation), have examined such linear relationships between variables of interest, and we
present such data in Appendix S1. We trained a model with echolocation activity or bat fatalities as our
response variable. We divided our dataset into three groups: a training set (75%), for learning; a validation
set, for hyperparameter tuning (10%); and a test set, to evaluate performance (15%). Data were randomly
assigned to these categories, using sampling dates for assignment, both for call activity and bat fatalities
datasets.

Briefly, with reference to the boosting and following syntax and logic from Chen et al. (2015, 2018), we
guarded against overfitting the model by choosing the best combination of parameters: max_depth = 12
(for mortality data) and 16 (for call activity); min_child_weight = 5, gamma = 0, 1, 2, 5, and 10;
colsample_bytree = 1; and subsample = 0.7 and 1.0. In addition, we lowered the learning rate to 0.01 and
set early_stopping_rounds to 100 to determine the optimal number of boosting iterations for that learning
rate. Max_depth is the maximum depth of regression trees, i.e., the step size shrinkage used in updates to
prevent overfitting and to make the boosting process more conservative (0.01 is a fine scale update),
min_child_weight corresponds to the minimum number of instances needed in each node,
colsample_bytree is set for subsampling of columns (no subsampling applied with a value of 1), and
subsample refers to the proportion of data XGBoost randomly samples from the training data prior to
growing trees (Chen et al. 2017). Numerous studies have examined the bias-variance tradeoff and the
challenges inherent in machine learning approaches between underfitting and overfitting (Geman,
Bienenstock, and Doursat, 1992). Lower learning rates decrease the contribution of each tree to the
model, making the boosting algorithm more conservative and further preventing overfitting, but lower
learning rates require more iterations. With this information, we fit a final model with learning rate = 0.01
on the combined training and validation sets. We used the xgb.importance function within the XGBoost R
package (Chen et al. 2015) to rank predictor variables in terms of their importance for the model. Variable
importance was measured by gain, which represents the fractional contribution of each feature to the
model based on the total gain of this feature's splits. Gain is a relative indicator of importance, with higher
values meaning a more important predictive feature and the summation of all features totally one.

July 26, 2021                                                                                               10
The Role of Regional-Scale Weather Variables in Predicting Bat Mortality and Bat Acoustic Activity

We removed uninformative predictors using a gain threshold of 0.01, leaving 20 variables (of 31) in the
final echolocation activity model: surface temperature, % water (2 km), hour after sunset, ordinal date,
hour before sunrise, distance to lake, air temperature (1000 hPa), % forest cover (100 m), % forest cover
(2 km), longitude, % development (2 km), visibility, surface pressure, % water (100 m), latitude, distance to
surface karst, relative humidity, surface wind, % development (100 m), and precipitation rate. We removed
uninformative predictors, leaving 17 variables (of 22) in the final mortality model: number of turbines
searched, ordinal date, longitude, surface temperature, air temperature (1000 hPa), surface pressure,
visibility, latitude, wind speed (1000 hPa), surface wind, relative humidity, wind speed (925 hPa),
precipitation rate, wind speed (900 hPa), turbulent kinetic energy (1000 hPa), total cloud cover, and
accumulated total precipitation. We applied the same model structure to the taxonomically specific
echolocation activity models allowing us to compare the same candidate variables across all models
(Figures 2 and 3). We evaluated performance on the test dataset (15% of data), which had been withheld
from training and validation. To assess performance, we calculated Pearson’s correlation coefficient (or
R2). Both R2 and Root Mean Squared Error (RMSE) approaches yield measures of goodness-of-fit. R2 is a
scaled (0 to 1) relative measure of variance explained, RMSE is also relative but is calculated by taking
the square root of variance and therefore remains rooted in the original units of the response variable –
i.e., it is an absolute measure of goodness-of-fit. We believe that R2 is more easily interpreted as a
measure of model performance, and for this reason, we opted for this metric.

To generate predictive maps of echolocation activity, we used a constant, synthetic atmosphere and
constant date and time of night, in conjunction with full variation of the landscape features (e.g., % forest
cover, % water, etc.) to reveal spatial differences in activity. In order to understand echolocation activity
from this perspective, we required such an approach to hold constant variables changing in the
atmosphere. We estimated responses to spatial covariates to predict bat activity (the cube root of bat
passes per hour) at each pixel while holding temporal and weather variables constant. A cube root
transformation was used to control for extreme values and adjust the highly skewed distributions
exhibited by both observed and predicted pass rate values. Prediction maps were produced for All Bats
and each species group separately. Because a static map cannot depict changes in temporal variables
like date or temperature, a set of values must be specified for each temporal covariate. The following
static conditions were used for the production of the color map in Figures 4 and 5. Values correspond to
conditions during periods of peak activity (Heist et al. in preparation): surface temperature 32°C, date July
19, 2 hours after sunset, 8 hours before sunrise, surface pressure 101.5 mb, relative humidity 85%,
visibility 20 km, and surface wind speed 0 m/s, air temperature at 1000 hPa 37°C, precipitation rate 0
kg/m2/s.

Results
Figure 1 shows the spatial distribution of study sites where bat acoustic activity was collected. Table 2
summarizes the spatial distribution (according to EPA Level III Ecoregion) of study sites where fatality
monitoring data were collected; the table includes level of effort in terms of sites searched and number of
days by ecoregion.

July 26, 2021                                                                                             11
The Role of Regional-Scale Weather Variables in Predicting Bat Mortality and Bat Acoustic Activity

Figure 1. Locations of acoustic recorders collecting bat echolocation activity. These data are publicly
available (batamp.databasin.org). Data used in this analysis were collected during spring (May 4 to June
12) and fall (July 28 to September 26) between 2010 and 2017. This analysis excludes data collected in
early spring and late fall when fewer detectors were deployed simultaneously.

Table 2. Spatial distribution of study sites where fatality monitoring data were collected. Number of sites
and search days available for analysis by EPA Level III Ecoregion. Monitoring studies in this subset were
conducted between 2006 and 2016 with searches scheduled spring through fall unless climate allowed for
year-round searches.

                                                                          Site-Search      Turbine-Search
Level III Ecoregion                                    Sites Searched
                                                                              Days              Days

Western Corn Belt Plains                                     24               3,759            126,628

Huron/Erie Lake Plains*                                       2                549             56,608

Ridge and Valley                                              2                558             13,845

July 26, 2021                                                                                              12
The Role of Regional-Scale Weather Variables in Predicting Bat Mortality and Bat Acoustic Activity Central Corn Belt Plains* 4 195 8,175 Central Appalachians 2 355 7,672 Eastern Great Lakes Lowlands* 4 327 3,680 Western Gulf Coastal Plain 1 16 1,616 Central California Foothills and Coastal Mountains 4 18 1,397 Northeastern Highlands 4 110 1,346 Northwestern Great Plains 2 42 1,260 Northern Glaciated Plains 3 16 867 High Plains 4 36 866 Arizona/New Mexico Plateau 1 24 552 Blue Mountains 1 11 551 Central Great Plains 1 19 437 Acadian Plains and Hills 3 20 425 Cross Timbers 1 9 270 Middle Atlantic Coastal Plain 1 198 198 Central Basin and Range 1 7 132 Columbia Plateau 3 5 131 Northern Allegheny Plateau 1 9 90 Southwestern Tablelands* 1 4 80 Total 71 6,289 226,842 *Ecoregion adjacent to Great Lakes Bat Echolocation Activity and Models Table 3 shows the distribution of calls by species groups. The best all-species gradient-boosted regression tree model explained 73% of the variation in bat activity collected from audio recordings (Figure 2a), with 53-74% of variation explained by taxonomically explicit models (Figure 3). The most important five variables, ranked from most to least important in terms of their gain in predictive performance, were: surface temperature, % water (within 2 km), hour after sunset, ordinal date, hour before sunrise (Figure 2b). Note the variation in predictive gain varied taxonomically, with different variables occupying the top positions. Furthermore, temperature was the top predictor in three of four acoustic models (Figure 3), but this variable exhibited distinct variation by taxonomy in terms of its July 26, 2021 13
The Role of Regional-Scale Weather Variables in Predicting Bat Mortality and Bat Acoustic Activity

predictive gain relative to the next highest ranking (e.g., temperature versus ordinal; distance to lake).
Note, also, that hour after sunset provided the greatest predictive gain for big brown and silver-haired
bats, with temperature following closely behind. Additionally, the variation in the top five predictive gain
variables by taxonomic group defines a total of eight variables (Figure 3). Characterizing direction of
effects is possible for many of the responses (see Appendix S1, Figure S1), but this is possible only in the
context of non-parametric relationships and many are not monotonic, e.g., they may increase and
decrease across the range of the predictor values.

Table 4 shows the variables and their respective values used as model predictors for predictive maps.
These maps highlight spatial relationships between bat activity and geography. This is most noticeable in
associations of high echolocation activity in more northern portions of the study areas within the United
States as well as locations in closer proximity to the Great Lakes (Figure 4). However, taxonomic variation
also clearly manifests in distribution of bat activity in space (Figure 5), with the greatest acoustic activity
predicted in northern Wisconsin for Myotis and big brown and silver-haired bats relative to notably lower
activity shown for migratory tree and hoary bats.

Table 3. Acoustic activity groupings and echolocation call totals (passes) from Great Lakes monitoring
programs.

                              Number of                                  Summed rate of       Percent of calls
Acoustic Groups                                     Species
                               species                                   calls (calls hr-1)

                                                 Big brown bat

                                                 Eastern red bat

                                                    Hoary bat

All calls                          7            Silver-haired bat             407,452              100.0

                                                Little brown bat

                                                 Tri-colored bat

                                            Northern long-eared bat

                                                    Hoary bat
Migratory tree roosting
                                   3            Silver-haired bat             185,510              45.5
bats
                                                 Eastern red bat

                                                Little brown bat
Myotis                             2                                          187,529              46.0
                                            Northern long-eared bat

                                                 Big brown bat
EPFULANO                           2                                          88,276               21.7
                                                Silver-haired bat

Hoary bat                          1                Hoary bat                 46,128               11.3

July 26, 2021                                                                                               14
The Role of Regional-Scale Weather Variables in Predicting Bat Mortality and Bat Acoustic Activity
Table 4. Atmospheric and temporal variables used as model predictors for Figures 4 and 5. Note, only
atmospheric, date, and time through the night predictors were held constant, whereas landcover variables
were allowed to naturally vary according to 2011 NLCD measures.
Atmospheric variable Value used in prediction
Surface Temperature (K) 305
Hour After Sunset 2
Ordinal Date 200
Hour Before Sunrise 8
Air Temperature (at 1000 hPa) (K) 310
Visibility (m) 20,000
Surface Pressure (Pa) 101,500
Relative Humidity (%) 85
Surface Wind (m s-1) 0 (no wind)
Precipitation Rate (kg m-2 s-1) 0 (no precipitation)
Figure 2. a.) Scatterplot of bat acoustic activity predicted by the all-species model (x axis) versus recorded
(i.e., actual) echolocations (y axis). Data plotted were withheld from the model training process. b.)
Predictor variable importance ranked in descending order. For additional detail on linear relationships
between individual variables, see Appendix S1, Figure 1 showing data and analyses from Heist et al. in
preparation).
July 26, 2021 15The Role of Regional-Scale Weather Variables in Predicting Bat Mortality and Bat Acoustic Activity Figure 3. (left column) Scatterplots of predicted versus observed bat acoustic activity for species (Hoary bat) or species groups (Myotis species, migratory tree roosting species, big brown bat and silver-haired bat). Data plotted were withheld from the model training process. (right column) Predictor variable importance ranked in descending order for each species or species group models. July 26, 2021 16
The Role of Regional-Scale Weather Variables in Predicting Bat Mortality and Bat Acoustic Activity

Figure 4. Predictive map generated from all-bat species acoustic activity model for July 19th with an
average, assumed and uniform atmosphere across the entire region (See Table 4 for specific values and
variables held constant). For this proof-of-concept, we only explored static depictions of what defined an
“average” night of atmospheric conditions.

July 26, 2021                                                                                                17
The Role of Regional-Scale Weather Variables in Predicting Bat Mortality and Bat Acoustic Activity

Figure 5. Predictive maps generated from species and species group acoustic activity models for July 19th
with an average, assumed and uniform atmosphere across the entire region (See Table 4 for specific
values and variables held constant). For the proof-of-concept, we only explored static depictions of what
defined an “average” night of atmospheric conditions.

Bat Mortality
Table 5 provides a breakdown of fatalities from the AWWIC database included in this analysis. The best
gradient-boosted regression tree model explained 44% of the variation in bat mortality, as indicated by
fatalities (Figure 6a). Predictor importance exhibited a different pattern than what was observed for the
bat acoustic activity model, with the most important five variables, ranked from most to least important in
terms of their gain in predictive performance, being longitude, ordinal date, and latitude, followed by
surface and air temperatures (Figure 6b).

Table 5. Reported bat fatality incidents in carcass searches from 71 sites across the United States included
in the analysis. Bat fatalities are defined in text and assumed to have occurred the night before the survey.
See Table 2 for regional distribution of studies.

          Species                          Number of bat fatalities         Percent of total

          Big brown bat                               461                          7.5

          Eastern red bat                            2,218                        36.3

July 26, 2021                                                                                              18
The Role of Regional-Scale Weather Variables in Predicting Bat Mortality and Bat Acoustic Activity
Hoary bat 2,035 33.3
Little brown bat 140 2.3
Silver-haired bat 998 16.3
Tri-colored bat 128 2.1
Mexican free-tailed bat 134 2.2
Total 6,114 100
Figure 6. a.) Scatterplot of predicted versus reported bat carcasses. We withheld data plotted from the
model training process. b.) Predictor variable importance ranked in descending order.
Discussion
Applying statistical and machine learning approaches to bat activity and fatality data at the regional scale
produced two models that predicted their respective responses, bat echolocation activity and fatalities at
wind turbines, based on a suite of variables (Figures 2, 3, 6; Table 4). The bat activity model performed
better than the fatality model; we believe this may be because the bat activity data consist of a higher
temporal and spatial resolution and constitute a larger sample size. Our acoustic and fatality training data
are limited spatially and temporally, which constrain the models’ performances and scalability. The
explanatory power of the models is a positive sign for this proof-of-concept effort based on what is
moderate explanatory power (Nau 2014; Kumar 2017), suggesting that future model performance may
improve with larger datasets having greater spatial and temporal resolution. In addition, given the levels
of variance explained by these models, it is worth further exploring these approaches as a decision
support tool for bat fatality reduction and reduced losses in power production.
This pilot application of the BirdCast migration forecasting approach (Van Doren and Horton 2018) and
standard application of gradient-boosted trees supports peer-reviewed literature that proposes potentially
useful predictor variables for bat activity in support of smart curtailment algorithms. Temperature, time at
multiple scales, landscape variables – including presence of and distance to water bodies and vegetation
July 26, 2021 19The Role of Regional-Scale Weather Variables in Predicting Bat Mortality and Bat Acoustic Activity patches and edge – and taxonomy are important characteristics for predicting bat activity (Korner- Nievergelt et al. 2013; Duff and Morrell 2007; Lookingbill et al. 2010; Polyakov, Weller, and Tietje 2019; Caldwell, Carter, and Doll 2019; Appel et al. 2019; Roemer et al. 2019). Predictive maps highlight the potential power of acoustic data (Roemer et al. 2019), as well as the capabilities to generalize beyond sampling locations. We also recognize that echolocation frequency and amount may vary significantly among and within species; for example hoary bats have been shown to exhibit periods of using no vocalizations (Corcoran and Weller 2018). The importance of temperature as a predictor for bat activity (in this case bat acoustic activity) reinforces its utility as a factor in future research. Three of four taxonomically explicit acoustic activity models had temperature as the variable with the highest predictive gain, and the exception had temperature as second most important. Temperature is an important attribute determining bat foraging and ecology (Erickson and West 2002; Frick et al. 2012), and it is no surprise that its importance appears in all models of acoustic activity. This variable also appears in mortality models, as a top atmospheric predictor behind surface pressure; however, longitude, date and latitude all provide higher gain. Concurrent investigations that share similar data, methods, and covariates (Heist et al. in preparation) highlight the nature of some of these relationships in isolation. Temperature above the ground (i.e., 1000 hPa) exhibits a generally positive relationship with bat aerial activity for all species groups, although this relationship is more complex with surface temperature (see Appendix S1; Heist et al. in preparation). But as can be the case with large numbers of linear prediction models, they may be too simplistic for non-normally distributed data and their respective errors (e.g., count data) and their relationships (Elith, Leathwick, and Hastie 2008; Costanza et al. 2020). In this case, the value of considering these complex relationships as embodied in their gain predictions for model building is high, suggesting that this proof-of-concept and other applications, e.g., BirdCast forecasts, may be guiding principles for meaningful future decision support tools and efforts. A valuable outcome of the effort was identification of existing data gaps that limit ability to successfully predict bats aloft and how that limit relates to observed bat fatalities at wind turbines. The limited availability and limited scope of input and training data characterizing mortality and acoustic activity constrained our ability to produce the types of generalizable and extensive forecast models possible for birds (e.g., Van Doren and Horton 2018). Of particular note is the limited availability of fatality data. However, we used the most comprehensive database of post-construction fatality monitoring data available in the United States, AWWIC, which includes publicly available and confidential data. A bigger constraint is associated with the temporal resolution provided by post-construction fatality monitoring field surveys, which commonly implement search schedules with one or more gap days between searches. When carcasses are detected hours or even days after the fatality occurs, the exact environmental conditions at the time of collision are unknown. We highlight the importance of further investment in technologies and methodologies that would provide an exact time stamp for fatality events. Also, habitat variables were specific to endeavors associated with the acoustic monitoring studies that occurred in parallel to this study; these analyses occurred via a different workflow in a completely different project and were not available for the fatality data. Future modeling efforts should certainly seriously consider accounting more thoroughly and directly for habitat. Finally, the methods we applied required the use of raw fatality data, which are not corrected for searcher efficiency or carcass persistence. These aspects of this outcome highlight several useful approaches to future research. We anticipate that more data will improve the predictive ability of the mortality model; however, the limited temporal resolution of fatality data collected through post-construction fatality monitoring methodologies must be overcome. We must acknowledge that given the high sample size necessary to apply regression tree ensemble models, there may simply not be enough fatality events occurring at wind energy facilities to reach a high level of confidence using these methods. Fatality data with the appropriate temporal and spatial resolution may be too expensive or unrealistic to acquire. Thus, it may be necessary to focus on the more readily available acoustic data which provide species-specific information at relatively low July 26, 2021 20
The Role of Regional-Scale Weather Variables in Predicting Bat Mortality and Bat Acoustic Activity

costs, in contrast to costs associated with collecting fatality data. Applications using acoustic data could
add value in additional models in other regions, given the explanatory power possible from relating such
activity data to our predictor variable ensemble.

Finally, additional integrated models of acoustic and fatality data using a similar forecasting approach to
those we have applied may have additional explanatory power. Making curtailment decisions on a model
based on acoustic data is indirect and might require another model relating activity data to mortality risk.
Future research needs to resolve the challenge of predicting bat fatality risk from acoustic activity.
Studies investigating a correlation between pre-construction bat activity and fatality rates have found no
relationship (Bennett and Hale 2018; Solick, Pham, et al. 2020; Voigt et al. 2021). Alternatively, acoustic
activity at operating wind energy facilities shows a strong positive relationship with collision risk when
turbines are operating, i.e., when there is exposure (Peterson 2020).

Paradoxically, although the success of wind-speed-based curtailment substantiates the premise that bats
are more active at lower wind speeds, wind variables did not load highly in terms of their predictor
importance in multivariate models. This may reflect a shortcoming in the data and sample sizes, a
shortcoming of previous modeling efforts, or some combination of both. However, it could also reflect the
effect of different factors operating at different spatial scales, e.g., long-distance migration movements
versus local foraging activity or wind speeds and associated activity levels at regional scales may not
have the relevance to bat activity in local and micro scale wind speeds. We do suggest that useful model
applications based on our proof-of-concept approaches are still possible without assurances that there is
a strong relationship with fatality risk. Specifically, identification of important (i.e., high gain) variables for
relationships with bat activity and collision fatalities highlight a path for future modeling and experimental
design incorporating such features. Furthermore, additional analysis of temporal variation in both
modeling efforts would be valuable. Such modeling efforts would hopefully yield proactive approaches to
decision support that would leverage the highest quality information from meteorological outlets with
quantified confidence in model behaviors regarding bat behaviors, e.g., activity and mortality.

Given the current geographic limitation of the majority of the acoustic activity data to the Great Lakes
region, a potential pathway for making a stronger activity model would involve querying more data from
the North American Bat Monitoring Program (NABat) or BatAmp. One possibility is that with a stronger
activity model, predictions at the site-specific (project level) are feasible to predict peaks in activity
across a broader spatial scale.

Our results suggest the value of applying published and peer-reviewed modeling methodologies that
forecast bird migration for applications focused on reducing bat fatalities and minimizing power loss. For
example, an operational model to forecast when bat activity or fatality rates are predicted to be high
could be applied in operational wind energy facilities as a means to collect additional data or deploy
additional monitoring resources. There is potential to consider other methodologies from the avian
domain that may have similarly valuable outcomes when applied to bat monitoring, including new
acoustic methodologies, radar aeroecology, and community-science data analysis and interpretation.
Generally, modeling for broader-scale applications in space and time requires more data, covering more
sampling locations over greater areas over longer periods of time sufficient for random sampling.

July 26, 2021                                                                                                   21
You can also read