The Illusion of School Choice: Empirical Evidence from Barcelona
←
→
Page content transcription
If your browser does not render page correctly, please read the page content below
Federal Reserve Bank of Minneapolis
 Research Department

                                The Illusion of School Choice:
                              Empirical Evidence from Barcelona*

                                    Caterina Calsamiglia and Maia Güell

                                              Working Paper 712

                                            Revised October 2014

 ABSTRACT __________________________________________________________________________

 The Boston mechanism is a school allocation procedure that is widely used around the world. To resolve
 overdemands, priority is often given to families who live in the neighborhood school. We note that such
 priorities define some schools as being safer. We exploit an unexpected change in the definition of neigh-
 borhood in Barcelona to show that when allowing school choice under the BM with priorities: (1) the re-
 sulting allocation is not very different from a neighborhood-based assignment, and (2) important inequali-
 ties emerge beyond parents’ naivete found in the literature.

 Key words: School choice; Boston mechanism; Priorities
 JEL classification: C78, D63, I24
 _____________________________________________________________________________________

*Calsamiglia: Universitat Autònoma de Barcelona and Barcelona GSE (Caterina.Calsamiglia@uab.cat). Güell: The
 University of Edinburgh, CEP (LSE), CEPR, FEDEA, and IZA (maia.guell@gmail.com). We are very grateful to
 Manel Blasco, Jordi Baró, and Francesc Iñiguez for providing us with the school applications and enrollment data;
 to Manel Blasco, Eduard Vallory, and Frederic Udina for allowing us to merge the school application data with the
 census data under the CEB-BGSE-IDESCAT institutional agreement; to Miquel Delgado at IDESCAT for merging
 the data sets; and to Javier Asensio, Isaac Aparicio, Albert Esteve, Sabine Flamand, and Diego Puga for helping us
 with the street map data. Anna Muñoz provided outstanding research assistance. We also thank Guillermo Caruana,
 Antonio Ciccone, Doireann Fitzgerald, Guillaume Haeringer, Philipp Kircher, Derek Neal, Mar Reguant, Sevi
 Rodríguez Mora, and participants at numerous seminars and conferences for fruitful discussions and comments. We
 are grateful to Joan Gieseke for editorial assistance. Calsamiglia acknowledges financial support by the Fundación
 Ramon Areces, the Ramón y Cajal contract of the Spanish Ministry of Science and Technology, the Spanish Plan
 Nacional I+D+I (SEJ2005-01481, SEJ2005-01690 and FEDER), and the Grupo Consolidado de tipo C (ECO2008-
 04756), the Generalitat de Catalunya (SGR2005-00626), and the Severo Ochoa program. Güell acknowledges finan-
 cial support from the Spanish Ministry of Science and Innovation (ECO2011-28965) and the hospitality of the Uni-
 versity of Minnesota and the Federal Reserve Bank of Minneapolis, where part of this work was written. Our online
 appendix is available at http://www.maiaguell.com/SchoolsBCN/OnlineAppendixChoiceBarcelona.pdf. The views
 expressed herein are those of the authors and not necessarily those of the Federal Reserve Bank of New York, the
 Federal Reserve Bank of Minneapolis, or the Federal Reserve System.
1       Introduction
During the last two decades, over two-thirds of OECD countries have implemented different forms
of school choice that depart from residential-based assignment (see Musset (2012)). The aims of
school choice programs are to improve the matching between children and schools as well as to
improve students’ educational outcomes.1,2 Yet, the concern is that disadvantaged families are less
able to exercise choice, which leads to equity concerns.3
    When school choice is implemented, the presumption is that the final allocation will be largely
determined by parents’ preferences. In this paper, we provide empirical evidence that challenges
this presumption. In a nutshell, we show that under the most widely used school choice mechanism
around the world, most families avoid revealing their preferences and systematically apply for
schools in their neighborhood. Only some of the advantaged families will be able to choose their
preferred school.
    Under centralized school choice procedures, parents are asked to submit a list with their ranking
of schools, and then a set of rules determines the final allocation. One of the most widely used
procedures in school choice is the so-called Boston mechanism, henceforth the B-mechanism or
BM.4 This mechanism assigns all applicants to the school ranked first, and if there is overdemand
for a school, ties are resolved according to priorities. These priorities can be defined through a
random lottery or according to criteria such as distance to the school, existence of siblings in the
school, or other socioeconomic variables. Those rejected from their school ranked first can opt for
the seats that remain free only after considering everyone else’s school ranked first. This process
drastically reduces the chances of being accepted in any particular school after being rejected
from one’s school ranked first. As the literature starting with Abdulkadiroğlu and Sönmez (2003)
has emphasized, the optimal strategy for parents under the Boston mechanism depends on what
other parents are doing, and telling the truth is rarely optimal. Parents may avoid overdemanded
schools and rank only relatively safer schools, thereby establishing a trade-off between preferences
and safety.5 On the other hand, Abdulkadiroğlu, Che, and Yasuda (2011) show that lack of truth-
telling can be useful for eliciting cardinal preferences in a way that other mechanisms cannot. But
    1
     Abdulkadiroğlu, Agarwal, and Pathak (2014) estimate preferences and provide evidence of the benefits from
moving from a decentralized to a centralized choice system for secondary schools in New York City. He (2012)
and Calsamiglia, Fu, and Güell (2014) evaluate the performance of different mechanisms with estimated preferences
using data from Beijing (China) and Barcelona (Spain), respectively.
   2
     A large set of papers explore the impact of school choice on elementary and secondary achievement, high school
graduation, and college attendance. Results are mixed, finding positive or nonsignificant effects. Some examples
are Rouse (1998), Howell and Peterson (2002), Hoxby and Rockoff (2005), Cullen, Jacob, and Levitt (2006), Hoxby
(2003), Hastings, Kane, and Staiger (2008), Gibbons, Machin, and Silva (2008), Hoxby and Murarka (2009), Lavy
(2010), Abdulkadiroğlu, Angrist, Dynarski, Kane, and Pathak (2011), Dobbie and Fryer (2011), Hastings, Neilson,
and Zimmerman (2012), Neilson (2013), and Demin, Hastings, Kane, and Staiger (2014).
   3
     Epple and Romano (2003) and Brunner and Imazeki (2008) explore how choice programs affect sorting in
schools. Allen, Burgess, and McKenna (2010) evaluate the impact on sorting that results from removing the Boston
mechanism and replacing it with the so-called Gale-Shapley mechanism, and of changing priorities from strict
priorities according to distance to the school to living in the catchment area of the school, which happened in
Brighton and Hove in England. Burgess, Greaves, Vignoles, and Wilson (2009) study what type of schools parents
choose in England in terms of schools’ characteristics and whether the type differs across parents’ characteristics.
   4
     This was the mechanism used in the city of Boston until 2005. See Abdulkadiroğlu (2013) for a review.
   5
     The fact that families do not have incentives to reveal their true preferences is referred to as manipulability of
the mechanism. Pathak and Sönmez (2013) provide a measure of the degree of manipulability of mechanisms and
document that local administrations have moved away from more to less manipulable mechanisms.

                                                          1
Abdulkadiroğlu, Che, and Yasuda (2011) assume that overdemand for a certain school is resolved
randomly, whereas in most cities around the world, when a school is overdemanded, ties are also
broken according to priority points based on criteria such as having siblings or living near the
school.6 In general, the literature has overlooked the role of priority points.7 These priority points
may seem innocuous, but we show that they have a drastic effect on parents’ behavior. Priorities
induce discontinuity with regard to the safety of different schools for different families. We find
that not only do families exclude some highly demanded schools from their submitted list, but a
large fraction of them exclude any school that is not of their highest priority, that is, any school
outside of their neighborhood.
The contribution of this paper is to highlight the importance of priorities in the case of the
Boston mechanism overcoming large empirical challenges.8 Namely, (i) preferences are not observ-
able, (ii) families choose schools as well as where to live, and (iii) some families may be able to
opt for a school outside of the public system. We exploit an unexpected change in the definition of
neighborhood in the city of Barcelona (Spain), where the B-mechanism is applied.9 This provides
an exogenous change in the set of safer schools and allows us to analyze what drives school choice,
keeping housing decisions constant. Moreover, data on final school enrollment (as explained below,
the school that children enroll in can differ from their assigned school in the public system) will be
key in shedding new light on equity concerns.
In Barcelona, priority points are given mainly to siblings and children living in the neighborhood
of the school. Thus, the neighborhood school provides a safer choice. The unexpected change in
the definition of neighborhood in Barcelona allows us to assess whether it is preferences or priorities
that drives parents’ school choice. Learning how parents choose by only observing their submitted
rankings is problematic. For instance, as we will show, in the city of Barcelona in any given year,
around 85 percent of the families get the school they rank first, but also 80 percent of families apply
for a neighborhood school. By observing parents’ choices at a point in time, however, one cannot
identify whether this behavior results from families’ preferences for the neighborhood schools or
from families applying for a safer school. Moreover, to the extent that families can also change
residence, these two reasons cannot be identified separately. Our strategy allows us to separate
housing and schooling decisions. Parents who applied to schools in 2007 were not able to change
their residence, because the change in the definition of neighborhood was very close to the school
application deadline. Moreover, crucial for our purposes is that the set of schools for which families
have priority changed with this new definition of neighborhood, and this change is exogenous to
families. Therefore, the set of safer schools that families have when they lived in any given address
6
They show that if families share the ranking over schools but differ in the intensity attached to each of them,
then only those families who value a given school relatively more will apply for it and therefore be assigned to it.
7
Only Calsamiglia and Miralles (2012) theoretically show that all parents playing it safe is one of the possible
Nash equilibria, and it is the unique equilibrium when one of the schools is thought to be sufficiently bad for all
families.
8
Chen and Sönmez (2006) and Calsamiglia, Haeringer, and Klijn (2010) identify the existence of this trade-off
for the BM through lab experiments. But the actual relevance of this trade-off depends on the risk of applying for
their preferred school and on the relative valuations for the different schools. Lab experiments cannot replicate the
risk involved in actual school choice, and therefore the ability to capture the size of this trade-off is limited.
9
Machin and Salvanes (2010), Bogart and Cromwell (2000), and Ries and Somerville (2010) also exploit variation
in the catchment area in school choice to analyze the effect on housing price changes due to school quality.
2changed before and after 2007. On the one hand, the set of neighborhood schools was reduced,
declining from an average of 24 schools to an average of 7. On the other hand, the identity of the
schools included for a given family changed. Our key insight is that if parents choose according
to their preferences, then a change in neighborhood definition should not change the distribution
of choices. Instead, if parents play it safe, then a change in neighborhood definition can affect
their choices systematically, because the incentives to apply to a given school have changed. A first
thing to note is that between 2006 and 2007, the fraction of families that applied for a school in the
neighborhood remained constant, despite the reduction in the set of schools and the change in the
definition of neighborhood. Further, we focus on families’ schools ranked first and find that after
the change in neighborhood definition, families avoid applying to the old neighborhood schools and
apply to the new neighborhood schools. We find that families not only change the schools they
choose after the change in neighborhood definition, but they do so in a clear way that supports
the idea that their preferences play a small role: they change their behavior mainly by excluding
any school that is not a neighborhood school anymore and incorporating the new neighborhood
schools. This implies that the gains of school choice in terms of matching of children and schools
seem limited, because the equilibrium allocation is not very different from that without choice.
Studies such as Lavy (2010) and Hastings, Kane, and Staiger (2008) exploit the implementation
of the B-mechanism to provide empirical evidence of the positive impact of choice on outcomes.
The underlying assumption in their analysis is that when choice is implemented, families can access
a different school or a school they like better. Since the mechanism implemented in these studies is
the B-mechanism, from the analysis provided in this paper we learn that these results may only be
a lower bound on the effects of implementing a mechanism that would better respond to parents’
preferences.10 Our results suggest that, in general, preferences may play a small role in determining
the allocation when choice is implemented.
One important concern in the debate regarding the B-mechanism is that naive parents, being
unable to strategize, may be harmed by the system (see Pathak and Sönmez (2008)). In this paper,
we merged our school application and assignment data with school enrollment data to provide novel
evidence of this important issue. Abdulkadiroğlu, Pathak, Roth, and Sönmez (2006) report that
in Boston, 19 percent of parents seem to be naive, playing a dominated strategy. We also find
a similar fraction of parents that exhibit seemingly naive behavior. Enrollment data allow us to
rationalize some of this behavior. We find that of those who are unlucky and do not get their
school ranked first, 14 percent of them go to private school (only 4 percent of schools are private
in Barcelona), and around 30 percent do not get any of the schools that they ranked (enrolling
in some other public school). Calsamiglia, Miralles, and Martinez-Mora (2013) show theoretically
that parents with the option of private school can take higher risks and apply for the best schools
in the public system, appearing to be naive if the private option is ignored. Our empirical evidence
suggests a new and important source of inequality that the B-mechanism induces.
Our application data set was merged with the population census data in order to yield infor-
mation about parents’ socioeconomic characteristics. Having this information allows us to analyze
10
Hastings, Kane, and Staiger (2008) show, in that case, policy makers strongly advised parents to state their
true choices and were not clear about the details of the mechanism, which lead to limited strategic behavior.
3the level of education for these families. We find that those who are particularly harmed by the
system, that is, by not getting any of the schools ranked in their application, have systematically
lower levels of education than those applicants who do not take any risk. Similarly, those with
higher levels of education can take higher risk and therefore have greater access to the best schools
in the city.
This paper shows that with the BM, priorities overtake the role of preferences for most appli-
cants. The risk involved in stating preferences is not worth taking, leading most of the applicants
to apply for one of the neighborhood schools, independently of the identity of those schools. Only
a few families who have the option of private school if they are unhappy with their allocation can
take the risk of stating their preferences. Those who dare to take risks without having an outside
option are particularly harmed by the system, which rationalizes why most families do not take
risks.
The rest of the paper is organized as follows. In Section 2 we describe the school allocation
mechanism in the city of Barcelona. In Section 3 we describe our data. In Section 4 we discuss the
empirical challenges involved in trying to identify what drives parents’ school choice. In Section 5
we explain our empirical strategy. In Section 6 we analyze what drives parents’ choices. In Section
7 we analyze the rationality behind parent’s choices and inequalities of the system. Finally, Section
8 concludes.
2 School allocation mechanism in Barcelona
In Spain all children age 3 and above have universal access to a seat in the public system.11 This
implies that even if compulsory primary education starts at the age of 6, de facto almost every
child starts school at the age of 3.12
Educational policies in Spain are determined at three levels: national, regional, and municipal.13
In Spain families have the right to choose their children’s schools.14 Parents choose the primary
school for their children in March of the natural year that their children turn 3. In general, this
school will be the one that they will attend until they are at least 12 years old and possibly until
11
This right started in 1990 with the recognition of preschool education in the national law Ley Orgánica de
Ordenación General del Sistema Educativo (LOGSE). This has been developed further since then. Preschool
education is divided into two stages: the first one (0-3) and the second one (3-6), which is appended to primary
schools.
12
Most schools include both preschool (3-6 years old) and primary school (from 6 years old on). The LOGSE
in 1990 established that in order to universally incorporate 3-year-old children into the public system, primary
schools in the public system should expand and include preschool. In fact, public childcare centers that offer care
for children under 3 do not offer care for older children, and the supply of care is limited.
13
In the case of the city of Barcelona, whose region is Catalonia, the regional government is called the Generalitat
de Catalunya, and the municipal government is called the Ajuntament de Barcelona. Together they form the
Consorci d’Educació de Barcelona, which deals with the management of public education in Barcelona. All education
legislation cited in this section can be found in Section 1 of our online appendix.
14
This was first established in the 1985 national law called Ley Orgánica reguladora del Derecho a la Educación
(LODE). Further developments on the application process, the allocation algorithm, and priorities for the region of
Catalonia are developed in decrees; the relevant decrees for our period of study are 252/2004 (for the years 2005 and
2006) and 75/2007 (from 2007 until 2010). Finally, further details on the exact weights of the established priorities
are provided every year (even if there are no changes) under resolutions from the regional educational ministry.
The relevant ones for our period of study are EDC/712/2005, EDC/449/2006, EDU/904/2007, EDU/349/2008,
EDU/553/2009 and EDU/107/2010.
4they finish secondary education.15
Since the mid-90s, the mechanism to assign children to schools that is used in Barcelona is the so-
called Boston mechanism, first described in Abdulkadiroğlu and Sönmez (2003). It can be described
as follows. First, parents submit an application form ranking up to 10 schools in Barcelona.16 Once
applications with families’ rankings have been submitted, all applicants are allocated to the school
they have ranked first.17 If the number of applicants is larger than the number of seats for a
certain school, applicants are given points following a scale that depends mainly on the existence
of a sibling in the school ranked first, whether the school is in the neighborhood that they live and
other characteristics (more details to follow). Those applicants with a higher number of points are
accepted and the rest rejected. Ties in number of points are broken through a random lottery.
Applicants rejected from the school ranked first opt for a seat in the next school in their submitted
ranking that has a free seat after the previous round. If there are more applicants than free seats
in the school ranked second, spots are allocated again according to the priority points of the first
round.18 The process continues until all children have an assigned seat in some school. As can be
immediately noticed, the chances of being admitted in any school in the second round are greatly
reduced, and more so in further rounds.
Waiting lists remain active until the new academic year starts. The ordering of the waiting list
is based on the point system mentioned above and described next.
As mentioned above, in case of overdemand for a certain school, the allocation mechanism
assigns points to different characteristics of the child, the family, and the school ranked first. Table
1 describes these aspects as well as the scale points in descending order. This point system has
remained mostly stable over our period of study, except for some minor changes (Appendix A
explains these changes and discusses how our results are not affected by them). We can distinguish
between “basic points” and “extra points”. Among the basic points, there are points for siblings,
neighborhood, and socioeconomic characteristics. Having a sibling in the school ranked first by the
applicant is the aspect that gives the most points (40). Next are criteria based on the neighborhood
of the school ranked first in the application. Neighborhoods are defined by the administration. As
mentioned, our empirical strategy will be based on an unexpected change in the definition of such
neighborhoods. The neighborhood criteria are mutually exclusive. Living in the neighborhood of
the school ranked first gives 30 points. Families have the choice to use the work address of one
of the parents/tutors instead of their home. In this case, the applicant would get 20 points if the
school ranked first is in the neighborhood of the workplace. After 2007, an applicant that applied
to a school living outside the neighborhood but still close enough (with the administrative district)
15
Schools either offer primary and secondary education or, if they do not offer the latter, they still give priority
to a specific secondary school when applying.
16
Section 2 of our online appendix provides the application forms for the academic years 2006-2007 and 2007-2008,
which in the paper we refer as years 2006 and 2007, respectively. One can notice that in 2006, families could rank
up to 7 schools, and in 2007 families could rank up to 6 schools. Although the application form included only 6 or
7 schools by default, up to 10 schools could be requested. In practice, very few applicants used the additional slots.
17
Applicants with special needs are allocated first before everyone else. These include important disabilities,
extreme socioeconomic circumstances, or being a recent immigrant to the country (having arrived in the last two
years).
18
Other cities around the world resolve ties by assigning priorities according to the school each applicant applies
to in each round. The way ties are broken in Barcelona gives even more weight to the school ranked first.
5would obtain 15 points (more details on these districts will be given in Section 5.1). Families can
apply to a school in another city from their residence. But priority (10 points) is given to families
that apply to a school in a city where they live if it is not in their neighborhood. The next set
of points corresponds to the socioeconomic characteristics of the applicant: being a low-income
family (10 points) and having a family member with a disability (10 points). The system also gives
extra points if the applicant belongs to a large family or has a single parent (15 points) or if the
applicant has a chronic digestive illness (10 points).
Table 1: Priority points in case of overdemand for a school, 2005-2010
Number
of Points
Basic Points
Siblings
Applicant has a sibling in school of ranked first 40
Neighborhood(a )
Residence in neighborhood of school ranked first 30
One of the parents/tutors works in neighborhood of school ranked first 20
Residence in the administrative district (not neighborhood) of school ranked first(b ) 15
Residence in the city (not neighborhood) of school ranked first 10
Socioeconomic characteristics
Low-income family(c ) 10
Applicant, one of the parents/tutors, or a sibling is disabled 10
Extra Points(d )
Socioeconomic characteristics
Large family (three or more siblings) or single parents(e ) 15
Applicant has a chronic digestive illness(f ) 10
Notes: (a ) Neighborhood criteria are mutually exclusive: The work address of one of the parents/tutors can be considered instead of
the residence address of the applicant. Neighborhoods of the city of Barcelona are explained in Section 5.1. (b ) Administrative district
criteria apply only from 2007 onward. Administrative districts of the city of Barcelona are explained in Section 5.1 and Figure 1. (c )
Low-income indicates a family in which one of the parents/tutors receives welfare income or the total family income per capita is less
than one-third of it (around 12,000 euros per year). (d ) Before 2007, the extra points were automatically added to the basic points.
From 2007 on, the extra points were taken into account only to break ties between people with the same number of basic points. (e )
Single parents have received the same points as large families since 2010. (f ) Before 2007, points for chronic digestive illness were given
only if school ranked first was in the neighborhood.
Source: Resolutions from the Catalan Ministry of Education EDC/712/2005, EDC/449/2006, EDU/904/2007, EDU/349/2008,
EDU/553/2009, and EDU/107/2010 (see Section 1 of our online appendix).
The case of Barcelona is particularly useful for our purposes. From Table 1, we note that
there are two types of families: those that have socioeconomic characteristics for which they get
priority and those that do not. These points are exogenous to the school choice decision, whereas
the neighborhood points are endogenous and depend on the location of the school ranked first. In
the case of Barcelona, the qualifying socioeconomic characteristics are narrow, and few applicants
obtain points from these characteristics. In fact, 90 percent of families do not receive any points
for their socioeconomic characteristics. This is particularly useful for our goal because the huge
majority of families, at least with respect to the priority points, will be equally constrained in
their choice problem, trading off safety and preferences. However, we will find that some families
have an outside option, and we will be able to understand how they choose schools as we highlight
important inequalities that the mechanism generates.
63 Data
We exploit four data sets that provide us with detailed information on: (i) the demand of schools
of each family in Barcelona, (ii) the supply of schools in Barcelona, and (iii) the final allocation
for each child and school in Barcelona for the years 2005-2010. Additionally, the family microdata
have been merged with the population census data to obtain socioeconomic characteristics. We
describe these in the following subsections.
3.1 Barcelona primary school applications data set
The demand for each school in Barcelona comes from a unique and rich administrative data set
that consists of the universe of applications for primary schools in Barcelona of children that turned
3 in the years 2005-2010. This population consists of 77,825 children.
For all children, we have a complete application form that consists of the following variables:
their ranking of schools (up to 10 schools) and all the priority points obtained for their different
characteristics (as described in Table 1: whether they are a low-family income, presence of a sibling
in the school ranked first, whether they suffer any chronic illness or disability, etc).19 We also know
where they live, which allows us to assign them the set of schools for which they would have priority
points if they were to rank them first. Finally, we also know the school to which each applicant
was assigned by the administration if this is a school in Barcelona.20 Table 2 describes this data
set year by year.
Our first analysis concentrates on understanding the choice of the school ranked first by ap-
plicants. As we explain in more detail in Section 6, for this exercise our population of interest
consists of those applicants that: live in the city of Barcelona and have no siblings in the school
ranked first. That is, on the one hand, we want to analyze those families for whom the definition of
neighborhood changed in 2007 (see Section 5.1 for details).21 On the other hand, for families with
older siblings, both the preferences for the school and the incentives provided by the mechanism
are very different and completely independent of the policy change that we are exploiting. We
therefore exclude them from our analysis.22 Crucial for our first analysis is to identify the address
19
For the year 2005, we only have the aggregate number of priority points obtained and not the detailed charac-
teristics. For most of our analysis, such details will not be necessary. However, whenever we need to use the detailed
points, the results for 2005 will be less precise because of this fact. Still, all the results of the paper can be derived
simply by using the years 2006 and 2007. We include the other years for completeness.
20
In our data, 1.25 percent of the observations for the school that they assigned is missing because they end up
in a school outside Barcelona.
21
Our data set only includes the residential address of every applicant and not the work addresses of the applicants’
parents. This means that we cannot tell how the neighborhood changed for those that live outside Barcelona and
apply to a school in Barcelona for work reasons. Similarly, for those that live in Barcelona we can only tell how
their neighborhood changed in terms of their residential address. In Appendix B we show that the fraction that
uses their work address is small and fairly constant over time; thus our results should not depend on being able to
identify the work addresses of the parents.
22
For the year 2005, we only have the aggregate number of priority points obtained and not the more detailed by
characteristics. However, given the structure of points (see Table 1), we can approximate a lower bound on this
population. More precisely, anyone with more than 75 points, the maximum that one can obtain with the other
characteristics, must have points for a sibling. Also, anyone that has exactly 70 points must have a sibling because
there is no other way to obtain exactly these points. With this approximation, those that have siblings and some
other points are being counted as having no siblings. This makes our analysis for 2005 more conservative because
these families are less constrained in their choices than those who do not have siblings.
7of the applicants in order to identify how the change in definition in neighborhood affected them.
The school applications forms are submitted to the school or the central administration and then
manually entered into the centralized system. This process implies that typos may be introduced,
which can make our identification difficult. Overall, we are able to identify the address for 91 per-
cent of the observations in our population of interest (see Table 2). In Appendix C we show that
the sub-population for which we cannot identify their address is not statically different from that
for which we can in terms of the other observable variables. The fact that this sub-population is
rather small and that there does not seem to be any non-random selection implies that our analysis
based on the sub-population for which we can identify the address is not biased. We will refer to
our population of interest (i.e., applicant lives in the city of Barcelona and has no siblings in the
school ranked first) for whom we can identify their address as our baseline population (highlighted
in bold in Table 2).
In our second analysis, we analyze how risky the behavior of families is. For this purpose, we
calculate the aggregate demand for each school using the total population of applicants.
Table 2: Barcelona Primary School Applications Data Set, 2005-2010
Number of applicants 2005 2006 2007 2008 2009 2010
Live in Barcelona & no sibling
in school ranked first:
Address identified 7,775 6,649 6,893 7,198 7,134 7,085
Address not identified 718 880 800 606 576 542
Live in Barcelona & have sibling
in school ranked first 3,087 4,342 4,642 4,794 4,798 4,812
Do not live in Barcelona 797 633 596 768 838 862
Total Population 12,377 12,504 12,931 13,366 13,346 13,301
Note: For 2005, applicants with a sibling in the school ranked first are approximated as described in footnote 22.
Source: Barcelona primary school applications data set, Consorci d’Educació de Barcelona., 2005-2010.
3.2 Barcelona supply of schools data set
Spain has three types of schools: public, semi-public, and private. The system described in Section
2 is for all public and all semi-public schools. That is, the application process and the allocation
process are identical for both public and semi-public schools. Semi-public schools are publicly
funded but privately managed. By law, no fees are involved in semi-public schools.23
Our second database includes all existing schools in the region of Catalonia, their address, and
their characteristics (whether they are public, semi-public, or private, and the grades they offer:
23
Semi-public schools are the so-called concertadas. Although fees are not compulsory, we know that in reality,
families are asked to pay for other services that most families pay for. Families preferences for a school may be
shaped by this fact. However, this is not an issue in this paper because (i) our aim is to understand whether
priorities or preferences determine the choice for schools (see Section 4) and (ii) the structure of these payments
did not change before and after 2007, which is key because we identify priorities versus preferences from a change
in the neighborhood definition that occurred in 2007 (see Section 5). One may think that semi-public schools could
be a safer option for those families that can afford the voluntary fees. But as we show in Table A3 in Appendix D,
in any given year, a larger number of public schools are underdemanded (i.e., demand is lower than the capacity of
the school).
8preschool only, preschool and primary school, etc.). Among the schools in the city of Barcelona,
around 48 percent are public, 48 percent are semi-public, and 4 percent are private. In this sense,
our paper studies the allocation of children in 96 percent of the schools in the city.
We can merge the application data set with the school data set to learn about the demand for
schools. In any given year, there is demand for all available public and semi-public schools. For
our baseline population, for the whole period of study, there is demand for 368 schools, 337 of these
schools are in the city of Barcelona.
3.3 Barcelona school enrollment data set
The third data set that we will exploit is the school enrollment data set of the residents in Barcelona.
The school where applicants end up enrolling is not necessarily the same school to which they were
allocated by the administration (and could include a private school). In the second part of our
analysis (see Section 7), we merge these data with our application and assignment data in order to
first verify whether families enroll in their assigned school or not, but also to identify families who,
failing to be assigned to their desired school, enroll their children in some other school. We refer
to this as an outside option, which can be either a private or a public school outside of the city of
Barcelona. This approach allows us to provide some novel evidence on so-called naive parents.
The school enrollment data contain information on enrolled children from two types of schools.
First, it contains all of the children that enrolled in any given school in the Barcelona public
system (i.e., public and semi-public primary schools in Barcelona).24 Second, it also includes
school enrollment information for some schools outside the Barcelona public system (i.e., private
schools in Barcelona and schools outside Barcelona) in which Barcelona residents have enrolled.
However, this enrollment is not complete.25
We match the Barcelona primary school applications data set with the school enrollment data
set on common variables (see Appendix E for details). We are able to match 96 percent of the
observations in the applications data set. The resulting data set allows us to further analyze the
potential inequalities generated by the system (see Section 7).
3.4 Population census: Parents’ socioeconomic characteristics
Under the institutional agreement between the Consorci d’Educació de Barcelona, the Barcelona
Graduate School of Economics, and the Catalan Institute of Statistics, the school application data
set was merged with the Catalan population census data (more information on the census can
24
Preschools in Barcelona (i.e., those schools that offer education up to age 6 only) are not in this data set. This
amounts to six centers in Barcelona. For the years 2005-2010, this amounts to not having enrollment information
for 504 children in our baseline population of applicants.
25
Children that submit an application to a school in the Barcelona public system may end up enrolling in a school
outside the public system in Barcelona (i.e., private schools in Barcelona or schools outside the city of Barcelona).
The institution that deals with the school applications in Barcelona (the Consorci d’Educació de Barcelona) tries
to keep track of the enrollment school for all the children resident in Barcelona. It therefore asks for the enrollment
information to all potential schools outside the Barcelona public system. However, schools are not obliged to provide
this information, and this is why the school enrollment data set does not include the enrollment information for all
of those that end up outside the Barcelona public system.
9be found at http://www.idescat.cat/en/poblacio/censos2011/) and the municipal popula-
tion register (more information on the register can be found at http://www.idescat.cat/en/
poblacio/padro.html). More specifically, each of the applicants was searched in the population
census or the municipal register in order to identify his or her father and mother and obtain their
socioeconomic characteristics (see Appendix F for details). It was possible to find one of the parents
in 95 percent of the children in our application data set. The resulting data allow us to study how
socioeconomic characteristics can relate to behavior in the context of school choice (see Section 7).
4 Empirical challenges
Table 3 displays for each year the percentage of children that enter the school that they ranked
first in their school application, those that enter the school that they ranked second, and so on.
We concentrate on our baseline population (those that live in Barcelona and have no siblings in
the school ranked first), which were allocated to a school in Barcelona.26 This table shows that on
average, as many as 86 percent of children enter their school ranked first.27 Also worth noting is
that 3.5 percent of children, on average, does not enter any of the schools they ranked. This shows
again that under the BM, the school ranked first is crucial.
Table 3: Parental behavior and school allocation in Barcelona
Percentages 2005 2006 2007 2008 2009 2010
Enter in school ranked 1st 88.10 85.05 83.19 85.44 86.83 88.64
Enter in school ranked 2nd 4.82 5.69 5.98 6.11 6.21 5.64
Enter in school ranked 3rd-10th 3.75 4.38 5.56 5.00 4.71 4.21
Does not enter in any ranked school 3.33 4.89 5.28 3.45 2.79 1.51
School ranked 1st is in residence neighborhood 72.85 79.89 82.02 83.34 82.32 82.16
Observations 7,713 6,649 6,893 7,183 7,122 7,075
Note: For 2005, applicants with a sibling in the school ranked first are approximated described in footnote 22.
Population: Baseline population that has been allocated to a school in Barcelona.
Source: Barcelona primary school applications data set matched with school enrollment data set, 2005-2010.
One might think that the fact that so many children get allocated to the school they rank first
indicates that the school system accommodates parents’ preferences nicely. However, Abdulka-
diroğlu and Sönmez (2003) have shown that under the BM, parents may not have incentives to
provide their true preferences. Further experimental evidence, such as Chen and Sönmez (2006)
and Calsamiglia, Haeringer, and Klijn (2010), suggests a trade-off between preferences and safety
when ranking schools (i.e., schools for which they obtain priority points, like the neighborhood
school).28 Priorities impose a discontinuity on the safety of the different schools for a given family.
Hence, this trade-off may imply that parents exclude from their submitted list any school that is
26
For those that were not allocated a school in Barcelona, 1.25 percent of the total population, we do not know
the exact school to which they were allocated. We only know that they were allocated a public school out of the
city.
27
This number is almost 100 percent for those that have a sibling in the school ranked first.
28
These studies observe that subjects in the lab manipulate the submitted rankings by reducing the position of
the neighborhood schools with respect to the true position of the school in the preference ranking.
10preferred to a school for which they are given priority points.29 But learning how parents choose
by only observing their submitted rankings is problematic. The following piece of evidence further
illustrates this empirical challenge.
The last line of Table 3 displays the percentage of children who rank first a school that is in
their residence neighborhood. On average across the years for our baseline population, this number
is as much as 80 percent.
Therefore, the question is: is it priorities or preferences that explains these facts? Or could
both reasons explain it, to the extent that families can move their residence to the neighborhood
of their most preferred school? The schooling and housing decisions can be summarized as follows.
Parents’ choice of neighborhood school: Three reasons Considering housing and schooling
decisions, parents may choose their neighborhood school for one of the following reasons:
• For families that cannot change residence:
(1) preference for the neighborhood school30
(2) opting for a safer school rather than another more preferred school.
• For families that can change residence:
(3) the neighborhood school is both their most preferred school and a safer option.
We will refer to reason (1) as “preferences” and to reason (2) as “safety.” Therefore, by
observing parents’ choice of a neighborhood school at a point in time, we cannot identify whether
their behavior results from preferences for that school or from the increased safety provided by
having priority for that school. Ultimately, we cannot identify whether the school ranked first in
the list reflects preferences or priorities for schools. Reason (3) is the union of the first two. Thus,
to the extent that families can also choose their residence makes it even harder to distinguish the
reason behind their choice. In this paper we exploit a change in the definition of neighborhood,
which will allow us to separately identify these reasons. In the next section, we explain our empirical
strategy.
5 Empirical strategy
We circumvent the identification problem explained in the previous section by exploiting an un-
expected change in the definition of neighborhood that occurred in the city of Barcelona in 2007.
The change was announced on March 27, 2007, and families applying for a school that year were
told on March 30 that they had to submit their applications between April 10 and 20, 2007.31
29
Note that this is different from saying that parents exclude their top choices, say, the best schools in the city,
where everyone wants to go.
30
This could be the quality of the school and/or shorter commuting time. The way neighborhoods changed in
Barcelona will allow us to provide some insights.
31
The change of neighborhoods was made public through the regional edict 4850/2007, and the application
deadline was made public through the regional resolution EDU/904/2007 (see Section 1 of our online appendix).
11This change had two consequences. The first implication is that for families that applied for
schools in 2007, it was almost impossible to move residence, thus essentially minimizing channel
(3) described above. Moreover, in order to get the corresponding residential points, applicants
need to prove to have resided in the claimed address for at least six months prior to the application
time. In other words, in 2007, the cases in which the choice of residence and school coincides should
be minimal. Since moving residence can take time, most likely this was also the case (even if to a
lesser extent) for some years after 2007.
The second implication of the change in the definition of neighborhood is that for each family,
the set of schools that were safer (i.e., those with the highest priority) also changed. In turn, this
allow us to distinguish between reasons (1) and (2) described above (priorities versus preferences).
In other words, it allows us to identify whether parents change their choices following the change
of neighborhood definition. Our key insight is that if parents choose according to their preferences,
then the change of neighborhood definition should not change the distribution of choices.32 Instead,
if parents play it safe, then the change of neighborhood definition can affect their choices by
excluding the old safer school and including the new safer school.
Therefore, in our empirical analysis we analyze the changes in school choices before and after
this change and, in particular, between 2006 and 2007. Our assumption is that distribution of
preferences will not change between these two years. As mentioned before, we will concentrate on
those families that live in Barcelona (for whom the neighborhood changed) and that do not have
a sibling in the school that they have ranked first. The latter approximates the families that are
choosing for the first sibling because the choice for a second sibling is a different problem.33 Note
that the school for the first sibling at age 3 is chosen only once by each family. Thus, we necessarily
need to compare different families over time. As mentioned above, our empirical strategy relies
on the assumption that the distribution of families’ preferences does not change between 2006 and
2007. More precisely, we need to assume that preferences of families in the same neighborhood
do not change in a systematic manner that coincides with the direction in which the incentives
provided by the mechanism have changed.
5.1 Change in the definition of neighborhood
As explained in Section 2, in the city of Barcelona, to resolve overdemands for schools, families
are given priority points for all schools within their residence neighborhood. The definition of
what constitutes such a neighborhood changed in March 2007. Before 2007, the city was divided
into fixed neighborhoods. The neighborhoods varied in size for semi-public and public schools,
but were conceptually the same. For semi-public schools, the neighborhood coincided with the
32
One concern is that the change in neighborhoods may induce changes in peer composition of schools, thereby
affecting parents preferences. We compare peer socioeconomic characteristics before and after the neighborhood
change and find no statistical differences in the average quality of YY, YN or NY schools. That is, peer composition
in schools does change, but it is not the case that increased safety is systematically correlated with improvement in
peers.
33
The reasons are that additional priority points are given for children with older siblings in a school (see Table
1), and it is reasonable to assume that families prefer that siblings attend the same school.
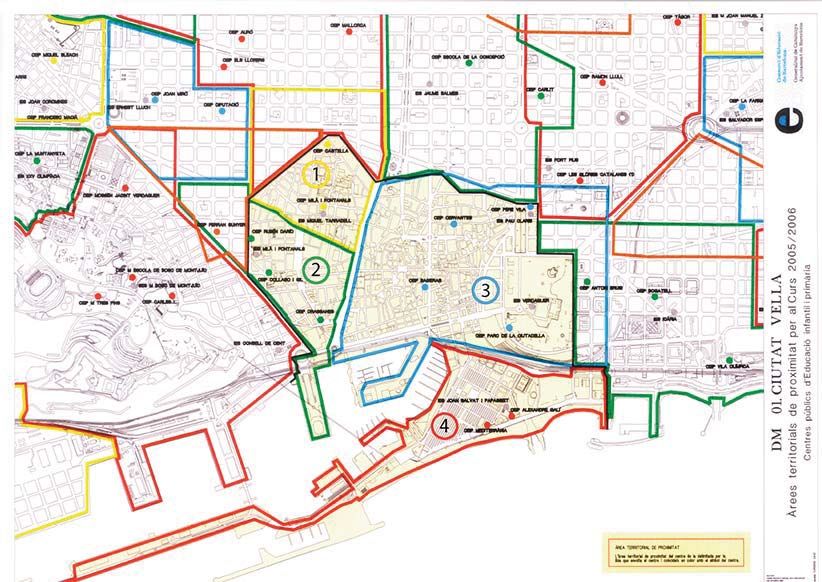
12administrative district.34 Figure 1 displays the 10 administrative districts in the city of Barcelona.
For public schools, the neighborhoods were smaller areas within the administrative district (see
Appendix G for more details).
Figure 1: Administrative districts in the city of Barcelona
In March 2007, new neighborhoods were defined, moving away from the old fixed administrative
districts. The change in the definition of neighborhood is unrelated to our concerns about the
properties of the B-mechanism. It occurred because the previous definition had two issues from
the administration’s point of view. First, the administration wanted to unify the definition of
neighborhood for public and semi-public schools. Second, the old neighborhoods did not capture
well the distance to schools (e.g., families living close to the border of two neighborhoods did not
have priority points for nearby schools while having priority points for schools farther away within
the neighborhood). Finally, the old neighborhoods implied that the size of the set of schools for
which a family could have priority could be very different because it depended on the density of
schools in the neighborhoods.
The new neighborhoods are based on distance between families’ residence and schools. An area
(specifically, a minimum convex polygon) around every block of houses in the city was established
to include at least the closest six schools (three public and three semi-public). An algorithm was
constructed to define the new neighborhoods citywide, which amounted to 5,300 for the whole
city.35
We can map every block of houses in the city to its neighborhood and thus to the schools for
which that address would have priority points if ranked first. We next explain how the change in
the definition of neighborhood changed this set.
34
There was the possibility for semi-public schools to request that their neighborhood would consist of two adjacent
administrative districts. Unfortunately, however, the body that granted these petitions no longer exists, and there
is no record of these requests. Please note that this implies that the share of applicants demanding a school that
we identify as their neighborhood is a lower bound for the years 2005 and 2006.
35
Before 2007, families knew which schools were in their neighborhood by looking at maps like the one in Figure
1, which were available in all schools. Since 2007, since every block in the city has a different neighborhood, the
administration would send a letter to each family specifying which schools were in their neighborhood. One might
think that this would increase the demand for schools in the neighborhood, but as Table 3 shows, this was not the
case. The number of families that ranked a neighborhood school first is constant over time.
135.2 Changes in the set of neighborhood schools
The change in the definition of neighborhood implied two changes in terms of the set of schools
for which each family had priority points. These changes are the basis of our empirical strategy.
For simplicity let us refer to the neighborhoods before 2007 as the old neighborhoods and the
neighborhoods defined in 2007 as the new neighborhoods.
The two changes in the set of priority schools are as follows. First, the new neighborhoods
were defined to include the closest 6 schools (3 public and 3 semi-public). This implied that the
size of the set of neighborhood schools for which families have priority was reduced. Before 2007,
families had priority points on average in 22 schools, whereas, after 2007, the number of priority
schools was reduced to 8 on average. Also, the standard deviation went from 7 to 2 (see Appendix
H for details). So, the size of the set of priority schools indeed became smaller as well as more
equal across families in the city. Second, for some families (those living near the border of an old
neighborhood), there was also a change in the composition of schools in the priority set because
the new neighborhood includes nearby schools that are on the other side of the border of the old
neighborhood. On average, around 83 percent of the families had a change in the composition of
the schools in their priority set. For these families, the change in composition involved an average
of 31 percent of schools in their set (see Appendix H for details). As will become apparent shortly,
it will be relevant to distinguish between: (i) families that live in the center of the old neighborhood
and (ii) families that live in the corner of the old neighborhood.
In order to illustrate these changes, we classify schools for each family, given their address of
residence, as follows:
• Yes-Yes Schools (YY hereafter): in the old neighborhood and in the new neighborhood.
• Yes-No Schools (YN hereafter): in the old neighborhood but not in the new neighborhood.
• No-Yes Schools (NY hereafter): not in the old neighborhood but in the new neighborhood.
• No-No Schools (NN hereafter): not the old neighborhood and not in the new neighborhood.
Figures 2 and 3 illustrate the change in the set of priority schools for different families (or
different addresses). Diamonds, pentagons, triangles, and hexagons in these graphs represent
schools. The (orange) building is a particular family/address. The (green) square represents the
old neighborhood, and the (purple) circle refers to the new neighborhood for a family that lives in
the center of the old neighborhood (Figure 2) and for a family that lives in the corner of the old
neighborhood (Figure 3). Schools inside the circle are YY schools; that is, these schools were also
in the old neighborhood (square). Schools outside the circle but inside the square are YN schools;
they used to be in the old neighborhood but are not in the new neighborhood. For families living
in the corner of the old neighborhood, there are also NY schools, which were not inside the old
neighborhood but are inside the new neighborhood. Finally, schools outside the square are NN
schools; they were not in the old neighborhood and are not in the new neighborhood either.36
36
In terms of priority points, families applying to their YY schools received 30 priority points both before and
after 2007; families applying to their YN schools received 30 priority points before 2007 and 15 points after 2007;
families applying to their NY schools received 10 priority points before 2007 and 30 points after 2007; and families
14EE
zE
zz
Figure 2: Change in the school priority set for an address in the center of the old neighborhood
Note: Diamonds are YY schools, triangles are YN schools, and hexagons are NN schools for the (orange) building.
The reduction in the size of the set of schools for which families have priority allows us to
identify YN schools as well as YY schools for any address in the city (see Figures 2 and 3). The
change in composition of the set of schools for which families have priority allows us to identify NY
schools for those addresses that are sufficiently far away from the center of the old neighborhood
(see Figure 3). On average for the period of study, we have 83 percent of families for whom the
set of priority schools changed both in size and in composition, whereas for 17 percent it only
changed in size. The two changes (size and composition) of the priority set allow us to identify the
different types of schools for each block of houses. It is worth noting that by construction of new
neighborhoods, the distance from families’ residences to any school in the neighborhood is reduced
after 2007. However, this fact carries no mileage for our identification strategy. If preferences drive
choices (and families care about a shorter distance to school), then the definition of neighborhood
is irrelevant. And if priorities are drivings choices, then distance is irrelevant.
Our key insight is that we can learn what drives families’ choices (preferences or priorities) by
looking at the changes in demand for these different types of schools before and after the change
of the definition of neighborhood. We explain our strategy in detail in the next subsection.
5.3 Testable hypothesis
As seen in Table 3, a huge majority of families apply for a school in their neighborhood. But from
this fact alone we cannot infer what drives parents’ choices. Key for our analysis is to examine
the response to incentives by families after the change in the neighborhood definition in 2007. As
applying to their NN schools received 10 priority points before 2007 and 10 points after 2007 (except for public
schools in the district for which the change would be from 10 to 15; see Appendix A for a further discussion).
15EE
zE
zz
Ez
Figure 3: Change in the school priority set for an address in the corner of the old neighborhood
Note: Diamonds are YY schools, pentagons are NY schools, triangles are YN schools, and hexagons are NN schools for the (orange)
building.
already argued, for parents who chose a school in 2007, it is very unlikely that they were able to
change residence. Therefore, as discussed in Section 4, we are left with two mutually exclusive
reasons for choice: preferences versus priorities.
The key for our identification is the following. If families choose according to their preferences,
then we should observe no change in choices after the change in the neighborhood definition
(assuming that preferences have not changed over time). Instead, if families play it safe, then
we should observe that their choices change. In particular, if safety is driving choice, we should
observe the following changes:
Hypothesis 0: If priorities are driving school choice, the proportion of families asking for
the different types of schools should only change between the years 2006 and 2007, when the
neighborhoods were changed. And we should observe no changes between the years 2005 and 2006,
nor between the years 2007, 2008, 2009, and 2010. But if preferences are driving school choice, the
proportion of families asking for the different types of schools should not change over time.
Hypothesis 1: If priorities are driving school choice, the proportion of families that ask for YN
schools should decrease between 2006 and 2007, given that these schools become less safe after the
neighborhood change. But if preferences are driving school choice, we should observe no change.
Hypothesis 2: If priorities are driving school choice, the proportion of families asking for NY
schools should increase between 2006 and 2007, given that these schools become safer to apply for
after the neighborhood change. But if preferences are driving school choice, we should observe no
change.
Regarding YY schools, since the set of schools with high priority has been reduced, if families’
16You can also read


