Ericsson Mobility Report - ON THE PULSE OF THE NETWORKED SOCIETY 2016 - ABC.es

Page created by Kirk Craig
 
CONTINUE READING
Ericsson Mobility Report - ON THE PULSE OF THE NETWORKED SOCIETY 2016 - ABC.es
Ericsson
Mobility
Report
ON THE PULSE OF THE NETWORKED SOCIETY

 JUNE 2016
Ericsson Mobility Report - ON THE PULSE OF THE NETWORKED SOCIETY 2016 - ABC.es
Key figures
                                                                                             2021                      CAGR
     Mobile subscription essentials                                2014     2015           forecast                  2015–2021           Unit
     Worldwide mobile subscriptions                                 7,100   7,300              9,000                     5%              million
     > Smartphone subscriptions                                    2,600    3,200              6,300                    10%              million

     > Mobile PC, tablet and mobile                                 250     250                  300                    5%              million
       router* subscriptions
     > Mobile broadband subscriptions                              2,900    3,500              7,700                    15%              million
     > Mobile subscriptions, GSM/EDGE-only                         4,000    3,600              1,200                    -15%             million
     > Mobile subscriptions, WCDMA/HSPA                            1,900    2,100              3,100                     5%              million
     > Mobile subscriptions, LTE                                     500    1,000              4,200                    25%              million
     > Mobile subscriptions, 5G                                                                   150                                    million

                                                                                             2021                      CAGR
     Traffic essentials**                                          2014     2015           forecast                  2015–2021           Unit
     > Monthly data traffic per smartphone**                         1.0     1.4                  8.9                   35%            GB/month
     > Monthly data traffic per mobile PC**                          3.9     5.8                  20                    25%            GB/month
     > Monthly data traffic per tablet*                              1.8     2.6                  10                    25%            GB/month
     Total monthly mobile data traffic                               3.2     5.3                  52                    45%             EB/month
     Total monthly fixed data traffic                                50       60                  150                   20%             EB/month

                                                                                          Multiplier                                     CAGR
     Mobile traffic growth forecast                                                      2015–2021                                     2015–2021
     All mobile data                                                                              10                                      45%
     > Smartphones                                                                                12                                      50%
     > Mobile PC                                                                                   2                                      15%
     > Tablets                                                                                     6                                      35%

     Monthly data traffic
     per smartphone                                                         2015               2021                                      Unit
     > Western Europe                                                        1.9                  18                                   GB/month
     > Central and Eastern Europe                                            1.4                  11                                   GB/month
     > Middle East and Africa                                                1.0                  6.0                                  GB/month
     > Asia Pacific                                                          1.0                  6.5                                  GB/month
     > North America                                                         3.7                  22                                   GB/month
     > Latin America                                                         1.2                  7.0                                  GB/month

* Fixed Wireless Access (FWA) subscriptions not included
** Active devices
                                                                            Key contributors
Traffic exploration tool                                                    Executive Editor:		    Patrik Cerwall
Create your own graphs, tablets and data using the Ericsson                 Project Manager: 		    Anette Lundvall
Traffic Exploration Tool. The information available here can be             Editors: 		            Stephen Carson, Anette Lundvall
filtered by region, subscription, technology, traffic and device type.      Forecasts: 		          Richard Möller, Susanna Bävertoft
                                                                            Articles: 		Anna Jacobsson, Git Sellin, Michael Björn, Vishnu Singh,
To find out more, visit www.ericsson.com/ericsson-mobility-report                                Stephen Carson, Reiner Ludwig, Lasse Wieweg,
There you will also find new regional reports and the                                            Jonas Edstam, Per Lindberg, Kati Öhman
Mobile Business Trends report                                               Regional appendices: Ritva Svenningsson

2 ERICSSON MOBILITY REPORT JUNE 2016
Ericsson Mobility Report - ON THE PULSE OF THE NETWORKED SOCIETY 2016 - ABC.es
Ericsson
Mobility Report
IoT is expected to will surpass mobile phones as
the largest category of connected devices in 2018
                                                                                                                                        FORECAST
In this Ericsson Mobility Report, we                            Weather impacts almost everything
continue to describe the evolution                              we do, and accurate weather forecasts                                 04 Mobile subscriptions Q1 2016
towards the Networked Society.                                  are vital.
                                                                                                                                      06 Mobile subscriptions outlook
Between 2015 and 2021, IoT                                      We also examine how teens drive the                                   08 Regional subscriptions outlook
is expected to increase at a                                    changing TV/video viewing behavior,
                                                                                                                                      10 The Internet of Things
compounded annual growth rate                                   which is moving from traditional TVs
(CAGR) of 23 percent, making up                                 to streaming video on smartphones.                                    12 Voice over LTE outlook
15 billion of the total forecast 28 billion
connected devices by 2021.                                      The article on managing user
                                                                experience describes how high traffic                                 13 Mobile traffic Q1 2016
LTE subscriptions grew at a high rate                           load in less than a tenth of the mobile                               14 Mobile traffic outlook
during Q1 2016. There were 150 million                          radio cells in metropolitan areas can
                                                                                                                                      16 Mobile traffic by application
new subscriptions during the quarter,                           affect more than half of the user
reaching a total of 1.2 billion                                 activity over the course of 24 hours.
worldwide. Subscriptions associated                                                                                                   18 State of the networks
with smartphones also continue to                               Finally, we discuss the need for global
increase, and are expected to exceed                            spectrum harmonization to secure
those for basic phones in Q3 this year.                         early 5G deployments.                                                    articles
We have included four feature articles                          We hope you find the report
in this report, exploring various                               engaging and valuable.                                                21	Microweather: unlocking potential
aspects of the mobile industry.                                                                                                       24 Growing up streaming
                                                                PUBLISHER
First we look into how microwave                                Rima Qureshi,                                                         26 Managing user experience
backhaul links can be used as                                   Senior Vice President,                                                28 T
                                                                                                                                          he need for spectrum
accurate, high resolution rainfall                              Chief Strategy Officer                                                    harmonization
measurement tools.

                                                                                                                                      30 Methodology
                                                                                                                                      31 Glossary

PAGE                                                            PAGE                                                             PAGE

10
IoT is expected to surpass
                                                                18
                                                                 LTE data speeds of 1 Gbps
                                                                                                                                24
                                                                                                                                 Teens have increased
mobile phones as the largest                                     will be commercially available                                  smartphone TV/video viewing
category of connected                                            in 2016                                                         at home by 85 percent in 4 years
devices in 2018

The content of this document is based on a number of theoretical dependencies and assumptions and Ericsson shall not be bound
by or liable for any statement, representation, undertaking or omission made in this document. Furthermore Ericsson may at any time
change the contents of this document at its sole discretion and shall not be liable for the consequences of such changes.

                                                                                                                                         JUNE 2016 ERICSSON MOBILITY REPORT 3
Ericsson Mobility Report - ON THE PULSE OF THE NETWORKED SOCIETY 2016 - ABC.es
Mobile subscriptions
q1 2016
The total number of mobile subscriptions in Q1 2016 was
around 7.4 billion, including 65 million new subscriptions

Mobile subscriptions are growing around 3 percent
year-on-year globally and reached 7.4 billion in Q1 2016.
India grew the most in terms of net additions during the                                                        In Q1 2016:
quarter (+21 million), followed by the US (+5 million), Myanmar                                                 7.4 billion mobile subscriptions, 3.7 billion
(+5 million), Indonesia (+5 million) and Pakistan (+3 million).                                                 mobile broadband subscriptions and
Mobile broadband subscriptions1 are growing by                                                                  3.4 billion smartphone subscriptions
around 20 percent year-on-year, increasing by
approximately 140 million in Q1 2016 alone.

LTE subscriptions continue to grow strongly, with                                                            Subscriptions associated with smartphones
150 million new subscriptions. The total number                                                              continue to increase. During Q3 2016 the number
of LTE subscriptions is now around 1.2 billion.                                                              of smartphone subscriptions will surpass those for
WCDMA/HSPA added around 30 million during the                                                                basic phones. In Q1 2016 smartphones accounted
quarter. The majority of 3G/4G subscriptions have                                                            for close to 80 percent of all mobile phones sold.
access to GSM/EDGE as a fallback. GSM/EDGE-only
subscriptions declined by 70 million during Q1 2016.

                                                                         1,425

                                                                                                                              1,295

                                                                                                                                                   1,035
                                                                                                                                         965

                                                710
                                                                          APAC (excluding China and India)

                      590
                                      550

                                                                395                                                400
                     Eastern Europe

                                                Latin America
                     Central and

                                      Western

                                                                                                                   America
                                      Europe

                                                                Middle

                                                                                                                                          Africa
                                                                                                                               China
                                                                                                                   North

                                                                                                                                                     India
                                                                East

                  Mobile subscriptions (millions)

1
    Mobile broadband is defined as HSPA, LTE, CDMA2000 EV-DO, TD-SCDMA and Mobile WiMAX.

4 ERICSSON MOBILITY REPORT JUNE 2016
Ericsson Mobility Report - ON THE PULSE OF THE NETWORKED SOCIETY 2016 - ABC.es
New mobile subscriptions Q1 2016

                                                   CEE                            Western Europe

                                                   2 million                                   1 million                                                                                                         65 million new
                                                                                    L a ti n                                                                                                                     mobile subscriptions
                                                                                                                   Am
                                                                                                                            eric
                                                                                                                                   a                                                                             globally in Q1 2016
                                                                                                                                            M
                                                                                                                                                id
                                                                                                                                                     dl
                                                                                      6                                                                   e

                                                                                                                                                          Ea
                                                                                  million

                                                                                                                                                              st
                                                                                                                                       4                                                                    Top 5 countries by
                                                                                                                              million
                          ia

                                                                                                                                                                                                            net additions Q1 2016
                         Ind

                                  21
                                million                                                                                                                                                                     1   India         +21 million
                                                                                                                                                                                                            2   USA            +5 million
                                                                                                                                                                                                            3   Myanmar        +5 million

                                                                                                                                                                              hin a a n d India)
                                                                                                                                                                                                            4   Indonesia      +5 million
                                                                                                                                                                                                            5   Pakistan       + 3 million
                                                                                                                                                              21
                                                                                                                                                      million

                                                                                                                                                                          i ng C
                                                                                                                                                                       clud
                                                                                                                                                                     (e x
                                                                                                                                                                     AC
                                                                                                                                                                   AP
                                                     16
                                                    million
                                                                                     5
                                    Af
                                         ric
                                               a
                                                                                  million                                                                                                                        5 billion
                                                                                                                            rica
                                                                                                                                                                                                                 subscribers
                                                                                                          A me
                                                                                  N or th

                                                             China

                                                             -11 million   2

                                                                                                                                                                              The number of mobile subscriptions exceeds the
                                                                                                                                                                              population in many countries. This is largely due to
                                                                                                                                                                              inactive subscriptions, multiple device ownership
                                                                                                                                                                              or optimization of subscriptions for different types
        144%                                                                                                                                                                  of calls. This means the number of subscribers
                                                                                                                                                                              is lower than the number of subscriptions. Today
                               131%
                                                                                                                                                                              there are around 5 billion subscribers compared
                                                                                                                                                                              to 7.4 billion subscriptions.
                                                      112%               113%                                                          110%
                                                                                    108%
                                                                                                                                                                                                                                         100%
                                                                                                                                                                    92%
                                                                                                                                                                                                   81%             80%
                                                                                         APAC (excluding China and India)

                                                                                                                                                                                                                                             Global penetration
        Eastern Europe

                                                         Latin America
        Central and

                               Western

                                                                                                                                           America
                               Europe

                                                                         Middle

                                                                                                                                                                                                   Africa
                                                                                                                                                                      China
                                                                                                                                           North

                                                                                                                                                                                                                    India
                                                                         East

      Penetration (percent of population)

2
    China Unicom has removed inactive subscriptions

                                                                                                                                                                                                                JUNE 2016 ERICSSON MOBILITY REPORT 5
Ericsson Mobility Report - ON THE PULSE OF THE NETWORKED SOCIETY 2016 - ABC.es
MOBILE SUBSCRIPTIONS
OUTLOOK
5G subscription uptake expected to be faster than for 4G

Global mobile broadband                                  Many PCs and tablets are used                          commercially in 2020. The launch
subscriptions will reach 7.7 billion by                  without a mobile subscription, one                     of pre-standard, pre-commercial
2021, accounting for 85 percent of all                   reason being the price difference                      networks is anticipated earlier in
subscriptions. Mobile broadband will                     between Wi-Fi only models and those                    selected markets. 5G subscriptions
complement fixed broadband in some                       with mobile capabilities. Despite this,                will provide enhancements in mobile
segments, and will be the dominant                       the number of devices with mobile                      broadband services, as well as enable
mode of access in others.1                               capabilities and a subscription will                   a wider range of use cases, e.g. for
                                                         increase by 20 percent by 2021.                        the Internet of Things (IoT).

                                                                                                                In 2021, South Korea, Japan, China
                                                         150 million 5G subscriptions
                                                         by the end of 2021                                     and the US are expected to have the
                                                                                                                fastest uptake of 5G subscriptions.
        By 2021 there will be:                           5G will offer a wider range of services
        9 billion mobile subscriptions,                  and will open up new industries                        A 5G subscription requires a device
                                                         and verticals.                                         capable of supporting 5G services
        7.7 billion mobile broadband
                                                                                                                and use cases, connected to a 5G
        subscriptions and 6.3 billion                    5G networks, based on standards that                   enabled network.
        smartphone subscriptions                         will meet ITU IMT-2020 requirements,
                                                         are expected to be deployed

Subscriptions/lines, subscribers (billion)

10

                                                                                                                         Mobile subscriptions
    9
                                                                                                                         Mobile broadband
    8
                                                                                                                         Mobile subscribers

    7                                                                                                                    Fixed broadband subscriptions

    6                                                                                                                    Mobile PCs, tablets
                                                                                                                         and mobile routers2

    5

    4

    3

    2

    1

    0
        2011     2012     2013     2014      2015     2016     2017     2018     2019     2020     2021

1
     he number of fixed broadband users is at least three times the number of fixed broadband connections, due to multiple usage in households,
    T
    enterprises and public access spots. This is the opposite of the mobile phone situation, where subscription numbers exceed user numbers
2
    Fixed Wireless Access (FWA) subscription not included

6 ERICSSON MOBILITY REPORT JUNE 2016
Ericsson Mobility Report - ON THE PULSE OF THE NETWORKED SOCIETY 2016 - ABC.es
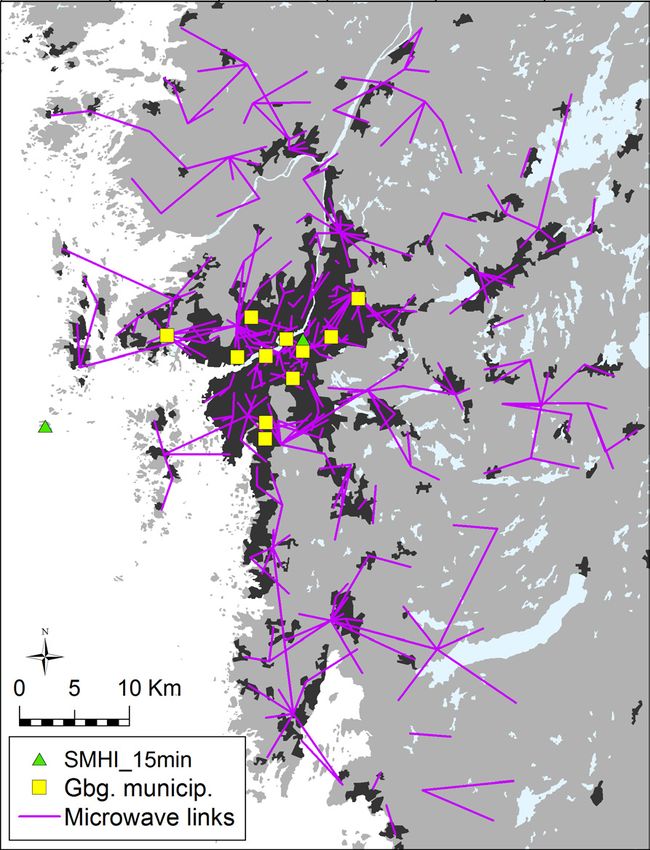
Mobile subscriptions by technology (billion)

                                                                                               9
10
                                                                                            billion

9                                  7.3
                                  billion                                                                               4.2
8                                                                                                                  billion LTE
7                                                                                                                 subscriptions
6
                                                                                                                   by the end
                                                                                                                    of 2021
5

4
                                                                                                          5G
3
                                                                                                          LTE
2                                                                                                         WCDMA/HSPA
                                                                                                          GSM/EDGE-only
1
                                                                                                          TD-SCDMA
0                                                                                                         CDMA-only
     2011   2012   2013    2014    2015     2016      2017        2018      2019     2020    2021         Other

In 2019, LTE will be the dominant mobile access technology                     However, in developing markets it remains a viable
                                                                              option as less affluent users are likely to choose
GSM/EDGE-only subscriptions presently represent the
                                                                              a low-cost mobile phone and subscription. The
largest share of mobile subscriptions, but in 2021, both
                                                                              majority of 3G/4G subscriptions in all regions will
LTE and WCDMA/HSPA subscription numbers will be more
                                                                              still have access to GSM/EDGE as a fallback.
than double GSM/EDGE-only subscriptions. In developed
markets, there has already been a substantial migration to                    LTE subscriptions reached the first billion during
more advanced technologies, and on a global level this has                    2015, and will make up the largest share of all
resulted in a slight decline in GSM/EDGE-only subscriptions.                  subscriptions by 2021, totaling 4.2 billion.

Smartphone subscriptions set                  Smartphone subscriptions per region 2015–2021
to almost double by 2021
                                                   Latin America                                                            6.3
Most mobile broadband devices are,                 North America                                                           billion
and will continue to be, smartphones.              Asia Pacific                                 Total
                                                                                              additions
Many consumers in developing                       Middle East and Africa
markets first experience the internet              Central and Eastern Europe                   +3
on a smartphone, usually due to                    Western Europe                             billion
limited access to fixed broadband.
It took over five years to reach the
first billion smartphone subscriptions,
a milestone that was passed in 2012,
and less than two years to reach
the second billion. This growth will                                 3,2                       +230
                                                                    billion
continue, fueled by massive growth
in markets such as the Middle East                                                             +90
and Africa, where smartphone
subscriptions will increase more than
200 percent between 2015–2021.                                                                +1,700

                                                                                               +730

                                                                                               +180

                                                                                               +110
                                                                     2015                                                   2021

                                                                                                               JUNE 2016 ERICSSON MOBILITY REPORT 7
Ericsson Mobility Report - ON THE PULSE OF THE NETWORKED SOCIETY 2016 - ABC.es
regional SUBSCRIPTIONS
OUTLOOK
There is an increase in mobile subscriptions
across all regions, but the underlying factor
driving change is mobile broadband

The number of mobile subscriptions is continuing to grow
across regions. Greater device affordability is encouraging
new subscribers in developing regions, whereas growth in
mature markets is largely due to individuals adding more
devices. Local economic conditions also have a significant
impact on the uptake of subscriptions in different regions.
The growth is fueled by the strong uptake of mobile
broadband subscriptions across most regions.

Mobile broadband subscription growth is expected to be
particularly strong in the Middle East and Africa due to a
young and growing population, rising GDP and smartphone
uptake. Several countries in the Asia Pacific region will also
experience a strong mobile broadband subscription uptake
over the next five years, while more mature regions like
North America and Europe will have more moderate growth.

    Mobile broadband subscriptions by region (billion)

    9

    8
                                                                                        4X growth in mobile
    7                                                                                   broadband subscriptions
                                                                                        in Middle East and Africa
    6
                                                                                        between 2015 and 2021

    5

    4

    3
                                                                                                  Latin America
                                                                                                  North America
    2                                                                                             Asia Pacific
                                                                                                  Middle East and Africa
                                                                                                  Central and Eastern Europe
    1
                                                                                                  Western Europe

    0
         2011   2012   2013   2014     2015   2016   2017   2018   2019   2020   2021

8 ERICSSON MOBILITY REPORT JUNE 2016
Ericsson Mobility Report - ON THE PULSE OF THE NETWORKED SOCIETY 2016 - ABC.es
Mobile subscriptions by region and technology (percent)

      LTE/5G
      WCDMA/HSPA
      GSM/EDGE-only
      TD-SCDMA               Middle East and Africa will                       90 percent of subscriptions
      CDMA-only
                             see a dramatic shift from                         in Western Europe and
      Other
                             2G to a market where almost                       95 percent in North America
                             80 percent of subscriptions                       will be for LTE/5G by 2021
                             will be for 3G/4G

          2015        2021     2015       2021     2015      2021       2015      2021        2015     2021         2015      2021
100
                                         50%               45%                  60%                   90%                   95%
                                         LTE/5G
                                                  45%      LTE/5G
                                                                      50%       LTE/5G                LTE/5G                LTE/5G

                                                  WCDMA/              WCDMA/
                                                  HSPA                HSPA
80

        75% 55 %
            WCDMA/
                                                                                             55%
                                                                                             WCDMA/
        GSM/        HSPA                                                                     HSPA
        EDGE-only
60
                             50%
                             GSM/
                             EDGE-only

40                                                                                                                 25%
                                                                                                                   WCDMA/
                                                                                                                   HSPA

20

  0
              Middle East        Asia Pacific          Latin             Central and             Western                 North
              and Africa                              America           Eastern Europe           Europe                 America

Mobile subscriptions in Middle East and Africa and                  This is despite an already ongoing massive deployment of
Asia Pacific are mainly GSM/EDGE-only, while in                     LTE in China which will result in 1.1 billion LTE subscriptions
Western Europe and North America the majority                       in the country by the end of 2021 – around one quarter
are WCDMA/HSPA and LTE                                              of the global total. Also, countries like South Korea
Middle East and Africa is a region experiencing economic            and Japan were among the first countries to adopt
growth and improved living standards in several                     LTE. These two countries accounted for 14 percent
countries. Combined with increasing availability of low             of global LTE subscriptions at the end of 2015.
cost smartphones and demand for mobile broadband                    In Central and Eastern Europe, the share of WCDMA/HSPA
services, there will be a shift from a voice centric                subscriptions is increasing and LTE networks are present
GSM/EDGE-only majority of subscriptions in 2015 to                  in almost all countries.
a majority of WCDMA/HSPA and LTE-subscriptions
by 2021. However, GSM/EDGE-only subscriptions
                                                                    5G initial deployments
will still have a significant share in the region by 2021.
In Sub-Saharan Africa, WCDMA/HSPA will become                       5G subscriptions will provide enhancements in mobile
predominant towards 2021, due to the high number of                 broadband services, as well as enabling a widening range
lower income consumers using 3G-enabled handsets.                   of use cases for the IoT. The US, Japan, China and South
                                                                    Korea are expected to be the first countries where 5G
Asia Pacific is a diverse region and the regional share             subscriptions will be available.
of LTE subscriptions will be around 50 percent in 2021.

                                                                                                 JUNE 2016 ERICSSON MOBILITY REPORT 9
the internet
of things
Growth in the number of connected devices is driven by emerging applications
and business models, and supported by falling device costs

Mobile phones continue to be the                           meters, remote metering and consumer                 In total, around 28 billion connected
largest category of connected devices1,                    electronics. IoT devices are expected                devices are forecast by 2021, of
but in 2018 they are expected to be                        to increase at a compounded annual                   which more than 15 billion will
surpassed by IoT, which includes                           growth rate (CAGR) of 23 percent from                be related to IoT.
connected cars, machines, utility                          2015 to 2021, driven by new use cases.

Connected devices (billions)

30
                                                                                                                          15         28        CAGR
25                                                                                                                      billion    billion   2015–2021

20                                                                                               Cellular IoT             0.4       1.5         27%

15
                                                                                                 Non-cellular IoT         4.2       14.1        22%

                                                                                                 PC/laptop/tablet         1.7       1.8          1%
10

                                                                                                 Mobile phones            7.1       8.6         3%
    5
                                                                                                 Fixed phones             1.3       1.4         0%
    0
          2014       2015      2016      2017       2018      2019      2020      2021                                   2015       2021

        IoT connected devices are
        expected to surpass mobile
        phones in 2018

1
     our forecast a connected device is a physical object that has an IP stack, enabling two-way
    In
    communication over a network interface. Traditional landline phones are included for legacy reasons

10 ERICSSON MOBILITY REPORT JUNE 2016
1.5 billion IoT devices with                            requirements and small data traffic        with very low latency. Examples
cellular subscriptions by 2021                          volumes. Examples include smart            include traffic safety, autonomous
                                                        buildings, transport logistics,            cars, industrial applications, remote
There were around 400 million IoT
                                                        fleet management, smart meters             manufacturing and healthcare
devices with cellular subscriptions at
                                                        and agriculture. Many things will          including remote surgery. Today, LTE’s
the end of 2015. The number of cellular
                                                        be connected through capillary             share of cellular IoT device penetration
connected devices is expected to
                                                        networks.2 This will leverage the          is around five percent. Cost reductions
grow substantially, reaching 1.5 billion
                                                        ubiquity, security and management          will make LTE-connected devices
in 2021. This is due to increased
                                                        of cellular networks. Today, around        increasingly viable, enabling new, very
industry focus, 3GPP standardization
                                                        70 percent of cellular IoT modules         low latency applications. This will be
of LTE-based Narrowband-IoT
                                                        are GSM-only. Network mechanisms           achieved by reducing complexity and
technology and EC-GSM-IoT as well
                                                        are being implemented, resulting           limiting modems to IoT application
as the growing maturity of operators’
                                                        in extended network coverage for           capabilities. Evolved functionality in
IoT business. Cellular connections
                                                        low-rate applications. Additional          existing LTE networks as well as 5G
benefit from enhancements in
                                                        functionality will allow existing          capabilities is expected to extend the
provisioning, device management,
                                                        networks to support different device       range of addressable applications
security and service enablement
                                                        categories, and enable prioritization      for critical IoT deployments.
supporting new applications.
                                                        of devices accessing the network.
                                                        Network systems improvements               Between 2015 and 2021, IoT
Within IoT, two major market
                                                        such as sleep mode will support            connections are expected to grow with
segments with different
                                                        battery lifetimes beyond 10 years          a CAGR of 23 percent. Over that time,
requirements are emerging:
                                                        for remote cellular devices.               Western Europe will add the most
massive and critical applications.
                                                                                                   connections, led by growth within the
Massive IoT connections are                             Critical IoT connections are               connected car segment. A connected
characterized by high connection                        characterized by requirements              car is counted as one device, though
volumes, low cost, low energy                           for ultra-reliability and availability,    it may have hundreds of sensors.

IoT connected devices: cellular and non cellular (billions)

6

5                                                                                                      The number of IoT devices
                                                                                                       is projected to quadruple
4                                                                                                      in Western Europe
                                                                                                       between 2015 and 2021
3

2
                                                                                                       Latin America
                                                                                                       North America
1                                                                                                      Asia Pacific
                                                                                                       Middle East and Africa
                                                                                                       Central and Eastern Europe
0                                                                                                      Western Europe
      2009           2011          2013          2015           2017          2019          2021

2
    Connected devices connecting to a wide area network through a common gateway

                                                                                                        JUNE 2016 ERICSSON MOBILITY REPORT 11
Voice over
LTE outlook
The first commercial launch of voice over LTE (VoLTE) took place in 2012 and the technology
has now been launched commercially in more than 55 networks in over 30 countries

At the end of 2015 there were more                  70 percent of all LTE voice calls are      In April 2016 there were more than
than 100 million VoLTE subscriptions.1              provisioned using VoLTE instead            340 VoLTE-enabled smartphone
The uptake is expected to accelerate                of utilizing 2G/3G using circuit           models, supporting different
in the coming years, with 2.3 billion               switched voice.                            regions and frequencies.2
subscriptions projected by 2021 –
equal to more than 50 percent of                    Many barriers to VoLTE adoption,           The VoLTE platform enables
all LTE subscriptions globally. In                  such as adapting charging and              services such as HD voice, video
the US, Canada, Japan and South                     IT systems, having adequate LTE            communication, IP messaging as well
Korea, uptake is projected to be even               coverage and interoperability              as new service innovations. Operators
faster, with around 80 percent of LTE               between vendors’ implementations,          which deploy the technology are
subscriptions using VoLTE by 2021.                  are now being resolved. In addition,       able to offer high-quality IP-based
Measurements indicate that there are                the penetration of VoLTE-capable           communications services across
already networks where around                       smartphones is increasing rapidly.         LTE, Wi-Fi, and fixed access
                                                                                               technologies, as well as 5G when
                                                                                               it becomes available.

       VoLTE subscriptions by region (billion)

                                                                                      2.3
       2.5                                                                           billion

                                                                                                  VoLTE subscriptions
        2                                                                                         will reach 2.3 billion
                                                                                                  by 2021

       1.5

        1

                                                                                                  Latin America
       0.5                                                                                        North America
                                                                                                  Asia Pacific
                                                                                                  Middle East and Africa
                                                                                                  Europe
        0
             2013    2014       2015       2016   2017     2018     2019     2020     2021

1
    Making at least one VoLTE call per month
2
    GSA (April 2016)

12 ERICSSON MOBILITY REPORT JUNE 2016
mobile traffic
q1 2016
 Mobile data traffic continues to grow, and the graph below shows
 total global monthly data and voice traffic from Q1 2011 to Q1 2016.1
 It depicts a continued strong increase in data traffic, and voice
 traffic growth in the mid-single digits per year. The growth in data
 traffic is being driven both by increased smartphone subscriptions
 and a continued increase in average data volume per subscription,
 fueled primarily by more viewing of video content.

 Data traffic grew around 10 percent quarter-on-quarter and
 60 percent year-on-year. It should be noted that there are large
                                                                                                                                                        60%
                                                                                                                                                         Data traffic grew
 differences in traffic levels between markets, regions and operators.
                                                                                                                                                         60% between Q1
                                                                                                                                                         2015 and Q1 2016
                                                       6

                                                       5
Total (uplink + downlink) monthly traffic (ExaBytes)

                                                       4

                                                       3

                                                       2

                                                       1

                                                              Voice
                                                              Data

                                                       0
                                                            Q1    Q2   Q3   Q4    Q1    Q2   Q3   Q4    Q1        Q2      Q3     Q4     Q1     Q2      Q3     Q4     Q1     Q2     Q3     Q4     Q1
                                                           2011                  2012                  2013                            2014                         2015                        2016

 Source: Ericsson traffic measurements (Q1 2016)                                                              1
                                                                                                                  Traffic does not include DVB-H, Wi-Fi, or Mobile WiMAX. VoIP is included in data traffic

                                                                                                                                                              JUNE 2016 ERICSSON MOBILITY REPORT 13
mobile traffic
outlook
Global mobile traffic (monthly ExaBytes)
60

50

                                                                                       12X
             Data: mobile PCs, tablets
             and mobile routers
                                                                                                       Between 2015 and 2021,
             Data: smartphones                                                                         there will be a 12X growth
40           Voice                                                                                     in smartphone traffic

30
                                                                                 Total mobile data traffic is expected
20
                                                                                 to rise at a compound annual growth
                                                                                 rate (CAGR) of around 45 percent
                                                                                 The growth in mobile data traffic is due to both the rising
 10
                                                                                 number of smartphone subscriptions, in particular for
                                                                                 LTE smartphones, and increasing data consumption
 0                                                                               per subscriber. This is forecast to result in a ten-fold
      2015                           2018                           2021         increase in total traffic for all devices by the end of 2021.

                                                                                 There are large differences in subscribers’ data
                                                                                 consumption patterns between networks, markets
                                                                                 and subscriber segments. Factors such as data plans,
                                                                                 user device capabilities and network performance
                                                                                 all impact data consumption per subscriber. Even
                                                                                 switching to a new version of the same device could
                                                                                 typically increase data consumption by 25–40 percent.
                       Around 90% of mobile data
                       traffic will be from smartphones
                       by the end of 2021

       Monthly data traffic per smartphone (GB)                                          North America is the region in the world
                                                                                         with the highest monthly data usage per
        25
                                                                                         active smartphone subscription. This trend
                                                                                         will continue in the coming years. In 2021,
        20
                                                                                         monthly smartphone data usage per active
                                                                                         subscription in North America (22 GB) will be
        15
                                                                                         1.2 times that of Western Europe (18 GB) and
                                                                                         3 times that of Asia Pacific (7 GB). Western
        10                                                                               Europe will experience a nine fold growth
                                                                                         in monthly smartphone data usage per
         5                                                                               user between 2015 and 2021. Due to the
                                                                                         growth in the number of subscriptions, the
         0                                                                               Asia Pacific region will have the largest
             2015 2021 2015 2021         2015 2021 2015 2021 2015 2021     2015 2021
             Middle East  Asia             Latin   Central and Western       North
                                                                                         share of total smartphone traffic in 2021.
             and Africa  Pacific          America Eastern Europe Europe     America

14 ERICSSON MOBILITY REPORT JUNE 2016
Asia Pacific will have the largest
share of mobile data traffic in 2021,                                                       2015                     Multiplier
due to it being the most populous               Mobile data traffic by region               (EB/month)               2015–2021
region and a rapid growth in
subscriptions. China alone will add             Asia Pacific                                2.1                      11
210 million mobile subscriptions                Central Europe and
                                                                                            0.8                      13
between end 2015 and 2021                       Middle East and Africa

With varying levels of maturity,                Western Europe                              0.8                      10
diversity is a key feature of the mobile        North America                               1.3                      7
broadband market in Asia Pacific.
For example, South Korea and Japan              Latin America                               0.4                      9
deployed LTE early, and with fast
penetration take-up, markets such
as Singapore and Hong Kong are             Global mobile data traffic (monthly ExaBytes)
highly advanced. GSM is still the
dominant technology in the less            25
developed countries, and insufficient
network quality and the cost of data
subscriptions remain barriers to
higher mobile data consumption.

Central Europe and Middle East
and Africa will experience a 13-fold       20

increase up to 2021, driven by a strong                                             There will be 13X mobile

                                                               13X
growth in smartphone subscriptions
                                                                                    data traffic in Central
and demand for data-intensive
applications like video.                                                            Europe and Middle East
                                                                                    and Africa up to 2021
North America and Western Europe
                                           15
currently have a larger share of total
traffic volume than their subscription
numbers imply. This is due to high
penetration of high-end user devices                           Mobile PCs, tablets and
                                                               mobile routers
and well built-out WCDMA and LTE
                                                               Smartphones
networks with affordable packages
of large data volumes. This leads to       10
higher data usage per subscription.

                                            5

                                            0
                                                   2015    2021        2015       2021   2015      2021       2015    2021     2015     2021
                                                     North               Latin           Western             Central Europe       Asia Pacific
                                                    America             America          Europe                and MEA

                                                                                                          JUNE 2016 ERICSSON MOBILITY REPORT 15
mobile traffic
by application
Mobile video traffic is increasingly dominant

Mobile video traffic is forecast to grow by around 55 percent                                Mobile traffic by app category CAGR 2015-2021 (percent)
annually through 2021, when it should account for over
two-thirds of all mobile data traffic.1 While social networking
is forecast to grow by 40 percent annually over the coming                                                                                                 55%
six years, its relative share of traffic will decline from
15 percent in 2015 to around 10 percent in 2021, as a result
of the stronger growth in the video category. The rest of the
application categories have annual growth rates ranging                                                                                         40%
from 20 to 36 percent, so are shrinking in proportion to                                                                              36%
                                                                                                                            34%
the whole. The trend is accentuated by the growing use of
embedded video in social media and web pages, which
is considered video traffic in this context.                                                                   25%
                                                                                                 20%
The emergence of new applications can shift the relative
volumes of different types of traffic, but the proliferation
of different sized smart devices will also affect the traffic
mix – for example, tablets are associated with a higher share
of online video traffic than smartphones. Typically, tablets
and smartphones are used equally for watching short
video content, but tablets are used more for watching                                             File         Web         Software   Audio     Social
longer video content.                                                                                                                                      Video
                                                                                                sharing      browsing      download           networking

Mobile traffic by app category per month (ExaBytes)
40

35

30

25                                       Embedded video in
                                         social media web pages
20                                       is counted as video                                                                      In 2021, video will
                                         traffic in this context                                                                  account for around 70%
15                                                                                                                                of mobile data traffic

10

    5

    0
         2015 2021         2015 2021         2015 2021         2015 2021         2015 2021         2015 2021
         File sharing         Web             Software           Audio             Social            Video
                            browsing          download                           networking

1
    Video is likely to form a major part of file sharing traffic in addition to the identified application type “video”

16 ERICSSON MOBILITY REPORT JUNE 2016
Mobile data traffic volumes by application and device type

                      0%              20%              40%             60%              80%             100%

                                              41%
        Mobile PC                                                                                                      On smartphones and
                                                                                                                       tablets, the share
                                                                                                                       of video traffic has
                                                                                                                       increased continuously
                                            55%
          Tablet

                                       43%
       Smartphone

                                                                                                                       Across all three types
                                                                                                                       of devices, social
                            File sharing          Web browsing                 Real-time communications
                            Video                 Social networking            Other
                                                                                                                       networking’s share
                            Audio                 Software download                                                    has increased

       Source: Ericsson network traffic measurements 2015

Significant increase of video traffic shares
on smartphones and tablets
Average values from measurements3 in a selected number
of commercial HSPA and LTE networks in Asia, Europe and
the Americas show that regardless of device type, video is
the largest contributor to traffic volumes (40–55 percent).
However, there is a large variation between networks.

YouTube still dominates video traffic in most mobile
networks and accounts for between 50–70 percent of total
video traffic for almost all measured networks, regardless
of terminal type. In markets where Netflix has launched
services, its share of video traffic can reach 10–20 percent
of total mobile video traffic.

For smartphones, social networking is the second largest
traffic volume contributor, with an average share of
20 percent in measured networks. There has been a
steady increase in the share of social networking traffic
on smartphones, as well as an increased share of video
traffic on smartphones and tablets in recent years.

File sharing is more prominent on mobile PCs than on other
devices, constituting around 10 percent of traffic. The very
small part of file sharing that is associated with smartphones
and tablets comes predominantly from tethering traffic.
The share of traditional web browsing traffic shows a
decreasing trend on all three types of devices.

3
    Measurements do not include Wi-Fi traffic. “Other” includes applications not possible to identify or that aren’t one of the listed application types

                                                                                                                           JUNE 2016 ERICSSON MOBILITY REPORT 17
STATE OF
THE NETWORKS
Today’s subscribers expect a high quality user experience and continual service
improvements. Evolving mobile network capabilities is key to ensuring this

WCDMA/HSPA enables mass market mobile broadband                                          Operators are also seeking additional ways to make the
                                                                                         network simple to handle and thus increase network
WCDMA/HSPA continues to experience significant growth
                                                                                         operational efficiency.
worldwide, both in terms of subscribers and population
coverage. This is expected to remain true throughout
our forecast period. The global statistics, however,                                     Achieving LTE downlink peak data speeds of 1 Gbps
mask diverging trends on a regional level.                                               The demand for app coverage continues to push LTE data
                                                                                         rates to new heights. Recent innovations will enable LTE
In some regions there is high growth of WCDMA
                                                                                         networks to support commercial LTE downlink peak data
subscriptions, as declining smartphone prices offer an
                                                                                         speeds of 1 Gbps in 2016, which has been a long sought
economic entry into mobile broadband. In others regions
                                                                                         after milestone for the wireless industry.
there is a growing focus on re-farming WCDMA frequency
bands to LTE, enabled by the ability to fit higher HSPA traffic                          Mobile users will have extremely fast time-to-content
volumes into smaller frequency allocations. This is made                                 thanks to 1 Gbps LTE peak data speeds. Also, enterprise
possible by new radio access network software functionality                              users will have immediate access to applications critical
that enhances smartphone handling and network capacity.                                  to their business.

World population coverage by technology1                                                                                    By 2021, over
                                                                                                                            90% of the world´s
         GSM/EDGE                                                                                                           population will be
                                                                                                                            covered by mobile
2015                                                   ~90%                                                                 broadband networks
                                                                                GSM/EDGE will
                                                                               retain the widest
2021                                                       ~95%                  global reach

         WCDMA/HSPA
                                                                                                                   WCDMA/HSPA is
                                                                                                                  driven by increased
2015                                             ~75%
                                                                                                                  demand for internet
                                                                                                                    access and the
2021                                                    >90%                                                      growing affordability
                                                                                                                    of smartphones

         LTE
                                                                                  LTE uptake is
2015                                 ~50%                                       driven by demand
                                                                              for an improved user
2021
                                                                                 experience and
                                                 ~75%
                                                                                 faster networks

1
    The figures refer to population coverage of each technology. The ability to utilize the technology is subject to factors such as access to devices and subscriptions

18 ERICSSON MOBILITY REPORT JUNE 2016
Percentage and number of WCDMA networks upgraded               Percentage of LTE-Advanced networks supporting
to HSPA and to HSPA 7.2, 21, 42 and 63 Mbps                    Cat 6, Cat 9, Cat 11 and Cat 16 devices

                  Initial deployments                              128 commercial                        Initial commercial
                  of HSPA 63 Mbps                                  LTE-A networks                        deployments of
                  have begun                                       launched in                           Cat 16 enabling
                                                                   61 countries                          speeds of up to
                                                                                                         1,000 Mbps are
                                                                                                         anticipated in 2016
   594                                                            128
   100%
                526
                                                                  100%
                                                                               104
                ~90%
                             420                                               ~80%
                             ~70%

                                         194
                                         ~30%
                                                                                             17
                                                                                            ~13%

                                                    2                                                     2         0
   HSPA       HSPA 7.2     HSPA 21      HSPA 42   HSPA 63         Cat 4        Cat 6        Cat 9       Cat 11     Cat 16
                                                                150 Mbps     300 Mbps     450 Mbps     600 Mbps 1,000 Mbps

Source: Ericsson and GSA (April 2016)                          Source: Ericsson and GSA (April 2016)

One gigabit of bandwidth will also enable personal hotspots    evolving their LTE-A networks with Category (Cat) 4, 6, 9,11
for use at vacation homes and small offices, for example,      and 16 implementations as can be seen in the figure above.
in addition to fixed wireless access. Faster speeds and        Cat 16 devices, which support 1 Gbps data speeds, are
increased capacity are making LTE a more attractive            expected in the second half of 2016.
alternative to deliver fixed wireless services.
                                                               These higher speeds will enhance the user experience both
One of the barriers to delivering higher LTE data speeds       indoors and outdoors. Note that network speeds mentioned
is spectrum. New commercially available LTE capabilities       here are a theoretical maximum: typical user speeds will
provide greater spectral efficiency and make the delivery      be lower and depend on factors such as device type,
of commercial LTE peak data rates of 1 Gbps feasible using     user location and network conditions.
60 MHz of spectrum. These capabilities include:

> 3 Component Carrier Aggregation – which enables
  the aggregation of 60 MHz of LTE spectrum
> 256 Quadrature Amplitude Modulation (QAM) – which                    494
                                                                                                                  422 LTE
  can increase downlink data speeds by 33 percent                    commercial
                                                                                                                deployments
> 4x4 Multiple Input Multiple Output (MIMO) – which doubles        LTE networks
                                                                                                                  of FDD
  the number of unique data streams being transmitted to               in 157
                                                                                                                 only mode
  the user’s smartphone, thereby enabling up to twice the             countries
  capacity and data throughput

When used in combination, 2 aggregated 20 MHz LTE
carriers using 4x4 MIMO and 256 QAM aggregated with a
single 20 MHz LTE carrier using 2x2 MIMO and 256 QAM can
support a LTE peak data rate of 1 Gbps over the downlink. It
                                                                                                                    21
should be noted that 256 QAM is susceptible to interference.
However, system interference can be reduced, hence
                                                                                                               deployments
                                                                        2 commercial                           of combined
increasing the utilization of 256 QAM in the network.
                                                                       LTE Broadcast                            FDD/TDD
The number of commercial LTE-Advanced (LTE-A) carrier                     networks                                 mode
aggregation launches continues to increase. Operators are

                                                               Source: Ericsson and GSA (May 2016)

                                                                                               JUNE 2016 ERICSSON MOBILITY REPORT 19
2012                                             2015
                                            Live IP messaging/RCS                                Live combined
Circuit switched voice                           plus CS voice                                 native VoLTE+RCS
(GSM, WCDMA)

Packet-switched voice
and new communication
                                                     2012               2014                         2015                      2016
services (LTE, Wi-Fi,                                 Live            Live native           Live native Wi-Fi calling   Live Evolved HD voice
fixed broadband, 5G)                                 VoLTE            Wi-Fi calling             for multi-device              for VoLTE

                                           COMMUNICATION SERVICES EVOLUTION

                                                                                                                2015
Operators can stay competitive by launching attractive                                         Live VoLTE and Wi-Fi calling using NFV
data and IP-based communication services bundles
Demand for communication services is still strong, despite                   All major chipset and device vendors now support natively
declining voice and messaging revenue. An Ericsson                           integrated Wi-Fi calling on many smartphone models. Some
ConsumerLab study2 in the US showed that SMS texting                         device and network vendors also support Wi-Fi calling on
and voice are still the main methods of communication                        devices without a SIM card, such as tablets, smartwatches and
for the majority of families.                                                personal computers. This means the users’ personal devices
                                                                             can be located at different Wi-Fi access points across the
Communication services based on VoLTE enable operators
                                                                             world, and the smartphone can be on cellular or Wi-Fi access.
to offer bundled data and high-quality communication
                                                                             The users can select to answer and make calls on any of the
services packages, with telecom-grade HD voice, video
                                                                             devices and transfer calls between their personal devices.
communication, multi-device capabilities and more, while
enabling simultaneous LTE data services on smartphones.                      Network evolution – 5G-ready core
Globally interoperable IP messaging and content sharing
during calls can be launched using GSMA standards based                      The IP Multimedia Subsystem (IMS) and Evolved Packet Core
Rich Communication Services (RCS). This can also be                          (EPC) enable these packet-switched communication services,
combined with VoLTE natively on smartphones.                                 which can be run over LTE, Wi-Fi and fixed broadband on any
                                                                             device, as the device ecosystem evolves. VoLTE and Wi-Fi
Taking HD voice to the next quality level                                    calling are the first consumer services that have been deployed
in LTE and Wi-Fi networks                                                    using Network Function Virtualization (NFV) in core networks.
                                                                             A 5G-ready core takes NFV one step further, by adding the
HD voice improves mobile voice quality. It requires device
                                                                             concepts distributed cloud and network slicing, which bring
support, and new functionality on 2G, 3G and LTE networks.
                                                                             new levels of flexibility and optimization with the promise of
An evolved HD voice service – 3GPP standardized Enhanced
                                                                             enabling business innovation at an unprecedented scale.
Voice Services (EVS) – for VoLTE-enabled networks further
improves the user experience by delivering even higher
quality voice and music within calls (e.g. call announcements
or sharing music from a concert during a voice/video call).                            130+
EVS also provides a better quality service than HD voice in                                                                    48 live RCS
                                                                                  commercial HD
challenging LTE radio conditions, as well as better service                                                                    networks in
                                                                                  voice networks
robustness when using Wi-Fi calling.                                                                                          35 countries5
                                                                                     (2G/3G)4
Wi-Fi calling is taking off quickly with more
commercial launches and new devices
With Wi-Fi calling, operators can extend their voice service
indoors so consumers can make calls in their homes over
their own Wi-Fi access points, using any Internet Service
Provider (ISP). This benefits users with limited circuit-switched                             20                                 55+
voice or VoLTE indoor coverage, as well as roaming users.                               commercial                           commercial
According to an Ericsson ConsumerLab study3, based on                                   native Wi-Fi                       VoLTE networks
the first market experience of Wi-Fi calling, four out of five                        calling networks                         in 30+
Wi-Fi calling users interviewed in the US were very satisfied                               in 10+                            countries
with the service.                                                                         countries

2
    Ericsson ConsumerLab, Bringing families closer (August 2015)             4
                                                                                 GSA (May 2016)
3
    Ericsson ConsumerLab, Wi-Fi calling finds its voice (July 2015)          5
                                                                                 GSMA (March 2016)

20 ERICSSON MOBILITY REPORT JUNE 2016
Microweather:
unlocking potential
Microwave backhaul links can be accurate, high resolution rainfall measurement tools
and used to create additional revenue streams for operators, as well as benefit society

Weather impacts almost everything we do. Severe weather                             Different methods for measuring rainfall already exist, all
can cause disasters, but smaller daily weather changes can                          with their own pros and cons. Historically, rain gauges
also have great impact on people and industries. The ability                        were one single data source, although weather radars
to react, plan accordingly and take preventative action is                          have also been used for this purpose for the past 50 years.
immensely valuable to businesses and society. In order to                           Microwave links can fill a gap where neither gauges
deliver high quality weather forecasts, it is vital to accurately                   nor radars are able to completely observe the rainfall
and meticulously monitor current weather conditions.                                and its variations – especially for short durations and
                                                                                    across small distances. The advantages and limitations
Microwave links can be used to make these observations.                             of each method are summarized in the figure below.
Used to wirelessly connect mobile radio base stations,
there are around 4 million microwave hops1 worldwide. This                          The main benefits of microwave links involve a higher
is by far a larger number than the amount of rain gauges                            resolution in time and space, better accuracy at ground
and covers a greater part of the world than weather radars.                         level and cost efficiency. Rain gauges are very precise, but
There is tremendous potential for increasing the number                             to cover large areas sufficiently would require an unrealistic
of observation points and improving the quality of weather                          amount of gauges. Conversely, weather radars can measure
services, including forecasting, now-casting, flood warnings                        vast spaces, but are not exact enough at scales below
and hydrological measurements. The most powerful impact is                          1 km2. The space resolution of a microwave link is higher,
expected in developing countries and regions where no other                         depending on the length of the link, typically 100-1,000 m.
measurements currently exist.                                                       Another drawback of radars is the fact that they measure
                                                                                    at high altitudes (≥500 m) and do therefore not provide
Higher resolution and accuracy at low cost                                          accurate figures at ground level. Regarding resolution in
                                                                                    time, microwave links can deliver measured values down
Microwave links are sensitive to rain and therefore a                               to every 10 seconds or even less, which is much more
certain reduction in signal strength across the link is                             frequent than radars and gauges. The extra cost to extract
expected. While this does not affect overall performance,                           rainfall information from a microwave network is small
it enables accurate calculations of the rainfall.                                   because the required infrastructure is already in place.

Comparison of different rainfall measurement methods

                                                 Rain gauge                            Weather radar                 Microwave link

     Time resolution                    Down to 15 min                        5–15 min                        10 s–1 min

     Space resolution                   ~2 dm2                                ~1 km2                          100–1,000 m

     Coverage area                      ~2 dm2                                ~200 km radius                  100–1,000 m

     Accuracy on ground level           Very good                             Limited, measures at            Good, measures at 10s of
                                                                              ≥500 m height                   meters above ground level

     Cost                               New installation                      New installation                Additional cost for collecting data
                                        CAPEX SEK 150,000                     CAPEX SEK 25 million            from an existing network of 1,000 links:
                                        OPEX SEK 90,000/year                  OPEX SEK 725,000/year           CAPEX SEK 135,000
                                                                                                              OPEX SEK 100,000/year

1
     ireless microwave connection between a transmitter and receiver. A microwave hop can have
    W
    a length from a few hundred meters up to tens of kilometers and a capacity up to several Gbps

                                                                                                                JUNE 2016 ERICSSON MOBILITY REPORT 21
Map of the HI3G microwave link network in the                                        Comparison between rain gauge, weather radar and
Gothenburg area and locations of the high resolution                                 microwave link in one specific point in time and place
rainfall gauges operated by SMHI and Gothenburg City

                                                                                                 The peaks are well captured by the
                                                                                                 microwave link; however, the radar failed
57°50’N
                                                                                                 to see any significant event

                                                                                                         Rain gauge
                                                                                                70
                                                                                                         Weather radar
57°40’N
                                                                                                         Microwave link
                                                                                                60

                                                                                                50

57°30’N                                                                                         40

                                                                                     P (mm/h)   30

                                                                                                20

57°20’N
                                                                                                10

              11°40’E    11°50’E     12°0’E     12°10’E    12°20’E    12°30’E
                                                                                                 0

Source: Hi3G Sweden and SMHI                                                         Source: SMHI

Live measurements during eight months                                                An example of a time series during a very local and
                                                                                     short-lasting rainfall is shown in the top right figure. As
In order to validate the accuracy and overall feasibility
                                                                                     can be seen, the microwave-link derived rainfall has a high
of the concept, a pilot study has been performed on a
                                                                                     correlation to the gauge measurement, whereas the radar
live microwave mobile backhaul network in Gothenburg,
                                                                                     almost completely misses the event. The reason for the
Sweden. Data has been collected from over 300 microwave
                                                                                     radar failure is mainly the short duration of the rainfall, but
links every 10 seconds for 8 months. This is believed to be
                                                                                     also the fact that the radar performs a spatial average over
the largest evaluated commercial microwave network with
                                                                                     a 2 km² area. The overall outcome of the study is that the
such a high time resolution.
                                                                                     microwave links show a higher correlation to the gauges
Even though the total number of measurements is over                                 than the radar.
1.5 billion, the corresponding amount of data is only 6.3 GB
in a zipped format. Each data sample, which contains the
transmitted and received power levels, is very small and
the extra load on the network is insignificant. As such, no                                     Microweather project
negative impact has been observed in the live network over                                      A joint pilot project run in 2015 by Ericsson, Hi3G
this time period.                                                                               Sweden and Swedish Meteorological and Hydrological
                                                                                                Institute (SMHI). The Hi3G commercial mobile backhaul
Existing algorithms2 have been evaluated and improved                                           microwave network in Gothenburg was monitored
to translate the link radio signal path loss to rain intensity.                                 and evaluated for the usage of microwave links as
The obtained rain intensity has then been compared with                                         rainfall measurement tools.
gauge and radar measurements.

2
     esser H., Zinevich A., Alpert P., “Environmental monitoring by wireless communication networks”,
    M
    Science, 312 (5774), pp 713-713, May 5, 2006 http://science.sciencemag.org/content/312/5774/713

22 ERICSSON MOBILITY REPORT JUNE 2016
Another promising result is seen in the figure below, which    sector. It is difficult to predict rainfall in this hilly country,
shows rainfall intensity maps. The microwave links provide     which impacts the cultivation of its most important crop:
much better resolution than the radar, due to the high link    teff. The seeds need rainfall within 1–2 days of being planted
density and more frequent sampling in time.                    or the crop will be damaged. This can have devastating
                                                               consequences for a country where bread made of teff is
Microwave links add value to existing methods                  eaten with every meal.

The pilot study in Gothenburg has demonstrated an              The example shows that with better forecasts for rainfall,
added value of measuring rainfall by microwave links           agricultural efficiency can be improved significantly. However,
when compared with existing observation techniques.            in order to provide better forecasts, improved observations
Further development is still required for a full commercial    are needed. Utilizing existing microwave links for this purpose
deployment, but the concept is a promising source              is a sustainable solution with great hidden potential.
of additional revenue streams for operators already
deploying microwave networks. Microwave links can be
used as a single source of observations, but an even
larger meteorological value is obtained when their input is
combined with existing sensors such as gauges and radars.

The concept holds great potential to bring added value             Microwave links provide much better
to society, particularly in developing parts of the world.
                                                                   resolution than weather radar
For instance, in Ethiopia, agriculture represents 50 percent
of the GDP and 80 percent of the population works in the

Rainfall intensity maps constructed from weather
radar data and microwave link data
Weather radar data                                             Microwave link data
                                               100                                                               100

                                                30                                                                30

                                                10                                                                10

                                                 3                                                                 3

                                                 1                                                                 1

                                                0.3                                                               0.3

                                                0.1                                                               0.1

Source: SMHI

                                                                                            JUNE 2016 ERICSSON MOBILITY REPORT 23
Growing up
streaming
Given the massive explosion of video content available on the internet, there
is a corresponding sharp increase in streamed video viewing, particularly
among younger generations. Today’s teens are streaming natives, as they
have no experience of a world without online video streaming

TV/video viewership is changing for everyone                                       change. For example, 30–35 year-olds spent 4 hours
                                                                                   more than teens in front of the traditional TV in 2011
Viewing is gradually switching from traditional TV to
                                                                                   and still did so in 2015.
streaming video on smartphones. Although most streaming
is over Wi-Fi, high growth rates can be seen for teen                              Video streaming situations spread
data usage over cellular networks, as they stream video                            out across time and place
throughout the day – indicating a major shift in behavior.
                                                                                   When TV/video viewing migrates from fixed to mobile
When looking at total time spent watching TV and video                             screens, viewing situations spread out across the day.
content at home, teens spend roughly as much time                                  Teenagers have higher viewership and more video sessions
watching as others. In fact, when compared with internet                           for all parts of the day. This behavior has also been verified
users between 20-59 years old with smartphones, teens                              by analysis of smartphone on-device measurements.
aged 16-19 reported similar overall viewing times at home
to others both in 2011 and 2015.                                                   Wi-Fi data use still grows faster than cellular data
                                                                                   With a lot of mobile device viewing time spent indoors, it
However screen preference is gradually changing from the
                                                                                   should come as no surprise that over 85 percent of data
traditional TV set to smartphones. This is a change that
                                                                                   traffic generated by the use of smartphone video apps goes
can be observed across age groups, although it is most
                                                                                   over Wi-Fi. However, given that video viewing is taking place
clearly seen in teen behavior. Between 2011 and 2015, teens
                                                                                   across the whole day, there are situations where Wi-Fi is
increased their TV/video viewing at home on smartphones
                                                                                   unavailable or insufficient, leading to an increase in video
by 85 percent and nearly halved their time spent watching
                                                                                   viewing over cellular networks.
on a traditional TV screen. Older generations are slower to

Total weekly hours of TV/video viewing at home
     Teens       Others

15
                                                                                        Teens have increased smartphone
                                                                                        TV/video viewing 85% in 4 years

10

 5

 0
        2011      2015            2011      2015            2011      2015            2011     2015            2011      2015

                 TV                      Desktop                   Laptop                Smartphone                   Tablet

Source: Ericsson ConsumerLab, TV and Media (2011, 2015)
Base: 9,000 respondents in Brazil, China, Germany, South Korea, Spain, Sweden, Taiwan, UK and US. Users of the respective devices for viewing at home, aged 16–59

24 ERICSSON MOBILITY REPORT JUNE 2016
Watching videos or TV online (percent of respondents)                                                                   Average monthly cellular/Wi-Fi video data use (MB)
      Teens               Others                                                                                           Cellular           WiFi

                                                                                                                                                                  3,090
                                                                                                                                                                                 Growth
60
50                                                                                                                                                                                     80%
40                                                                                                                                                                                     Cellular
30                                                                                                                                    1,170
20                                                                                                                                                      480                            164%
10                                                                                                                        270                                                          W-iFi
 0
                                                                                                                             July 2014                   October 2015
                                                afternoon

                                                             afternoon
      wake up

                                                     Early

                                                                   Late
       when I

                morning

                           morning

                                      lunch

                                                                                    dinner

                                                                                                Late

                                                                                                         In bed
                                                                            Early
                                                                          evening

                                                                                    During
       In bed

                  Early

                              Late

                                     During

                                                                                             evening

                                                                                                        before
                                                                                                        I sleep
                                                                                                                        Source: Ericsson ConsumerLab, on-device measurements (July 2014,
                                                                                                                        October 2015)
                                                                                                                        Base: Smartphone video app users, South Korea: Android users 16–65
Source: Ericsson ConsumerLab, Japan, South Korea and the US (2015)
                                                                                                                        years, Japan and US: Android and iOS users, 18–65 years
Base: Internet users, 16–65 years

Although cellular data usage on smartphones is growing,                                                                 Teens are the most important group to watch
Wi-Fi data growth is dramatically outpacing it. As shown in
                                                                                                                        The figure below shows that although teens reported the
the top right figure, our analysis of smartphone on-device
                                                                                                                        lowest cellular data consumption for video streaming apps
measurements in the US, Japan and South Korea indicates
                                                                                                                        among all age groups in both July 2014 and October 2015,
an 80 percent growth in cellular data usage between July
                                                                                                                        the higher reliance on smartphones for video viewing at any
2014 and October 2015 for smartphone video streaming apps;
                                                                                                                        time of the day means that teen video data consumption
corresponding Wi-Fi data growth is more than double this.
                                                                                                                        over cellular networks is growing rapidly.

Cellular data growth increasingly driven by teens                                                                       Only 30–35 year olds have a higher growth rate than teens
                                                                                                                        for cellular video streaming data usage. However, the overall
Interestingly, although teens use more Wi-Fi, they are also
                                                                                                                        video data consumption among this group is only around a
more interested in paying for connectivity. 63 percent of
                                                                                                                        fifth of the teens’ data consumption and their potential for
teenagers surveyed in the US, Japan and South Korea say
                                                                                                                        further growth is limited due to the fact that this generation
they would like to pay for improved mobile data speed and
                                                                                                                        is still rooted in traditional TV viewing behavior.
coverage, which is higher than other age groups. Given the
highly mobilized video viewing behavior spread throughout                                                               Overall, teens are the heaviest users of data for smartphone
the day among teens, it makes sense that this should also                                                               video streaming apps and have the second highest rate
result in an increased demand for cellular data connectivity.                                                           of cellular video data consumption growth. Since we are
Analysis of smartphone on-device data in the US, Japan and                                                              witnessing a generational change, current teens are likely
South Korea shows that this is now starting to happen.                                                                  to increase their appetite for cellular data as they grow
                                                                                                                        older, making them the most important group to watch
                                                                                                                        for cellular operators.
Cellular video data use – teens vs. others
Managing user
experience
High load in less than a tenth of the cells in a metropolitan area can affect
more than half of the user activity over the course of 24 hours. This is not
necessarily bad news – with an efficient way to identify highly loaded cells,
focused improvements can be made to enhance overall user experience

Before the smartphone revolution, most of the attention in                                         performance statistics. This is leading to more efficient ways
mobile network operations was focused on managing voice                                            of pinpointing bottlenecks in mobile broadband networks.
coverage. Voice now constitutes less than five percent of                                          To illustrate this, we focus on time-to-content, defined as
mobile traffic. Users still expect good voice coverage, but                                        the time from when a user requests online content until it
they also expect good user experience when they access                                             is rendered on the display. Time-to-content is increasingly
the internet through apps running on their smart devices.                                          used as a proxy for user experience.
Providing good app coverage has become an important
differentiator for mobile operators, and it has a significant                                      As individual users in a cell access the internet through apps
impact on subscriber loyalty and an operator’s Net Promoter                                        on their smart devices, the radio base station determines
Score (NPS). The ability to directly connect user experience                                       when they are served. The higher the cell load, the longer
to network performance statistics is a major step on the way                                       users must wait for the radio resources they need to send
to monitoring and managing app coverage.                                                           and receive data. Time-to-content becomes increasingly
                                                                                                   variable and, beyond a certain level of cell load, user
Good app coverage depends on sufficient uplink and downlink                                        experience deteriorates sharply. This level is typically
throughput and low latency, which in turn depend on many                                           reached well before the cell capacity is fully utilized. These
factors including cell load and radio channel quality. With                                        effects reflect fundamental principles of queueing theory
so many variables involved, how can networks be managed                                            that apply to situations where a common resource is shared
effectively to deliver the desired level of user experience?                                       among multiple users. It turns out that time-to-content is
                                                                                                   strongly correlated with cell load. Cell load can therefore
Data analytics are increasingly being applied to find                                              be used to estimate time-to-content.1
relationships between user experience and network

         Using a time-to-content target to determine an optimal cell load ceiling

                                   35

                                   30
                                                 At a six second time-to-content                                 The higher the cell load, the
                                                                                                                 more variable time-to-content
       Time-to-content (seconds)

                                   25            target, the optimal cell load
                                                 ceiling is 80% for this cell                                    becomes. Beyond a certain
                                   20                                                                            level of cell load, user experience
                                   15                                                                            deteriorates sharply
                                   10

                                    5
                                                                                                                    95th percentile2

                                    0                                                                               5th percentile
                                        0   10      20   30   40      50     60     70   80   90     100
                                                              Cell load (percent)

1
     n LTE radio base station allocates radio resources once per millisecond and cell load can vary greatly
    A
    at this resolution. Cell load figures shown in this analysis have been averaged across 15 minute periods
2
    The 95th percentile line indicates the maximum time-to-content for 95% of measurements

26 ERICSSON MOBILITY REPORT JUNE 2016
You can also read