2018 OCTOBER 2018 Prepared for the Metro Vancouver Community Entity, Homelessness Partnering Strategy
←
→
Page content transcription
If your browser does not render page correctly, please read the page content below
2018

         OCTOBER 2018

         Prepared for the
Metro Vancouver Community Entity,
 Homelessness Partnering Strategy

By BC Non-Profit Housing Association

                                       Page 1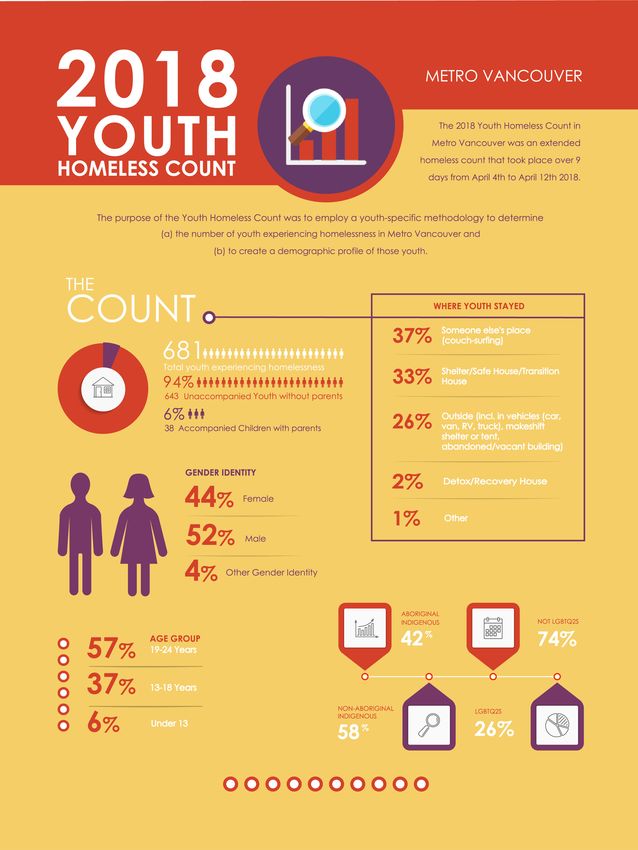
FOREWORD
         BY METRO VANCOUVER COMMUNITY ENTITY
The Metro Vancouver Community Entity thanks all who contributed to the 2018 Youth Homeless Count, especially
the youth who participated in the survey and the youth with lived experience of homelessness who participated
in the planning and design of the project and survey questions. Thank you also to the members of the Project
Team who gave their time, experience and expertise to the design and implementation of the project, and to
all the staff of the youth-serving organizations and schools across the region that participated – all together your
contributions have produced an unprecedented quality and quantity of reliable data.

Thank you to the BCNPHA consultants for the excellent community development and research skills brought to
this research project that involved a large and complex regional scope, which aimed to reach a largely hidden
population while applying new methodologies – well done!

Page 2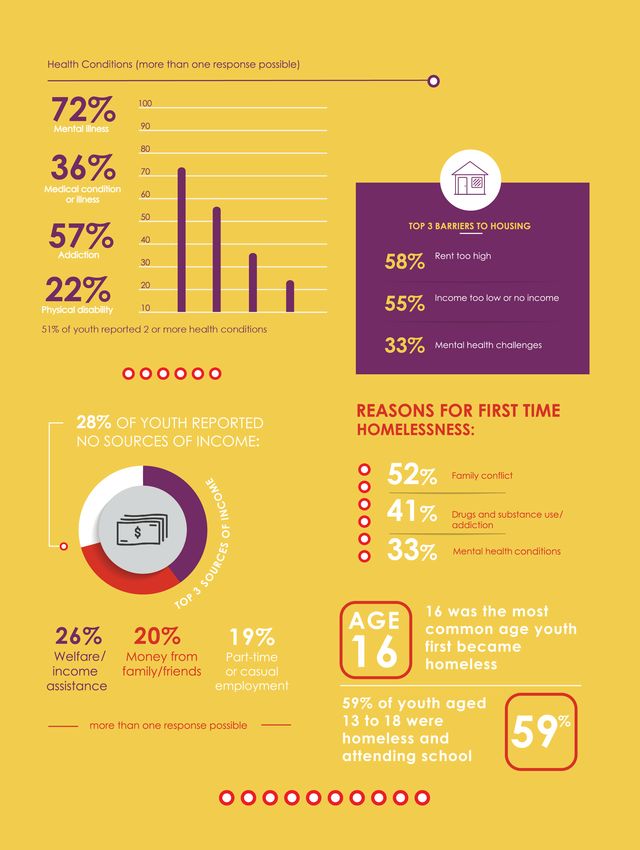
2018 Youth Homeless Count Project Team

Alison Stewart			             Fraser Valley Regional District
Annie Smith			                McCreary Society
Averill Hanson			             Community Poverty Reduction Initiative
Chelsea Grier 			             Fraser Region Aboriginal Friendship Centre Association
Crystal Williamson		          Service Canada, Homelessness Partnering Strategy
David Baspaly 			             Infocus Consulting
David Wells			                Aboriginal Homelessness Steering Committee
Dena Kae Beno			              City of Abbotsford
Heather Lynch			              Options Community Services
Jennifer Hales			             City of Vancouver
Jonquil Hallgate			           Council of Community Homeless Tables
Linda Lavallee			             Aboriginal Homelessness Partnering Strategy, Community Entity
Lorraine Copas			             Social Planning and Research Council of British Columbia
Louise Sallai			              Fraser Region Aboriginal Friendship Centre Association
Niki Cooke			                 School District 43
Zach Batalden			              Pacific Community Resources Society

Metro Vancouver Community Entity

Theresa Harding		             Manager
Jessica Hayes		               Regional Planner

BC Non-Profit Housing Association
Peer-Daniel Krause            Project Manager
Erika Sagert                  Coordinator Manager
Brian Clifford                Data Manager

Count Coordinators

Evan Hammer                   Burnaby/New Westminster
Julie Hemily                  Vancouver
Liam Schober                  Langley/Ridge Meadows
Paul Butler                   North Shore
Polly Krier                   Tri-Cities
Tracy Lau                     Delta/Richmond
Veronica Reiss                Surrey/White Rock

Report Design By

Elana Siu

Photograph By

Tallulah Photography

Partners

                       This project was funded by the Metro Vancouver Community Entity,       Page 3
                            Homelessness Partnering Strategy, Government of Canada.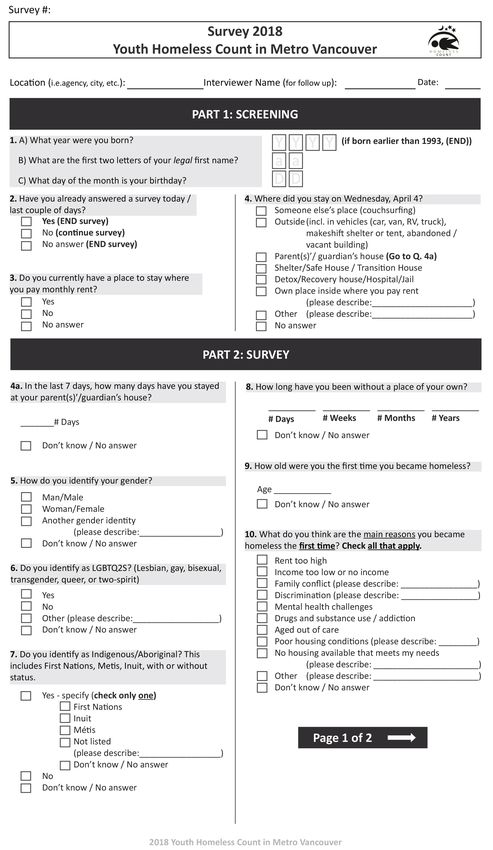
EXECUTIVE SUMMARY
The methodology for the 2018 Youth Homeless Count differed from a traditional Point-in-Time (PiT) homeless
count approach by carrying out data collection over the course of nine days, rather than 24 hours. This new
method was designed to provide more opportunities to make contact with youth experiencing homelessness
across the region. The focus of data analysis for the 2018 count was to explore the different circumstances of
youth experiencing homelessness who identified as Aboriginal/Indigenous and those who did not, specifically to
assist with funding allocation and service provision in the region.

There were two primary methods for data collection used in the 2018 Youth Homeless Count: (1) a paper-based
survey and (2) an Excel-based service use spreadsheet. The survey instrument was intended to capture both the
number of youth experiencing homelessness in the region and to provide a demographic profile of those youth.
The service use spreadsheet was designed to supplement the enumeration process by recording youth who met
the definition of youth homelessness, but who may not have wanted to answer a full survey.

When combined, these two methods of data collection produced the total number of youth experiencing
homelessness that were engaged with during the count period. In addition to the total number of youth engaged,
the survey then provided further details regarding the experiences of a percentage of those youth. As such,
readers will notice two different totals in the data presented below and throughout this report. Basic information
was obtained from a total of 681 youth by combining the survey and service use spreadsheet data. Within that
group, 356 youth provided further details about themselves through their answers to the survey. Data presented
in this report (unless otherwise specified; see Section 1) came solely from the 356 youth who answered the survey
(see Section 2). The figures presented below represent a percentage of the total number of youth who responded
to the associated survey question, not necessarily the overall number of youth who answered the survey, since
some youth chose not to answer every question.

To explore the number of youth represented by the percentages below, please see the associated data tables
in Sections 1 and 2 of this report. For more information on how to read the data collected through the 2018 Youth
Homeless Count, see page 18.

Total Number of Youth and Children Experiencing            as female, and 4% identified as another gender.
Homelessness                                               An additional 121 youth did not provide an
As was determined by the survey and the service            answer to the gender question in the survey or in the
use spreadsheet, a total of 681 youth and children         service use spreadsheet.
were found to be experiencing homelessness across
Metro Vancouver between the 4th and 12th of April          Indigenous Youth
2018. Of those, 643 youth aged 13 to 24 were found         Of the youth who answered the survey question on
living independently of their parent(s) or guardian(s)     Indigenous identity, 42% self-identified as Indigenous.
and a further 38 children (under age 25) were found        Of those Indigenous youth, 65% further identified as
with their parent(s) or guardian(s) while experiencing     First Nations, 22% identified a s M étis, a nd o ne youth
homelessness.                                              identified a s I nuit. Another 1 2% r eported t hey were
                                                           Indigenous but did not further identify as First Nation,
Sheltered and Unsheltered Youth                            Métis, or Inuit.
On the night of April 4th, 35% of the 681 youth who
responded to the survey or who were recorded               Sexual Identity
through the service use spreadsheet were sheltered,        Through the survey question on sexual identity,
indicating they were either staying in a shelter,          26% of youth identified t hemselves a s l esbian, gay,
safe or transition house, or in a detox facility/          transgender, queer or two-spirit (LGBTQ2S). A higher
recovery house. The other 64% indicated that they          proportion of LGBTQ2S-identifying youth identified as
were unsheltered on the night of April 4th, having         female (48%), compared to the number of youth who
stayed either outside in a vehicle, in a make shift        identified as male (40%) or as another gender (22%).
shelter or tent, in an abandoned/vacant building, or
were staying temporarily indoors (couch-surfing).          Age When Homeless for the First Time
                                                           Just under two-thirds of survey respondents (64%)
Gender Identity                                            were between the ages of 13 and 18 when they
Of the 681 youth who answered the question on              experienced homelessness for the first t ime; another
gender, 52% identified as male, 44% identified             7% reported being under 13 when they became
Page 4
homeless for the first time.                              (20%) of youth reported that they received money
                                                          from family/friends as a source of income. And at
More than one quarter (26%) of youth reported             slightly more than one quarter, 27%, indicated that
experiencing homelessness either at age 15 or 16 for      they held either a part-time or full-time job while
the first time, representing the two ages youth most      experiencing homelessness from April 4th to 12th
commonly reported as the first time they became           2018.
homeless. Indigenous youth reported first becoming
homeless at a younger age than non-Indigenous             School Attendance
youth, with 75% of Indigenous youth becoming              More than one quarter of survey respondents (27%)
homeless for the first time under age 19, compared        indicated they were currently attending school,
to 67% of non-Indigenous youth.                           training or another educational program at the time
                                                          of the count. Another 5% indicated that while they
Family conflict was the most frequently reported          were enrolled in some type of educational program,
reason for youth becoming homeless for the first          they were not currently attending. The majority of
time, with 52% indicating as such. Drugs and              youth attending school were aged 13 to 18 (86%).
substance use/addiction was the second most               A higher proportion of Indigenous youth (30%) were
common reason at 40%. A further 33% of youth              attending school, training or another educational
survey respondents reported      mental   health          program, compared to their non-Indigenous peers
challenges as one main reason for becoming                (23%).
homeless for the first time.

Main Barriers to Accessing Housing                        Foster Care, Group Homes, Independent Living
More than half of youth who responded to the              Half of respondents (50%) indicated they were
question on what was keeping them from finding            currently or had been previously in foster care, a group
a place of their own reported that rent was too           home or under an independent living arrangement,
high (58%), and/or that their income was too low or       and 11% of survey respondents indicated that
they had no income (55%).                                 aging out of care was one of the main reasons they
                                                          experienced homelessness for the first time.
Health, Mental Health and Addiction
51% of youth survey respondents reported having           Please note: the 2018 Youth Count was the first of its
two or more health conditions while 17% indicated         kind, and therefore no directly comparable homeless
they had no health conditions. A high number, 72%,        count data exists for the information presented in this
reported having a mental illness. Similarly, reports of   report. As the project included a new methodology
addiction were also high with 53%                         for enumerating youth homelessness, it cannot be
reporting they were managing some form of                 directly compared to past homeless count initiatives
addiction.                                                in the region. Instead, the data included should be
                                                          treated as the baseline for youth homelessness in
Sources of Income                                         Metro Vancouver. The narrative that accompanies
“No income” was the most commonly selected                the data tables in the executive summary, and
answer on the question of income sources, with 28%        Sections 1 and 2, is purely descriptive in nature and
of survey respondents selecting that answer. Welfare/     does not presume to infer conclusions that are
income assistance was the second most common              beyond of the scope of the data that was collected.
answer from survey respondents at 26%. One-fifth

                                                                                                          Page 5
Page 6
Page 7
TABLE OF CONTENTS

List of Tables                                                           9
Glossary of Terms and Definitions                                        10
Introduction                                                             12
Definition of Youth Homelessness                                         17
How to Read This Report                                                  18
1.       Overview of Youth Experiencing Homelessness                     20
1.1.     Total Number of Youth and Children Experiencing Homelessness    20
1.2.     Where Youth Stayed on April 4th 2018                            20
1.3.     Age of Survey Respondents and Servive Use Spreadsheet Clients   21
1.4.     Gender                                                          22
1.5.     Youth Homelessness by Metro Vancouver Sub-Region                22
2.       Profile of Youth Experiencing Homelessness                      24
2.1.     Age of Survey Respondents Only                                  24
2.2.     Gender Identity of Survey Respondents Only                      25
2.3.     Indigenous Identity                                             25
2.4.     Sexual Identity                                                 26
2.5.     First Time Experiencing Homelessness                            27
2.6      Length of Time Homeless                                         28
2.7.     Health Conditions – Incidence and Types                         29
2.8.     School Enrollment                                               30
2.9.     Barriers to Housing                                             32
2.10.    Sources of Income                                               33
2.11.    Newcomers to Canada                                             34
2.12.    First Language                                                  34
2.13.    Length of Time Lived in Sub-Region of Metro Vancouver           35
2.14.    Foster Care, Group Home or Independent Living Arrangement       36
2.15.    Time Lived in Canada                                            36
2.16.    Where Youth Had Previously Lived                                37
Methodology                                                              38
Limitations                                                              42
Appendices                                                               46
How to Cite This Report                                                  53
About the Author                                                         53

Page 8
LIST OF TABLES

Table 1. Overview of the Data Collection Methods Used in the 2018 Youth Homeless Count		   15
Table 2. Total Number of Unaccompanied Youth and Accompanied Children                      20
Table 3. Total Sheltered and Unsheltered Unaccompanied Youth and Accompanied Children      21
Table 4. Unaccompanied Youth and Accompanied Children by Age Group                         22
Table 5. Unaccompanied Youth and Accompanied Children by Gender Identity                   22
Table 6. Unaccompanied Youth and Accompanied Children by Municipal Sub-Region              23
Table 7. Age Distribution of Youth Who Participated in the Survey                          24
Table 8. Gender Identity of Youth Who Participated in the Survey		                         25
Table 9. Indigenous Identity                                                               25
Table 10. Indigenous – First Nation, Metis, Inuit                                          26
Table 11. Sexual Identity                                                                  26
Table 12. Age When Youth First Experienced Homelessness                                    27
Table 13. Reason for First Time Homeless                                                   28
Table 14. Length of Time Homeless                                                          29
Table 15. Incidence of Health Conditions                                                   29
Table 16. Types of Health Conditions                                                       30
Table 17. Educational Attendance and Enrollment by Indigenous Indentity                    31
Table 18. Educational Attendance and Enrollment by Age Group                               31
Table 19. Barriers to Housing                                                              32
Table 20. Sources of Income                                                                33
Table 21. Newcomers to Canada and Refugee Claimants                                        34
Table 22. First Language                                                                   35
Table 23. Length of Time Lived in Sub-region of Metro Vancouver                            35
Table 24. Foster Care, Group Home, or Independent Living Arrangement                       36
Table 25. Time Lived in Canada                                                             36
Table 26. Previous Location                                                                37
Table 27. Overview of the Service Use Spreadsheet and Survey Instrument                    39
Table 28. Structure and Intent of the Service Use Data Form and the Survey                 40
Table 29. 2018 Youth Homeless Count Age Calculator                                         41
Table 30. Overview of the Data Screening Process                                           42
Table 31. Primary Limitations                                                              43

                                                                                                Page 9
GLOSSARY
OF TERMS AND DEFINITIONS
TERM DEFINITION
Aboriginal / Refers to persons who identified with the Indigenous peoples of Canada. This includes
Indigenous those who are First Nations (North American Indian), Métis or Inuk (Inuit) and/or those who
are Registered (under the Indian Act of Canada), or Treaty Indians and/or those who
have membership in a First Nation or Indian band. Aboriginal peoples of Canada are
defined in the Constitution Act, 1982, Section 35 (2) as including the Indian, Inuit and Métis
peoples of Canada.1
The total number of Indigenous People is a count of those who participated in the survey
and self-identified as Indigenous/Aboriginal.
Throughout this report “Indigenous” and “Indigenous Peoples” is used in keeping with the
federal government terminology.
Accompanied For the purposes of the count, the term “accompanied children” refers to those under the
Children age of 19 who were found experiencing homelessness with their parent(s) or guardian(s)
during the count. No survey record of these youth exists, as they were not interviewed.
Don’t Know/No Many tables contain a line for “Don’t Know/No Answer.” The number in this line
Answer summarizes the number of individuals for whom we did not obtain an answer to the
question, either because they did not know what response to give or did not provide a
response to the survey question.
Hidden According to the Canadian Observatory on Homelessness, “hidden homelessness” refers
Homelessness to the circumstance of “people who stay with friends, family, or even strangers. They are
typically not paying rent, their duration of stay is unsustainable in the long term, and they
do not have the means to secure their own permanent housing in the future.”2
Individual Refers to persons included in the count’s total number, including those who participated
in the survey and those whose information was provided through a service use data form.
(see Respondent)
LGBTQ2S Refers to youth who self-identify as lesbian, gay, bisexual, transgender, queer, two-spirit or
questioning.
1
Statistics Canada. No date. “Aboriginal identity of person.” Definitions, data sources and methods, variables. Last updated August 15
2018. http://www23.statcan.gc.ca/imdb/p3Var.pl?Function=DECI&Id=246617 (accessed September 20, 2018).
2
Gaetz, S., Barr, C., Friesen, A., Harris, B., Hill, C., Kovacs-Burns, K., Pauly, B., Pearce, B., Turner, A., Marsolais, A. (2012). Canadian Definition of
Homelessness. Toronto: Canadian Observatory on Homelessness Press. For more information on hidden homelessness and other forms of
homelessness, see: http://homelesshub.ca/sites/default/files/COHhomelessdefinition.pdf
Page 10TERM DEFINITION
No Fixed Refers to a youth that does not have a permanent place to live and was staying in a
Address (NFA) facility at the time of the count (e.g. a detox centre) with no registered address to return
to upon discharge.
Refugee Refers to a youth who has fled their country and is seeking refugee status in Canada.
Claimant A refugee remains a claimant until their case has been ruled on by the Government of
Canada. The survey did not distinguish between refugee claimants who were homeless
and Government Assisted Refugees who became homeless after government
resources expired.
Respondent Refers to a person who participated in the survey and answered questions in the survey.
(see Individual)
Unaccompanied Refers to young people aged 13 to 24 who were not accompanied by a parent(s) or
Youth guardian(s) during the Count and were found to be experiencing homelessness as per
the 2018 Youth Count definition of youth homelessness.
Page 11INTRODUCTION
The 2018 Youth Homeless Count in Metro Vancouver Given BC Non-Profit Housing Association (BCNPHA)
took place over nine days from April 4th to April 12th led the implementation of the 2017 Homeless Count
2018. The purpose of the Youth Count was to employ on behalf of the Metro Vancouver Community
a youth-specific methodology to determine: Entity, and in order to build on the knowledge and
partnerships created through that count, BCNPHA
(a) the number of youth experiencing homelessness in was re-engaged to conduct the 2018 Youth Homeless
Metro Vancouver; and Count. Design, methodology and implementation
lessons learned from the triennial all-ages count, as
(b) to create a demographic profile of those youth. well as strategies utilized by youth-focused counts
conducted elsewhere, were used to create a unique
Since 2002, the Government of Canada has funded youth-specific methodology, including a tailored
triennial homeless counts in the Metro Vancouver survey. For more information on the methodology, see
region. In 2016, a biannual national Point–in-Time page 38.
(PiT) homeless count initiative was announced by
the federal government. With the introduction of Through discussions with local stakeholders, it became
this new nation-wide homeless count, 2018 was the apparent that the number of youth counted through
first year that the regional count in Metro Vancouver past homeless counts was particularly low relative
was conducted in alignment with other communities to the number of youth that were actually being
across Canada. Since the 2017 triennial count had served in the region. Accordingly, the main challenge
already commenced prior to the announcement of in designing the new youth count was to identify
the nation-wide count, the Council of Community an approach that would help to overcome the
Homelessness Tables (CHTs) of Metro Vancouver undercount inherent in the 24-hour Point-in-Time (PiT)
and Fraser Valley advocated for adequate recovery methodology and specifically address the hidden
time between the 2017 and 2020 triennial region- conditions of youth experiencing homelessness.
wide counts. Specifically, the council recommended Traditional PiT homeless counts, including Metro
conducting a smaller-scale count, focused on one Vancouver’s triennial counts, occur over a 24-hour
particular subpopulation, to take place in lieu of period, with volunteers surveying as many people
another full-scale regional count just one year after experiencing homelessness as can be found within
the 2017 count. a predetermined service area. Youth experiencing
homelessness are often found couch-surfing, not
The council carefully considered which populations necessarily sleeping on the streets or in shelters, and
would be more effectively captured through a tailored “those who are provisionally accommodated or
methodology and recommended the 2018 count disconnected from homeless-serving agencies”3 are
pilot a youth-focused methodology, which would use generally less likely to be surveyed/counted through
minimal volunteer engagement and target youth- a typical PiT count methodology. As such, it was
serving agencies. In response, the Metro Vancouver reasonable to assume that even a tailored 24-hour PiT
Homelessness Partnering Strategy Community Advisory count would still deliver only the minimum number of
Board directed the Metro Vancouver Community youth experiencing homelessness in the region and
Entity to conduct a regional youth homeless count would struggle to reach youth most disconnected
as its participation in the national count initiative. from services.
Although the data from the 2018 Youth Homeless
Count would not be expected to merge with the In response to this concern, an extended count
longitudinal triennial count data for Metro Vancouver, period was adopted for the 2018 Youth Homeless
its design and implementation aimed to give a better Count. For the first time, in recognition of the difficulties
understanding of the causes and conditions of youth inherent in achieving widespread uptake by youth
homelessness and to offer a more accurate number completing surveys, organizations that serve youth
of youth who were without a home. were invited to participate in the count by surveying
3
For more information on the Point-in-Time Count methodology see the Canadian Observatory of Homelessness’ Point-in-Time Count Tool-
kit: http://www.homelesshub.ca/sites/default/files/Point-in-Time_Count_Toolkit.pdf
Page 12Please note: As the 2018 Youth Count was the first Given their overrepresentation amongst their peers, a
of its kind, no comparative homeless count data brief context of each population is warranted. It should
exists for the information presented in this report. be noted that these groups of youth often overlap,
As the project included a new methodology creating complex experiences of marginalization
for enumerating youth homelessness, it cannot and discrimination. For example, studies have
be directly compared to past homeless count shown that Indigenous youth continue to make up a
initiatives in the region. Instead, the data included disproportionate number of children in government
in this report should be treated as the baseline for care4 and that LGBTQ2S youth are also more likely to
youth homelessness in Metro Vancouver. be involved with child protection services than their
straight peers.5
The narrative that accompanies the data tables
in Sections 1 and 2 is purely descriptive in nature
and does not presume to infer conclusions that Indigenous Youth
are beyond of the scope of the data that was
collected. Indigenous Peoples of all ages continue to make up
a disproportionate number of people experiencing
homelessness across Canada. According to the
“
Homeless Hub:
Homelessness amongst Indigenous Peoples
can be traced back to historical trauma,
oppression, racism and discrimination.
Homelessness amongst Indigenous Peoples
should be considered as a consequence
resulting from Canada’s history of
youth accessing their services, and by recording the colonization and exploitation of Indigenous
number of youth that accessed their facility during land and populations. Significant abuse and
each of the nine days of the count period. Therefore, cultural trauma occurred through the use of
in addition to counting youth through the number residential schools to house and educate
of surveys being collected, youth were also tracked Indigenous children… Many of the personal
through a separate but related client intake system. issues (including familial dysfunction,
Together, these two methods were anticipated to substance use, addictions, health issues,
generate data that would give new and deeper community violence) faced by Indigenous
insights into youth homelessness in Metro Vancouver Peoples and that act as contributors to
and, importantly, produce a more accurate number homelessness can be directly linked to
of youth experiencing homelessness than had been various types of historical trauma. Structural
found through traditional PiT count methods. issues can include transitions from reserves to
urban living, racism, landlord discrimination,
low levels of education and unemployment.6
Context of Youth Homelessness in Metro
Vancouver
The Aboriginal population of Metro Vancouver is
The 2018 Youth Homeless Count provided an also considerably younger than the population at
opportunity to explore particular populations of large. In 2016, the national census showed that 28%
youth that tend to be found in disproportionate of those in the Metro Vancouver Census Metropolitan
numbers in the overall youth homeless population in Area (Metro Vancouver) were under the age of 25,
Metro Vancouver. This includes but is not limited to compared to 38% of those in the same region who
Indigenous youth, youth in care, and LGBTQ2S youth. were of Indigenous ancestry.7
4
For more information on Indigenous overrepresentation in government care, see the Aboriginal Children in Care: Report to Canada’s Pre-
miers, July 2015: https://fncaringsociety.com/sites/default/files/Aboriginal%20Children%20in%20Care%20Report%20%28July%202015%29.pdf
5
Stephen Gaetz, Bill O’Grady, Sean Kidd & Kaitlin Schwan. (2016). Without a Home: The National Youth Homelessness Survey. Toronto: Ca-
nadian Observatory on Homelessness Press. http://homelesshub.ca/sites/default/files/WithoutAHome-final.pdf
6
For more information see, visit the Homeless Hub: http://homelesshub.ca/about-homelessness/population-specific/indigenous-peoples
7
Data from Statistics Canada, Census of Canada 2015.
Page 13Youth in Care but where 57% of straight youth reported experiencing
The link between youth in government care and some manner of physical, sexual, or
homelessness is also well founded. In a 2016 study, it other form abuse in their past, the rate was higher at 76%
was determined that “homeless youth are 193 times for their LGBTQ2S peers. Similar statistics are available
more likely to have been involved with the child for Indigenous youth and youth in government care.
welfare system than the general public.”8 Specifically,
the Without a Home (2016) study found that 58% of
the 1,103 youth with lived experience of homelessness Challenges with Enumerating Youth
involved in their study “had some kind of involvement Homelessness
with child protection services in the past.”9 The reasons
why youth come into government care and how Homeless counts attempt to navigate this complexity
they then transition to homelessness are complex. and enumerate as many individuals as possible, over the
The link between the two is attributed to a variety of course of one day, often in a vast geographic space.
factors, including housing instability that has shown to Homeless counts are most successful at capturing
produce poor outcomes for youth, the transition out those who are sleeping rough, staying in shelters, or
of care where youth aged 19 are no longer eligible for frequently accessing homelessness services. This often
government care but have nowhere else to go, and means that older men are most likely to be counted,
early experiences of homelessness either as individuals as they are the population typically found in those
or with parents/guardians.10 spaces. While many youth experiencing homelessness
may sleep outdoors and access homelessness
services, anecdotally we know that many youth also
LGBTQ2S Youth find temporary shelter with family or friends (referred
to as couch-surfing) and that there are a limited
While there have been fewer empirical studies number of youth-specific homeless service agencies
on the topic of LGBTQ2S youth homelessness, for youth to visit (relative to the number of agencies
researchers have found that LGBTQ2S youth are tailored to adults). These realities pose a challenge to
also overrepresented in the homeless population enumerating youth homelessness through the typical
of Canada.11 LGBTQ2S youth homelessness is likely PiT count method.
caused by multiple intersections of discrimination
and marginalization (as is all youth homelessness). To account for this, the 2018 Youth Count used an
Experiences with homophobia, racism and poverty extended count period as well as a unique client code
may all be contributing factors. For example, family in pursuit of more accurately capturing the number of
rejection/conflict is frequently referenced as a cause youth experiencing homelessness in Metro Vancouver.
of LGBQT2S youth homelessness (and youth The methodology was intended to provide youth
homelessness more broadly speaking). with more contact points for being counted. Youth-
serving agencies were invited to survey clients and/or
However, the pathways into homelessness are record them through a service use spreadsheet. Table
complex, rarely linear and are usually influenced by 1 provides an overview of the two major methods for
both individual and systemic factors. Some other data collection that were used in the youth count.
factors contributing to youth homelessness may include
physical, emotional or sexual abuse, intervention from Even with this alternate methodology, the figures
child services, challenges with mental health and presented in this report are likely to be an undercount
misuse of substances. It is important to note that these of the total number of youth who experienced
dynamics may also be more prevalent in certain homelessness in the region, given that some youth
populations, such as LGBTQ2S youth. As one example, still may not have accessed services or participated
Without a Home found that rates of trauma and abuse in the survey, even over the extended count period.
were particularly high among all youth in their study, Additionally, it is important to note that not all
8
Nichols, N., Schwan, K., Gaetz, S., Redman, M., French, D., Kidd, S., O’Grady, B. (2017). Child Welfare and Youth Homelessness in Canada:
A Proposal for Action. Toronto: Canadian Observatory on Homelessness Press. http://homelesshub.ca/sites/default/files/ChildWelfare-
Policy-Brief-final_0.pdf
9
Stephen Gaetz, Bill O’Grady, Sean Kidd & Kaitlin Schwan. (2016). Without a Home: The National Youth Homelessness Survey. Toronto: Ca-
nadian Observatory on Homelessness Press. http://homelesshub.ca/sites/default/files/WithoutAHome-final.pdf
10
Nichols, N., Schwan, K., Gaetz, S., Redman, M., French, D., Kidd, S., O’Grady, B. (2017). Child Welfare and Youth Homelessness in Canada:
A Proposal for Action. Toronto: Canadian Observatory on Homelessness Press.
11
Abramovich, A., & Shelton, J. (Eds.). (2017). Where Am I Going to Go? Intersectional Approaches to Ending LGBTQ2S Youth Homelessness
in Canada & the U.S. Toronto: Canadian Observatory on Homelessness Press. http://homelesshub.ca/sites/default/files/Where_Am_I_Go-
ing_To_Go.pdf
Page 14Table 1. Overview of the Data Collection Methods Used in the 2018 Youth Homeless Count
Survey Detailed demographic data was collected through a paper survey that was conducted by
service providers, school youth workers, and youth peers/experts across Metro Vancouver.
Service Use Service providers filled in high-level information about youth accessing their services
Spreadsheet into encrypted Excel spreadsheets. While both methods collected information on
unaccompanied youth, the service use data form also captured information on
accompanied children found with their parent(s) or guardian(s) in shelters or transition
houses during the count period.12 No children (under the age of 13) were surveyed for the
count.
schools or service organizations in Metro Vancouver homelessness.
participated in the count, potentially resulting in some While PiT homeless counts may strategize to capture
youth being missed. those experiencing hidden homelessness, this
methodology targets spaces where individuals
As a result, the figures presented in this report must experiencing homelessness are most likely to be
be interpreted as a baseline figure for the number of found and, as such, this population is less likely to be
youth experiencing homelessness in the the region, fully enumerated. The methodology in the 2018 Youth
rather than an absolute figure. Count was designed to better enumerate those who
may be more likely to visit a homelessness-serving
agency over an extended period of time, rather than
Types of Homelessness within a 24-hour period. By focusing on youth-serving
agencies and not deploying volunteers on street
To better understand how youth homelessness was routes, the count intended to better capture youth
enumerated through the 2018 Youth Count, three experiencing hidden homelessness.
forms of homelessness must be considered.
3. At Risk of Homelessness
1. Visible Homelessness Not addressed through the 2018 Youth Count are those
“Visible homelessness” is a term often used to refer youth who may be at risk of homelessness, meaning
to the most visually apparent form of homelessness, their present circumstances are not adequate or
i.e. the circumstance of individuals who are sleeping considered to be sustainable. This group includes
rough and most likely to be accessing homeless youth living in poverty or on the brink of poverty.
services. PiT counts are most effective in enumerating
this form of homelessness. As the iceberg figure to the
right demonstrates, visible homelessness is only one
part of the overall extent of homelessness.
Visible Homelessness
2. Hidden Homelessness
A far more difficult form of homelessness to enumerate
is sometimes referred to as “hidden homelessness” or Hidden Homelessness
“couch-surfing.” These individuals “stay with friends,
family, or even strangers,” “are typically not paying
rent, their duration of stay is unsustainable in the long At Risk
term, and they do not have the means to secure their
own permanent housing in the future.”13 Anecdotally,
we know that youth often experience this form of
12
For more information on the differences between these two groups of young people, see the definition of youth homelessness on page
17.
Gaetz, S., Barr, C., Friesen, A., Harris, B., Hill, C., Kovacs-Burns, K., Pauly, B., Pearce, B., Turner, A., Marsolais, A. (2012). Canadian Definition of
13
Homelessness. Toronto: Canadian Observatory on Homelessness Press. For more information on hidden homelessness and other forms of
homelessness, see: http://homelesshub.ca/sites/default/files/COHhome-lessdefinition.pdf
Page 15Considerations about youth
homelessness from the Canadian
Observatory on Homelessness14:
“
Youth homelessness is a complex social issue because
as a society we have failed to provide young people
and their families with the necessary and adequate
supports that will enable them to move forward with
their lives in a safe and planned way.
In addition to experiencing economic deprivation
and a lack of secure housing, many young people
who are homeless lack the personal experience of
living independently and at the same time may be
in the throes of significant developmental (social,
physical, emotional and cognitive) changes. As a
result, they may not have the resources, resilience,
education, social supports or life skills necessary to
foster a safe and nurturing transition to adulthood
and independence.
Few young people choose to be homeless, nor
wish to be defined by their homelessness, and the
experience is generally negative and stressful. Youth
homelessness is the denial of basic human rights and
once identified as such, it must be remedied. All
young people have the right to the essentials of life,
including adequate housing, food, safety, education
and justice.
14
Stephen Gaetz, Bill O’Grady, Sean Kidd & Kaitlin Schwan. (2016). Without a Home: The National Youth Homelessness Survey. Toronto:
Canadian Observatory on Homelessness Press.
Page 16Definition of Youth Homelessness
During the 2018 Youth Homeless Count, information was collected from youth who met the
following definition of youth homelessness, drawn from the Canadian Observatory to End
Homelessness and the definition of homelessness used in the 2017 Homeless Count in Metro
Vancouver15:
“Youth” referred to young people aged 13 to 24 who were living independently of parents and/
or legal caregivers during the count period. This included people who stayed overnight on any
of the nights between April 4th and April 12th 2018, in accommodation like homeless shelters,
transition houses for women fleeing violence, youth safe houses, as well as youth with no fixed
address staying temporarily in detox facilities, as well as outside or temporarily indoors with
others (couch-surfing).
“Children” referred to youth under the age of 19, and including those less than 13 years of age,
who were not living independently of parents and/or legal caregivers during the count period
but were experiencing homelessness. While children were not the focus of the 2018 youth
count, they were included in the overall count to remain consistent with past homeless counts.
“Youth Homelessness” refers to the situation and experience of young people who:
a. did not have a stable, safe or consistent residence of their own;
b. had no place where they could expect to stay for more than 30 days; and,
c. were not paying rent.
15
Canadian Observatory of Homelessness, Canadian Definition of Youth Homelessness: http://homelesshub.ca/sites/default/files/Defini-
tion_of_Youth_Homelessness.pdf
B.C. Non-Profit Housing Association and M. Thomson Consulting. (2017). 2017 Homeless Count in Metro Vancouver. Prepared for the
Metro Vancouver Homelessness Partnering Strategy Community Entity. Burnaby, BC: Metro Vancouver.
Page 17HOW TO READ THIS REPORT
This section is intended to assist readers in understanding Example Table A explores the differences in gender
data collected through the 2018 Youth Homeless identity within the Indigenous and non-Indigenous
Count. Due to the overrepresentation of Indigenous populations of youth experiencing homelessness. Each
peoples in Metro Vancouver’s homeless population, red number on the table refers to an explanation of the
the project team decided it was important to explore associated rows or columns. See below.
any differences in the circumstances of youth who
were Indigenous and those who were not. Particularly 1. These rows detail the number of survey respondents
for organizations that serve Indigenous youth, this data who identified as male, female, or another gender
is crucial for advocating for adequate funding and further subcategorized by Indigenous identity when
services. Accordingly, most of the data tables included available. For example, according to the data in
in this report contain at least one cross tabulation to Example Table A, 144 respondents out of 274 youth
draw out any points of interest. respondents identified as male (53%). Of those 144
male respondents, 56 also identified as Indigenous, 75
Please note: the data highlighted in the example table identified as non-Indigenous and 13 did not answer the
includes actual youth count survey response data. For question on Indigenous identity.
the full analysis of the tables, see Table 4 in Section 1
and Table 8 in Section 2. 2. This row shows the total number of respondents, i.e. all
those who answered the question on gender identity.
Tables with Cross Tabulation 3. This row highlights the number of survey respondents
who did not provide an answer to the question on
In Example Table A, two pieces of data are presented gender identity. The majority of questions in the survey
simultaneously. Survey responses are divided into two contained a “Don’t Know/No Answer” check box. It
categories, by (1) gender identity and (2) Indigenous is unknown how many respondents did not know the
identity. To understand what is shown in Example Table answer to the question or how many chose not to
A, see the annotations below. answer the question, just the combined total of both.
Example Table A. Gender Identity by Indigenous/Aboriginal Identity
Indigenous Identity
Gender Identity Indigenous Non-Indigenous Don’t Know/
Total
No Answer
# % # % # # %
Male 56 54% 75 51% 13 144 53%
1 Female 42 40% 65 44% 8 115 42%
Another Gender 6 6% 8 5% 1 15 5%
2 Total Respondents 104 100% 148 100% 22 274 100%
3 Don’t Know/No Answer 2 1 79 82
4 Total 106 149 101 356
5 6 7
Page 184. This row outlines the total number of all survey provide their gender identity. Example Table A shows
respondents, including those who answered the that 82 respondents did not answer the question on
gender identity question and those who did not. gender identity or the question on Indigenous identity.
This number remains consistent throughout all the
data tables, as it captures the total number of
“completed”16 surveys. Tables for Mandatory Questions
5. These columns include the total number of As Example Table B demonstrates, for some tables, the
respondents who identified as Indigenous or non- data presented was collected through a mandatory
Indigenous, further subcategorized by gender identity question, meaning all survey respondents had to
when available. In Example Table A, two respondents provide an answer to the question to be included in
who identified as Indigenous did not provide an the youth count. For example, all survey respondents
answer to the gender identity question. needed to provide their age so that the consultant
could be sure they did in fact meet the project’s
6. This column shows the number of survey respondents definition of youth homelessness. This means that
who may have provided their gender identity but the total number of responses included in the table
did not provide an answer to the Indigenous identity represents all youth included in the youth count. For
question. these tables, the data is not broken out by number of
respondents and non-answers (as there were none),
7. This column provides the total number of respondents only the total is recorded.
who identified as each gender and those who did not
Example Table B. Age by Indigenous/Aboriginal Identity
Indigenous Identity
Age Group Indigenous Non-Indigenous Don’t Know/
Total
No Answer
# % # % # # %
19-24 66 62% 95 64% 54 215 60%
13-18 40 38% 54 36% 47 141 40%
Total 106 100% 149 100% 101 356 100%
Not every respondent provided an answer to each question in the survey. A survey respondent was screened into the data set and
16
counted for the youth count if they met the definition of youth homelessness. This was determined by their answers to the screening
questions. The remaining survey questions were not mandatory for participation in the youth count.
Page 191 OVERVIEW
OF YOUTH EXPERIENCING HOMELESSNESS
The first section of this report features data captured through both the service use spreadsheet and the survey
components of the 2018 Youth Homeless Count. Section 2 features data derived solely from survey responses.
1.1 Total Number of Youth and Children Experiencing Homelessness Included in the Count
The combined data from the survey and service use spreadsheet shows that a total of 681 unique unaccompanied
youth and accompanied children were found experiencing homelessness during the count period. Of these 681
young individuals, 643 were unaccompanied youth (94% of the total) and 38 (6%) were accompanied children.
Table 2. Total Number of Unaccompanied Youth and Accompanied Children 17
Unaccompanied Youth Accompanied Children 18 Total
# % # % # %
643 94% 38 6% 681 100%
1.2 Where Youth Stayed on April 4, 2018
The 2018 Youth Homeless Count asked youth where they stayed on the night of April 4th.19 Table 3 shows a total
of 462 youth answered this question and most responded that they were couch-surfing (174 respondents, or
38%), followed by a large share of youth who stayed in shelters, safe houses, and transition houses (154
respondents, or 33%).
Responses showed that 295 respondents (64%) had stayed in unsheltered locations such as doorways, alleys,
and parks, or temporarily indoors (couch-surfing) on the night of April 4th 2018.
An additional 43 youth (not included in Table 3) indicated that they stayed with their parents on the night of
April 4th and were subsequently screened out of the count during the data cleaning process. Of the youth who
stayed with their parents on the night of April 4th, 14 youth (33%) had stayed with their parents for five days or
less over the course of the previous week. In addition, 13 (30%) of these youth identified as Indigenous, 10 (23%)
identified as LGBTQ2S, 12 (28%) were currently or had previously been in foster care, a group home, or
independent living arrangements and 32 (74%) of these 43 youth were under the age of 19.
17
This table combines data collected through survey responses and the service use spreadsheet. Unless otherwise specified all other tables
contain survey data only. For all tables, the number of total respondents varies depending on how many individuals chose to provide an
answer to the associated questions in the service use spreadsheet or the survey.
18
“Accompanied Children” refers to children under 19 who were found with their parent(s) or guardian(s) during the youth homeless count.
No individual survey records of these children exist, as they were not interviewed. 70% of these children were found in transition houses.
19
The reference to a single day was chosen to ensure comparability between the amended youth count methodology and the traditional
PiT count methodology.
Page 20Table 3. Total Sheltered and Unsheltered Unaccompanied Youth 20
Total
Where youth stayed on the night of April 4th 2018
# %
Unsheltered 295 64%
Someone else's place (couch-surfing) 174
Outside (incl. in vehicles, makeshift shelter or tent, abandoned/
121
vacant building)
Sheltered 164 35%
Shelter/Safe House/Transition House 154
Detox/Recovery House 10
Other 21
3 1%
Total Respondents 462 100%
Don’t Know/No Answer 219
Total 681
1.3 Age of Survey Respondents and Service Use Data Clients
Of the 681 youth and children counted, 296 (43%) were aged 18 or younger, and 390 (57%) were between the
ages of 19 and 24 inclusive.
The target demographic of the 2018 Youth Homeless Count was youth aged 13 to 24 who were experiencing
homelessness and living independently of their parent(s) or guardian(s). This group is referred to throughout
this report as “unaccompanied youth.” These youth were tracked through survey responses and through client
records listed on service use spreadsheets. The service use spreadsheets also identified children experiencing
homelessness who were accompanied by their parent(s) or guardian(s) in shelters or at other homelessness service
locations. The majority of these children were found in transition houses. In this report, children with their parent(s)
or guardian(s) are referred to as “accompanied children” and were captured solely through the service use
data spreadsheet as supplementary data. No further demographic information is available for these children as
they were not interviewed by staff for the purposes of the count.
20
This table combines data collected through survey responses and the service use spreadsheet.
21
Three youth that selected the “other” category for this question did not provide a write-in answer explaining where they stayed on the
night of April 4th.
Page 21Table 4. Unaccompanied Youth and Accompanied Children by Age Group 22 23
Total
Age Group
# %
19-24 390 57%
13-18 253 37%
Under 13 38 6%
Total 24 681 100%
1.4 Gender
Youth that responded to the question on gender totaled 560 and over half (290, or 52%) identified as male; 248
(44%) identified as female, and 22 youth (4%) identified as another gender identity.
Table 5. Unaccompanied Youth and Accompanied Children by Gender Identity 25
Total
Gender Identity
# %
Male 290 52%
Female 248 44%
Another Gender Identity 22 4%
Total Respondents 560 100%
Don’t Know/No Answer 121
Total 681
1.5 Youth Homelessness by Metro Vancouver Sub-Region
The following map shows the communities across Metro Vancouver that participated in the 2018 Youth Homeless
Count and the total number of unaccompanied youth and accompanied children counted in each community.
This table combines data collected through survey responses and through the service use spreadsheet and includes information on 38
22
accompanied children under the age of 13; age was derived in reference to the unique anonymous code of each respondent. See the
methodology section for more information.
Age was identified for all respondents, as youth were required to provide their year of birth for the creation of their unique anonymous
23
code.
24
This number includes accompanied children.
25
This table combines data collected through survey responses and data received through the service use spreadsheet.
Page 22TOTAL NUMBER OF YOUTH AND
CHILDREN IDENTIFIED AS HOMELESS
IN THE METRO VANCOUVER YOUTH
HOMELESS COUNT: 681
The count captured responses from 64
youth in most of the 21 municipalities
of the Metro Vancouver region. NORTHSHORE 20
The majority of youth and children
TRICITIES 22
experiencing homelessness were
found in Vancouver (349). This figure RIDGE MEADOWS
represents 51% of all unaccompanied 349 34
youth and accompanied children
who were counted. In addition to the VANCOUVER BURNABY
33
City of Vancouver, a large number
of youth were also counted in Surrey 18 NEW WESTMINSTER
(106), which represents 16% of the total
RICHMOND
counted, while the North Shore had
64 individuals (9%) as the third highest 16 106 16
number of youth. DELTA SURREY LANGLEY
3 WHITE ROCK
Table 6. Unaccompanied Youth and Accompanied Children by Municipal Sub-Region 26
Total
Sub-region
# %
Burnaby 34 5%
Delta 16 2%
Langley 16 2%
New Westminster 33 5%
North Shore 64 9%
Richmond 18 3%
Ridge Meadows 22 3%
Surrey 106 16%
Tri-Cities 20 3%
Vancouver 349 51%
White Rock 32 PROFILE
OF YOUTH EXPERIENCING HOMELESSNESS
Section 2 of this report features data captured solely through the survey component of the 2018 Youth Count.
This section of the report does not include information on accompanied children28 or youth who were captured
solely through the service use spreadsheet.
A total of 82 youth provided answers to the mandatory questions that qualified their surveys to be screened-into
the count and allowed them to be included in the total number of youth found experiencing homelessness.
Another 274 youth provided an answer to at least one additional question beyond the basic screening questions.
All previous homeless counts in the Metro Vancouver region found a disproportionately high percentage of
Indigenous homelessness overall – adults and youth. As such, the data presented in the tables in Section 2 of this
report was analyzed by Indigenous identity to assist with service provision and allocation of funding. Where the
sample size was too low for a meaningful representation, the data was not separated between Indigenous and
non-Indigenous identities.
The total number of respondents varies by table depending on how many youth chose to answer that question
in the survey.
2.1. Age of Survey Respondents Only
Out of all respondents, 215 or 60% of youth were over the age of 19, while 141 youth surveyed (40%) were
between the ages of 13 and 18.
Table 7. Age Distribution of Youth Who Participated in the Survey 29
Indigenous Identity
Age Group Indigenous Non-Indigenous Don’t Know/
Total 30
No Answer
# % # % # # %
19-24 66 62% 95 64% 54 215 60%
13-18 40 38% 54 36% 47 141 40%
Total 106 100% 149 100% 101 356 100%
28
No children accompanied by their parent(s) or guardian(s) were interviewed as part of the survey component of the count.
29
The age group table combines survey and service use spreadsheet data. There are slight differences between the survey responses in
Table 5 and the responses shown in Table 8. These are accounted for by the exclusion of children under age 13 who were not surveyed
and are not included in Table 8. As a result, the proportion of youth over the age of 19 was slightly higher in the survey responses (60%
compared to 57%).
30
Data used in this table was derived solely from survey responses, which is why the total number included is lower than in Table 4.
31
When compared to Table 5 above, which combined the two data sets, the proportion of youth identifying with each gender varies only
slightly. 52% of combined respondents identified as male, compared to 53% of survey respondents only, while 44% of combined
respondents identified as female compared to 42% of survey respondents only. Four percent of the combined respondents identified as
another gender compared to 5% of survey respondents only.
Page2.2 Gender Identity of Survey Respondents Only
Table 8 below shows youth by their responses to the question of gender identity on the survey.31 In total, 144
respondents identified as male (53%) compared to 115 female (42%). By percentage, the proportion of Indigenous
youth (54%) who identified as male was marginally higher than for non-Indigenous youth (51%). It was the opposite
for those youth who identified as female; among Indigenous youth 40% identified as female compared to 44% of
the non-Indigenous youth. Of those who responded to this question, 15 youth, or 5%, identified as another gender.
Table 8. Gender Identity of Youth Who Participated in the Survey
Indigenous Identity
Gender Identity Indigenous Non-Indigenous Don’t Know/
Total 32
No Answer
# % # % # # %
Male 56 54% 75 51% 13 144 53%
Female 42 40% 65 44% 8 115 42%
Another Gender 6 6% 8 5% 1 15 5%
Total Respondents 104 100% 148 100% 22 274 100%
Don’t Know/No Answer 2 1 79 82
Total 106 149 101 356
2.3 Indigenous Identity
A total of 106 youth surveyed identified as Indigenous, which accounted for 42% of all unaccompanied youth
found through the survey.33
Table 9. Indigenous Identity
Total
Indigenous Identity34
# %
Indigenous 106 42%
Non-Indigenous 149 58%
Total Respondents 255 100%
Don’t Know/No Answer 35 101
Total 356
As the next table shows, of the youth who identified as Indigenous, a majority of 65%, identified as First Nations,
followed by Métis at 22% and one youth identified as Inuit. The survey did not include a list of other Indigenous
32
Data used in this table was derived solely from survey responses, which is why the total number included is lower than in Table 5.
33
In the 2018 City of Vancouver Homeless Count, 46% of youth under 25 identified as Indigenous/Aboriginal. See: City of Vancouver: Staff
Presentation to Council (2018). Slide 20. URL: http://council.vancouver.ca/20180501/documents/rr1presentation.pdf (Last Accessed: June
21, 2018)
34
This table was derived from survey data only. Service use data for this question was not consistently available.
Page 25identities; the table shows that 12 youth indicated they were of an Indigenous identity not listed in the survey. This
category may have included Indigenous youth from other countries as well as Canada.
Table 10. Indigenous – First Nation, Métis, Inuit
Total
Indigenous Identity, by Sub-category
# %
First Nations 63 65%
Métis 21 22%
Not Listed 12 12%
Inuit 1 1%
Total Respondents 97 100%
Don’t Know/No Answer 9
Total 106
2.4. Sexual Identity
This question was also posed in the 2017 Homeless Count in Metro Vancouver and was included on feedback
from service providers seeking data on anecdotal information suggesting a higher number of non-heterosexual
youth were experiencing homelessness or at greater risk of becoming homeless. Table 11 shows that 65 youth
(26% if respondents) identified as LGBTQ2S.
Additional analysis was undertaken to determine if there were any differences in the age and gender of LGBTQ2S
youth compared to non-LGBTQ2S youth. LGBTQ2S youth were slightly younger than their heterosexual peers
with 45% under age 19, compared to 34% of youth who did not identify as LGBTQ2S. A higher proportion of
LGBTQ2S-identifying youth identified as female (48%), compared to 40% as male or as another gender (22%).
Table 11. Sexual identity
Indigenous Identity
Sexual Identity Indigenous Non-Indigenous Don’t Know/
Total
No Answer
# % # % # # %
LGBTQ2S36 28 28% 33 24% 4 65 26%
Not LGBTQ2S 72 72% 107 76% 4 183 74%
Total Respondents 100 100% 140 100% 8 248 100%
Don’t Know/No Answer 6 9 93 108
Total 106 149 101 356
35
A total of 101 youth respondents were included under the “No Answer” category for the question on Aboriginal/Indigenous identity. Out
of the 101 youth, 48 were included because the question was not filled out on their survey form. The remaining 53 youth were included
because “Don’t Know/No Answer” was selected on the survey form as their answer choice. Of the 53 respondents who selected “Don’t
Know/No Answer,” it is unknown how many did not know the answer to the question and/or whether it was selected by the surveyor due to
non-response. It is possible that some respondents may not have known whether they were of Aboriginal/Indigenous ancestry/identity and
would have chosen “Don’t Know” had it been a separate answer category.
36
Three respondents identified their sexuality as “other”: one as pansexual, one as bisexual and one as “does it matter.” The former two
were coded as LGBTQ2S and the latter as “don’t know/no answer.”
Page 26You can also read