Portal TB Gombak: Web-Based Application for Plotting of Tuberculosis Cases in Gombak, Selangor, Malaysia - Research Square
←
→
Page content transcription
If your browser does not render page correctly, please read the page content below
Portal TB Gombak: Web-Based Application for
Plotting of Tuberculosis Cases in Gombak, Selangor,
Malaysia
Nur Adibah Mohidem
Universiti Putra Malaysia Fakulti Perubatan dan Sains Kesihatan
Malina Osman ( nuradibah620@gmail.com )
Universiti Putra Malaysia Fakulti Perubatan dan Sains Kesihatan https://orcid.org/0000-0002-9423-
7505
Farrah Melissa Muharam
Universiti Putra Malaysia Fakulti Pertanian
Saliza Mohd Elias
Universiti Putra Malaysia Fakulti Perubatan dan Sains Kesihatan
Ra za Shaharudin
Institute for Medical Research, National Institutes of Health
Zailina Hashim
Universiti Putra Malaysia Fakulti Perubatan dan Sains Kesihatan
Research
Keywords: GIS, Mapping, Tuberculosis, Programming, Web
DOI: https://doi.org/10.21203/rs.3.rs-152689/v1
License: This work is licensed under a Creative Commons Attribution 4.0 International License.
Read Full License
Page 1/21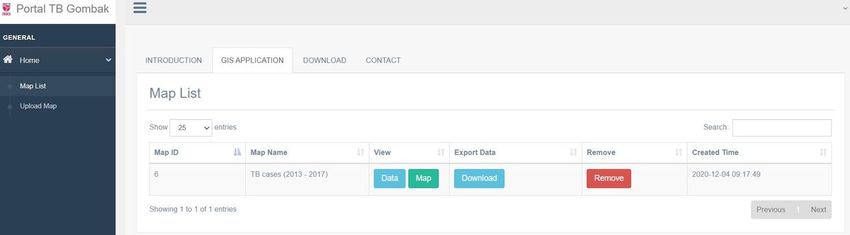
Abstract
Background: In the last few decades, public health surveillance has been conducted using various
programming languages implementing statistical methods to analyze the spatial distribution of a
disease. Nevertheless, contact tracing and follow up control measures for tuberculosis (TB) patients
remain challenging because many public health o cers lack the appropriate programming skills to use
the related software. Therefore, this study aimed to develop a TB mapping application associated with
sociodemographic factor in Gombak.

Methods: The sociodemographic data of 3325 TB cases such as age, gender, race, nationality, country of
birth, educational level, employment status, healthcare worker, income status, residency, and smoking
status between January 2013 and December 2017 in Gombak district were collected from the
Tuberculosis Information System (TBIS) database at the Gombak District Health O ce and Rawang
Health Clinic and myTB website. Apart from that, the sociodemographic data of TB cases were extracted
from the Aeronautical Reconnaissance Coverage Geographic Information System (ArcGIS) version 10.7
and subsequently uploaded into the Portal TB Gombak. The application was set up in the Python
Shape le (PHP) CodeIgniter framework with ArcGIS JavaScript API 3.7 and HyperText Markup Language
(HTML), Cascading Style Sheet (CSS), JavaScript, and PHP as programming languages to build the
system. Additionally, the ESRI map was used as the base map and combined with the web GIS
technology via ArcGIS Application Programming Interface (API).

Results: The application displays the location of TB cases on an interactive map based on
sociodemographic factor.

Conclusion: Portal TB Gombak allows public health o cers to visualize the potential risk areas of TB
cases without a trained programmer and geospatial statistician. This application will help healthcare
personnel better understand TB transmission, thus improving case detection and minimize the public
health impact of the disease.

Background
Tuberculosis (TB) is an infectious disease caused by Mycobacterium tuberculosis and one of the top 10
deadly infectious diseases worldwide. In 2018, about 10 million new TB cases were reported, and
1.5 million people died from this disease. According to the World Health Organization [1], Malaysia is
ranked 76th globally, categorized as an intermediate TB burden country. Nonetheless, the mortality rate
due to TB is the highest compared to other infectious diseases, i.e., 5–7 deaths per 100 000 population
annually, and about 20,000 to 25,000 new TB cases are recorded each year [2]. This report is a cause for
concern because it shows TB transmission is on the rise in Malaysia; hence prevention measures are
mandatory to keep this endemic under control. Previous studies have found that TB cases are associated
with a list of sociodemographic factors: age [3], gender [4], race [5], educational level [6], employment
status [7], health care worker status [8], income [9], residency [10], nationality [11], country of birth [12],

                                                   Page 2/21
and smoking status [13]. From a public health management perspective, understanding the distribution
of TB cases associated with sociodemographic factors over a speci c period is crucial in prevention and
control programs. This is where spatial epidemiology comes in.
Spatial epidemiology generally includes the interpretation and analysis of spatial data consisting of
major interrelated approaches such as disease mapping and associated risk factors [14]. Principally, it
involves two types of data: point and regional, in the form of dot and choropleth maps, respectively [15].
A map provides a simple visualization of spatial data in the preliminary observation stage, besides being
more comprehensive than data tables and written reports, which require a longer time to be interpreted.
Therefore, disease mapping is the key step in epidemiological disease investigation that can help
illustrate spatial variation, formulate and validate etiological hypotheses, and develop public health
prevention and surveillance programs [16]. GeoDA is a tool that facilitates exploratory spatial data
analysis and visualization on lattice data, including spatial autocorrelation and basic spatial regression
analysis. On the other hand, OpenBUGS software conducts more complex spatial and spatio-temporal
analysis, such as predicting the relative risk of diseases and allowing the establishment of Bayesian
disease models using Markov chain Monte Carlo methods.
In the last decade, spatial statistics have seen tremendous development with the increased accessibility
to geographically indexed disease data and geographic information systems (GIS), which is in line with
the improvement of spatial statistics. Aeronautical Reconnaissance Coverage Geographic Information
System (ArcGIS), a commonly used commercial package that integrates GIS with epidemiology, consists
of many features ranging from simple to advanced analyses using spatial statistics. Conversely,
Quantum Geographical Information System (QGIS) is an open-source package that can be an alternative
for the ArcGIS that shares the latter’s functions and features. Both ArcGIS and QGIS are currently the most
relevant tools for disease mapping. Nevertheless, the presence of a GIS expert is necessary to operate
even the simplest analysis and output because many biomedical sciences researchers lack the
appropriate statistical and programming skills to operate them e ciently.
In view of this, there is a broad range of spatial analysis that can be used as a surveillance technique,
such as space-time scan statistic [17], spatial autocorrelation analysis [18], identi cation of hotspot
clusters [19], and spatial regression analysis [20]. However, running these spatial statistics will result in
the loss of each TB patient's original data, thus plotting each case's location is the only way to track back
the individual information. This process is possible with GIS, a powerful tool to store, analyze, and
display geographically-referenced data [21] to conduct various spatial analyses. These functions make
GIS an excellent platform for creating a map that effectively presents the data and is more
comprehensive for users from different educational backgrounds.
Many commercial GIS applications are equipped with high functionalities developed by the latest
software. Geospatial and Geoinformatics experts in the industry must bear the cost of server
development and license fee annually to use these apps continuously. In contrast, a web-based GIS
application is designed for a certain function for users that lack programming knowledge and skills at a
Page 3/21fraction of the cost. It is an alternative to visualize the disease pattern because it is easy to use and can
be accessed anywhere as long as the user has a laptop or handphone with internet access.
Earlier literature has reported various disease mapping applications that involve case detections in high-
risk areas. For instance, the European Center for Disease Prevention and Control Map Maker is an online
application to identify the spatial pattern of communicable diseases among European countries [22].
Aside from that, Smith and Hayward [23] introduced Dot Mapper to plot the molecular clusters of TB
cases in space and time according to London's demographic risk factors. Additionally, SpatialEpiApp is a
Shiny web application that t Bayesian models to obtain risk estimates of lung cancer mortality and their
uncertainty for each of the areas and dates by using R-Integrated nested Laplace approximations and
detection of the spatial and spatio-temporal clusters by using the scan statistics implemented in
SaTScan in Ohio, United States from 1981 to 1984 [24]. These are examples of web-based GIS
applications that are easy to use, include basic data speci cation, and does not require the manual
processing of the geospatial data.
Similarly, this disease mapping application with a slightly different design would be useful to promote the
understanding of TB’s epidemiological characteristics and improve its prevention and targeted control
strategies. Thus, this study aimed to develop Portal TB Gombak, a novel tool that plots the location of TB
cases from 2013 to 2017 based on the sociodemographic factor. To the best of our knowledge, this is the
rst study that has designed a web application for creating interactive TB point maps in south-east Asia;
including Malaysia using sociodemographic characteristics of TB cases. This application is mainly
addressed to public health o cers responsible for case investigations but lacks GIS and programming
knowledge and skills. Therefore, this application was created as the handy source for the MOHM’s case
investigation with appropriate ethical approval.
Materials And Methods
1. Study area
This cross-sectional study used retrospective data of TB cases in the district of Gombak, Selangor,
Malaysia. Gombak is one of the administrative districts in Selangor, covering a total area of 650.08 km2.
It is between longitude 101°34′ and 14°6′ East and latitude 3°16′ and 27.3°North′, which lies from the
middle to the eastern part of Selangor state. The district of Gombak is divided into four sub-districts or
mukim: Rawang, Batu, Setapak, and Hulu Kelang. Each mukim is de ned as the minimal area of analysis
in this study. The location of mukims is displayed in Fig 1. Gombak’s residential population is about
815,200 in 2018, which ranks fourth (after Petaling, Hulu Langat, and Klang) among the eight districts in
Selangor; with approximately 90% of the population living in urban areas [25].
The annual average temperature in Gombak is 27.1 °C, re ecting the tropical climate, which is hot and
humid throughout the year. Furthermore, this district experiences a signi cant average rainfall at
approximately 2535 mm annually [26]. Moreover, the terrain is hilly in the eastern and parts of the
Page 4/21northern and west regions, whereby most of them are still covered with forests within the altitude of 100
and 500 m above sea level. On the other hand, the central and south-west areas of Gombak are relatively
low, with lowlands with an average elevation between 30 and 70 m above sea level [27].
Gombak district is a part of the Klang Valley, consisting of major municipal areas in the south and west.
Moreover, Kuala Lumpur city's rapid urbanization has spread to the southern part of Gombak in recent
decades, especially in the industrial processes. Aside from that, the health sector comprises of two
government hospitals, eighteen government clinics, three private hospitals, and three private clinics [28].
In 2018, Selangor accounted for the highest TB burden with 5,071 cases, among which Gombak was the
district that reported the highest TB incidence at approximately 700 cases each year [29]. The
geographical location of Gombak is presented in Fig 1.
2. Data sources
2.1 Sociodemographic data of TB cases
All healthcare providers in hospitals, clinics, disease prevention, control institutions, and all other
designated healthcare establishments are obligated to promptly report active TB cases into the TBIS
database of the respective health districts. After that, the data would be electronically transferred into the
myTB by MOHM’s o cers. In this study, the TB data between 1 January 2013 and 31 December 2014
were collected from the Government Health Clinic in Rawang, while TB data between January 2015 and
December 2017 were collected from the TB/Leprosy Unit of Gombak District Health O ce in Batu Caves.
The con dential data were retrieved upon the approval from the Director of Gombak District Health O ce
via myTB and double checked from TBIS to prevent errors. The TB patients were diagnosed based on X-
ray ndings, pathogen detection, and pathological diagnosis according to the criteria set by the MOHM
(2008).
The sociodemographic variables of the TB patients including age (years ), gender (male,
female), race (Malay, Chinese, Indian, and others), country of birth (Malaysia, Indonesia, Myanmar,
Bangladesh, others), nationality (Malaysian, non-Malaysian), educational level (secondary school and
below, secondary school and above), employment status (employed, unemployed), healthcare worker
status (health care worker and non-healthcare worker), residency (urban, rural), income status (permanent
income/not permanent income), and smoking status (smoking, not smoking) were collected for the
current study. These data were acquired via myTB selected by considering the reality of Malaysia’s TB
situation reported in earlier literature [62-64] and double checked from TBIS to prevent errors. Additionally,
data such as individuals' ID, type of TB (smear-positive, smear-negative, extra-pulmonary, and drug-
resistance), and date of diagnosis (month, year) were also retrieved, while the “year” and “month” were
recorded according to the date when the TB diagnosis was con rmed.
Out of the 3,590 TB cases retrieved, 181 cases (5.04%) were excluded, of which 2.53% were residents
outside the study zone, while another 2.51% were not diagnosed within the study period. After removing
cases that could not be geocoded (2.46%) due to incorrect, missing, or unclear address information, only
Page 5/213,325 (97.54%) cases from January 2013 to December 2017 were included in the nal analysis, which
was then aggregated at the mukim level.
2.2 Geographical data
Firstly, the data obtained were imported into the spatial district data attribute table to display the spatial
distribution of TB cases and their sociodemographic factors. The Universal Transverse Mercator
coordinates of the patients’ residences were geocoded from their home addresses recorded in the
database using Google Earth™ version 7.15 (Alphabet Inc., Mountain View, CA, USA). However, some of
the patients’ addresses in rural areas were not detected by Google Earth; thus, coordinates of the bigger
geographical areas such as village and street names were recorded. Then, the extracted data were
georeferenced with the district polygons using ArcGIS version 10.7 (Environmental Systems Research
Institute [ESRI], Redlands, CA, USA)
3. Web application
3.1 Input data preparation
Initially, the app user is required to prepare several types of TB data that include patients ID, address
coordinates, mukim, month of diagnosis, year of diagnosis, and sociodemographic variables of TB cases
(age, gender, race, nationality, country of birth, educational level, employment status, healthcare worker
status, income status, residency status, and smoking status). The established data table form of a .csv
le consisting of one column per data type and one row per individual TB case (patient). Aside from that,
the data le containing information were categorized into numbers, as presented in Table 1.
3.2 System architecture and design
Portal TB Gombak is a web-based application to plot locations of TB cases based on sociodemographic
factors from years 2013 to 2017 in the Gombak district. The application can be access through
https://tbgisgombak.com/arcgis/ by single or multiple users (a group of users) at one time. The web is
already hosted on the dedicated server with a presented architecture comprising of CodeIgniter
Framework as the Application layer, Web ArcGIS Service and Environmental Systems Research Institute
(ESRI) Map as Service layer, and SQL Server database as the Data layer. Furthermore, the CodeIgniter
Framework consists of four main components such as HyperText Markup Language 5 (HTML),
Cascading Style Sheet (CSS), JavaScript, and Python Shape le (PHP) to build the server’s interface and
combined with web GIS technology to develop the server for JavaScript API on ArcGIS software (Fig 2). In
addition, the app interfaces allow users to insert and modify the TB data directly from the browser and
control the application's layout using CodeIgniter Framework, which will automatically change the input.
3.2.1 Application layer
The HTML and CSS widget was used for interactive web data visualization (HTML and CSS Standards,
2020). HTML is used because it has the elements to support multimedia without using Flash or other
Page 6/21third-party plugins. Apart from that, PHP was utilized as the MapServer to import the data le to the
website page using HTML code, acting as a platform to display geographic information. To achieve an
online display of spatial inundation information, MapServer has four necessary les: start webpage,
spatial information, and HTML template. This platform is displayed on browser pages, and after it
captures the spatial data, the results are presented in the users’ web browsers according to the template
les. Besides, the templates les also show the webpage image and the control panel for the design layer,
such as opening/closing, zooming, panning, and other operations.
On the other hand, JavaScript is a scripting language written by the users by embedding them into HTML
documents and accessible o ine. It supports the development of highly responsive interfaces and
maintains user interface presentation besides offering dynamic functionality without waiting for the
server response. Furthermore, a JavaScript program can control what is visible on the screen by showing,
hiding, or changing the characteristics of the page elements (text, tables, page regions, buttons) de ned
in HTML. The purpose of JavaScript is to geocode reported TB cases and its sociodemographic variables
of the Gombak district. An additional feature of the application is the geocoding of the TB patients’
addresses according to the base map using JavaScript. Geolocation detection by JavaScript is
compatible with different devices such as laptops, tablets, and mobile devices, creating a responsive web
application and cross platform, besides supporting several browsers such as Chrome, Mozilla Firefox,
Safari, and Opera.
Additionally, Data Tables display interactive tables containing information on the TB cases and their
sociodemographic variables. It supports ltering, pagination, and sorting, which helps locate and provide
information on a particular area or show the areas with higher or lower values.
3.2.2 Service layer
ESRI Map is a free, editable world map server that allows the sharing of visualization of the target areas
without copyright restrictions [30]. The user interface base map in the current application is an ESRI Map,
with several basic controls for panning, zooming, and switching views, which is very convenient when the
map contains small areas. This part of the interface is built when the page is loaded and the starting map
location is a default location. Furthermore, the ESRI Map is selected so that the user will be able to
operate the app like the other mass-market internet mapping sites such as Google Earth and Google Map.
In this study, the ESRI Map is used as a platform to facilitate the detection of high-risk areas of TB cases
and provide visualization on the web.
Contrary to the complex, multifunctional, and established version of the GIS system, Web GIS integrated
with the internet is broadly used in many elds. It focuses on the conversion of data format as well as
usual function inquiry and display. This study used ArcGIS JavaScript API 3.7 developed by ESRI Map as
the Web GIS technology (JavaScript API for ArcGIS Guide, 2020). Furthermore, the API key was added to
the JavaScript code of the ESRI Map along with latitude and longitude of the TB cases. Thus, API
displays TB data on the Portal TB Gombak map, which substantially simpli es the information and
allows sharing with other users without any software.
Page 7/213.2.3 Data layer
My Structured Query Language (MySQL) is an open-source relational database management system that
can retrieve rows of data, and there is a request of string named "Query." The SQL Server 2008 database
preserves spatial information for the reported TB data in the current study.
3.2.4 Web GIS technology
Unlike the complex standalone version of GIS system, web GIS combined with the internet is extensively
used in all elds. This is because it focuses on the conversion of data format as well as the common
function survey and display and is an effective tool for displaying spatial data. Furthermore, rate of data
transmission and user convenience should also be recognized in the advancement of technology. The
client uses a web browser and the server provides the client with information and services. Web GIS has
not only be able to perform the functions of traditional GIS, yet has also be able to perform the functions
of data acquisition, storage, processing, compilation, management analysis, and visualisation of
geographic information. In this study, the functions of web GIS application is map visualization. It could
be carried out by retrieving graphics and attribute data of TB cases, as well as allowing clients in other
regions to be able to operate these data by interacting with the browser. This study used ArcGIS API, in
which the common web GISs developed by ESRI, TIGER (Topologically Integrated Geographic Encoding
and Referencing) developed by the United States Census Bureau and MapServer owned by the Open
Source Geospatial Foundation (OSGeo).
3.3 Functionality of the web
The application consists of four tabs: (i) an ‘Introduction’ tab where the user can read the summary of the
information about the web; (ii) a ‘GIS Application’ tab where the data can be uploaded and downloaded;
and TB cases and its sociodemographic factor can be plotted and displayed; (iii) a ‘Download’ tab
containing a ow diagram on designing the web, publication for references regarding the
sociodemographic factor of TB cases in Malaysia, and a user manual and tutorial on how to use the web;
and (iv) ‘Contact’ tab whereby the user can send queries to the authors via e-mail and letter using their
a liation address.
Meanwhile, the ‘GIS Application’ tab includes several control widgets for users to interact by sending
messages or instructions to the application. However, it is not an open-access web because the user
needs to ll in the ‘Username’ and ‘Password’ columns to enter the web. Furthermore, the ‘GIS Application’
page comprises two components: ‘Upload Map’ and ‘Map List’ buttons. There are several functions in the
‘Upload Map’ option, including ‘Map Name’ column, ‘Choose File,’ ‘Submit,’ and ‘Reset’ button. Moreover,
there is a ‘Search’ column, ‘Data,’ ‘Map,’ ‘Download,’ and ‘Remove’ button in the ‘Map List.’ In addition, there
is the navigation (+/-), ‘Search address,’ Legend of ‘Year of TB cases,’ scale bar, coordinate, ‘Filter,’
‘Sociodemographic variables,’ and ‘Reset’ buttons on the map generation page. The ow of design for
Portal TB Gombak is presented in Fig 3.
Page 8/21Results
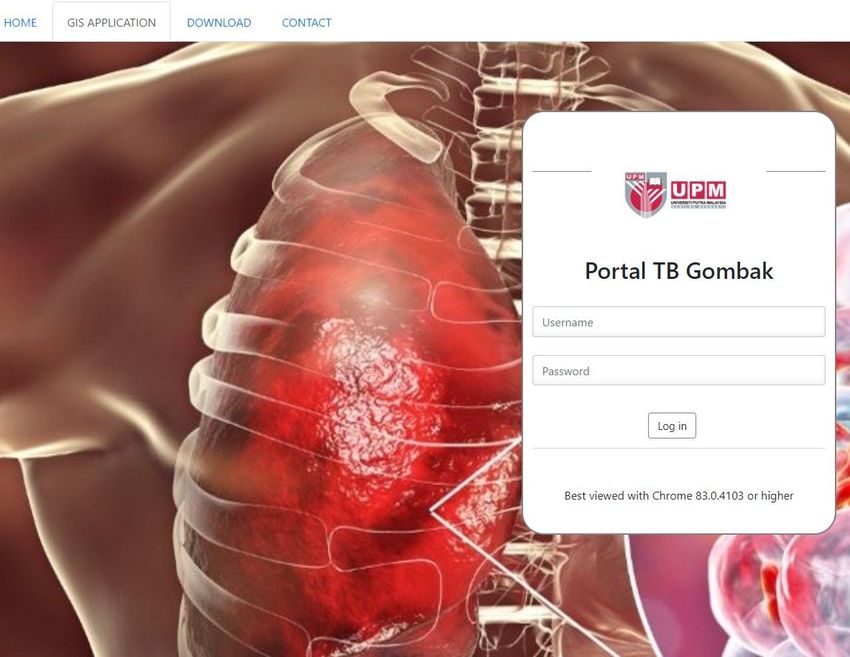
The main output of this application is Portal TB Gombak, a convenient website for plotting TB cases in
the Gombak district. It allows users to lter the distribution of TB cases based on year, mukim, location of
patients, and sociodemographic characteristics. Once the webpage is accessed, the dashboard appeared
as shown in Fig. 4. Then, the user is required to insert a speci c ‘username’ and ‘password’ in the columns
provided to access the web.
After login, the user can click the ‘GIS Application’ tab to upload the data le through the ‘Upload Map’
column (Fig. 5). The data le can be inserted by clicking the ‘Choose File’ button and selecting the
respective les. Then, the user needs to specify the data le in the ‘Map name’ column and upload it by
clicking the ‘Submit’ button. On the other hand, the ‘Reset’ button is present if the user wants to delete the
uploaded data le or re-upload a new data le. Meanwhile, the map ID is the unique identi er of TB
patients from 1 January 2013 to 30 December 2017. The le data can be exported by clicking the
‘Download’ button to download the data in the plotted map. Furthermore, the users can upload new data
les in the future, such as TB data from the year 2018 and above, using different map ID to differentiate
them with the existing data on the web. Therefore, the application offers a exible data input procedure
for the user.
Information of the uploaded data le can be displayed as a map through the ‘Map List’ column in the ‘GIS
Application’ tab. Meanwhile, the user can click the ‘Data’ button to view the table form of the data
consisting of latitude, longitude, mukim, month of diagnosis, and year of diagnosis. Furthermore, the user
can view and lter selected information from the table by entering a keyword in the ‘Search’ column.
Moreover, they can sort the rows in an ascending or descending order for data in any of the columns.
Nevertheless, this study could not show all the data view variables because the large data size will cause
a lag in the web, thus needing a longer time to be loaded. In addition, uploaded maps can be removed by
clicking the ‘Remove’ button.
In spatial epidemiology, the location of each TB patient is conveyed in point form. This study plotted the
TB cases in point form (longitude and latitude) to prevent the loss of raw information of each patient.
Therefore, TB cases from 2013–2017 can be displayed by clicking the ‘Map’ button to generate a map on
a new page on the computer or mobile phone screen (Fig. 6).
After clicking the ‘Map’ button in the ‘Map List’ column of the ‘GIS Application’ tab, the server will
automatically generate the data as a map on the ESRI Map. Since the temporal unit is “Year,” the TB
cases were differentiated by color-coded dots as follows: (i) 2013; yellow, (ii) 2014; black, (iii) 2015; green
(iv) 2016; blue, and (v) 2017; red, indicated at the bottom-left side of the dashboard. Meanwhile, the user
can nd each patient's address at the dashboard's top-left side, which consisted of three buttons such as
ESRI World Geocoder, Congressional Districts, and Senator. Besides, plotted cases can be changed and
ltered according to mukim and variables of the sociodemographic factor by clicking the ‘Filter’ button on
the right side of the page. Furthermore, the lter can be removed to display all cases by clicking the ‘Reset’
Page 9/21button. This information is useful when investigating the locations of each sociodemographic variable
located on the map.
Additionally, the map can be zoomed in (+) and out (-) by clicking the panning and zooming controls on
the top-left side of the dashboard and scrolling the mouse to magnify or minimize the map. When the
mouse is moved to any area, the dot's size representing TB cases remains the same until the user
zoomed in to the maximum size of the targeted location, and information of the targeted areas will be
displayed. Moreover, the ‘scale bar’ in kilometers can also be seen on the map (Fig. 7).
By analyzing the uploaded data in the developed application, a higher occurrence of TB cases in the
south, south-east, north-west, and west part of Gombak were identi ed, whereas lower TB cases were
detected in the north and north-east areas. Meanwhile, moderate TB cases were recorded in the south-
west part of the Gombak district. In the past couple of decades, the increasing entry of foreign workers
has contributed to the rise in TB cases in Malaysia. Most of them came from Indonesia, Myanmar,
Bangladesh, and Pakistan [31]. Using the ‘ lter’ button in the application, the public health o cer can lter
the housing areas for non-Malaysian TB patients and enhance surveillance on the risk areas.
The reported TB cases among non-Malaysians were distributed across districts such as Bukit Kembara,
Kampung Datuk Keramat, Bukit Antarabangsa, Ukay Perdana, Taman Melawati, International Islamic
University Malaysia, Kampung Sri Gombak Indah, Greenwood 2210A, Taman Kampung Tengah 1 & 2,
Kampung Baru Batu Caves, Kampung Selayang Indah, Kampung Selayang Pandang, Taman Ehsan,
Taman Wangsa Permai, Kawasan Industri Kampung Jaya, Taman Industri Bolton, Sungai Buloh, Rawang
Perdana, Bandar Country Homes, Batu Arang, Kampung Melayu Dri Kundang, Kampung Setia, Kampung
Gombak Batu 19, Bandar Tasik Puteri, Kampung Damai, and Sungai Buloh prison. At the International
Islamic University Malaysia, there are ve TB cases among international students; of which four of them
were male, and six were smokers. On the other hand, 13 foreigners were inmates and prison workers at
the Sungai Buloh prison.
Discussion
Disease mapping is the most common approach in public health surveillance. The development of Portal
TB Gombak would help public health o cers to visualize and assess the geographically-referenced data
in the absence of specialists in spatial statistics and programming. Furthermore, this web allows a
convenient data presentation method to detect disease patterns based on the dots' distribution on the
maps that show disease progression in time and space using the data from 2013 to 2017. Besides, it
promotes targeted prevention and control measures through screening and contract tracing.
Generally, this application aims to increase the understanding of the spatial epidemiology of TB among
public healthcare workers. The current study provided a detailed investigation of TB cases based on
hotspot analysis from earlier literature [32]. Furthermore, this study reported high kernel densitie of TB
cases in different localities, including G1 (Bandar Country Homes, Rawang mukim), G2 (Selayang,
Rawang mukim) and G3 (Kepong, Batu mukim), G4 (Desa Tun Razak, Batu and Setapak mukims), G5
Page 10/21(Taman Melawati, Hulu Kelang mukim), and G6 (Setiawangsa, Hulu Kelang mukim). Moreover, the
previous study (Mohidem et al., 2021) found that hotspot clusters with 99% con dence interval were
detected in Bandar Tasik Puteri, Desa Puteri, Sungai Buloh Prison, Sungai Pelong, and Tiara Puteri, 95%,
con dence interval was seen in con dence interval were detected in Bandar Baru Kundang, Kampung
Melayu Seri Kundang, Kampung Permata, Kampung Setia Kuang, Taman Tasik Biru, Kampung Gombak,
Kampung Baru Cina Kuang, Bukit Ladon, and Taman Sri Putra Mas, and 90% con dence interval was
found in Kundang Jaya. In addition, one area of the hotspot clusters was the same as one of the
localities (G1) for high kernel densities risk where the Sungai Buloh prison was located. Therefore,
assessment of hotspot areas by experts could identify potential source of transmission of the disease,
such as inmates at the Sungai Buloh prison. Using Portal TB Gombak, the user can conduct a preliminary
screening of TB cases in the potential risk areas based on the localities of hotspot clusters. The user can
then zoom in to the ESRI Map and conduct surveillance at the targeted areas promptly.
On top of that, Portal TB Gombak's exible nature was designed for convenient updates in the future, thus
offering the opportunity for further web development. In this study, an unlimited number of categorical
variables of a data set can be plotted on the map. However, an adaptation to plotting TB cases according
to speci c data sets could be useful by adding more features or functions. For example, users may want
to change from categorical variables into continuous variables such as real age and total household
income of TB patients, as well as the environmental variables such as air quality index (AQI) and
concentration of pollutants including carbon monoxide (CO), nitrogen dioxide (NO2), sulfur dioxide (SO2),
and (PM10), rainfall, relative humidity, temperature, wind speed, and atmospheric pressure.
Additionally, users may want to customize the dots' color to represent years of TB cases from 2018
onwards or change the data set in the input table. Furthermore, a smaller temporal unit such as daily or
weekly can also be implemented. Moreover, the user can extend this application by including other
features or functions such as enabling marker dragging, adding area data with polygons, overlaying
images, or using alternative base map tiles (imagery with labels, topographic, bing map road, bing map
aerial, and bing map hybrid). These features will enhance the application to be useful for public health
researchers that intend to analyze the geostatistical or point process data.
Another advantage of this application is its web browser interface, which provides intuitive features of the
base map (ESRI map) similar to those found on the internet such as Google Earth and Google Map that
are familiar to users. It will allow the acquisition of spatial data by healthcare o cers to investigate
epidemiological disease without GIS skills and knowledge. On top of that, this application is an
independent platform that does not require installing GIS software, thus signi cantly reducing the server
development cost and time. The users only require a web browser to access the entire functionality of this
app. A future extension to the TB mapping is to add a mobile version of the currently available
application for computers and laptops. The mobile app will enable public health o cers to make live
updates in the database on-site during surveillance.
Page 11/21Furthermore, the server's effective architecture can manage the user requests and respond quickly to
organize the design ow of the application in plotting TB cases and their demographic characteristics
within the same software environment without having to transfer data between different types of
software packages. Moreover, the advantage of using CodeIgniter Framework is the large user-base and
online community that can assist in many circumstances. For instance, this kind of support could be
advantageous during an outbreak and epidemic, where data can be updated regularly with convenience.
Although this study focused on TB data, this application can be extended to any geocoded health data in
other areas. For example, dengue cases with a suspected waterborne origin can display polluted water
outlets that enhanced the breeding of Aedes aegypti mosquitoes. The public health o cers may plot the
reported dengue cases and identify the mosquitoes' breeding sites, with the association of rainfall,
relative humidity, and temperature variation as the risk factors that favor the transmission of the disease.
Another potential usage for this app is for foodborne disease, including gastrointestinal disease,
identi ed from customers’ complaints against food premises (restaurant, retail food service, fast food,
hospital, bistro or caterer), in which some of them may suffer from diarrhea or even the local people who
reported unsafe practices in certain premises. This app will enable public health o cers to plot the
reported cases and investigate the legitimacy of the complaints and ensure adherence to food safety
policies and procedures by the food premises, including cleaning and sanitizing, pest control garbage,
and waste disposal. Furthermore, this app is useful for investigating sexually transmitted diseases, in
which the public health o cers can plot the location of reported HIV cases and lter sociodemographic
characteristics of the patients, such as lifestyle and behavior.
Nevertheless, there are several limitations to this web-based mapping application. Firstly, although the
application is a user-friendly tool, it is not supported and needs a technical expert to install and debug if
necessary. Moreover, this application is written in HTML, and extensive experience with ArcGIS JavaScript
API 3.7 is essential for the initial set up. Furthermore, it is important to realize the limitation of disease
mapping as an approach for epidemiological disease investigations. Secondly, the mapping does not
account for the overall TB cases because the data input must include patients' addresses to plot the
cases according to latitude and longitude values. Therefore, the user must remove incomplete addresses
and homeless people before uploading the data into the server, hence preventing the intervention for a
speci c risk population. Thirdly, while the application is useful in the early steps to visualize the
distribution of TB cases, it cannot conduct spatial statistics such as kernel density, hotspot, and ordinary
least squares that are available in GIS. Thus, this application is not a replacement for formal software for
the statistical analysis of spatial data.
Conclusion
This study developed the Portal TB Gombak, an interactive web application to visualize the spatial
distribution of TB cases. The application has a user-friendly interface and allows public health o cers to
perform surveillance without using GIS and programming skills. Speci cally, it provides a convenient and
rapid mapping of TB cases and their sociodemographic characteristics. Furthermore, Portal TB Gombak
Page 12/21is implemented in the PHP CodeIgniter package by the Jet brain to aid ArcGIS JavaScript API 3.7. Most
importantly, a better understanding of TB distribution using this application could enhance public health
interest by facilitating targeted control measures through screening and contract tracing before treating
and diagnosing the patients.
Abbreviations
API: Application Programming Interface; ArcGIS: Aeronautical Reconnaissance Coverage Geographic
Information System; CSS: Cascading Style Sheet; ESRI: Environmental Systems Research Institute;
HTML: HyperText Markup Language; PHP: Python Shape le; QGIS: Quantum Geographical Information
System; SQL: Structured Query Language; TB: Tuberculosis; WHO: World Health Organization.
Declarations
Ethics approval
The use of secondary data in this study was approved by the Ministry of Health Malaysia, Medical
Research and Ethics Committee.
Availability of data and materials
Demographic data were extracted from the MyTB database; full access to which requires government
authorization (http://mytb.moh.gov.my/). The original dataset is available from the corresponding author
upon request.
Competing interests
The authors declare no con ict of interest.
Funding
This research received no external funding.
Author’s contributions
Conceptualization, N.A.M. and M.O.; methodology, N.A.M. and M.O; validation, M.O.; formal analysis,
N.A.M.; investigation, N.A.M; resources, Z.H.; data curation, N.A.M.; writing—original draft preparation,
N.A.M.; writing—revise and editing, N.A.M., M.O., F.M.M., S.M.E, R.S. and Z.H.; supervision, M.O., F.M.M.,
S.M.E, R.S. and Z.H; funding acquisition, Z.H. All authors have read and agreed to the published version
of the manuscript.
Acknowledgement
Page 13/21We would like to thank Leow Kang Ren for providing feedback for useful discussion during the
development of Portal TB Gombak.
References
1. World Health Organization. In: Global tuberculosis report 2017. Geneva: WHO. Available at:
https://apps.who.int/iris/bitstream/handle/10665/329368/9789241565714-eng.pdf?ua=1.
2. Ministry of Health Malaysia: Annual Report 2000–2005. Disease Control Division. Malaysia: Ministry
of Health; 2019.
3. Kang W, Du J, Yang S, Yu J, Chen H, Liu J, Zong P, et al. The prevalence and risks of major
comorbidities among inpatients with pulmonary tuberculosis in China from a gender and age
perspective: a large-scale multicenter observational study. Eur J Clin Microbiol Infect Dis 2020;1-14.
4. Ben JM, Ben AH, Koubaa M, Hammami F, Damak J, Ben JM. Is there gender inequality in the
epidemiological pro le of tuberculosis?. Tunis Med 2020;98(3):232.
5. Barroso EG. Factors associated with household contacts’ tuberculosis testing and evaluation. Public
Health Nurs 2020;37(5):705-714.
6. Taherian A, Akhlaghi M, Sadat Hosseiniun Z, Shahrestanaki E, Tiyuri A, Sahebkar M. Investigating the
effect of education on knowledge and practice in preventing tuberculosis in eastern Iran. Int J Health
Promot Educ 2020;58(2):83-91.
7. Sweeney S, Vassall A, Guinness L, Siapka M, Chimbindi N, Mudzengi D, Gomez GB. Examining
Approaches to Estimate the Prevalence of Catastrophic Costs Due to Tuberculosis from Small-Scale
Studies in South Africa. Pharmacoeconomics 2020;38(6):619-631.
8. Horter S, Achar J, Gray N, Parpieva N, Tigay Z, Singh J, Stringer B. Patient and health-care worker
perspectives on the short-course regimen for treatment of drug-resistant tuberculosis in
Karakalpakstan, Uzbekistan. Plos One 2020;15(11):e0242359.
9. Kwak N, Winters N, Campbell JR, Chan ED, Gegia M, Lange C, Yim JJ, et al. Changes in treatment for
multidrug-resistant tuberculosis according to national income. Eur Respir J 2020;56(5).
10. Singh H, Ramamohan V. A model-based investigation into urban-rural disparities in tuberculosis
treatment outcomes under the Revised National Tuberculosis Control Programme in India. Plos One
2020;15(2):e0228712.
11. Cheng J, Sun YN, Zhang CY, Yu YL, Tang LH, Peng H, Zhao JM, et al. Incidence and risk factors of
tuberculosis among the elderly population in China: a prospective cohort study. Infect Dis Poverty
2020;9(1):13.
12. Hill AN, Cohen T, Salomon JA, Menzies NA. High-resolution estimates of tuberculosis incidence
among non-US-born persons residing in the United States, 2000-2016. Epidemics 2020;33:100419.
13. Adegbite BR, Edoa JR, Achimi Agbo P, Dejon-Agobé JC, Essone PN, Lotola-Mougeni F, Zinsou JF, et al.
Epidemiological, Mycobacteriological, and Clinical Characteristics of Smoking Pulmonary
Page 14/21Tuberculosis Patients, in Lambaréné, Gabon: A Cross-Sectional Study. Am J Trop Med Hyg
2020;103(6):2501-2505.
14. Cho J, You SC, Lee S, Park, D, Park B, Hripcsak G, Park RW. Application of Epidemiological
Geographic Information System: An Open-Source Spatial Analysis Tool Based on the OMOP
Common Data Model. Int J Environ Res Public Health 2020;17(21):7824.
15. Cai J, Xie Y, Deng M, Tang X, Li Y, Shekhar S. Signi cant spatial co-distribution pattern discovery.
Comput Environ Urban Syst 2020;84:101543.
16. Ferraro OE, Guido D, Zambianchi R, Lanfranchi S, Oddone E, Villani S. Mortality for neurological
diseases and pesticides: etiological hypotheses by a spatial analysis in the province of Pavia. La
Medicina del Lavoro 2018;109(6):420-434.
17. Takahashi K, Shimadzu H. Detecting multiple spatial disease clusters: information criterion and scan
statistic approach. Int J Health Geogr 2020;19(1):1-11.
18. Scarpone C, Brinkmann ST, Große T, Sonnenwald D, Fuchs M, Walker BB. A multimethod approach
for county-scale geospatial analysis of emerging infectious diseases: a cross-sectional case study of
COVID-19 incidence in Germany. Int J Health Geogr 2020;19(1):1-17.
19. Carrasco-Escobar G, Schwalb A, Tello-Lizarraga K, Vega-Guerovich P, Ugarte-Gil C. Spatio-temporal
co-occurrence of hotspots of tuberculosis, poverty and air pollution in Lima, Peru. Infect Dis Poverty
2020;9:1-6.
20. Oshan TM, Smith JP, Fotheringham AS. Targeting the spatial context of obesity determinants via
multiscale geographically weighted regression. Int J Health Geogr 2020;19, 1-17.
21. Schultz SD, MacArthur R. Geographic Information Systems and Rural Data. Rural Data, People, and
Policy: Information Systems for the 21st Century, Routledge 2019;189-204.
22. European Centre for Disease Prevention and Control. ECEC Map Maker (EMMa). 2015
23. Smith CM, Hayward AC. DotMapper: an open source tool for creating interactive disease point maps.
BMC Infect Dis 2016;16(1):1-6.
24. Moraga P. SpatialEpiApp: A Shiny web application for the analysis of spatial and spatio-temporal
disease data. Spat Spatiotemporal Epidemiol 2017;23:47-57.
25. Census, 2018. Population distribution by local authority areas and mukims. Department of Statistics
Malaysia, 2001. Available at https://www.selangor.gov.my.
26. Malaysian Meteorological Department: General Climate of Malaysia. Ministry of Science, Technology
and Innovation, Kuala Lumpur. 2018. Available at http://www. met.gov.my/
27. Nur HA, Choy L. Analysis of land use and land cover changes in Gombak, Selangor using remote
sensing data. Sains Malays 2016;45(12):1869-1877.
28. O cial Portal of Gombak Land and District O ce. 2020. Available at
https://www2.selangor.gov.my/
29. Ministry of Health of Malaysia. Annual report 2018: TB control programme in Malaysia. Kuala
Lumpur. 2019.
Page 15/2130. ESRI. ArcGIS Desktop. 102nd ed. Redlands, CA: Environmental Systems Research Institute; 2013.
31. Hamzah IS, Sari n MR, Aziz MSA, Abdullah MFA. Malaysia as attraction of international foreign
workers. J Crit Rev 2020;7(8):2020.
32. Mohidem NA, Hashim Z, Osman M, Shaharudin R, Muharam FM, Makeswaran. Demographic, socio-
economic and behavior as risk factors of tuberculosis in Malaysia: a systematic review of the
literature. Rev Environ Health 2018;33(4):407-421
Table
Page 16/21Table 1.
Data preparation for TB cases in Gombak district between 2013 and 2017
Column Information
Patients ID Unique identi er for each patient case
X-coordinate Longitude of the address of patients
Y-coordinate Latitude of the address of patients
Mukim Batu = 1, Hulu Kelang = 2, Rawang = 3, and Setapak = 4,
Month of January = 1, February = 2, March = 3, April = 4, Mei = 5, June = 6, July = 7, August = 8,
diagnosis September = 9, October, November = 11, and December = 12
Year of 2013, 2014, 2015, 2016, 2017
diagnosis
Age Less than 15 years old = 1, Between 15 to 64 years old = 2, More than 64 years old =
3
Gender Male = 1, Female = 2
Race Malay = 1, Chinese = 2, Indian = 3, and Others = 4
Nationality Malaysian = 1, Non-Malaysian = 2
Country of Malaysia = 1, Indonesia = 2, Myanmar = 3, Bangladesh = 4, Others = 5
birth
Educational Secondary school and below = 1, Higher than secondary school = 2
level
Employment Employed =1, Unemployed = 2
status
Healthcare Healthcare worker = 1, and Non-healthcare worker = 2
worker
status
Income Permanent income =1, Not permanent income = 2
status
Residency Urban = 1, Rural = 2
Smoking Smoking = 1, Not smoking = 2
status
Figures
Page 17/21Figure 1
Geographical location of Gombak in the states of Selangor and mukims of Gombak. Note: The
designations employed and the presentation of the material on this map do not imply the expression of
any opinion whatsoever on the part of Research Square concerning the legal status of any country,
territory, city or area or of its authorities, or concerning the delimitation of its frontiers or boundaries. This
map has been provided by the authors.
Page 18/21Figure 3
The ow of Portal TB Gombak
Page 19/21Figure 4
Dashboard of the user interface that consists of four tabs (Home, GIS Application, Download, and
Contact), ‘Username’ and ‘Password’ column of Portal TB Gombak
Figure 6
Page 20/21‘Map List’ column that includes ‘Search’ column and ‘Data’, ‘Map’, ‘Download,’ and Remove’ buttons of
Portal TB Gombak
Page 21/21You can also read