Predicting Depressive Symptom Severity Through Individuals' Nearby Bluetooth Device Count Data Collected by Mobile Phones: Preliminary ...
←
→
Page content transcription
If your browser does not render page correctly, please read the page content below
JMIR MHEALTH AND UHEALTH                                                                                                                        Zhang et al

     Original Paper

     Predicting Depressive Symptom Severity Through Individuals’
     Nearby Bluetooth Device Count Data Collected by Mobile Phones:
     Preliminary Longitudinal Study

     Yuezhou Zhang1, MSc; Amos A Folarin1,2,3,4,5, PhD; Shaoxiong Sun1, PhD; Nicholas Cummins1, PhD; Yatharth
     Ranjan1, MSc; Zulqarnain Rashid1, PhD; Pauline Conde1, BSc; Callum Stewart1, MSc; Petroula Laiou1, PhD; Faith
     Matcham6, PhD; Carolin Oetzmann6, MSc; Femke Lamers7, PhD; Sara Siddi8,9,10, PhD; Sara Simblett11, PhD; Aki
     Rintala12,13, MSc; David C Mohr14, PhD; Inez Myin-Germeys12, PhD; Til Wykes3,11, PhD; Josep Maria Haro8,9,10, MD;
     Brenda W J H Penninx7, PhD; Vaibhav A Narayan15, PhD; Peter Annas16, PhD; Matthew Hotopf3,6, PhD; Richard J
     B Dobson1,2,3,4,5, PhD; RADAR-CNS Consortium
     1
      Department of Biostatistics & Health Informatics, Institute of Psychiatry, Psychology and Neuroscience, King's College London, London, United
     Kingdom
     2
      Institute of Health Informatics, University College London, London, United Kingdom
     3
      NIHR Biomedical Research Centre at South London and Maudsley NHS Foundation Trust and King’s College London, London, United Kingdom
     4
      Health Data Research UK London, University College London, London, United Kingdom
     5
      NIHR Biomedical Research Centre at University College London Hospitals NHS Foundation Trust, London, United Kingdom
     6
      Department of Psychological Medicine, Institute of Psychiatry, Psychology and Neuroscience, King's College London, London, United Kingdom
     7
      Department of Psychiatry, Amsterdam Public Health Research Institute and Amsterdam Neuroscience, Amsterdam University Medical Centre, Vrije
     Universiteit and GGZ InGeest, Amsterdam, Netherlands
     8
      Teaching Research and Innovation Unit, Parc Sanitari Sant Joan de Déu, Fundació Sant Joan de Déu, Barcelona, Spain
     9
      Centro de Investigación Biomédica en Red de Salud Mental, Madrid, Spain
     10
          Faculty of Medicine and Health Sciences, Universitat de Barcelona, Barcelona, Spain
     11
          Department of Psychology, Institute of Psychiatry, Psychology and Neuroscience, King's College London, London, United Kingdom
     12
          Center for Contextual Psychiatry, Department of Neurosciences, Katholieke Universiteit Leuven, Leuven, Belgium
     13
          Faculty of Social Services and Health Care, LAB University of Applied Sciences, Lahti, Finland
     14
          Center for Behavioral Intervention Technologies, Department of Preventive Medicine, Northwestern University, Evanston, IL, United States
     15
          Janssen Research and Development LLC, Titusville, NJ, United States
     16
          H Lundbeck A/S, Copenhagen, Denmark

     Corresponding Author:
     Richard J B Dobson, PhD
     Department of Biostatistics & Health Informatics
     Institute of Psychiatry, Psychology and Neuroscience
     King's College London
     SGDP Centre, IoPPN, Box PO 80
     De Crespigny Park, Denmark Hill
     London, SE5 8AF
     United Kingdom
     Phone: 44 20 7848 0473
     Email: richard.j.dobson@kcl.ac.uk

     Abstract
     Background: Research in mental health has found associations between depression and individuals’ behaviors and statuses,
     such as social connections and interactions, working status, mobility, and social isolation and loneliness. These behaviors and
     statuses can be approximated by the nearby Bluetooth device count (NBDC) detected by Bluetooth sensors in mobile phones.
     Objective: This study aimed to explore the value of the NBDC data in predicting depressive symptom severity as measured via
     the 8-item Patient Health Questionnaire (PHQ-8).

     https://mhealth.jmir.org/2021/7/e29840                                                                JMIR Mhealth Uhealth 2021 | vol. 9 | iss. 7 | e29840 | p. 1
                                                                                                                         (page number not for citation purposes)
XSL• FO
RenderX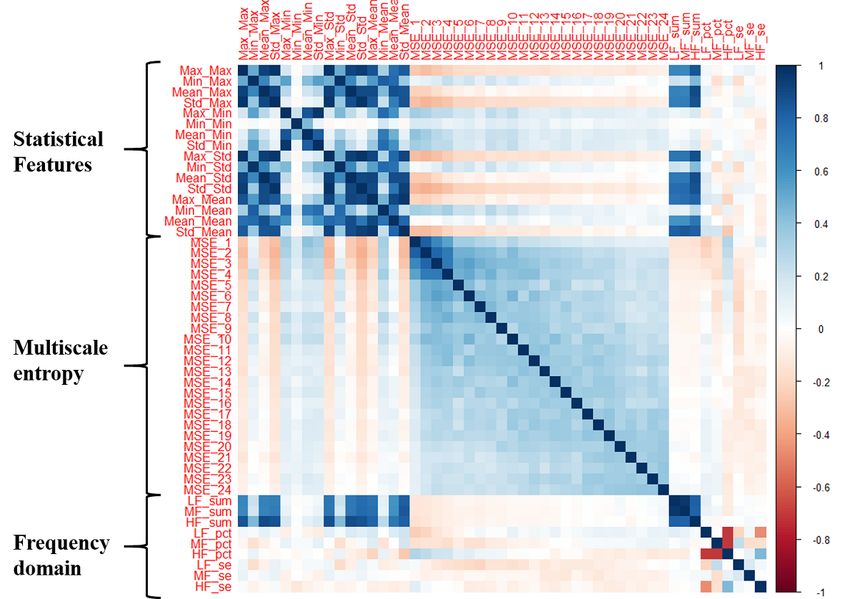
JMIR MHEALTH AND UHEALTH                                                                                                               Zhang et al

     Methods: The data used in this paper included 2886 biweekly PHQ-8 records collected from 316 participants recruited from
     three study sites in the Netherlands, Spain, and the United Kingdom as part of the EU Remote Assessment of Disease and
     Relapse-Central Nervous System (RADAR-CNS) study. From the NBDC data 2 weeks prior to each PHQ-8 score, we extracted
     49 Bluetooth features, including statistical features and nonlinear features for measuring the periodicity and regularity of individuals’
     life rhythms. Linear mixed-effect models were used to explore associations between Bluetooth features and the PHQ-8 score.
     We then applied hierarchical Bayesian linear regression models to predict the PHQ-8 score from the extracted Bluetooth features.
     Results: A number of significant associations were found between Bluetooth features and depressive symptom severity. Generally
     speaking, along with depressive symptom worsening, one or more of the following changes were found in the preceding 2 weeks
     of the NBDC data: (1) the amount decreased, (2) the variance decreased, (3) the periodicity (especially the circadian rhythm)
     decreased, and (4) the NBDC sequence became more irregular. Compared with commonly used machine learning models, the
     proposed hierarchical Bayesian linear regression model achieved the best prediction metrics (R2=0.526) and a root mean squared
     error (RMSE) of 3.891. Bluetooth features can explain an extra 18.8% of the variance in the PHQ-8 score relative to the baseline
     model without Bluetooth features (R2=0.338, RMSE=4.547).
     Conclusions: Our statistical results indicate that the NBDC data have the potential to reflect changes in individuals’ behaviors
     and statuses concurrent with the changes in the depressive state. The prediction results demonstrate that the NBDC data have a
     significant value in predicting depressive symptom severity. These findings may have utility for the mental health monitoring
     practice in real-world settings.

     (JMIR Mhealth Uhealth 2021;9(7):e29840) doi: 10.2196/29840

     KEYWORDS
     mental health; depression; digital biomarkers; digital phenotyping; digital health; Bluetooth; hierarchical Bayesian model; mobile
     health; mHealth; monitoring

                                                                           found a negative association (r=−0.362, P=.03) between the
     Introduction                                                          NBDC and self-reported depressive symptoms on the
     Existing studies have demonstrated that depression is                 StudentLife data set, which contained mobile phone data from
     significantly associated with individuals’ behaviors and statuses,    48 students across a 10-week term at Dartmouth College [15].
     such as social connections and interactions, working status,          Boonstra et al illustrated the feasibility of collecting nearby
     mobility, and social isolation and loneliness [1-4]. For example,     Bluetooth device information for the depression recognition
     individuals reporting fewer social network connections or less        task, but they did not provide further findings [5].
     social support tend to have higher depressive symptomatology          Several recent studies have investigated the relationships
     [1]. As the depressive mood and medical comorbidity can make          between Bluetooth proximity data and mental health [16-18].
     people unable to work, the unemployment rate in depression is         Moturu et al found that individuals with lower sociability
     high [2]. Reduced mobility and physical activity are associated       (estimated by the NBDC) tend to report lower mood more often
     with depressive symptoms [3]. Loneliness is a specific risk           [16]. Bogomolov et al established machine learning models to
     factor for depression, and a significant proportion of suicides       recognize happiness and stress with features of Bluetooth
     have a history of social isolation [1,4]. Although these findings     records, calls, and text messages, which obtained accuracy rates
     have been replicated in different populations, these studies relied   of 80.81% and 72.28%, respectively [17,18]. The above three
     on participant self-report, which is susceptible to recall bias and   studies were all performed on the “Friends and Family” data
     typically does not capture dynamic information [5].                   set, including 8 weeks of mobile phone data from 117
     Mobile phone technology provides an unobtrusive, continuous,          participants living in a major US university’s married graduate
     and cost-efficient means to capture individuals’ daily behaviors      student residency.
     and statuses using a number of embedded sensors, such as              Previous studies [15-18] have been performed on relatively
     accelerometers, GPS sensors, and Bluetooth sensors [6]. The           small (approximately 100 participants) homogeneous (eg,
     embedded Bluetooth sensor can be used to record individuals’          university students) cohorts of participants over relatively short
     local proximity information, such as the nearby Bluetooth device      periods (8-10 weeks), which may limit their generalizability.
     count (NBDC) that includes the Bluetooth signal of other phone        Besides, Bluetooth features used in these studies [15-18] have
     users [7]. The continuously recorded NBDC data represents a           been limited to basic statistical features (eg, sum, mean, and
     mixed signal that has been used to estimate individuals’              standard deviation), which are unable to characterize some
     behaviors and statuses, including face-to-face social interactions    nonlinear aspects (such as complexity, regularity, and
     [8-10], working status [11], mobility [12], and isolation and         periodicity) of the Bluetooth data. These nonlinear
     loneliness [13,14]. Therefore, the NBDC data have the potential       characteristics can reflect individuals’ life rhythms, such as
     to reflect changes in people’s behaviors and statuses during the      circadian and social rhythms, which are affected by depressive
     depressive state.                                                     symptoms [19]. Therefore, the associations between the NBDC
     There have been a few studies exploring the relationship              data and depression are yet to be fully explored.
     between the NBDC data and depression directly. Wang et al

     https://mhealth.jmir.org/2021/7/e29840                                                       JMIR Mhealth Uhealth 2021 | vol. 9 | iss. 7 | e29840 | p. 2
                                                                                                                (page number not for citation purposes)
XSL• FO
RenderX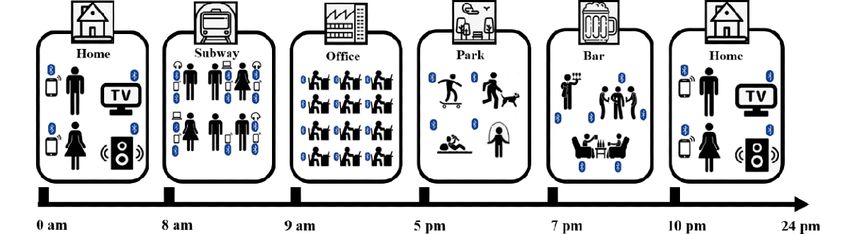
JMIR MHEALTH AND UHEALTH                                                                                                              Zhang et al

     In this paper, we aimed to explore the value of the NBDC data        pandemic and related lockdown policies greatly impacted the
     in predicting self-reported depressive symptom severity in a         behaviors (particularly mobility, social interactions, and working
     relatively large cohort of individuals with a history of recurrent   environment [working from home]) of European people [25].
     major depressive disorder. Our first objective was to explore        To exclude the impact of the COVID-19 pandemic, we
     the associations between statistical Bluetooth features and          performed a preliminary analysis with the data before February
     depressive symptom severity. Our second objective was to             2020.
     extract nonlinear features for quantifying complexity, regularity,
     and periodicity from the NBDC data and test their associations
                                                                          PHQ-8 Data
     with depression. The third objective was to leverage appropriate     The variability of each participant’s depressive symptom
     machine learning models to predict the severity of depressive        severity was measured via the PHQ-8, conducted by mobile
     symptoms using extracted Bluetooth features.                         phones every 2 weeks. The PHQ-8 score ranges from 0 to 24
                                                                          (increasing severity) [24]. According to the PHQ-8 score, the
     Methods                                                              severity of depression can usually be divided into the following
                                                                          five levels: asymptomatic (PHQ-8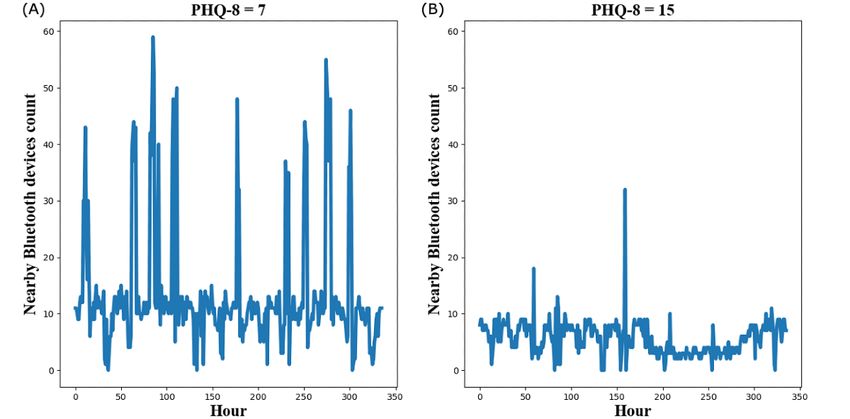
JMIR MHEALTH AND UHEALTH                                                                                                                       Zhang et al

     Figure 1. A schematic diagram showing an individual’s nearby Bluetooth devices count (NBDC) in different scenarios in daily activities and life.

     Figure 2. An example of two 14-day nearby Bluetooth devices count (NBDC) sequences from the same participant at the mild depression level (A)
     and moderately severe level (B). PHQ-8: 8-item Patient Health Questionnaire.

                                                                                     89.62% of days have 50% (12 hours) or more of the NBDC
     Demographics                                                                    data. We considered one day as a “valid day” if it contained
     Participants’ demographics were recorded during the enrollment                  at least 12 hours of the NBDC data. Then, we empirically
     session. According to previous studies [27,28], baseline age,                   selected PHQ-8 intervals with at least 10 valid days as valid
     gender, and education level were considered as covariates in                    PHQ-8 intervals to retain the majority (81.78%) of PHQ-8
     our analyses. Due to the different educational systems in the                   intervals.
     three countries in our data set, we used the number of years in
     education to represent education level.                                    For the NBDC sequence in each selected PHQ-8 interval, we
                                                                                used linear interpolation to impute the missing hours in all valid
     Data Inclusion Criteria and Data Preprocessing                             days and discarded the NBDC data that did not belong to a valid
     For each PHQ-8 record, we considered a “PHQ-8 interval” of                 day. The “NBDC sequence” in the rest of this paper refers to
     14 days before the day when the participant fills in the PHQ-8             the preprocessed NBDC data in the 14-day PHQ-8 interval.
     questionnaire, as the PHQ-8 score is used to represent the                 Feature Extraction
     depressive symptom severity of the participant for the past 2
     weeks. To reduce the impact of the COVID-19 pandemic and                   According to past Bluetooth-related research [15-18] and
     missing data on our analysis, we specified the following two               research on nonlinear features of signal processing [31,32], we
     data inclusion criteria:                                                   extracted 49 Bluetooth features from the NBDC sequence in
                                                                                the PHQ-8 interval in the following three categories:
     1.   As mentioned in the data set section, to exclude the impact           second-order statistics, multiscale entropy (MSE), and frequency
          of the COVID-19 pandemic, we restricted our analysis to               domain (FD). Table 1 summarizes all Bluetooth features
          PHQ-8 records prior to February 2020.                                 extracted in this paper.
     2.   Saeb et al [29] and Farhan et al [30] used 50% as each day’s
          completeness threshold for passive data. In our data set,

     https://mhealth.jmir.org/2021/7/e29840                                                               JMIR Mhealth Uhealth 2021 | vol. 9 | iss. 7 | e29840 | p. 4
                                                                                                                        (page number not for citation purposes)
XSL• FO
RenderX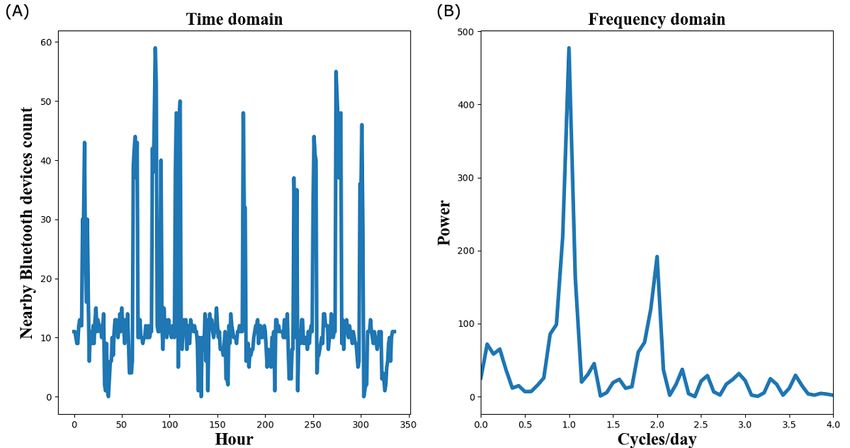
JMIR MHEALTH AND UHEALTH                                                                                                                           Zhang et al

     Table 1. Summary of 49 Bluetooth features used in this paper and their short descriptions.
         Category               Abbreviation                                  Description                                                           Number of
                                                                                                                                                    features
                                                                                                                                                    (N=49)
         Statistical features   [Second-order feature]_[Daily feature], eg,   Second-order features (max, min, mean, and standard deviation) 16
                                Max_Mean                                      calculated in the PHQ-8a interval based on daily statistical
                                                                              Bluetooth features (max, min, mean, and standard deviation).
         Multiscale entropy MSE_1, MSE_2, …, MSE_24                           Multiscale entropy of the NBDCb sequences from scale 1 to             24
         (MSE)                                                                scale 24.
         Frequency do-          LF_sum, MF_sum, HF_sum                        The sums of spectrum power in LF, MF, and HF.                         3
              c
         main
         Frequency domain LF_pct, MF_pct, HF_pct                              The percentages of spectrum power in LF, MF, and HF to the            3
                                                                              total spectrum power.
         Frequency domain LF_se, MF_se, HF_se                                 Spectral entropy in LF, MF, and HF.                                   3

     a
         PHQ-8: 8-item Patient Health Questionnaire.
     b
         NBDC: nearby Bluetooth device count.
     c
         LF: low frequency (0-0.75 cycles/day); MF: middle frequency (0.75-1.25 cycles/day); HF: high frequency (>1.25 cycles/day).

                                                                                    variability analysis [33], electroencephalogram analysis [34],
     Second-Order Statistical Features                                              and gait dynamics analysis [35]. Compared with other entropy
     We first calculated four daily features (max, min, mean, and                   techniques (eg, sample entropy and approximate entropy), the
     standard deviation) of daily NBDC data from all valid days in                  advantage of MSE analysis is that the assessments of complexity
     the PHQ-8 interval. For each daily feature, we calculated four                 at shorter and longer timescales can be analyzed separately [36].
     second-order features (max, min, mean, and standard deviation)                 The MSE at short timescales reflects the complexity of the
     to reflect the amount and variance of the NBDC in the PHQ-8                    sequence. The larger the MSE at short timescales, the more
     interval. These features were denoted in the following format:                 chaotic and irregular the signal. The MSE at relatively long
     [Second-order feature]_[Daily feature]. For example, the average               timescales assesses fluctuations occurring at a certain period,
     value of the daily maximum number of the NBDC in the PHQ-8                     reflecting the periodicity of the signal.
     interval was denoted as Mean_Max. A total of 16 second-order
     statistical features were extracted.                                           To explore the complexity and periodicity of the NBDC
                                                                                    sequence on different timescales (from 1 hour to 24 hours), we
     Nonlinear Bluetooth Features                                                   calculated MSE features of the NBDC sequences from scale 1
     The second-order statistical features can only reflect the amount              to scale 24, denoted as MSE_1, MSE_2, …, MSE_24. Figure 3
     (max, min, and mean) and variance (standard deviation) of the                  shows an example of MSE features calculated on two NBDC
     NBDC data. To exploit more information embedded in the                         sequences at different depression severity levels from the same
     NBDC data, we proposed MSE and FD features to measure the                      participant shown in Figure 2. In this example, the NBDC
     nonlinear characteristics, such as regularity, complexity, and                 sequence at the mild depression level (PHQ-8=7) has lower
     periodicity, of the NBDC sequence.                                             MSE at relatively short timescales (scale 1-3) and higher MSE
                                                                                    at relatively long timescales than the sequence at the moderately
     Multiscale Entropy Features                                                    severe depression level (PHQ-8=15). This indicated that this
     MSE analysis has been used to provide insights into the                        participant’s NBDC sequence at the mild depression level was
     complexity and periodicity of signals over a range of timescales               more regular and periodic than the NBDC sequence at the
     since the method was proposed by Costa et at [31]. It has been                 moderately severe depression level.
     widely used in the field of signal analysis, such as heart rate

     https://mhealth.jmir.org/2021/7/e29840                                                                  JMIR Mhealth Uhealth 2021 | vol. 9 | iss. 7 | e29840 | p. 5
                                                                                                                           (page number not for citation purposes)
XSL• FO
RenderX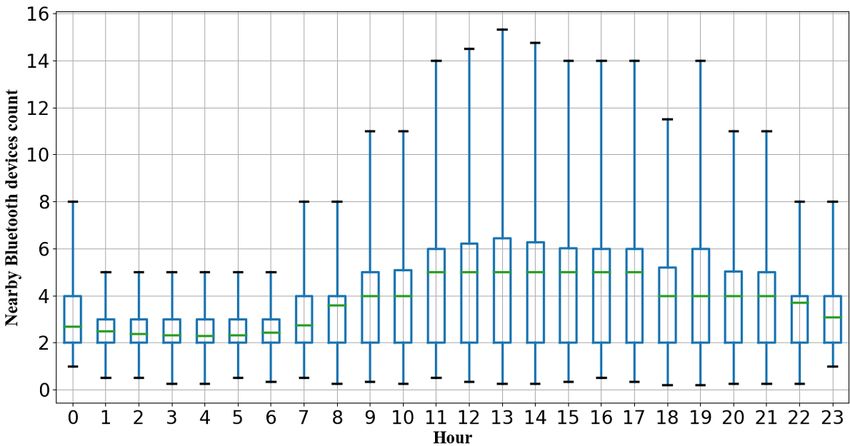
JMIR MHEALTH AND UHEALTH                                                                                                                     Zhang et al

     Figure 3. An example of multiscale entropy (scale 1-24) of two 14-day nearby Bluetooth device count (NBDC) sequences at the mild depression level
     (blue) and the moderately severe level (orange) from the same participant as in Figure 2. PHQ-8: 8-item Patient Health Questionnaire.

                                                                               [19]. To explore the periodic rhythms of different period lengths,
     FD Features
                                                                               we empirically defined the following three frequency intervals:
     FD analysis has been widely used in the signal processing field,          low frequency (LF) (0-0.75 cycles/day), middle frequency (MF)
     especially for signals with periodic characteristics [32]. People’s       (0.75-1.25 cycles/day), and high frequency (HF) (>1.25
     behaviors follow a quasiperiodic routine, such as sleeping at             cycles/day). The power in MF represents the circadian rhythm.
     night, working on weekdays, and gathering with friends on                 Similarly, the power in LF represents the long-term (>1 day)
     weekends [19,37]. We therefore leveraged FD analysis to                   rhythm, while the power in HF represents the short-term (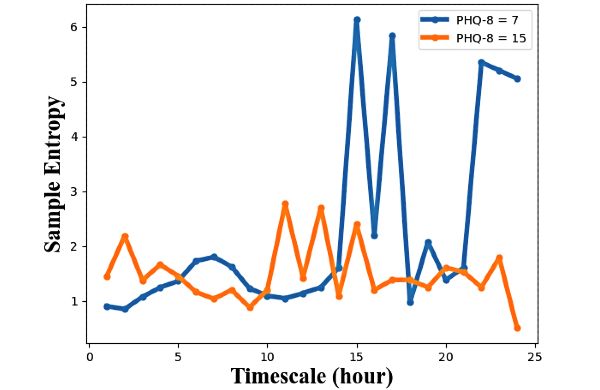
JMIR MHEALTH AND UHEALTH                                                                                                                   Zhang et al

     Figure 4. An example of a 14-day nearby Bluetooth devices count (NBDC) sequence in the time domain (A) and its spectrum in the frequency domain
     (B).

                                                                              and 16 second-order statistical features. The predictors of model
     Statistical Methods                                                      C were demographics and all 49 Bluetooth features. The
     The linear mixed-effect model contains both fixed and random             likelihood ratio tests were performed to test whether these
     effects, allowing for both within-participant and                        Bluetooth features have a significant value in fitting the PHQ-8
     between-participants variations over repeated measurements               score regression model.
     [39]. Therefore, we used linear mixed-effect models in our
     statistical analyses.                                                    Prediction Models
                                                                              Another objective of this paper was to examine whether it is
     Pairwise Association Analyses                                            possible to predict participants’ depressive symptom severity
     To explore the association between each Bluetooth feature and            using Bluetooth features combined with some known
     depression severity, a series of pairwise linear mixed-effect            information (demographics and previous PHQ-8 scores). A
     models with random participant intercepts were performed to              subset of PHQ-8 intervals was selected for the prediction task
     regress the PHQ-8 score with each of the Bluetooth features.             based on the following two additional criteria:
     All mixed-effect models, baseline age, gender, and years in
                                                                              1.   To ensure that each participant had sufficient PHQ-8
     education were considered as covariates. The z-test was used
     to evaluate the statistical significance of the coefficient of each           intervals for the time-series cross-validation (described in
     model. The Benjamini-Hochberg method [40] was used for                        the following model evaluation section), the number of
     correction of multiple comparisons, and the significant level                 valid PHQ-8 intervals for each participant should be at least
     for the adjusted P value was set to .05. All linear mixed-effect              3.
                                                                              2.   To test whether the model can predict variability of
     models were implemented by using the R package “lmerTest,”
     and the Benjamini-Hochberg method was performed by using                      depression severity, the difference of one participant’s
     the command “p.adjust” in R software (R Foundation for                        PHQ-8 scores should be more than or equal to 5 (clinically
     Statistical Computing).                                                       meaningful change) [42].

     Likelihood Ratio Test                                                    Hierarchical Bayesian Linear Regression Model
     One objective of this paper was to assess what value these               The hierarchical Bayesian approach is an intermediate method
     Bluetooth features provide beyond other information that might           compared to the completely pooled model and individualized
     be readily available, such as baseline demographics. The                 model, capturing the whole population’s characteristics while
     likelihood ratio test is a statistical test of goodness of fit between   allowing individual differences [43]. We leveraged the
     two nested models [41]. If the model with more parameters fits           hierarchical Bayesian linear regression model to predict
     the data significantly better, it indicates that additional              participants’ PHQ-8 scores using Bluetooth features,
     parameters provide more information and improve the model’s              demographics (age, gender, and years in education), and the
     fitness [41]. Therefore, we built three nested linear mixed-effect       last observed PHQ-8 score. In this study, we implemented the
     models with random participant intercepts (model A, model B,             hierarchical Bayesian linear regression using the “PyMC3”
     and model C). The predictors of model A were only                        package [44] in Python. To compare the results with other
     demographics. The predictors of model B were demographics                commonly used machine learning models, we also implemented

     https://mhealth.jmir.org/2021/7/e29840                                                           JMIR Mhealth Uhealth 2021 | vol. 9 | iss. 7 | e29840 | p. 7
                                                                                                                    (page number not for citation purposes)
XSL• FO
RenderX
JMIR MHEALTH AND UHEALTH Zhang et al
the LASSO regression model [45] and XGBoost regression discrimination evaluation. As we used the temporal data, “future
model [46] using the Scikit-learn machine learning library [47] data” should not predict “past data.” Therefore, only the data
in Python. As depressive mood has a strong autocorrelation observed before test data can be included in the training set. We
[48], we considered a baseline hierarchical Bayesian linear applied leave-all-out (LAO) and leave-one-out (LOO)
regression model with the last observed PHQ-8 score and time-series cross-validation [48]. As the number of PHQ-8
demographics as predictors. intervals of each participant in our data was different, we made
some minor modifications to these two schemes (Figure 5).
Model Evaluation
We selected root mean squared error (RMSE) and the predicted
coefficient of determination (R2) as two metrics for model
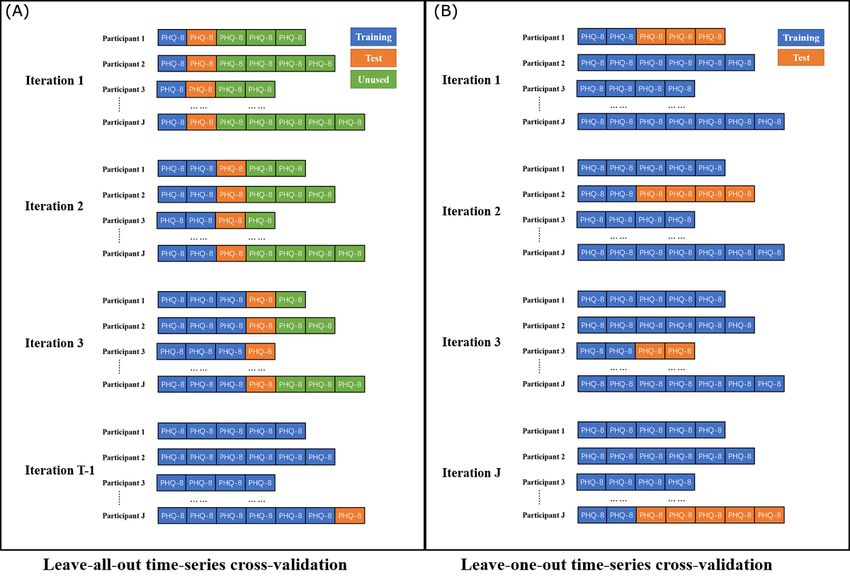
Figure 5. Two schematic diagrams of leave-all-out time-series cross-validation (A) and leave-one-out time-series cross-validation (B), where T is the
maximum number of PHQ-8 intervals of one participant, J is the number of participants, the training set is indicated by blue, the test set is indicated by
orange, and unused data are indicated by green. PHQ-8: 8-item Patient Health Questionnaire.
the rest of the participant’s PHQ-8 intervals. Then, the training
LAO Time-Series Cross-Validation
set was pooled with all data from all other participants. This
Each participant’s data were divided into a sequence of t scheme generated J training and test set pairs, where J is the
consecutive same-sized test sets, where the size of each test set number of participants in our data set.
is the length of one PHQ-8 interval (14 days) and t is the number
of PHQ-8 intervals of this participant. The corresponding Results
training set included all PHQ-8 intervals before each test set.
Then, test sets and training sets were pooled across all Data Summary
participants. This process generated T-1 test and training set According to our date inclusion criteria, from June 2018 to
pairs (no prior data to predict the first PHQ-8 score), where T February 2020, 2886 PHQ-8 intervals from 316 participants
is the maximum number of PHQ-8 intervals of one participant collected from three study sites were selected for our analysis.
in our data set (t≤T). Table 2 shows the descriptive statistics for all 49 Bluetooth
LOO Time-Series Cross-Validation features, and Figure 6 presents pairwise Spearman correlation
Each participant’s data were divided into a training set and a coefficients between all features. Table 3 presents a summary
test set. The training set was constructed using the first two of the demographics and distribution of PHQ-8 records of all
PHQ-8 intervals of a participant, with the test set containing selected participants. Figure 7 presents boxplots of the NBDC
for every hour in the whole population.
https://mhealth.jmir.org/2021/7/e29840 JMIR Mhealth Uhealth 2021 | vol. 9 | iss. 7 | e29840 | p. 8
(page number not for citation purposes)
XSL• FO
RenderXJMIR MHEALTH AND UHEALTH Zhang et al
Table 2. Descriptive statistics for all 49 Bluetooth features.
Featurea Mean SD Min Q1 Median Q3 Max
Second-order statistics
Max_Max 49.79 48.48 1.00 25.00 40.00 60.00 621.00
Min_Max 5.09 6.22 0.00 2.00 4.00 6.00 90.00
Mean_Max 18.56 18.94 0.75 9.23 14.07 21.62 268.29
Std_Max 13.14 14.05 0.00 6.14 10.45 16.22 195.19
Max_Min 1.59 2.08 0.00 0.00 1.00 2.00 43.00
Min_Min 0.06 0.27 0.00 0.00 0.00 0.00 3.00
Mean_Min 0.58 0.88 0.00 0.00 0.21 0.79 13.71
Std_Min 0.50 0.62 0.00 0.00 0.42 0.70 11.94
Max_Std 12.31 12.76 0.34 5.60 9.51 15.39 185.98
Min_Std 1.20 1.45 0.00 0.56 0.87 1.32 21.61
Mean_Std 4.55 4.87 0.16 2.17 3.25 5.24 70.65
Std_Std 3.24 3.71 0.09 1.34 2.43 4.04 62.52
Max_Mean 9.32 9.34 0.17 4.38 6.88 11.04 136.10
Min_Mean 1.88 2.14 0.00 0.50 1.42 2.50 32.00
Mean_Mean 4.42 4.19 0.07 2.19 3.40 5.28 49.55
Std_Mean 2.13 2.59 0.05 0.84 1.45 2.54 49.37
Multiscale entropy (MSE)
MSE_1 0.80 0.46 0.05 0.42 0.71 1.13 2.44
MSE_2 0.97 0.54 0.04 0.56 0.85 1.31 3.58
MSE_3 1.12 0.66 0.09 0.70 1.01 1.42 9.41
MSE_4 1.23 0.69 0.05 0.82 1.15 1.51 8.83
MSE_5 1.35 0.82 0.10 0.93 1.27 1.62 8.51
MSE_6 1.38 0.84 0.08 0.97 1.28 1.63 8.00
MSE_7 1.47 0.97 0.10 1.01 1.33 1.70 7.72
MSE_8 1.50 1.07 0.10 1.00 1.30 1.67 7.40
MSE_9 1.58 1.22 0.10 0.99 1.32 1.72 7.30
MSE_10 1.58 1.23 0.08 0.97 1.30 1.72 7.08
MSE_11 1.58 1.29 0.09 0.95 1.25 1.67 7.02
MSE_12 1.59 1.33 0.10 0.92 1.23 1.66 6.70
MSE_13 1.74 1.46 0.11 0.98 1.30 1.79 6.55
MSE_14 1.85 1.53 0.11 1.01 1.36 1.87 6.70
MSE_15 1.96 1.62 0.13 1.03 1.39 1.95 6.55
MSE_16 1.98 1.62 0.13 1.03 1.39 1.95 6.40
MSE_17 2.04 1.67 0.14 1.02 1.39 2.08 6.14
MSE_18 2.03 1.65 0.15 1.01 1.39 2.08 6.04
MSE_19 2.09 1.69 0.17 1.01 1.39 2.08 6.04
MSE_20 2.09 1.67 0.17 0.98 1.39 2.08 5.94
MSE_21 2.10 1.66 0.18 0.98 1.39 2.20 5.83
MSE_22 2.13 1.68 0.18 0.98 1.39 2.30 5.83
MSE_23 2.17 1.69 0.18 0.98 1.39 4.28 5.61
MSE_24 2.27 1.70 0.20 0.98 1.39 4.28 5.35
https://mhealth.jmir.org/2021/7/e29840 JMIR Mhealth Uhealth 2021 | vol. 9 | iss. 7 | e29840 | p. 9
(page number not for citation purposes)
XSL• FO
RenderXJMIR MHEALTH AND UHEALTH Zhang et al
Featurea Mean SD Min Q1 Median Q3 Max
Frequency domain (FD)
LFb_sum 330.66 2469.74 0.05 17.41 53.87 184.80 85956.16
MFc_sum 157.24 1166.32 0.02 8.16 25.77 83.05 34970.35
HFd_sum 602.22 3272.44 0.47 55.72 151.74 403.38 64127.16
LF_pcte 0.25 0.10 0.03 0.17 0.23 0.31 0.63
MF_pct 0.13 0.10 0.01 0.07 0.11 0.17 0.74
HF_pct 0.62 0.15 0.12 0.53 0.64 0.72 0.92
LF_sef 0.83 0.10 0.38 0.78 0.85 0.90 1.00
MF_se 0.82 0.09 0.40 0.77 0.83 0.88 0.99
HF_se 0.90 0.04 0.72 0.88 0.90 0.92 0.99
a
Definitions of Bluetooth features in this table are shown in Table 1.
b
LF: low frequency (0-0.75 cycles/day).
c
MF: middle frequency (0.75-1.25 cycles/day).
d
HF: high frequency (>1.25 cycles/day).
e
pct: percentage of spectrum power.
f
se: spectral entropy.
Figure 6. A correlation plot of pairwise Spearman correlations between all 49 Bluetooth features. Definitions of Bluetooth features in this figure are
shown in Table 1.
https://mhealth.jmir.org/2021/7/e29840 JMIR Mhealth Uhealth 2021 | vol. 9 | iss. 7 | e29840 | p. 10
(page number not for citation purposes)
XSL• FO
RenderXJMIR MHEALTH AND UHEALTH Zhang et al
Table 3. Summary of the demographics and 8-item Patient Health Questionnaire (PHQ-8) record distribution of all selected participants.
Characteristic Value
Number of participants 316
Demographics
Age at baseline, median (Q1, Q3) 51.0 (35.0, 59.0)
Female sex, n (%) 234 (74.1%)
Number of years in education, median (Q1, Q3) 16.0 (14.0, 19.0)
PHQ-8 record distribution
Number of PHQ-8 intervals 2886
Number of PHQ-8 intervals for each participant, median (Q1, Q3) 8.0 (3.0, 14.0)
PHQ-8 score, median (Q1, Q3) 9.0 (5.0, 15.0)
Figure 7. Boxplots of the nearby Bluetooth devices count (NBDC) for every hour in the whole population. Boxes extend between the 25th and 75th
percentiles, and green solid lines inside the boxes are medians. Note the relative stationary NBDC during the night-time hours.
Associations Between the PHQ-8 Score and Multiscale
Association Analysis Results
Entropy Features
The significant associations between depression severity (the
PHQ-8 score) and Bluetooth features are presented in Table 4. MSE at scale 1, scale 2, and scale 3 (MSE_1, MSE_2, and
MSE_3) were significantly and positively associated with the
Associations Between the PHQ-8 Score and PHQ-8 score, while MSE at scale 16 and scale 22 (MSE_16 and
Second-Order Statistical Features MSE_22) were significantly and negatively associated with
There were 10 second-order statistical features significantly depressive symptom severity. According to the explanations of
associated with the PHQ-8 score. All these significant MSE we mentioned in the Methods section, these associations
associations were negative, that is, the larger the value of these indicated that participants with more irregular and chaotic
features, the lower the PHQ-8 score. Notably, Min_Max (the NBDC sequences were likely to have more severe depressive
minimum value of daily maximum NBDC in the past 14 days) symptoms, while those with periodic and regular NBDC
had the strongest association (z=−4.431, PJMIR MHEALTH AND UHEALTH Zhang et al
frequency intervals (LF_sum, MF_sum, and HF_sum) were all middle-frequency power (MF_pct) was significantly and
significantly and negatively associated with the PHQ-8 score. negatively associated with depressive symptom severity. The
Among them, the MF_sum had the strongest association spectral entropy of HF (HF_se) was significantly and positively
(z=−4.766, PJMIR MHEALTH AND UHEALTH Zhang et al
Table 5. Results of the likelihood ratio tests of the three nested linear mixed-effect models.
Model Difference of parameters Chi-squarea P value
Model Bb vs model Ac 16 31.04 .01
Model Cd vs model A 49 135.19JMIR MHEALTH AND UHEALTH Zhang et al
with the finding by Wang et al [15], (2) the variance decreased, individualized when each participant had more data available
(3) the periodicity (especially the circadian rhythm) decreased, in the training set.
and (4) the NBDC sequence became more irregular and chaotic.
Limitations
These changes in the NBDC data can be explained by depression The RADAR-MDD project was designed for long-term
symptoms. The main manifestations of depression include monitoring (up to 2 years) and collecting many other passive
negative feelings (such as sadness, guilt, stress, and tiredness) data, such as GPS data, acceleration data, app usage, and screen
and loss of interest or pleasure [49]. This may lead to changes lightness, which need to be collected simultaneously through
in behaviors, such as increased time at home [29,50], decreased the mobile phone. Therefore, to avoid excessive battery
mobility [3,29], loss of the ability to work or study [2,49], consumption, nearby Bluetooth devices were scanned hourly
reduced intensity of social interactions [1], unstable and irregular in this study. However, some past studies suggested scanning
sleep [51], and decreased engagement in activities [52]. The nearby Bluetooth devices every 5 minutes to achieve high
increased time at home, inability to work or study, and enough temporal resolution [9,18]. Although hourly NBDC
diminished social interactions are reflected in the reduced data can also reflect individuals’ behaviors and statuses, our
amount of the NBDC sequence. The decreased mobility and lower data resolution may cause the loss of some dynamic
engagement in activities may be possible reasons why information. On the other hand, using the relatively low
participants with higher PHQ-8 scores have lower resolution enabled us to collect multimodal data without
variance-related features (Max_Std, Min_Std, Mean_Std, and excessive battery consumption. As the NBDC data are related
Std_Std). Depression also may lead to misalignment of the to individuals’ movement and location information, we will
circadian rhythm and make people’s life rhythms (such as sleep combine the NBDC data with GPS and acceleration data for
rhythms and social rhythms) more irregular [19]. This can be future analysis to understand the context of the Bluetooth data.
reflected in reduced periodicity and increased irregularity of
the NBDC sequence. Saeb et al [29] and Farhan et al [30] found As we mentioned in the Methods section, the MAC addresses
similar findings in GPS data, and showed that the circadian and types of Bluetooth devices were not recorded for private
rhythm of the GPS signal was significantly and negatively issues. This made it impossible to distinguish between mobile
correlated with depression. phones and other Bluetooth devices (such as headphones,
printers, and laptops), and between strangers’ and acquaintances’
From the perspective of the statistical model, Bluetooth features devices. The advantage of the NBDC data is that the data contain
extracted in this paper significantly improved the goodness of mixed and rich information. The disadvantage is that it is
fit for the PHQ-8 score, and nonlinear Bluetooth features (MSE difficult to explain the specific reasons for changes in the
and FD features) can provide additional information to NBDC, that is, we cannot know whether the changes in the
second-order statistical features (Table 5). From the perspective NBDC are caused by social interactions, working status,
of the prediction model, these 49 Bluetooth features explained traveling, or isolation. Therefore, this paper did not explain in
an extra 18.8% of the variance in the PHQ-8 score relative to depth the actual meaning behind the Bluetooth features. For
the baseline model, containing only the last PHQ-8 score and this limitation, we plan to use hashed MAC addresses in future
demographics, and MSE and FD features explained an extra research.
4.5% of data variance in the hierarchical Bayesian model (Table
6). From the perspective of the correlations between Bluetooth For the FD features, the division of the frequency intervals of
features (Figure 6), we can observe that, except for three FD the spectrum of the NBDC sequence in this paper was manually
features related to the spectrum power that had relatively strong specified by our experience. The purpose of extracting these
correlations with second-order statistical features, the FD features was to prove that the NBDC sequence’s FD has
correlations between other nonlinear Bluetooth features and the potential to provide more information about individuals’
second-order statistical features were not obvious. This indicated behaviors and life rhythms. It is necessary to discuss the optimal
that the MSE and FD features captured dimensions of boundaries of frequency intervals of the NBDC data in future
information to second-order statistical features. research.
In our prediction model, the hierarchical Bayesian linear This paper applied the hierarchical Bayesian linear regression
regression model achieved the best results in both the LAO and model to explore the linear relationships between Bluetooth
LOO time-series cross-validation. Compared with other models, features and depression. However, there may be nonlinear
one of the advantages of the hierarchical Bayesian model is that relationships between social connections and depressive
it performs individual predictions while considering the symptom severity. The Gaussian process [53], using the kernel
population’s common characteristics [43]. Therefore, the method to find nonlinear relationships, will be considered in
hierarchical Bayesian model can be considered a suitable future research.
prediction modelling method for longitudinal data. The LOO
Conclusion
time-series cross-validation results illustrated that the
hierarchical Bayesian model could predict depression for Our statistical results indicated that the NBDC data have the
participants with few observations (only two PHQ intervals in potential to reflect changes in individuals’ behaviors and statuses
the training set) that overcomes the cold start problem. The during a depressive state. The prediction results demonstrated
hierarchical Bayesian linear model achieved a better result in that the NBDC data have significant value in predicting
the LAO time-series cross-validation, which indicated that the depressive symptom severity. The nonlinear Bluetooth features
prediction results gradually became more accurate and proposed in this paper provide additional information to
https://mhealth.jmir.org/2021/7/e29840 JMIR Mhealth Uhealth 2021 | vol. 9 | iss. 7 | e29840 | p. 14
(page number not for citation purposes)
XSL• FO
RenderXJMIR MHEALTH AND UHEALTH Zhang et al
statistical and prediction models. The hierarchical Bayesian population-level characteristics are considered in the model.
model is an appropriate prediction model for predicting These findings may support the mental health monitoring
depression with longitudinal data, as both participant-level and practice in real-world settings.
Acknowledgments
The Remote Assessment of Disease and Relapse-Central Nervous System (RADAR-CNS) project has received funding from the
Innovative Medicines Initiative (IMI) 2 Joint Undertaking under grant agreement number 115902. This Joint Undertaking receives
support from the European Union’s Horizon 2020 research and innovation program and European Federation of Pharmaceutical
Industries and Associations (EFPIA) (www.imi.europa.eu). This communication reflects the views of the RADAR-CNS consortium,
and neither IMI nor the European Union and EFPIA are liable for any use that may be made of the information contained herein.
The funding body was not involved in the design of the study, the collection or analysis of the data, or the interpretation of the
data. Participants in the CIBER site came from the following four clinical communities in Spain: Parc Sanitari Sant Joan de Déu
Network services, Institut Català de la Salut, Institut Pere Mata, and Hospital Clínico San Carlos. Participant recruitment in
Amsterdam was partially accomplished through Hersenonderzoek.nl, a Dutch online registry that facilitates participant recruitment
for neuroscience studies. Hersenonderzoek.nl is funded by ZonMw-Memorabel (project number 73305095003), a project in the
context of the Dutch Deltaplan Dementie, Gieskes-Strijbis Foundation, the Alzheimer's Society in the Netherlands, and Brain
Foundation Netherlands. This paper represents independent research partly funded by the National Institute for Health Research
(NIHR) Maudsley Biomedical Research Centre at South London and Maudsley NHS Foundation Trust and King’s College
London. The views expressed are those of the authors and not necessarily those of the NHS, NIHR, or Department of Health and
Social Care. We thank all the members of the RADAR-CNS patient advisory board for their contribution to the device selection
procedures and for their invaluable advice throughout the study protocol design. This research was reviewed by a team with
experience in mental health problems and their careers who have been specially trained to advise on research proposals and
documentation through the Feasibility and Acceptability Support Team for Researchers (FAST-R), a free confidential service in
England provided by the National Institute for Health Research Maudsley Biomedical Research Centre via King’s College London
and South London and Maudsley NHS Foundation Trust. Remote Assessment of Disease and Relapse-Major Depressive Disorder
(RADAR-MDD) will be conducted according to the Declaration of Helsinki and Good Clinical Practice, adhering to principles
outlined in the NHS Research Governance Framework for Health and Social Care (2nd edition). Ethical approval has been obtained
in London from the Camberwell St Giles Research Ethics Committee (REC reference: 17/LO/1154), in London from the CEIC
Fundacio Sant Joan de Deu (CI: PIC-128-17), and in the Netherlands from the Medische Ethische Toetsingscommissie VUms
(METc VUmc registratienummer: 2018.012 – NL63557.029.17). RJBD is supported by the following: (1) NIHR Biomedical
Research Centre at South London and Maudsley NHS Foundation Trust and King’s College London, London, UK; (2) Health
Data Research UK, which is funded by the UK Medical Research Council, Engineering and Physical Sciences Research Council,
Economic and Social Research Council, Department of Health and Social Care (England), Chief Scientist Office of the Scottish
Government Health and Social Care Directorates, Health and Social Care Research and Development Division (Welsh Government),
Public Health Agency (Northern Ireland), British Heart Foundation, and Wellcome Trust; (3) The BigData@Heart Consortium,
funded by the Innovative Medicines Initiative-2 Joint Undertaking under grant agreement number 116074. This Joint Undertaking
receives support from the European Union’s Horizon 2020 research and innovation program and EFPIA; it is chaired by DE
Grobbee and SD Anker, partnering with 20 academic and industry partners and the European Society of Cardiology; (4) The
National Institute for Health Research University College London Hospitals Biomedical Research Centre; (5) The NIHR Biomedical
Research Centre at South London and Maudsley NHS Foundation Trust and King’s College London; (6) The UK Research and
Innovation London Medical Imaging & Artificial Intelligence Centre for Value Based Healthcare; (7) The NIHR Applied Research
Collaboration South London (NIHR ARC South London) at King’s College Hospital NHS Foundation Trust. This paper represents
independent research partly funded by the NIHR Biomedical Research Centre at South London and Maudsley NHS Foundation
Trust and King’s College London. The views expressed are those of the authors and not necessarily those of the NHS, the NIHR,
or the Department of Health and Social Care. MH and TW have been supported by NIHR Senior Investigator Awards.
Conflicts of Interest
VAN is an employee of Janssen Research and Development LLC. PA is employed by the pharmaceutical company H. Lundbeck
A/S. DCM has accepted honoraria and consulting fees from Apple, Inc, Otsuka Pharmaceuticals, Pear Therapeutics, and the One
Mind Foundation; has received royalties from Oxford Press; and has an ownership interest in Adaptive Health, Inc.
References
1. Cacioppo JT, Hughes ME, Waite LJ, Hawkley LC, Thisted RA. Loneliness as a specific risk factor for depressive symptoms:
cross-sectional and longitudinal analyses. Psychol Aging 2006 Mar;21(1):140-151. [doi: 10.1037/0882-7974.21.1.140]
[Medline: 16594799]
https://mhealth.jmir.org/2021/7/e29840 JMIR Mhealth Uhealth 2021 | vol. 9 | iss. 7 | e29840 | p. 15
(page number not for citation purposes)
XSL• FO
RenderXJMIR MHEALTH AND UHEALTH Zhang et al
2. Rizvi SJ, Cyriac A, Grima E, Tan M, Lin P, Gallaugher LA, et al. Depression and employment status in primary and tertiary
care settings. Can J Psychiatry 2015 Jan;60(1):14-22 [FREE Full text] [doi: 10.1177/070674371506000105] [Medline:
25886545]
3. Lampinen P, Heikkinen E. Reduced mobility and physical activity as predictors of depressive symptoms among
community-dwelling older adults: an eight-year follow-up study. Aging Clin Exp Res 2003 Jun;15(3):205-211. [doi:
10.1007/BF03324501] [Medline: 14582683]
4. Burgess P, Pirkis J, Morton J, Croke E. Lessons from a comprehensive clinical audit of users of psychiatric services who
committed suicide. Psychiatr Serv 2000 Dec;51(12):1555-1560. [doi: 10.1176/appi.ps.51.12.1555] [Medline: 11097653]
5. Boonstra T, Werner-Seidler A, O'Dea B, Larsen M, Christensen H. Smartphone app to investigate the relationship between
social connectivity and mental health. 2017 Presented at: 39th Annual International Conference of the IEEE Engineering
in Medicine and Biology Society (EMBC); July 11-15, 2017; Jeju, Korea (South) p. 287-290. [doi:
10.1109/EMBC.2017.8036818]
6. Rohani DA, Faurholt-Jepsen M, Kessing LV, Bardram JE. Correlations Between Objective Behavioral Features Collected
From Mobile and Wearable Devices and Depressive Mood Symptoms in Patients With Affective Disorders: Systematic
Review. JMIR Mhealth Uhealth 2018 Aug 13;6(8):e165 [FREE Full text] [doi: 10.2196/mhealth.9691] [Medline: 30104184]
7. Yan Z, Yang J, Tapia EM. Smartphone bluetooth based social sensing. In: UbiComp '13 Adjunct: Proceedings of the 2013
ACM conference on Pervasive and ubiquitous computing adjunct publication. 2013 Presented at: ACM conference on
Pervasive and ubiquitous computing adjunct publication; September 8-12, 2013; Zurich, Switzerland p. 95-98. [doi:
10.1145/2494091.2494118]
8. Eagle N, Pentland A, Lazer D. Inferring friendship network structure by using mobile phone data. Proc Natl Acad Sci U S
A 2009 Sep 08;106(36):15274-15278 [FREE Full text] [doi: 10.1073/pnas.0900282106] [Medline: 19706491]
9. Eagle N, (Sandy) Pentland A. Reality mining: sensing complex social systems. Pers Ubiquit Comput 2005 Nov
3;10(4):255-268. [doi: 10.1007/s00779-005-0046-3]
10. Dissing AS, Jørgensen TB, Gerds TA, Rod NH, Lund R. High perceived stress and social interaction behaviour among
young adults. A study based on objective measures of face-to-face and smartphone interactions. PLoS One 2019 Jul
26;14(7):e0218429 [FREE Full text] [doi: 10.1371/journal.pone.0218429] [Medline: 31348787]
11. Clark BK, Winkler EA, Brakenridge CL, Trost SG, Healy GN. Using Bluetooth proximity sensing to determine where
office workers spend time at work. PLoS One 2018 Mar 7;13(3):e0193971 [FREE Full text] [doi:
10.1371/journal.pone.0193971] [Medline: 29513754]
12. Nordström E, Diot C, Gass R, Gunningberg P. Experiences from measuring human mobility using Bluetooth inquiring
devices. In: MobiEval '07: Proceedings of the 1st international workshop on System evaluation for mobile platforms. 2007
Presented at: 1st international workshop on System evaluation for mobile platforms; June 11, 2007; San Juan, Puerto Rico
p. 15-20. [doi: 10.1145/1247721.1247725]
13. Doryab A, Villalba DK, Chikersal P, Dutcher JM, Tumminia M, Liu X, et al. Identifying Behavioral Phenotypes of Loneliness
and Social Isolation with Passive Sensing: Statistical Analysis, Data Mining and Machine Learning of Smartphone and
Fitbit Data. JMIR Mhealth Uhealth 2019 Jul 24;7(7):e13209 [FREE Full text] [doi: 10.2196/13209] [Medline: 31342903]
14. Wu C, Barczyk AN, Craddock RC, Harari GM, Thomaz E, Shumake JD, et al. Improving prediction of real-time loneliness
and companionship type using geosocial features of personal smartphone data. Smart Health 2021 Apr;20:100180. [doi:
10.1016/j.smhl.2021.100180]
15. Wang R, Chen F, Chen Z, Li T, Harari G, Tignor S, et al. StudentLife: assessing mental health, academic performance and
behavioral trends of college students using smartphones. In: UbiComp '14: Proceedings of the 2014 ACM International
Joint Conference on Pervasive and Ubiquitous Computing. 2014 Presented at: ACM International Joint Conference on
Pervasive and Ubiquitous Computing; September 13-17, 2014; Seattle, Washington p. 3-14. [doi: 10.1145/2632048.2632054]
16. Moturu S, Khayal I, Aharony N, Wei P, Pentland A. Sleep, mood and sociability in a healthy population. 2011 Presented
at: Annual International Conference of the IEEE Engineering in Medicine and Biology Society; August 30-September 3,
2011; Boston, MA, USA p. 5267-5270. [doi: 10.1109/iembs.2011.6091303]
17. Bogomolov A, Lepri B, Pianesi F. Happiness Recognition from Mobile Phone Data. 2013 Presented at: 2013 International
Conference on Social Computing; September 8-14, 2013; Alexandria, VA, USA p. 790-795. [doi:
10.1109/socialcom.2013.118]
18. Bogomolov A, Lepri B, Ferron M, Pianesi F. Daily Stress Recognition from Mobile Phone Data, Weather Conditions and
Individual Traits. 2014 Presented at: MM '14: Proceedings of the 22nd ACM international conference on Multimedia;
November 3-7, 2014; Orlando, FL, USA p. 477-486. [doi: 10.1145/2647868.2654933]
19. Walker WH, Walton JC, DeVries AC, Nelson RJ. Circadian rhythm disruption and mental health. Transl Psychiatry 2020
Jan 23;10(1):28 [FREE Full text] [doi: 10.1038/s41398-020-0694-0] [Medline: 32066704]
20. Khoulji S, Garzón-Rey J, Aguilo J. Remote Assessment of Disease and Relapse – Central Nervous System- RADAR-CNS.
TMLAI 2017 Aug 31;5(4):1 [FREE Full text] [doi: 10.14738/tmlai.54.3293]
21. Matcham F, Barattieri di San Pietro C, Bulgari V, de Girolamo G, Dobson R, Eriksson H, RADAR-CNS consortium.
Remote assessment of disease and relapse in major depressive disorder (RADAR-MDD): a multi-centre prospective cohort
https://mhealth.jmir.org/2021/7/e29840 JMIR Mhealth Uhealth 2021 | vol. 9 | iss. 7 | e29840 | p. 16
(page number not for citation purposes)
XSL• FO
RenderXJMIR MHEALTH AND UHEALTH Zhang et al
study protocol. BMC Psychiatry 2019 Feb 18;19(1):72 [FREE Full text] [doi: 10.1186/s12888-019-2049-z] [Medline:
30777041]
22. Hersenonderzoek.nl. URL: https://hersenonderzoek.nl [accessed 2020-07-20]
23. Ranjan Y, Rashid Z, Stewart C, Conde P, Begale M, Verbeeck D, Hyve, RADAR-CNS Consortium. RADAR-Base: Open
Source Mobile Health Platform for Collecting, Monitoring, and Analyzing Data Using Sensors, Wearables, and Mobile
Devices. JMIR Mhealth Uhealth 2019 Aug 01;7(8):e11734 [FREE Full text] [doi: 10.2196/11734] [Medline: 31373275]
24. Kroenke K, Strine TW, Spitzer RL, Williams JBW, Berry JT, Mokdad AH. The PHQ-8 as a measure of current depression
in the general population. J Affect Disord 2009 Apr;114(1-3):163-173. [doi: 10.1016/j.jad.2008.06.026] [Medline: 18752852]
25. Sun S, Folarin AA, Ranjan Y, Rashid Z, Conde P, Stewart C, RADAR-CNS Consortium. Using Smartphones and Wearable
Devices to Monitor Behavioral Changes During COVID-19. J Med Internet Res 2020 Sep 25;22(9):e19992 [FREE Full
text] [doi: 10.2196/19992] [Medline: 32877352]
26. Lee RM, Draper M, Lee S. Social connectedness, dysfunctional interpersonal behaviors, and psychological distress: Testing
a mediator model. Journal of Counseling Psychology 2001;48(3):310-318. [doi: 10.1037/0022-0167.48.3.310]
27. Aluoja A, Leinsalu M, Shlik J, Vasar V, Luuk K. Symptoms of depression in the Estonian population: prevalence,
sociodemographic correlates and social adjustment. Journal of Affective Disorders 2004 Jan;78(1):27-35. [doi:
10.1016/s0165-0327(02)00179-9]
28. Akhtar-Danesh N, Landeen J. Relation between depression and sociodemographic factors. Int J Ment Health Syst 2007
Sep 04;1(1):4 [FREE Full text] [doi: 10.1186/1752-4458-1-4] [Medline: 18271976]
29. Saeb S, Zhang M, Karr CJ, Schueller SM, Corden ME, Kording KP, et al. Mobile Phone Sensor Correlates of Depressive
Symptom Severity in Daily-Life Behavior: An Exploratory Study. J Med Internet Res 2015 Jul 15;17(7):e175 [FREE Full
text] [doi: 10.2196/jmir.4273] [Medline: 26180009]
30. Farhan AA, Yue C, Morillo R, Ware S, Lu J, Bi J, et al. Behavior vs. introspection: refining prediction of clinical depression
via smartphone sensing data. 2016 Presented at: 2016 IEEE Wireless Health (WH); October 25-27, 2016; Bethesda, MD,
USA. [doi: 10.1109/wh.2016.7764553]
31. Costa M, Goldberger AL, Peng C. Multiscale entropy analysis of biological signals. Phys Rev E Stat Nonlin Soft Matter
Phys 2005 Feb 18;71(2 Pt 1):021906. [doi: 10.1103/PhysRevE.71.021906] [Medline: 15783351]
32. Broughton S, Bryan K. Discrete Fourier Analysis and Wavelets: Applications to Signal and Image Processing. Hoboken,
NJ, USA: Wiley; 2008.
33. Silva LEV, Cabella BCT, Neves UPDC, Murta Junior LO. Multiscale entropy-based methods for heart rate variability
complexity analysis. Physica A: Statistical Mechanics and its Applications 2015 Mar;422:143-152. [doi:
10.1016/j.physa.2014.12.011]
34. Mizuno T, Takahashi T, Cho RY, Kikuchi M, Murata T, Takahashi K, et al. Assessment of EEG dynamical complexity in
Alzheimer's disease using multiscale entropy. Clin Neurophysiol 2010 Sep;121(9):1438-1446 [FREE Full text] [doi:
10.1016/j.clinph.2010.03.025] [Medline: 20400371]
35. Costa M, Peng C, L. Goldberger A, Hausdorff JM. Multiscale entropy analysis of human gait dynamics. Physica A: Statistical
Mechanics and its Applications 2003 Dec;330(1-2):53-60. [doi: 10.1016/j.physa.2003.08.022]
36. Busa MA, van Emmerik RE. Multiscale entropy: A tool for understanding the complexity of postural control. J Sport Health
Sci 2016 Mar;5(1):44-51 [FREE Full text] [doi: 10.1016/j.jshs.2016.01.018] [Medline: 30356502]
37. Mizuno K. Human circadian rhythms and exercise: Significance and application in real-life situations. JPFSM
2014;3(3):307-315. [doi: 10.7600/jpfsm.3.307]
38. Shannon CE. A Mathematical Theory of Communication. The Bell System Technical Journal 1948;27(3):379-423. [doi:
10.1002/j.1538-7305.1948.tb01338.x]
39. Laird NM, Ware JH. Random-effects models for longitudinal data. Biometrics 1982 Dec;38(4):963-974. [Medline: 7168798]
40. Benjamini Y, Hochberg Y. Controlling the False Discovery Rate: A Practical and Powerful Approach to Multiple Testing.
Journal of the Royal Statistical Society: Series B (Methodological) 2018 Dec 05;57(1):289-300. [doi:
10.1111/j.2517-6161.1995.tb02031.x]
41. Glover S, Dixon P. Likelihood ratios: a simple and flexible statistic for empirical psychologists. Psychon Bull Rev 2004
Oct;11(5):791-806. [doi: 10.3758/bf03196706] [Medline: 15732688]
42. Saeb S, Lattie EG, Schueller SM, Kording KP, Mohr DC. The relationship between mobile phone location sensor data and
depressive symptom severity. PeerJ 2016;4:e2537 [FREE Full text] [doi: 10.7717/peerj.2537] [Medline: 28344895]
43. Gelman A, Carlin J, Stern H, Dunson D, Vehtari A, Rubin D. Bayesian Data Analysis. New York, NY: Chapman and
Hall/CRC; 2013.
44. Salvatier J, Wiecki T, Fonnesbeck C. Probabilistic programming in Python using PyMC3. PeerJ Computer Science 2016;2:e55
[FREE Full text] [doi: 10.7717/peerj-cs.55]
45. Tibshirani R. Regression Shrinkage and Selection Via the Lasso. Journal of the Royal Statistical Society: Series B
(Methodological) 2018 Dec 05;58(1):267-288. [doi: 10.1111/j.2517-6161.1996.tb02080.x]
46. Chen T, Guestrin C. XGBoost: A Scalable Tree Boosting System. 2016 Presented at: KDD '16: Proceedings of the 22nd
ACM SIGKDD International Conference on Knowledge Discovery and Data Mining; August 13-17, 2016; San Francisco,
CA, USA p. 785-794. [doi: 10.1145/2939672.2939785]
https://mhealth.jmir.org/2021/7/e29840 JMIR Mhealth Uhealth 2021 | vol. 9 | iss. 7 | e29840 | p. 17
(page number not for citation purposes)
XSL• FO
RenderXJMIR MHEALTH AND UHEALTH Zhang et al
47. Pedregosa F, Varoquaux G, Gramfort A, Michel V, Thirion B, Grisel O, et al. Scikit-learn: Machine learning in Python.
The Journal of Machine Learning Research 2011;12:2825-2830 [FREE Full text]
48. Busk J, Faurholt-Jepsen M, Frost M, Bardram JE, Vedel Kessing L, Winther O. Forecasting Mood in Bipolar Disorder
From Smartphone Self-assessments: Hierarchical Bayesian Approach. JMIR Mhealth Uhealth 2020 Apr 01;8(4):e15028
[FREE Full text] [doi: 10.2196/15028] [Medline: 32234702]
49. Depression and Other Common Mental Disorders: Global Health Estimates. World Health Organization. URL: https://apps.
who.int/iris/bitstream/handle/10665/254610/WHO-MSD-MER-2017.2-eng.pdf [accessed 2021-07-20]
50. Chow PI, Fua K, Huang Y, Bonelli W, Xiong H, Barnes LE, et al. Using Mobile Sensing to Test Clinical Models of
Depression, Social Anxiety, State Affect, and Social Isolation Among College Students. J Med Internet Res 2017 Mar
03;19(3):e62 [FREE Full text] [doi: 10.2196/jmir.6820] [Medline: 28258049]
51. Zhang Y, Folarin AA, Sun S, Cummins N, Bendayan R, Ranjan Y, RADAR-CNS Consortium. Relationship Between Major
Depression Symptom Severity and Sleep Collected Using a Wristband Wearable Device: Multicenter Longitudinal
Observational Study. JMIR Mhealth Uhealth 2021 Apr 12;9(4):e24604 [FREE Full text] [doi: 10.2196/24604] [Medline:
33843591]
52. Goldberg B, Brintnell ES, Goldberg J. The Relationship Between Engagement in Meaningful Activities and Quality of
Life in Persons Disabled by Mental Illness. Occupational Therapy in Mental Health 2002 Mar;18(2):17-44. [doi:
10.1300/j004v18n02_03]
53. Dearmon J, Smith TE. Gaussian Process Regression and Bayesian Model Averaging: An Alternative Approach to Modeling
Spatial Phenomena. Geogr Anal 2015 Aug 21;48(1):82-111. [doi: 10.1111/gean.12083]
Abbreviations
CIBER: Centro de Investigación Biomédican en Red
FD: frequency domain
HF: high frequency
KCL: King’s College London
LAO: leave-all-out
LF: low frequency
LOO: leave-one-out
MAC: Media Access Control
MF: middle frequency
MSE: multiscale entropy
NBDC: nearby Bluetooth device count
PHQ-8: 8-item Patient Health Questionnaire
RADAR-CNS: Remote Assessment of Disease and Relapse - Central Nervous System
RADAR-MDD: Remote Assessment of Disease and Relapse - Major Depressive Disorder
RMSE: root mean squared error
RMT: remote measurement technology
VUmc: Vrije Universiteit Medisch Centrum
Edited by G Eysenbach; submitted 23.04.21; peer-reviewed by A Lamer; comments to author 14.05.21; revised version received
18.05.21; accepted 31.05.21; published 30.07.21
Please cite as:
Zhang Y, Folarin AA, Sun S, Cummins N, Ranjan Y, Rashid Z, Conde P, Stewart C, Laiou P, Matcham F, Oetzmann C, Lamers F,
Siddi S, Simblett S, Rintala A, Mohr DC, Myin-Germeys I, Wykes T, Haro JM, Penninx BWJH, Narayan VA, Annas P, Hotopf M,
Dobson RJB, RADAR-CNS Consortium
Predicting Depressive Symptom Severity Through Individuals’ Nearby Bluetooth Device Count Data Collected by Mobile Phones:
Preliminary Longitudinal Study
JMIR Mhealth Uhealth 2021;9(7):e29840
URL: https://mhealth.jmir.org/2021/7/e29840
doi: 10.2196/29840
PMID: 34328441
©Yuezhou Zhang, Amos A Folarin, Shaoxiong Sun, Nicholas Cummins, Yatharth Ranjan, Zulqarnain Rashid, Pauline Conde,
Callum Stewart, Petroula Laiou, Faith Matcham, Carolin Oetzmann, Femke Lamers, Sara Siddi, Sara Simblett, Aki Rintala, David
C Mohr, Inez Myin-Germeys, Til Wykes, Josep Maria Haro, Brenda W J H Penninx, Vaibhav A Narayan, Peter Annas, Matthew
Hotopf, Richard J B Dobson, RADAR-CNS Consortium. Originally published in JMIR mHealth and uHealth
https://mhealth.jmir.org/2021/7/e29840 JMIR Mhealth Uhealth 2021 | vol. 9 | iss. 7 | e29840 | p. 18
(page number not for citation purposes)
XSL• FO
RenderXYou can also read


