The fortedata R package: open-science datasets from a manipulative experiment testing forest resilience - ESSD
←
→
Page content transcription
If your browser does not render page correctly, please read the page content below
Earth Syst. Sci. Data, 13, 943–952, 2021
https://doi.org/10.5194/essd-13-943-2021
© Author(s) 2021. This work is distributed under
the Creative Commons Attribution 4.0 License.

        The fortedata R package: open-science datasets from a
           manipulative experiment testing forest resilience
              Jeff W. Atkins1 , Elizabeth Agee2 , Alexandra Barry1 , Kyla M. Dahlin3 , Kalyn Dorheim4 ,
             Maxim S. Grigri1 , Lisa T. Haber1 , Laura J. Hickey1 , Aaron G. Kamoske3 , Kayla Mathes1 ,
          Catherine McGuigan1 , Evan Paris5 , Stephanie C. Pennington4 , Carly Rodriguez6 , Autym Shafer1 ,
              Alexey Shiklomanov7 , Jason Tallant8 , Christopher M. Gough1 , and Ben Bond-Lamberty4
                 1 Department   of Biology, Virginia Commonwealth University, Richmond, VA 23059, USA
         2 Environmental  Sciences Division and Climate Change Science Institute, Oak Ridge National Laboratory,
                                                  Oak Ridge, TN 37831, USA
                  3 Department of Geography, Environment, and Spatial Sciences, Michigan State University,

                                                 East Lansing, MI 48824, USA
       4 Joint Global Change Research Institute at the University of Maryland, Pacific Northwest National Laboratory,

                                                College Park, MD 20740, USA
                                       5 Vassar College, Poughkeepsie, NY 12604, USA
                                  6 Western Colorado University, Gunnison, CO 81231, USA
                              7 NASA Goddard Space Flight Center, Greenbelt, MD 20771, USA
                            8 University of Michigan Biological Station, Pellston, MI 49769, USA

                                   Correspondence: Jeff W. Atkins (jwatkins6@vcu.edu)

                                  Received: 5 May 2020 – Discussion started: 10 September 2020
                       Revised: 14 December 2020 – Accepted: 21 December 2020 – Published: 9 March 2021

      Abstract. The fortedata R package is an open data notebook from the Forest Resilience Threshold Experiment
      (FoRTE) – a modeling and manipulative field experiment that tests the effects of disturbance severity and distur-
      bance type on carbon cycling dynamics in a temperate forest. Package data consist of measurements of carbon
      pools and fluxes and ancillary measurements to help analyze and interpret carbon cycling over time. Currently
      the package includes data and metadata from the first three FoRTE field seasons, serves as a central, updatable
      resource for the FoRTE project team, and is intended as a resource for external users over the course of the exper-
      iment and in perpetuity. Further, it supports all associated FoRTE publications, analyses, and modeling efforts.
      This increases efficiency, consistency, compatibility, and productivity while minimizing duplicated effort and er-
      ror propagation that can arise as a function of a large, distributed and collaborative effort. More broadly, fortedata
      represents an innovative, collaborative way of approaching science that unites and expedites the delivery of com-
      plementary datasets to the broader scientific community, increasing transparency and reproducibility of taxpayer-
      funded science. The fortedata package is available via GitHub: https://github.com/FoRTExperiment/fortedata
      (last access: 19 February 2021), and detailed documentation on the access, used, and applications of fortedata
      are available at https://fortexperiment.github.io/fortedata/ (last access: 19 February 2021). The first public re-
      lease, version 1.0.1 is also archived at https://doi.org/10.5281/zenodo.4399601 (Atkins et al., 2020b). All data
      products are also available outside of the package as .csv files: https://doi.org/10.6084/m9.figshare.13499148.v1
      (Atkins et al., 2020c).

Published by Copernicus Publications.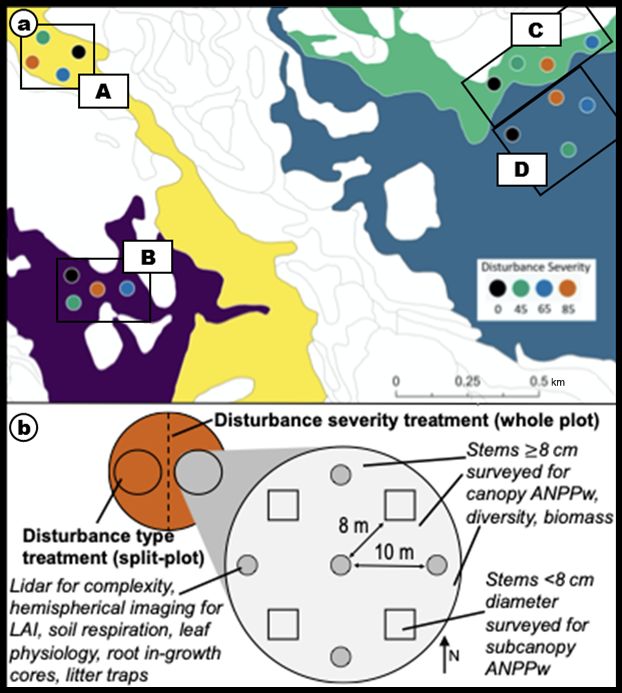
944                                                                             J. W. Atkins et al.: The fortedata R package

1   Introduction                                                 accountability and transparency by documenting the prove-
                                                                 nance of research data from conceptualization to publica-
Disturbance alters multiple carbon (C) cycling processes and,    tion and fights against the file drawer effect of lost data
as a result, may affect forest C uptake and storage (Williams    (Rosenthal, 1979). The ability for a project team to pull from
et al., 2016). The magnitude, timing, and duration of changes    one well-documented and consistent open data notebook in-
in the C cycle following disturbance vary among forests          creases research productivity and efficiency – streamlining
(Amiro et al., 2010; Luo and Weng, 2011; Coomes et al.,          the process of data curation and manipulation, and elimi-
2012; Hicke et al., 2012; Gough et al., 2013; Peters et al.,     nating errors or inconsistencies that may otherwise be in-
2013; Vanderwel et al., 2013; Flower and Gonzalez-Meler,         troduced from multiple copies of datasets across multiple
2015; Gu et al., 2019). These responses may differ as a func-    workstations. In turn, this increases the potential for repro-
tion of disturbance severity, type, and frequency along with     ducibility and data use outside of a core project (Powers and
the physical, structural, and biological properties of the af-   Hampton, 2019; Schapira et al., 2019; Gallagher et al., 2020).
fected ecosystem (Amiro et al., 2010; Williams et al., 2012;     Open data notebooks also perfectly complement mentoring
Scheuermann et al., 2018; Rebane et al., 2019; Fahey et          and teaching – simultaneously serving to rapidly and effec-
al., 2020; Atkins et al., 2020a). Understanding which for-       tively onboard new team members to the project while also
est ecosystems are most vulnerable to disturbance and, con-      providing project-based learning opportunities in the class-
versely, what characteristics of an ecosystem confer C cy-       room that teach open science and data science skills.
cling stability remains an important frontier crucial to fore-      The goal of this paper is to (i) describe the scientific con-
casting changes in the terrestrial C sink in the face of ris-    text and goals of the Forest Resilience Threshold Experiment
ing global disturbance frequencies (Frelich and Reich, 1999;     (FoRTE), (ii) describe its experimental design and high-level
White and Jentsch, 2001; Johnstone et al., 2010; 2016).          measurement protocols, and (iii) document the open-source
Large-scale manipulative experiments may be particularly         fortedata package that serves as the project data repository.
useful to identify the C fluxes and drivers that determine       The systematically documented and transparent approach to
ecosystem C balance following disturbance (Fahey et al.,         science outlined in this paper and in the fortedata package
2020; Gough et al., 2013; Shiels and González, 2014).            surpasses the data-sharing expectations of publishers and
   Honing the prediction of how forests respond to distur-       funding bodies – specifically the publication of data prior
bance, however, requires the parallel examination of mecha-      to manuscript(s) submission – and may be considered as a
nisms leading to the stability or decline of multiple C stocks   model for future experiments and projects that is in line with
and fluxes to changing disturbance regimes. The calculation      widely adopted principles concerning the management and
and interpretation of forest ecosystem C balance necessitates    stewardship of scientific data (See FAIR Principles, Wilkin-
repeated measurements of aboveground C stocks and fluxes         son et al., 2016).
through tree and litterfall inventories and belowground pro-
cesses including root production and soil respiration – the
total CO2 efflux from roots and microbes to the atmosphere.      2   The FoRTE project
Complementary process and structural measurements such
as leaf physiology, morphology, and chemistry along with re-     FoRTE is a modeling and manipulative experiment that
motely sensed measures of canopy structure and physiology        aims to identify the mechanisms underlying C cycling re-
provide important ancillary data useful to the interpretation    sponse to disturbance – specifically net primary productiv-
of changes in C fluxes following disturbance. Few compre-        ity (NPP) resilience and its decline following disturbance. It
hensive datasets from such experiments exist in the public       centers on a manipulative field experiment located in north-
domain, and those that exist are almost never published in       ern lower Michigan at the University of Michigan Biologi-
near-real time concurrently as an experiment is conducted,       cal Station (45.58◦ N, 84.71◦ W) with experimental plots that
which limits testing hypotheses related to forest resilience     span ∼ 8 ha of regionally representative landforms and forest
and functional change beyond the focus of the project and        types (Fig. 1). Data from the field experiment also inform a
slows the scientific enterprise more broadly (Falster et al.,    series of modeling experiments; specifically, data included in
2019).                                                           this package are used to initialize, calibrate, and validate dy-
   The “open data” movement in science emphasizes trans-         namic vegetation model simulations of forest function and its
parency, reproducibility, and the moral imperative of making     responses to disturbance (e.g., Shiklomanov et al., 2021).
publicly funded research products broadly available (Culina         The experimental design follows a hierarchical structure
et al., 2018). A specific example of this is “open notebook”     with four replicates (A, B, C, D) of each factorial combina-
science where the entire data record of a research project       tion of disturbance severity (four levels) and type (two lev-
is made publicly available in near-real time with the goal       els) (Fig. 1a, b). Within each replicate, each 0.5 ha plot was
of generating, integrating, documenting, and reporting het-      randomly assigned a disturbance severity level of 0 %, 45 %,
erogeneous data streams (e.g., Bond-Lamberty et al., 2016;       65 %, or 85 % gross defoliation, respectively (Fig. 1a). Each
Falster et al., 2019). Open notebook science helps create        plot is bisected, with each half subjected to a disturbance

Earth Syst. Sci. Data, 13, 943–952, 2021                                          https://doi.org/10.5194/essd-13-943-2021
J. W. Atkins et al.: The fortedata R package 945
8 m from plot center at intercardinal directions (2: north-
east; 4: southeast; 6: southwest; and 8: northwest) (Fig. 1b),
where understory leaf physiology, morphology, and chem-
istry measurements are taken. Additionally, all stems in the
4 m2 vegetation survey plots, including those below the 8 cm
DBH canopy threshold, are counted and identified to the
species level. The data detailed above are meant to be illus-
trative, but not entirely inclusive, of what is being measured
in FoRTE. Additional environmental measurements will be
taken as FoRTE matures and added to fortedata prior to in-
corporation in conventional data products such as research
papers – including, but not limited to, soil chemical and phys-
ical properties, dendrometer readings, canopy profiles from
3D terrestrial lidar, fine root production, root density profiles,
and data products from a NEON Airborne Observation Plat-
form 2019 flyover. The fortedata readme file includes updates
on the progress of current and future data availability.
2.1 The fortedata package
fortedata is a package for the R language (R Core Team,
2020) that includes field data from FoRTE. The fortedata
package version 1.0.1 (Atkins et al., 2020b) includes leaf
physiology, canopy structural traits, soil respiration, litter-
Figure 1. (a) Map showing the distribution of plots in relation
to landform types (Pearsall, 1996; Table S1). Plot replicates are fall, soil micrometeorology, and forest inventory data for the
grouped (A, B, C, D) with colors indicating severity level; (b) sub- years 2018, 2019, and 2020. Additional project data and data
plot diagram showing position of nested subplots for sampling and products will be incorporated over the lifetime of the project
arrangement of subplots within the plot (orange). (initial FoRTE NSF funding 2018–2022).
2.2 Versioning and archiving
treatment preferentially targeting large (top-down) or small
(bottom-up) canopy trees (Fig. 1). All trees larger than 8 cm The fortedata package uses semantic versioning (https://
in diameter at breast height (DBH) are classified as canopy semver.org/, last access: 19 February 2021), meaning ver-
trees. An intensively surveyed 0.1 ha subplot is nested within sion numbering follows an “x.y.z” format where x is the
each disturbance-severity–treatment combination – there are major version number, y the minor version number, and z
a total of 32 subplots (Fig. 1). The standard nomenclature is the patch version number. For example, this paper specif-
for subplots is a concatenation of the replicate (A, B, C, D) ically details version 1.0.0. The major version number (x)
plot number (01, 02, 03, 04) and subplot location (E for east only changes when there is a major change in overall pack-
side of the plot, or W for the west side of the plot) referred age structure or there is expansive update in data – for ex-
to in datasets by the variable name of subplot_id (Fig. 1b; ample, following the inclusion of all data for a given field
Tables S2–S5 in the Supplement). Within each subplot, all season. The minor version number (y) changes follow less
canopy trees are measured (DBH) and geolocated (total no. notable changes, such as minor changes in functionality or
of measured trees 3165; Fig. 2), and terrestrial laser scans the addition of minor data products. Changes in the patch ver-
using both 2D and 3D lidar (light detection and ranging) are sion number (z) represent minor bug fixes or error corrections
taken to estimate canopy structural traits (Atkins et al., 2018; that do not affect package structure. Following each (major)
Fahey et al., 2019). release a DOI will be issued and the data archived by Zen-
Within each subplot, a series of C cycling and environ- odo (https://zenodo.org/, last access: 19 February 2021). All
mental measurements are taken at nested subplots. There are changes to data and code are immediately available through
two types of nested subplot: (1) nested subplots 0, 1, 3, 5, and the GitHub repository, but only official releases will be is-
7 are 1 m2 plots located at plot center (0) and 10 m off plot sued a DOI.
center at cardinal directions (1: north; 3: east; 5: south; and
7: west) (Fig. 1b), where environmental measurements such 2.3 Package license
as soil volumetric water content, soil temperature, soil CO2
efflux, and hemispherical imagery are taken; (2) nested sub- The fortedata package is under a CC-BY-4 license (https://
plots 2, 4, 6, and 8 are 4 m2 vegetation survey plots located creativecommons.org/licenses/by/4.0/, last access: 19 Febru-
https://doi.org/10.5194/essd-13-943-2021 Earth Syst. Sci. Data, 13, 943–952, 2021946 J. W. Atkins et al.: The fortedata R package
ary 2021); see the “LICENSE” file in the repository. This is
identical to that used by, e.g., AmeriFlux and FLUXNET Tier
1. This license provides that users may copy and redistribute
this R package and their associated data in any medium
or format, adapting and building upon them for any scien-
tific or commercial purpose, as long as appropriate credit is
given. We request that users cite this paper (see Sect. 3.4)
and strongly encourage them to (i) cite all constituent dataset
primary publications (see fd_publications()) and (ii) involve
data contributors as co-authors when possible and appropri-
ate.
2.4 Citing the FoRTE data package
Papers or other research products using any FoRTE data
should cite both this publication and the fortedata package,
including the package version used. Appropriate citations
can be found via the command citation(“fortedata”).
2.5 Using the FoRTE data package to access FoRTE
data
It is necessary to install and use the fortedata R
package in order to access FoRTE data. The forte-
data package can be installed directly from GitHub
(https://github.com/FoRTExperiment/fortedata, last access:
19 February 2021) (Atkins et al., 2020b) using the devtools
package in R (Wickham et al., 2020):
devtools::install_github("FoRTExperiment
/fortedata")
library(fortedata).
We plan to submit fortedata to the Comprehensive R
Archive Network (CRAN), the common clearing house for
all standardized R software packages.
2.6 FoRTE data package structure
The package is structured as a collection of independent
datasets with standardized plot notation, date (ISO 8601 stan-
dard YYYY-MM-DD), and time (HH:MM:SS TZ) format-
ting (see fd_plot_metadata and Tables S1–S3 for more infor-
mation). Datasets are available via user-facing, external func-
Figure 2. Number of available records as of 13 Decem-
tions outlined below. Additional metadata, instrument spec-
ber 2020 for time-series datasets including soil respiration (as
well as soil temperature and soil water content) called from ifications, and abbreviated measurement protocols are avail-
fd_soil_respiration; leaf spectrometry including leaf-level vegeta- able in the Supplement (Tables S1–S11) and in package doc-
tion spectra indices from fd_spectrometry; hemispherical camera umentation. Currently available functions include the follow-
imagery including camera derived LAI, gap fraction, and NDVI ing.
from fd_hemi_camera; photosynthesis and stomatal conductance
from fd_photosynthesis; light availability from fd_ceptometer; – fd_inventory() returns a single dataset of the forest
canopy structural traits from fd_canopy_structure; forest inventory inventory data, including diameter at breast height
data from fd_forest_inventory; and litter mass collected from litter (DBH), latitude, longitude, species, and information on
traps from fd_litter. vitality and canopy position (Fig. 3; Table S6). There
are 3165 observations, all measured in 2018 (Figs. 2,
3). DBH measurements were taken with a Haglof PDII
Earth Syst. Sci. Data, 13, 943–952, 2021 https://doi.org/10.5194/essd-13-943-2021J. W. Atkins et al.: The fortedata R package 947
digital caliper (Haglof, Inc., Madison, MS, USA). Lon- clumping index, and NDVI (normalized difference veg-
gitude and latitude were measured using a Trimble R1 etation index) from terrestrial, upward-facing hemi-
GNSS receiver (Trimble; Sunnyvale, CA, USA), which spherical photos looking into the forest canopy taken
has an accuracy range of ±30 cm. Re-measurement of 1 m above ground (Table S11). The dataset includes
DBH is slated for 2022. Additionally, mortality assign- 1028 observations of each variable from 2018 and 2019
ments per tree can be found in the fd_ mortality() func- (Fig. 2).
tion which is structurally similar to fd_inventory().
– fd_canopy_structure() returns a single dataset that in-
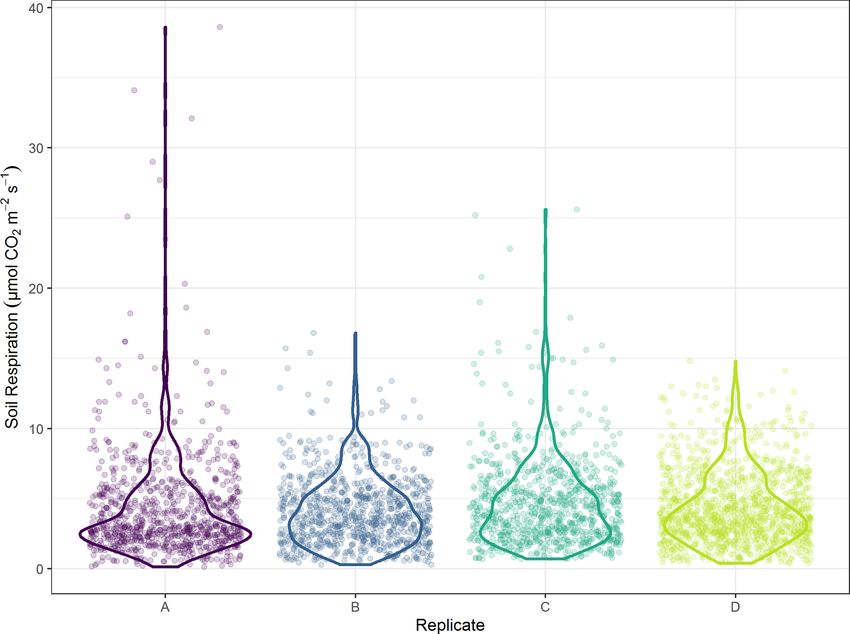
– fd_soil_respiration() returns a single dataset currently cludes estimates of canopy structural traits such as
with 3908 observations each of soil CO2 efflux height, area/density, openness, complexity, and arrange-
(µmol CO2 m−2 s−1 ), soil temperature (◦ C; integrated ment derived from terrestrial lidar and processed using
from 0 to 7 cm depth), and volumetric water content (%) forestr version 1.0.1 (Atkins et al., 2018) in R version
for the years 2019 and 2020 (Figs. 2, 4; Table S7). Soil 3.6.2 (R Core Team, 2020). The package includes 195
CO2 efflux was measured using a LI-6400 XT (LI-COR observations for each metric (28 canopy structural met-
Biosciences; Lincoln, NE) with a soil CO2 flux chamber rics are included in forestr v1.0.1 that estimate canopy
model 6400-09 attachment with a measurement accu- structural traits such as area/density, openness, arrange-
racy of ±5 µmol mol−1 maximum deviation. Soil tem- ment, heterogeneity, and layering (Atkins et al., 2018;
perature was measured using the attached soil temper- Fahey et al., 2019)) from 2018, 2019, and 2020 (Ta-
ature probe, with an accuracy of ±1.5 ◦ C. Soil mois- ble S12).
ture was measured using a Campbell HS2 HydroSense
II time domain reflectometer (Campbell Scientific; Lo- – fd_ceptometer() returns a single dataset that includes es-
gan, UT, USA) with a measurement accuracy of ±3 % timates of the fraction of photosynthetically available
and accurate range of 0 %–50 %. radiation (faPAR) absorbed by the canopy as well as
leaf area index (LAI) – each derived from a handheld
– fd_leaf_spectrometry() returns a single dataset of veg- ceptometer (LP-80; Decagon Devices) (Table S13) with
etation indices derived from leaf-level spectrometry a resolution of 1 µmol m−2 s−1 and accuracy of ±5 %.
data collected via a CI-710 handheld spectrometer (Ta- The dataset includes 32 observations of each variable
ble S8). The dataset currently includes 6873 observa- from 2019 and 16 from 2018 (Fig. 2).
tions from 2018 and 2020 of spectral indices for three
species each in eight subplots within the D replicate Additionally, fortedata includes functionality beyond sim-
(Figs. 1 and 2). ple data ingestion.
– fd_photosynthesis() returns a single dataset of leaf phys- – Brief summaries of certain datasets are available via
iology variables, including photosynthesis and transpi- summary functions, such as fd_inventory_summary(),
ration measured using a LI-6400 XT (LI-COR Bio- which returns a summary of the fd_inventory() dataset
sciences; Lincoln, NE) (Table S9) with a measurement that includes stocking density (in stems ha−1 ) and mean
accuracy of ±5 µmol mol−1 maximum deviation. The basal area (m2 ha−1 ) averaged at the subplot level (n =
dataset includes 2215 observations from 2018 (Fig. 2). 32) grouped by replicate, plot, and subplot variables.
fd_canopy structure_summary() returns a similar table
– fd_litter() returns a single dataset of litter mass collected of canopy structural trait data.
via litter traps (four in each subplot, at nested sampling
points 1, 3, 5, 7). The data include the tare + oven-dried – Experimental design information, including plot meta-
mass for each litter fraction as well as the tare weight data such as disturbance severity or treatment assign-
(the empty bag), by subplot (Fig. 5; Table S10). The ments, can be accessed via fd_plot_metadata() (see
data are coded by litter fraction, denoted in the frac- FoRTE Working with Data vignette for a worked ex-
tion column as either leaf, fwd (fine woody debris), or ample).
misc (miscellaneous, unidentifiable leaf fragments). Lit-
ter mass can be calculated by subtracting the tare weight – Biomass estimates from plot forest inventory data are
from the mass + tare. There are a total of 340 obser- available using the calc_biomass() function, which uses
vations included in the dataset from 2018, with 2019 regionally relevant allometries with a power law func-
and 2020 data to be processed and added in early 2021 tion to convert tree diameter to biomass in kilograms of
(Fig. 5). C and calc_lai() estimates leaf area index (LAI) from
FoRTE litter data found in fd_litter() using site-derived
– fd_hemi_camera() returns a single dataset that includes specific leaf area (SLA) data (see Leaf Litter vignette
derived estimates of leaf area index, gap fraction, for further information).
https://doi.org/10.5194/essd-13-943-2021 Earth Syst. Sci. Data, 13, 943–952, 2021948 J. W. Atkins et al.: The fortedata R package
Figure 3. Diameter at breast height (DBH) distributions for each species, grouped by replicate. The bounds of each box in the box plot
represent the 25th percentile at the lower bound and the 75th percentile at the upper bound, and the horizontal line is the median. Lines
extending from the lower and upper bounds represent values that are 1.5 times the interquartile range for the minimum and maximum values,
respectively, while black circles indicate outliers. Above each box plot, n is the number of observations.
2.7 Accessing FoRTE data without using fortedata tal design and proposal narratives, are also included both
in the package and online and can be accessed via Browse-
All data contained in fortedata can Vignettes(“fortedata”). Vignettes are currently available for
also be accessed directly via Figshare the functions above, and additional vignettes will be added
(https://doi.org/10.6084/m9.figshare.12292490.v3, Atkins as new data products are incorporated into fortedata.
et al., 2020c) as a compressed file containing all output Supporting project information, including detailed meth-
generated from each function in fortedata (Atkins et al., ods and data collection information (introduced briefly be-
2020c). This mirror of the dataset will be updated with each low and in Supplement Tables S1–S11), can be found
major release of fortedata. within package documentation: function help files (e.g.,
?fd_inventory()) and package vignettes – which can be ac-
2.8 FoRTE documentation and vignettes cessed via browseVignettes(“fortedata”) or online at https:
//fortexperiment.github.io/fortedata/ (last access: 19 Febru-
This paper serves as the primary documentation for FoRTE ary 2021). The funded project narrative (NSF DEB-165509)
data, and all code to reproduce this paper – including the ta- can be accessed directly within in the package via vi-
bles and plots herein – is available in the package (https:// gnette(“fd_forte_ proposal_ vignette”) and outlines hypothe-
github.com/FoRTExperiment/fortedata/tree/master/essd, last ses, objectives, proposed methods, and supporting literature
access: 19 February 2021). The package also includes addi- for the project.
tional supporting documentation via R’s standard help sys-
tem. Vignettes, which are guided tutorials that include ex-
ample code or background information such as experimen-
Earth Syst. Sci. Data, 13, 943–952, 2021 https://doi.org/10.5194/essd-13-943-2021J. W. Atkins et al.: The fortedata R package 949
– data class verification (e.g., plot numbers as integer val-
ues, soil CO2 efflux measurements as numeric values)
– out-of-bound latitude or longitude values
– appropriately formatted plot metadata that adheres to
FoRTE naming conventions
– out-of-bound values (e.g., unreasonable, unrealistic, er-
roneous entries) for environmental measurements (e.g.,
negative values for tree DBH, soil water content < 0 or
> 100).
The appropriate method of uncertainty quantification for any
given dataset, herein fortedata, may vary based on the use,
application, or analyses of these data. To this end, we have
provided extensive documentation for end users to make
Figure 4. Distribution of soil CO2 efflux values from May– these calculations based on their own judgement, discre-
November 2019 by replicate. Lines represent distribution, while tion, or discipline-specific needs. This is why there is no
points are individual measures.
direct quantification of uncertainty for datasets contained
within fortedata. These data are raw and represent unmod-
ified point measurements, taken according to each instru-
ment’s or method’s standards. Any uncertainties associated
with measurements, either instrument or method specific, are
detailed above in Sect. 4.2 and in Tables S5–S11.
2.10 Reporting issues
We use the fortedata GitHub issue tracker (https://
github.com/FoRTExperiment/fortedata/issues, last access:
19 February 2021) to track and categorize user improvement
suggestions, problems, or errors with the R package code and
included data, as well as requests for new variables or func-
tionality, and/or other questions. All past and current issues
are viewable to the public, and new issues can be contributed
by anyone with a (free) GitHub account.
3 Data availability
Figure 5. Distribution of litter mass values for 2018 by replicate.
Lines represent distribution, while points are individual measures.
fortedata is available via GitHub (https://github.com/
FoRTExperiment/fortedata, last access: 19 February 2021)
and can be installed and accessed directly within the R
2.9 Testing and quality assurance programming language as outlined above. Additionally, the
first version of fortedata (version 1.0.1) outlined in this pa-
The fortedata R package has a wide variety of unit tests that
per is archived at https://doi.org/10.5281/zenodo.3936146
test code functionality, typically via assertions about func-
(Atkin et al., 2020b). We have also made all pack-
tion behavior, but also by verifying behavior of those func-
age data products accessible as formatted .csv files
tions when importing datasets. As datasets within fortedata
with accompanying documentation available via Figshare:
differ in composition and format, they may create a variety
https://doi.org/10.6084/m9.figshare.12292490.v3 (Atkins et
of errors. Unit tests, detailed below, ensure that entries in
al., 2020c).
these datasets are realistic and valid. These tests are run au-
tomatically every time fortedata code or data are updated on
GitHub, ensuring continuing package validity for end users. 4 Conclusions
These tests include error checks on the following:
The lack of existing publicly available datasets compre-
– appropriate date and timestamp formatting hensively documenting forest and ecosystem manipulations
https://doi.org/10.5194/essd-13-943-2021 Earth Syst. Sci. Data, 13, 943–952, 2021950 J. W. Atkins et al.: The fortedata R package
limits our ability to test hypotheses related to forest re- Supplement. The supplement related to this article is available
silience and functional change, broadly. While projects such online at: https://doi.org/10.5194/essd-13-943-2021-supplement.
as FoRTE push our boundaries of understanding the mech-
anisms that facilitate ecological resilience, the additional ef-
fort to make the project as open and transparent as possible, Author contributions. JWA, BBL, and CMG wrote the
including the expeditious delivery of project data, increases manuscript. JWA, EAA, AB, KMD, LTH, LJH, MSG, AGK, KM,
the impact of the project. FoRTE and the fortedata package CM, EP, CR, AS, and JT collected, processed, and provisioned
data for the package, including providing details on methods
serve as one model for future experiments and projects by
and metadata included within the manuscript and in package
showcasing the advantages of supplying centralized project
documentation. JWA, BBL, KD, SCP, and AS contributed code
data openly and to investigators within and external to the and package oversight. BBL and CMG envisioned, proposed,
project. This approach is above and beyond the typical re- and oversaw the project. All authors contributed to manuscript
quirements and expectations for data availability, particularly discussion, editing, and revision.
in field-based ecology where standard conventions for data
availability, if and where they do exist, call for reporting
only upon project completion or publication. The results of Competing interests. The authors declare that they have no con-
such modular practices often limit data availability to sin- flict of interest.
gle spreadsheets of varying quality with limited, sometimes
non-existent, metadata. We argue that open-notebook science
should be the new science normal, whenever possible – when Acknowledgements. FoRTE is funded by the National Science
we fail to provide timely, open, and usable data, we fall short Foundation (grant no. DEB-1655095). NEON AOP data collection
of our duty as scientists and in doing so jeopardize scientific was supported by NSF award no. 1702379 to Kyla M. Dahlin. Carly
advancement and its societal benefits: Rodriguez, Laura J. Hickey, and Evan Paris, in whole or in part,
were supported by the UMBS REU program (NSF no. 1659338).
the free, open, and responsible practice of science We would also like the gratefully acknowledge the University of
Michigan Biological Station for their continued support.
is fundamental to scientific advancement for both
human and environmental well-being. Science re-
quires freedom of movement, collaboration, and
Financial support. This research has been supported by the NSF
communication, as well as equitable access to data (grant nos. DEB-1655095, 1702379, and 1659338).
and resources. It requires scientists to conduct and
communicate scientific work for the benefit of so-
ciety, with excellence, integrity, respect, fairness, Review statement. This paper was edited by David Carlson and
trustworthiness, clarity, and transparency. (Ameri- reviewed by Joseph Stachelek and one anonymous referee.
can Geophysical Union, 2017)
We do acknowledge there may be legitimate barriers for
References
some scientists/project teams – such as limited access to reli-
able internet, to resources to acquire necessary computational American Geophysical Union: The Responsibilities and
skills, to budgeted time, or to supportive and collaborative Rights of Scientists, available at: https://www.agu.org/
environments where open-science is rewarded – these chal- Share-and-Advocate/Share/Policymakers/Position-Statements/
lenges require our attention and support. In addition, some Rights-and-responsibilities-of-scientists (last access:
types of data (proprietary, human subject) clearly require dif- 23 April 2020), 2017.
ferent standards and practices. That said, where there exists Amiro, B. D., Barr, A. G., Barr, J. G., Black, T. A., Bracho,
the privilege of having access to the necessary resources to R., Brown, M., Chen, J. M., Clark, K. L., Davis, K. J., De-
conduct science openly and equitably, choosing to do oth- sai, A. R., Dore, S., Engel, V., Fuentes, J. D., Goldstein, A.
erwise is unconscionable. Open science approaches should H., Goulden, M. L., Kolb, T. E., Lavigne, M. B., Law, B. E.,
Margolis, H. A., Martin, T. A., McCaughey, J. H., Misson, L.,
be the rule and not the exception, and we anticipate that
Montes-Helu, M., Noormets, A., Randerson, J. T., Starr, and
the release of fortedata in near-real time will motivate exter-
G. Xiao, J.: Ecosystem carbon dioxide fluxes after disturbance
nal collaboration, facilitate data exchange within the project, in forests of North America, J. Geophys. Res.-Biogeo., 115,
and provide project-wide data transparency, consistency, and G00K02, https://doi.org/10.1029/2010JG001390, 2010.
availability, as well as increased team member efficiency and Atkins, J. W., Bohrer, G., Fahey, R. T., Hardiman, B. S., Morin, T.
productivity. H., Stovall, A. E., and Gough, C. M.: Quantifying vegetation and
canopy structural complexity from terrestrial LiDAR data using
the forestr r package, Methods Ecol. Evol., 9, 2057–2066, 2018.
Earth Syst. Sci. Data, 13, 943–952, 2021 https://doi.org/10.5194/essd-13-943-2021J. W. Atkins et al.: The fortedata R package 951 Atkins, J. W., Bond-Lamberty, B., Fahey, R. T., Hardiman, B. S., Gu, H., Williams, C. A., Hasler, N., and Zhou, Y.: The carbon bal- Haber, L., Stuart-Haëntjens, E., and Tallant, J.: Multidimensional ance of the southeastern US forest sector as driven by recent Structural Characterization is Required to Detect and Differenti- disturbance trends, J. Geophys. Res.-Biogeo., 124, 2786–2803, ate Among Moderate Disturbance Agents, Ecosphere, 11, 1–19, 2019. https://doi.org/10.1002/ecs2.3156, 2020a. Hicke, J. A., Allen, C. D., Desai, A. R., Dietze, M. C., Hall, R. J., Atkins, J. W., Bond-Lamberty, B., Dorheim, K., Pennington, S., Hogg, E. H., and Vogelmann, J.: Effects of biotic disturbances and Shiklomanov, A.: fortedata v1.0.2 (Version 1.0.2), Zenodo, on forest carbon cycling in the United States and Canada, Glob. https://doi.org/10.5281/zenodo.4399601, 2020b. Change Biol., 18, 7–34, 2012. Atkins, J. W., Bond-lamberty, B., Dorheim, K., Penning- Johnstone, J. F., McIntire, E. J., Pedersen, E. J., King, G., and Pis- ton, S. C., Shiklomanov, A., Agee, E., Gough, C. M., aric, M. J.: A sensitive slope: estimating landscape patterns of Shiklomanov, A., Dorheim, K., Pennington, S., Barry, A., forest resilience in a changing climate, Ecosphere, 1, 1–21, 2010. Dahlin, K., Grigri, M., Haber, L., Hickey, L., Kamoske, Johnstone, J. F., Allen, C. D., Franklin, J. F., Frelich, L. E., Harvey, A., Mathes, K., McGuigan, C., Paris, E., Rodriguez, C., B. J., Higuera, P. E., and Schoennagel, T.: Changing disturbance Shafer, A., and Tallant, J.: fortedata-1.0.2, Dataset, figshare, regimes, ecological memory, and forest resilience, Front. Ecol. https://doi.org/10.6084/m9.figshare.13499148.v1, 2020c. Environ., 14, 369–378, 2016. Bond-Lamberty, B., Smith, A. P., and Bailey, V.: Running Luo, Y. and Weng, E.: Dynamic disequilibrium of the terrestrial car- an open experiment: transparency and reproducibility in soil bon cycle under global change, Trends Ecol. Evol., 26, 96–104, and ecosystem science, Environ. Res. Lett., 11, 084004, 2010. https://doi.org/10.1088/1748-9326/11/8/084004. 2016. Pearsall, D. R.: Landscape ecosystems of the University of Michi- Coomes, D. A., Holdaway, R. J., Kobe, R. K., Lines, E. R., and gan Biological Station: Ecosystem diversity and ground-cover di- Allen, R. B.: A general integrative framework for modelling versity, Doctoral dissertation, The University of Michigan, 1996. woody biomass production and carbon sequestration rates in Peters, E. B., Wythers, K. R., Bradford, J. B., and Reich, P. B.: In- forests, J. Ecol., 100, 42–64, 2012. fluence of disturbance on temperate forest productivity, Ecosys- Culina, A., Baglioni, M., Crowther, T. W., Visser, M. E., Woutersen- tems, 16, 95–110, 2013. Windhouwer, S., and Manghi, P.: Navigating the unfolding open Powers, S. M. and Hampton, S. E.: Open science, reproducibil- data landscape in ecology and evolution, Nature E and E, 2, 420– ity, and transparency in ecology, Ecol. Appl., 29, e01822, 426, 2018. https://doi.org/10.1002/eap.1822, 2019. Fahey, R. T., Atkins, J. W., Gough, C. M., Hardiman, B. S., Nave, Rebane, S., Jõgiste, K., Põldveer, E., Stanturf, J. A., and Metslaid, L. E., Tallant, J. M., and Haber, L. T.: Defining a spectrum of M.: Direct measurements of carbon exchange at forest distur- integrative trait-based vegetation canopy structural types, Ecol. bance sites: a review of results with the eddy covariance method, Lett., 22, 2049–2059, 2019. Scand. J. Forest Res., 34, 585–597, 2019. Fahey, R. T., Atkins, J. W., Campbell, J. L., Rustad, L. E., Duffy, Rosenthal, R.: The file drawer problem and tolerance for null re- M., Driscoll, C. T., Fahey, T. J., and Schaberg, P. G.: Effects of an sults, Psychological Bulletin, 86, 638–641, 1979. experimental ice storm on forest canopy structure, Can. J. Forest Schapira, M., Harding, R. J., and The Open Lab Notebook Res., 50, 136–145, 2020. Consortium: Open laboratory notebooks: good for science, Falster, D. S., FitzJohn, R. G., Pennell, M. W., and Cornwell, W. K.: good for society, good for scientists, F1000Research, 8, 87, Datastorr: a workflow and package for delivering successive ver- https://doi.org/10.12688/f1000research.17710.1, 2019. sions of “evolving data” directly into R, GigaScience, 8, giz035, Scheuermann, C. M., Nave, L. E., Fahey, R. T., Nadelhoffer, K. J., https://doi.org/10.1093/gigascience/giz035, 2019. and Gough, C. M.: Effects of canopy structure and species di- Flower, C. E. and Gonzalez-Meler, M. A.: Responses of temperate versity on primary production in upper Great Lakes forests, Oe- forest productivity to insect and pathogen disturbances, Annu. cologia, 2, 405–415, https://doi.org/10.1007/s00442-018-4236- Rev. Plant Biol., 66, 547–569, 2015. x, 2018. Frelich, L. E. and Reich, P. B.: Minireviews: Neighborhood Ef- Shiels, A. B. and González, G.: Understanding the key mechanisms fects, Disturbance Severity, and Community Stability in Forests, of tropical forest responses to canopy loss and biomass deposi- Ecosystems, 2, 151–166, 1999. tion from experimental hurricane effects, Forest Ecol. Manage., Gallagher, R. V., Falster, D. S., Maitner, B. S., Salguero-Gómez, R., 332, 1–10, 2014. Vandvik, V., Pearse, W. D., and Ankenbrand, M. J.: Open Science Shiklomanov, A. N., Bond-Lamberty, B., Atkins, J., and Gough, C. principles for accelerating trait-based science across the Tree of M.: Structure and parameter uncertinty in centennial projections Life, Nature Ecology & Evolution, 4, 294–303, 2020. of forest community structure and carbon cycling, Glob. Change Gough, C. M., Hardiman, B. S., Nave, L. E., Bohrer, G., Maurer, K. Biol., 26, 6080–6096, https://doi.org/10.1111/gcb.15164, 2021. D., Vogel, C. S., Nadelhoffer, K. J., and Curtis, P. S.: Sustained Vanderwel, M. C., Coomes, D. A., and Purves, D. W.: Quanti- carbon uptake and storage following moderate disturbance in a fying variation in forest disturbance, and its effects on above- Great Lakes forest, Ecol. Appl., 23, 1202–1215, 2013. ground biomass dynamics, across the eastern United States, Gough, C. M., Atkins, J. W., Bond-Lamberty, B., Agee, E. A., Glob. Change Biol., 19, 1504–1517, 2013. Dorheim, K. R., Fahey, R. T., Grigri, M. S., Haber, L. T., Mathes, White, P. S. and Jentsch, A.: The Search for Generality in Studies K. C. Pennington, S. C., Shiklomanov, A. N., and Tallant, J. of Disturbance and Ecosystem Dynamics, in: Progress in Botany: M.: Forest Structural Complexity and Biomass Predict First-Year Genetics Physiology Systematics Ecology, edited by: Esser, K., Carbon Cycling Responses to Disturbancem Ecosystems, 1–14, Lüttge, U., Kadereit, J. W., and Beyschlag, W., Springer Berlin https://doi.org/10.1007/s10021-020-00544-1, 2020. Heidelberg, Berlin, Heidelberg, 399–450, 2001. https://doi.org/10.5194/essd-13-943-2021 Earth Syst. Sci. Data, 13, 943–952, 2021
952                                                                                   J. W. Atkins et al.: The fortedata R package

Wickham, H., Hester, J., and Change, W.: devtools: Tools to Make     Williams, C. A., Collatz, G. J., Masek, J. G., and Goward, S.
  Developing R Packages Easier, R package version 2.3.0, avail-        N.: Carbon consequences of forest disturbance and recovery
  able at: https://CRAN.R-project.org/package=devtools (last ac-       across the conterminous United States, Global Biochem. Cy., 26,
  cess: 15 January 2021), 2020.                                        GB1005, https://doi.org/10.1029/2010GB003947, 2012.
Wilkinson, M. D., Dumontier, M., Aalbersberg, I. J., Appleton, G.,   Williams, C. A., Gu, H., MacLean, R., Masek, J. G., and Collatz, G.
  Axton, M., Baak, A., Blomberg, N., Boiten, J. W., da Silva San-      J.: Disturbance and the carbon balance of US forests: A quantita-
  tos, L. B., Bourne, P. E., and Bouwman, J.: The FAIR Guiding         tive review of impacts from harvests, fires, insects, and droughts,
  Principles for scientific data management and stewardship, Sci.      Global Planet. Change, 143, 66–80, 2016.
  Data, 3, 1–9, https://doi.org/10.1038/sdata.2016.18, 2016.

Earth Syst. Sci. Data, 13, 943–952, 2021                                                https://doi.org/10.5194/essd-13-943-2021
You can also read