CLIMATE-DEPENDENT PROPAGATION OF PRECIPITATION UNCERTAINTY INTO THE WATER CYCLE - MPG.PURE
←
→
Page content transcription
If your browser does not render page correctly, please read the page content below
Hydrol. Earth Syst. Sci., 24, 3725–3735, 2020
https://doi.org/10.5194/hess-24-3725-2020
© Author(s) 2020. This work is distributed under
the Creative Commons Attribution 4.0 License.

Climate-dependent propagation of precipitation uncertainty
into the water cycle
Ali Fallah1,2 , Sungmin O2 , and Rene Orth2
1 Department   of Civil and Environmental Engineering, Shiraz University, Shiraz, Iran
2 Department   of Biogeochemical Integration, Max Planck Institute for Biogeochemistry, 07745 Jena, Germany

Correspondence: Ali Fallah (alifallah@shirazu.ac.ir, afallah@bgc-jena.mpg.de)

Received: 9 December 2019 – Discussion started: 6 January 2020
Revised: 15 June 2020 – Accepted: 27 June 2020 – Published: 23 July 2020

Abstract. Precipitation is a crucial variable for hydro-         climate-dependent performance variations of the considered
meteorological applications. Unfortunately, rain gauge mea-      data sets, which can be used to guide their future develop-
surements are sparse and unevenly distributed, which sub-        ment. The overall best agreement is achieved when using an
stantially hampers the use of in situ precipitation data in      ensemble mean generated from all the individual products. In
many regions of the world. The increasing availability of        summary, our findings highlight a climate-dependent propa-
high-resolution gridded precipitation products presents a        gation of precipitation uncertainty through the water cycle;
valuable alternative, especially over poorly gauged regions.     while runoff is strongly impacted in comparatively wet re-
This study examines the usefulness of current state-of-the-      gions, such as central Europe, there are increasing implica-
art precipitation data sets in hydrological modeling. For this   tions for evapotranspiration in drier regions.
purpose, we force a conceptual hydrological model with
multiple precipitation data sets in >200 European catch-
ments to obtain runoff and evapotranspiration. We consider
a wide range of precipitation products, which are generated      1   Introduction
via (1) the interpolation of gauge measurements (E-OBS and
Global Precipitation Climatology Centre (GPCC) V.2018),          Precipitation is a key quantity in the water cycle since it con-
(2) data assimilation into reanalysis models (ERA-Interim,       trols water availability, including both blue and green wa-
ERA5, and Climate Forecast System Reanalysis – CFSR),            ter resources (Falkenmark and Rockström, 2006; Orth and
and (3) a combination of multiple sources (Multi-Source          Destouni, 2018). In this way, changes in precipitation trans-
Weighted-Ensemble Precipitation; MSWEP V2). Evaluation           late into changes in water resources, which could have severe
is done at the daily and monthly timescales during the pe-       impacts on ecosystems and consequently the economy and
riod of 1984–2007. We find that simulated runoff values are      society (Oki and Kanae, 2006; Kirtman et al., 2013; Abbott et
highly dependent on the accuracy of precipitation inputs; in     al., 2019). Changes in precipitation can be induced or inten-
contrast, simulated evapotranspiration is generally much less    sified by climate change and consequently lead to amplified
influenced in our comparatively wet study region. We also        impacts (Blöschl et al., 2017, 2019). Thus, accurate precipi-
find that the impact of precipitation uncertainty on simu-       tation information is essential for monitoring water resources
lated runoff increases towards wetter regions, while the op-     and managing related impacts.
posite is observed in the case of evapotranspiration. Finally,      Despite the necessity of accurate precipitation data sets,
we perform an indirect performance evaluation of the pre-        in most regions, reliable gauge measurements are not widely
cipitation data sets by comparing the runoff simulations with    available. Furthermore, these measurements need to be cor-
streamflow observations. Thereby, E-OBS yields the partic-       rected for potential errors such as wind-induced inaccura-
ularly strong agreement, while ERA5, GPCC V.2018, and            cies or precipitation undercatch, especially in higher alti-
MSWEP V2 show good performances. We further reveal               tudes (Sevruk et al., 2009; Mekonnen et al., 2015; Zandler et
                                                                 al., 2019; Duethmann et al., 2020). Next to gauge measure-

Published by Copernicus Publications on behalf of the European Geosciences Union.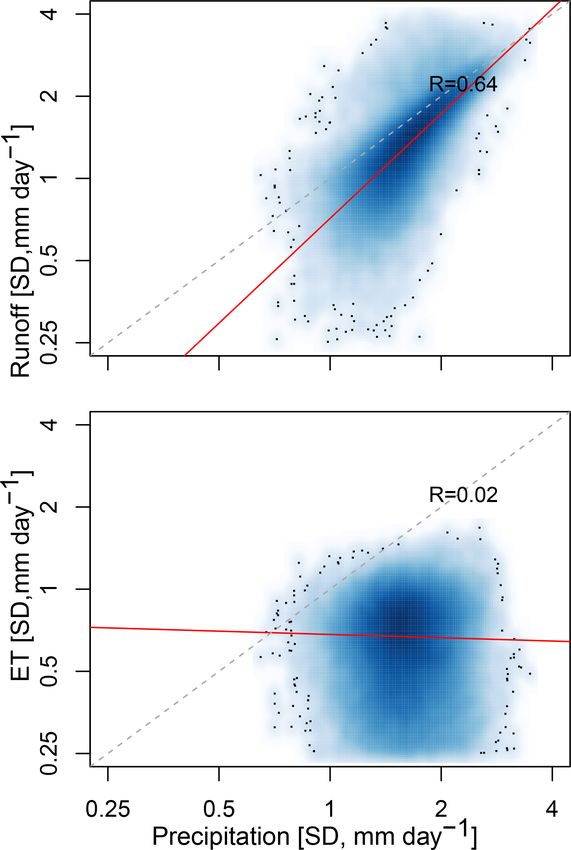
3726                     A. Fallah et al.: Climate-dependent propagation of precipitation uncertainty into the water cycle

ments, precipitation information can be inferred from satel-         2     Data and methodology
lite observations and/or model simulations. Based on these
sources, a variety of global gridded precipitation data sets
                                                                     2.1    Forcing data
have emerged. While some of these data sets make direct use
of gauge measurements to interpolate them in time and space,
others make indirect use of the gauge information to calibrate       Runoff and ET are modeled with a conceptual hydrological
satellite retrieval algorithms or models, enabling them to es-       model, the simple water balance model (SWBM). The un-
timate gridded large-scale precipitation.                            derlying framework was initially presented by Koster and
   Across these data sets there are ample discrepancies in           Mahanama (2012), where runoff (normalized by precipita-
space and time, highlighting the need for comparative assess-        tion) and ET (normalized by net radiation) are assumed to be
ments (e.g., Koutsouris et al., 2016; Alijanian et al., 2017,        polynomial functions of soil moisture (Whan et al., 2015).
2019; Balsamo et al., 2018; Sun et al., 2018; Massari et al.,        We use the model version introduced by Orth and Senevi-
2020; Brocca et al., 2019; Sharifi et al., 2019; Caroletti et al.,   ratne (2015) in which the original model is adapted to the
2019; Levizzani and Cattani, 2019; Roca et al., 2019; Fallah         daily timescale by the addition of an implicit form of the
et al., 2020; Satgé et al., 2020; Contractor et al., 2020; Xu        water balance equation and a streamflow recession param-
et al., 2020; Zhou et al., 2020). In particular, indirect eval-      eter, which enables streamflow that is delayed with respect
uation of the data sets through application in hydrological          to the respective precipitation event. Please refer to Orth and
modeling is a valuable alternative in this context as precipi-       Seneviratne (2015) for the relevant model equations and val-
tation is translated into variables with more reliable observa-      idation results. Note that the basic concept and the governing
tions, such as runoff, as long as runoff is measured in catch-       equations of runoff and ET formation used here are well es-
ments with near-natural dynamics (Thiemig et al., 2013; Ner-         tablished and employed in many similar conceptual models,
ini et al., 2015; Beck et al., 2017a, b, 2019a, b; Fereidoon         such as Hydrologiska Byråns Vattenbalansavdelning (HBV;
et al., 2019; Ehsan Bhuiyan et al., 2019; Mazzoleni et al.,          Bergström, 1995; Orth and Seneviratne, 2015). As inputs,
2019; Arheimer et al., 2020; Dembélé et al., 2020). However,         the model uses temperature, net radiation, and precipitation.
while this approach relies on the propagation of precipitation       For each catchment, temperature and net radiation are used
uncertainty into runoff, it is largely underexplored with re-        from the respective grid cells from the E-OBS (Cornes et al.,
spect to when and where this propagation pathway is active.          2018) and ERA-Interim (Dee et al., 2011) data sets, respec-
Conversely, it is unclear in which regions or conditions the         tively. Corresponding grid-cell-based precipitation data are
gridded data sets of runoff (Gudmundsson and Seneviratne,            used from various data sets derived from different sources,
2016) or evapotranspiration (e.g., Martens et al., 2017; Jung        namely gauge-based (E-OBS and GPCC V.2018), reanalysis
et al., 2019) are impacted by the existing precipitation uncer-      (ERA-Interim, ERA5, and CFSR), and multisource data sets
tainties.                                                            (MSWEP V2). A summary of all precipitation data sets and
   In this study, we investigate the uncertainty across              their respective characteristics is shown in Table 1.
six widely used gridded precipitation data sets, including              Before using the precipitation data sets to force the
their propagation into the hydrological cycle, i.e., runoff          SWBM, they are regridded to a common 0.5◦ spatial res-
and evapotranspiration (ET). Thereby, we consider gauge-             olution, if necessary. This was done through conserva-
interpolated (E-OBS v17.0 and GPCC V.2018), reanal-                  tive remapping, which preserves the water mass (Jones,
ysis (ERA-Interim, ERA5, and CFSR), and multisource                  1999), using climate data operators (Schulzweida, 2019).
(MSWEP V2) data sets. With each of them, and with an en-             The SWBM simulations are performed with a daily time
semble mean computed from all of them, we force a concep-            step, and the analysis thereof is done at daily and monthly
tual land surface model and compare the respectively sim-            timescales.
ulated runoff and ET. This is done separately for different
hydro-climatological regimes. In addition, by validating the
                                                                     2.2    Reference data
runoff simulations against respective observations we can in-
directly infer the performance of the precipitation data sets.
This further allows us to obtain guidelines with respect to the      Modeled runoff is evaluated against streamflow observa-
usefulness of the different types of precipitation products in       tions obtained from 416 catchments distributed across Eu-
the considered regimes.                                              rope (Stahl et al., 2010). The streamflow data were collected
   Section 2 introduces the reference, forcing data sets, and        from the European water archive, national ministries and me-
model calibration used in the study, and Sect. 3 illustrates the     teorological agencies and from the Water and Global Change
results and discussion. Finally, in Sect. 4 the conclusions of       (WATCH) project. These daily data are available for the pe-
this study are presented.                                            riod 1984–2007. There is no or little human influence on the
                                                                     streamflow in these catchments, which are mostly between
                                                                     10 and 100 km2 in size. More details on the data and catch-
                                                                     ments can be found in Stahl et al. (2010).

Hydrol. Earth Syst. Sci., 24, 3725–3735, 2020                                         https://doi.org/10.5194/hess-24-3725-2020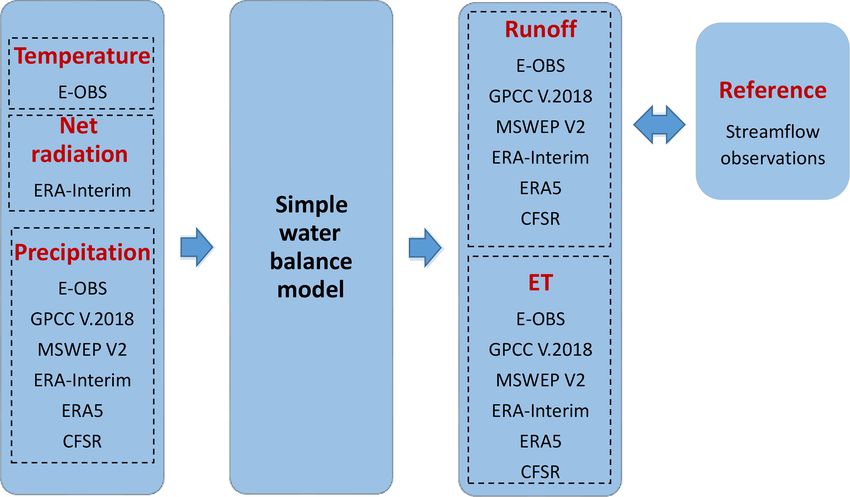
A. Fallah et al.: Climate-dependent propagation of precipitation uncertainty into the water cycle                                         3727

Table 1. Summary of the precipitation data sets evaluated in this study.

   Group          Data set          Temporal         Spatial      Spatial       Data            Reference
                                    coverage         coverage     resolution    sources
   Interpolated   E-OBS             1950–2019        Europe       0.25◦         Gauge           Cornes et al. (2018)
                  GPCC V.2018       1901–2016        Global       1◦            Gauge           Ziese et al. (2018)
   Multisource    MSWEP V2          1979–2017        Global       0.1◦          Satellite,      Beck et al. (2019)
                                                                                Gauge, and
                                                                                Reanalysis
                  ERA-Interim       1979–2019        Global       0.5◦          Reanalysis      Dee et al. (2011)
   Modeled        ERA5              1950–present     Global       ∼ 0.28◦       Reanalysis      Copernicus Climate Change Service (2017)
                  CFSR              1979–present     Global       0.5◦          Reanalysis      Saha et al. (2010, 2012)

2.3   Model calibration

The simple water balance model employed in this study in-
cludes six adjustable parameters, namely water-holding ca-
pacity, inverse streamflow recession timescale, runoff ratio
exponent, ET ratio exponent, maximum evaporative fraction,
and a snowmelt parameter (as in Orth and Seneviratne, 2015;
see also Table S1). For model calibration, 500 parameter
sets are tested, which are randomly sampled from the en-
tire parameter space using Latin hypercube sampling (LHS;
McKay et al., 1979). The ranges for each parameter within
this parameter space are obtained from O et al., 2020 (see
also Table S1). In this way, we performed 500 correspond-
ing simulations for each catchment over the entire considered
time period (1984–2007). For each simulation, we computed
the resulting Nash–Sutcliffe efficiency (NSE; Nash and Sut-
cliffe, 1970) between the observed and simulated runoff to
determine the best-performing parameter set. The results are
shown in Fig. S1 in the Supplement. In addition, any catch-
ments with NSE 400 catchments, 264 are retained for the ac-                 (1984–2007).
tual analyses, which are well distributed across the European
continent and its climate regimes.
   Note that we perform only the calibration of the model and              computed as the ratio of the mean annual net radiation to
no validation. This is because we focus on the influence of                mean annual precipitation calculated from ERA-Interim and
the precipitation forcing on the modeled runoff performance                E-OBS, respectively.
and not on the simulation capacity of the model outside train-                In each of the 264 catchments, the SWBM is forced with
ing conditions. A satisfactory predictive performance of the               temperature, net radiation, and the different precipitation
model has been shown in previous studies (Orth et al., 2015;               data sets, respectively, as illustrated in Fig. 2. In this way,
Orth and Seneviratne, 2014, 2015; Schellekens et al., 2017;                six simulations with the six different precipitation data sets
O et al., 2020).                                                           are performed for each catchment, leaving the temperature
   As shown in Fig. 1, the hydro-climatological regime is                  and net radiation data unchanged. The model parameters are
characterized through long-term average temperature and                    thereby obtained from the abovementioned calibration using
aridity (Budyko, 1974). Thereby, for each catchment the tem-               E-OBS precipitation. As this can potentially introduce biases
perature is taken from the E-OBS data set, and aridity is                  into our results, we additionally calibrated the model using

https://doi.org/10.5194/hess-24-3725-2020                                                 Hydrol. Earth Syst. Sci., 24, 3725–3735, 2020
3728 A. Fallah et al.: Climate-dependent propagation of precipitation uncertainty into the water cycle
Figure 2. Overview of the modeling approach. The simple water
balance model (SWBM) is forced with consistent net radiation and
temperature data and six different precipitation data sets. The ob-
tained runoff and evapotranspiration are assessed in terms of the
variability between the simulations. The performance of the runoff
simulations is determined against streamflow observations.
GPCC V.2018 precipitation data to derive alternative param-
eters with which we recomputed the main analyses. Figure 3. Propagation of precipitation uncertainty into the runoff
All analyses are performed during the warm season (May– and ET simulations. Standard deviations (SDs) are computed across
September) to minimize the impact of snow and ice, even the precipitation estimates and the resulting runoff and evapotran-
though snowmelt can locally affect streamflow even in the spiration values. This is done at every grid cell and for every month
warm season (Jenicek et al., 2016). between May and September. Red lines indicate linear regression
lines. Note that a log–log scale is used.
3.2 Climate-dependent propagation of precipitation
3 Results and discussion uncertainty
3.1 Impact of precipitation uncertainty on runoff and In addition to examining the role of precipitation uncertainty
ET for runoff and ET across all considered catchments, we an-
alyze this uncertainty propagation within individual hydro-
Figure 3 illustrates the propagation of precipitation uncer- climatological regimes (Fig. 4). For this purpose, we com-
tainty into simulated runoff and ET at the monthly scale. pute the median of the standard deviations from catchments
Each point denotes the standard deviation across the six sim- within each regime, considering all respective warm season
ulations obtained with the different precipitation data sets months. Figure S2 shows the number of catchments located
and represents a particular month (May–September) in a spe- within each regime. Only regimes with >5 catchments are
cific catchment. Runoff simulations are impacted by precip- considered in the analysis. The uneven distribution of catch-
itation uncertainty, while the ET simulations are much less ments across the regimes induces higher uncertainties in the
influenced by precipitation uncertainty, as indicated by the results obtained for the wettest and driest regimes. As shown
regression slope. The clear relationship between runoff and in Fig. 4a, the precipitation variability across the considered
precipitation is in line with previous studies (e.g., Beck et products is higher in comparatively cold and wet regions.
al., 2017a, b; Sun et al., 2018; Blöschl et al., 2019). It is re- This could be related to especially sparse gauge networks and
lated to the fact that most of the considered catchments are more intense rainfall in these regions which are known to in-
located in relatively wet climates (aridityA. Fallah et al.: Climate-dependent propagation of precipitation uncertainty into the water cycle 3729
3.3 Indirect validation of precipitation data set
qualities
Given the preferential propagation of precipitation uncer-
tainty to runoff in the considered European catchments, we
focus in the following on runoff only. In this context, we use
streamflow measurements from the catchments to validate
the modeled runoff, which also allows us to draw conclu-
sions on the usefulness of the employed precipitation forcing
data sets and of a mean ensemble thereof. This is, however,
not possible in the case of ET due to the lacking relationship
between ET and the precipitation forcing in our study region
(Fig. 3). For the runoff validation, we consider the correlation
of monthly anomalies in each catchment and the absolute
bias. To obtain anomalies, we remove the mean seasonal cy-
cle from the observed and modeled runoff time series of each
catchment. The six runoff simulations derived with the indi-
vidual precipitation products alongside the runoff simulation
obtained with the mean ensemble are then ranked in each
catchment with respect to (i) correlation and (ii) bias. The
sum of these two ranks is used to obtain an overall ranking
of runoff simulations and corresponding precipitation forc-
ing data sets in each catchment.
Figure 5 shows the number of catchments in which each
Figure 4. Climate-dependent propagation of precipitation uncer- precipitation product yields the best-ranked runoff simu-
tainty into runoff and ET. Panel (a) shows the standard deviation lation. Our findings show that overall the performance of
across precipitation products, while panels (b) and (c) show the rel- modeled runoff is clearly dependent on the employed pre-
ative standard deviation of resulting runoff and ET simulations with cipitation product. This is expected given the considerable
respect to precipitation, respectively. disagreement between precipitation products and the pref-
erential propagation of this uncertainty to runoff (Fig. 4).
Generally, among the individual products, the runoff com-
puted with E-OBS precipitation agrees best with observa-
tions. Also, ERA5, MSWEP V2, and GPCC V.2018 yield
comparatively good runoff estimates. In contrast, runoff sim-
runoff, whereas ET remains unchanged. Towards drier and ulations obtained with ERA-Interim and CFSR agree less
warmer climates the uncertainty propagation shifts, affecting well with observations. The precipitation ensemble outper-
runoff less and increasingly influencing ET. forms all individual products, highlighting the usefulness of
In addition to the previous analyses using monthly aver- multisource and multiproduct approaches in the derivation
aged data, we recompute Fig. 4 using daily data. The results of suitable precipitation data sets for hydrological model-
are shown in Fig. S3. The similarity between Figs. 4 and S3 ing. Furthermore, we compute runoff performance assess-
suggests that our findings on the climate-dependent propa- ments separately for anomaly correlation and absolute bias
gation of precipitation uncertainty are valid across daily and (Fig. S10). This reveals that the performance of the precipi-
monthly timescales. Furthermore, we repeat the uncertainty tation data sets is rather similar in terms of resulting runoff
propagation analysis (i) using model parameters obtained biases. Only ERA5 seems to lead to reduced biases when
from calibration with GPCC V.2018 precipitation forcing in- compared with the other products; this is probably because it
stead of E-OBS precipitation (Fig. S4); (ii) using all months does not suffer from a gauge-based precipitation undercatch.
instead of focusing on the warm season (Fig. S5); and (iii) us- In contrast, there are considerable differences in terms of the
ing an NSE limit of 0.5 instead of 0.36 to select catch- runoff anomaly correlation performance across the products.
ments where the SWBM is applicable (Fig. S6). We find that This indicates that the differences across products shown
Figs. S4–S6 show similar patterns to Fig. 4, which confirms in Fig. 5 are mostly resulting from contrasting performance
that our findings are robust with respect to the methodolog- with respect to runoff anomaly correlation.
ical approach, particularly in terms of the precipitation data When repeating the evaluation from Fig. 5 with the daily
set employed for model calibration, the considered season, data (Fig. S7) we find similar results. This suggests that the
and the applied NSE threshold to determine the applicability relative quality of the considered precipitation is compara-
of the model (see also Sect. 2.3). ble across daily and monthly timescales. In addition, we
https://doi.org/10.5194/hess-24-3725-2020 Hydrol. Earth Syst. Sci., 24, 3725–3735, 20203730 A. Fallah et al.: Climate-dependent propagation of precipitation uncertainty into the water cycle
Figure 5. Number of catchments where each precipitation prod-
uct yields the best agreement with runoff observations (May–
September). Multiple data products can be best performing at a
catchment since they are ranked based on a merged score by com-
bining anomaly correlation and absolute error.
Figure 6. Runoff-based performance of precipitation products
across climate regimes. Colors refer to the percentage of catch-
recompute Fig. 5, using all months of the year (Fig. S8), ments within each box recognized as the best performance based
and GPCC-derived SWBM parameters (Fig. S9), which both on anomaly correlation and absolute bias during May–September.
largely confirm the described results. Note that, not surpris-
ingly, model calibration with a particular precipitation prod-
uct, e.g., E-OBS or GPCC V.2018, leads to the better perfor- ings reveal that the uncertainty across precipitation data sets
mance of that respective product. propagates mainly into runoff rather than ET simulations in
Figure 6 shows the runoff performance resulting from the Europe. In addition, the partitioning of precipitation uncer-
various precipitation products for the previously considered tainty between runoff and ET is climate dependent. In com-
hydro-climatological regimes. Interestingly, we find remark- paratively cold and wet regions, such as Europe, runoff is
able performance differences across the regimes, suggesting more impacted, whereas in drier and warmer regions the un-
differential usefulness of precipitation products for hydro- certainty partitioning shifts towards ET. This applies across
logical modeling across different climate zones. Also, we daily and monthly timescales.
can identify regimes in which the precipitation products per- The results in this study are obtained with a single model
form particularly well or not. For example, MSWEP V2 leads and are potentially dependent on the choice of that model.
to strong agreement between modeled and observed runoff, Even though this model has been validated thoroughly and
mostly in comparatively cold and wet climate and less so in applied in previous studies (Orth et al., 2015; Orth and
warmer and drier regimes. This might be related to problems Seneviratne, 2014, 2015; Schellekens et al., 2017; O et al.,
of the products incorporated in MSWEP V2 in capturing con- 2020), future research needs to explore precipitation error
vective rainfall in warm and dry regions while this is less propagation with other models (as in Ehsan Bhuiyan et al.,
problematic in colder regions (Ebert et al., 2007; Beck et al., 2019). This should particularly include distributed models,
2017a, b; Massari et al., 2017; Fallah et al., 2020). The oppo- adding to our use of a lumped scheme. However, we do ob-
site performance pattern is observed for GPCC V.2018. The tain similar results with different calibrations of this model,
weaker performance in the cold climate, which is also present while previous research indicated that differences across
in the case of E-OBS, might be related to smaller gauge net- model calibrations can be similar to those across models
work density and more complex topography in colder areas (Tebaldi and Knutti, 2007).
(Beck et al., 2017b; Ziese et al., 2018). For the other prod- The strong link between precipitation and runoff in Eu-
ucts, such as CFSR and ERA-Interim, the performance is less rope allowed us to perform an indirect validation of pre-
dependent on the hydro-climatological regime. cipitation products through the performance of the respec-
tively modeled runoff. Overall, the E-OBS precipitation data
set yields the most reliable streamflow simulations in Eu-
4 Conclusions rope across the considered precipitation products. Weaker
but still comparatively good agreement between modeled and
In this study, we investigate how the remarkable discrepancy observed streamflow is obtained with ERA5, GPCC V.2018,
across state-of-the-art gridded precipitation data sets propa- and MSWEP V2. Thus, the products differ mostly with re-
gates through the water cycle. This is essential for hydrolog- spect to the temporal dynamics rather than the overall amount
ical modeling and the applicability of resulting simulations of precipitation (Sun et al., 2018; Fallah et al., 2020). The in-
of water balance components such as runoff or ET. Our find- terpolated products overall outperform the satellite-derived
Hydrol. Earth Syst. Sci., 24, 3725–3735, 2020 https://doi.org/10.5194/hess-24-3725-2020A. Fallah et al.: Climate-dependent propagation of precipitation uncertainty into the water cycle 3731
products in Europe. This is probably due to the high den- Overall, our findings highlight the important role of pre-
sity of gauge observations, as previous research found con- cipitation accuracy and the understanding of the propagation
trasting conclusions in regions with low gauge density (e.g., of existing inaccuracies through the water cycle. By reveal-
Thiemig et al., 2013, for Africa). We further find that the ing the climate dependency of this propagation, this study
ensemble mean of the considered precipitation data sets out- contributes to improved modeling and monitoring of water
performs the individual data sets, suggesting that such ap- resources, which is of particular relevance in the case of ex-
proaches are promising to obtain more reliable precipitation treme events, such as floods and droughts (e.g., Golian et al.,
forcing for hydrological modeling as shortcomings in indi- 2019; Alexander et al., 2020), that might increase in a chang-
vidual data sets seem to cancel out to some extent when used ing climate.
within an ensemble. Further, we study the performance of
the considered precipitation products with respect to climate.
We find systematic variations for data sets like MSWEP V2 Data availability. All data sets used in the current study are pub-
and GPCC V.2018, whereas ERA5, ERA-Interim, and CFSR licly available from the indicated references or sources.
perform more similarly across climate regimes. Revealing
climate-dependent accuracies in some precipitation data sets
supports focused development of these products. In this way, Supplement. The supplement related to this article is available on-
innovative hydrological validation of precipitation data, in line at: https://doi.org/10.5194/hess-24-3725-2020-supplement.
addition to direct validation against ground truth, can con-
tribute to addressing the still considerable uncertainty across
Author contributions. AF performed the analyses for the figures.
state-of-the-art gridded products in future efforts.
All authors conceived the study and analyses and contributed to the
Furthermore, these findings allow a more targeted combi-
writing of the paper.
nation of products to compensate for individual weaknesses
and preserve respective strengths. The climate-dependent
(propagation of) precipitation uncertainties illustrates that Competing interests. The authors declare that they have no conflict
there is no best overall product but instead a careful re- of interest.
gional, climate-based selection can support hydrological ap-
plications. Overall, these findings highlight the usefulness of
streamflow measurements capturing truly large-scale hydro- Acknowledgements. The authors thank the anonymous reviewers
logical dynamics, which can then be used to make inferences for their valuable comments. Furthermore, we appreciate the as-
on the accuracy of precipitation data sets (Behrangi et al., sistance of Ulrich Weber (Max Planck Institute for Biogeochem-
2011; Thiemig et al., 2013; Beck et al., 2017a, 2019a; Ehsan istry), who prepared the precipitation data sets. Ali Fallah acknowl-
Bhuiyan et al., 2019; Mazzoleni et al., 2019; Alnahit et al., edges the hosting and supervision provided by the Max Planck
2020; Arheimer et al., 2020). Institute for Biogeochemistry in Jena, Germany. We acknowledge
Another important outcome of our analyses is that ET the E-OBS data set from the EU-FP6 project UERRA (http://
www.uerra.eu) and the Copernicus Climate Change Service and the
simulations are mostly insensitive to precipitation uncer-
data providers in the ECA&D project (https://www.ecad.eu). Also,
tainty in the European climate, confirming previous studies we acknowledge GPCC V.2018 (https://opendata.dwd.de), MSWEP
(Ehsan Bhuiyan et al., 2019; Zheng et al., 2019). However, V2 (http://www.gloh2o.org), ERA-Interim (https://www.ecmwf.int/
in warmer and drier regions, such as the Middle East, central en/forecasts/datasets/reanalysis-datasets/era-interim), ERA5 (https:
North America, or Australia, the link between ET and pre- //climate.copernicus.eu/climate-reanalysis), and CFSR (https://cfs.
cipitation should be stronger. Wherever available in these re- ncep.noaa.gov). Furthermore, we are thankful for the streamflow
gions, ET measurements can and should be used for the indi- data from a data set compiled by Stahl et al. (2010), who collected
rect evaluation of large-scale precipitation products to com- data from the European water archive (http://www.bafg.de/GRDC/,
plement the results in this study where we focused more on last access: 9 December 2019), from national ministries and me-
comparatively wet regions. teorological agencies, and from the WATCH project (http://www.
Moreover, our findings suggest that, across Europe and eu-watch.org, last access: 9 December 2019).
regions with similar climate, gridded runoff data sets (e.g.,
Gudmundsson and Seneviratne, 2016) inevitably suffer from
Financial support. This research has been supported by the Ger-
the existing uncertainty in state-of-the-art precipitation data
man Research Foundation (Emmy Noether; grant no. 391059971)
sets, although this depends on the extent to which they rely
and the Ministry of Science, Research and Technology (MSRT) of
on precipitation data. In contrast, gridded ET products (e.g., the Islamic Republic of Iran.
Martens et al., 2017; Jung et al., 2019) are not impacted
by precipitation uncertainty in these regions. In warmer and The article processing charges for this open-access
drier regions, however, the gridded ET products are more publication were covered by the Max Planck Society.
challenged than the runoff products.
https://doi.org/10.5194/hess-24-3725-2020 Hydrol. Earth Syst. Sci., 24, 3725–3735, 20203732 A. Fallah et al.: Climate-dependent propagation of precipitation uncertainty into the water cycle
Review statement. This paper was edited by Graham Jewitt and re- 22 precipitation datasets using gauge observations and hydro-
viewed by Massimiliano Zappa and one anonymous referee. logical modeling, Hydrol. Earth Syst. Sci., 21, 6201–6217,
https://doi.org/10.5194/hess-21-6201-2017, 2017b.
Beck, H. E., Wood, E. F., McVicar, T. R., Zambrano-Bigiarini,
M., Alvarez-Garreton, C., Baez-Villanueva, O. M., Sheffield,
References J., and Karger, D. N.: Bias correction of global high-
resolution precipitation climatologies using streamflow obser-
Abbott, B. W., Bishop, K., Zarnetske, J. P., Minaudo, C., Chapin, F. vations from 9372 catchments, J. Climate, 33, 1299–1315,
S., Krause, S., Hannah, D. M., Conner, L., Ellison, D., Godsey, https://doi.org/10.1175/JCLI-D-19-0332.1, 2019a.
S. E., Plont, S., Marçais, J., Kolbe, T., Huebner, A., Frei, R. J., Beck, H. E., Wood, E. F., Pan, M., Fisher, C. K., Miralles, D.
Hampton, T., Gu, S., Buhman, M., Sara Sayedi, S., Ursache, O., G., Dijk, A. I. J. M. v., McVicar, T. R., and Adler, R. F.:
Chapin, M., Henderson, K. D., and Pinay, G.: Human domination MSWEP V2 Global 3-Hourly 0.1◦ Precipitation: Methodology
of the global water cycle absent from depictions and perceptions, and Quantitative Assessment, B. Am. Meteorol. Soc., 100, 473–
Nat. Geosci., 12, 533–540, https://doi.org/10.1038/s41561-019- 500, https://doi.org/10.1175/BAMS-D-17-0138.1, 2019b.
0374-y, 2019. Behrangi, A., Khakbaz, B., Jaw, T. C., AghaKouchak, A., Hsu, K.,
Alexander, L. V., Bador, M., Roca, R., Contractor, S., Donat, M. and Sorooshian, S.: Hydrologic evaluation of satellite precipita-
G., and Nguyen, P. L.: Intercomparison of annual precipitation tion products over a mid-size basin, J. Hydrol., 397, 225–237,
indices and extremes over global land areas from in situ, space- https://doi.org/10.1016/j.jhydrol.2010.11.043, 2011.
based and reanalysis products, Environ. Res. Lett., 15, 055002, Bergström, S: Computer models of watershed hydrology The HBV
https://doi.org/10.1088/1748-9326/ab79e2, 2020. Model, Water Resources Publications, Highlands Ranch, CO,
Alijanian, M., Rakhshandehroo, G. R., Mishra, A. K., and 443–76, 1995.
Dehghani, M.: Evaluation of satellite rainfall climatol- Blöschl, G., Hall, J., Parajka, J., Perdigão, R. A. P., Merz, B.,
ogy using CMORPH, PERSIANN-CDR, PERSIANN, Arheimer, B., Aronica, G. T., Bilibashi, A., Bonacci, O., Borga,
TRMM, MSWEP over Iran, Int. J. Climatol., 37, 4896–4914, M., Čanjevac, I., Castellarin, A., Chirico, G. B., Claps, P., Fi-
https://doi.org/10.1002/joc.5131, 2017. ala, K., Frolova, N., Gorbachova, L., Gül, A., Hannaford, J.,
Alijanian, M., Reza Rakhshandehroo, G., Mishra, A., and De- Harrigan, S., Kireeva, M., Kiss, A., Kjeldsen, T. R., Kohnová,
hghani, M.: Evaluation of Remotely Sensed Precipitation Es- S., Koskela, J. J., Ledvinka, O., Macdonald, N., Mavrova-
timates using PERSIANN-CDR and MSWEP for Spatio- Guirguinova, M., Mediero, L., Merz, R., Molnar, P., Montanari,
Temporal Drought Assessment over Iran, J. Hydrol., 579, A., Murphy, C., Osuch, M., Ovcharuk, V., Radevski, I., Rogger,
124189, https://doi.org/10.1016/j.jhydrol.2019.124189, 2019. M., Salinas, J. L., Sauquet, E., Šraj, M., Szolgay, J., Viglione,
Alnahit, A. O., Mishra, A. K., and Khan, A. A.: Evaluation of high- A., Volpi, E., Wilson, D., Zaimi, K., and Živković, N.: Changing
resolution satellite products for streamflow and water quality as- climate shifts timing of European floods, Science, 357, 588–590,
sessment in a Southeastern US watershed, J. Hydrol., 27, 100660, https://doi.org/10.1126/science.aan2506, 2017.
https://doi.org/10.1016/j.ejrh.2019.100660, 2020. Blöschl, G., Hall, J., Viglione, A., Perdigão, R. A. P., Parajka, J.,
Arheimer, B., Pimentel, R., Isberg, K., Crochemore, L., Anders- Merz, B., Lun, D., Arheimer, B., Aronica, G. T., Bilibashi, A.,
son, J. C. M., Hasan, A., and Pineda, L.: Global catchment mod- Boháč, M., Bonacci, O., Borga, M., Čanjevac, I., Castellarin, A.,
elling using World-Wide HYPE (WWH), open data, and step- Chirico, G. B., Claps, P., Frolova, N., Ganora, D., Gorbachova,
wise parameter estimation, Hydrol. Earth Syst. Sci., 24, 535– L., Gül, A., Hannaford, J., Harrigan, S., Kireeva, M., Kiss, A.,
559, https://doi.org/10.5194/hess-24-535-2020, 2020. Kjeldsen, T. R., Kohnová, S., Koskela, J. J., Ledvinka, O., Mac-
Balsamo, G., Agusti-Panareda, A., Albergel, C., Arduini, G., Bel- donald, N., Mavrova-Guirguinova, M., Mediero, L., Merz, R.,
jaars, A., Bidlot, J., Blyth, E., Bousserez, N., Boussetta, S., Molnar, P., Montanari, A., Murphy, C., Osuch, M., Ovcharuk,
Brown, A., Buizza, R., Buontempo, C., Chevallier, F., Choulga, V., Radevski, I., Salinas, J. L., Sauquet, E., Šraj, M., Szolgay, J.,
M., Cloke, H., Cronin, M. F., Dahoui, M., De Rosnay, P., Volpi, E., Wilson, D., Zaimi, K., and Živković, N.: (Changing
Dirmeyer, P. A., Drusch, M., Dutra, E., Ek, M. B., Gentine, climate both increases and decreases European river floods, Na-
P., Hewitt, H., Keeley, S. P. E., Kerr, Y., Kumar, S., Lupu, C., ture, 573, 108–111, https://doi.org/10.1038/s41586-019-1495-6,
Mahfouf, J.-F., McNorton, J., Mecklenburg, S., Mogensen, K., 2019.
Muñoz-Sabater, J., Orth, R., Rabier, F., Reichle, R., Ruston, Brocca, L., Filippucci, P., Hahn, S., Ciabatta, L., Massari, C., Cam-
B., Pappenberger, F., Sandu, I., Seneviratne, S. I., Tietsche, S., ici, S., Schüller, L., Bojkov, B., and Wagner, W.: SM2RAIN–
Trigo, I. F., Uijlenhoet, R., Wedi, N., Woolway, R. I., and Zeng, ASCAT (2007–2018): global daily satellite rainfall data from
X.: Satellite and In Situ Observations for Advancing Global ASCAT soil moisture observations, Earth Syst. Sci. Data, 11,
Earth Surface Modelling: A Review, Remote Sens., 10, 2038, 1583–1601, https://doi.org/10.5194/essd-11-1583-2019, 2019.
https://doi.org/10.3390/rs10122038, 2018. Budyko, M. I. and Miller, D. H.: Climate and life, edited by: Miller,
Beck, H. E., van Dijk, A. I. J. M., Levizzani, V., Schellekens, D. H., Academic Press, New York, available at: https://trove.nla.
J., Miralles, D. G., Martens, B., and de Roo, A.: MSWEP: 3- gov.au/version/26211710 (last access: 9 December 2019), 1974.
hourly 0.25° global gridded precipitation (1979–2015) by merg- Caroletti, G. N., Coscarelli, R., and Caloiero, T.: Validation
ing gauge, satellite, and reanalysis data, Hydrol. Earth Syst. Sci., of Satellite, Reanalysis and RCM Data of Monthly Rain-
21, 589–615, https://doi.org/10.5194/hess-21-589-2017, 2017a. fall in Calabria (Southern Italy), Remote Sens., 11, 1625,
Beck, H. E., Vergopolan, N., Pan, M., Levizzani, V., van Dijk, https://doi.org/10.3390/rs11131625, 2019.
A. I. J. M., Weedon, G. P., Brocca, L., Pappenberger, F.,
Huffman, G. J., and Wood, E. F.: Global-scale evaluation of
Hydrol. Earth Syst. Sci., 24, 3725–3735, 2020 https://doi.org/10.5194/hess-24-3725-2020A. Fallah et al.: Climate-dependent propagation of precipitation uncertainty into the water cycle 3733 Contractor, S., Donat, M. G., Alexander, L. V., Ziese, M., Meyer- and management, J. Water Resour. Plan. Manag., 132, 129–132, Christoffer, A., Schneider, U., Rustemeier, E., Becker, A., Durre, https://doi.org/10.1061/(ASCE)0733-9496(2006)132:3(129), I., and Vose, R. S.: Rainfall Estimates on a Gridded Network 2006. (REGEN) – a global land-based gridded dataset of daily precipi- Fereidoon, M., Koch, M., and Brocca, L.: Predicting Rainfall tation from 1950 to 2016, Hydrol. Earth Syst. Sci., 24, 919–943, and Runoff Through Satellite Soil Moisture Data and SWAT https://doi.org/10.5194/hess-24-919-2020, 2020. Modelling for a Poorly Gauged Basin in Iran, Water, 11, 594, Copernicus Climate change Service (C3S), ERA5: Fifth gener- https://doi.org/10.3390/w11030594, 2019. ation of ECMWF atmospheric reanalyses of the global cli- Ghajarnia, N., Kalantari, Z., Orth, R., and Destouni, G.: Close mate, Copernicus Climate Change Service Climate Data Store co-variation between soil moisture and runoff emerging from (CDS), available at: https://cds.climate.copernicus.eu/cdsapp#!/ multi-catchment data across Europe, Sci. Rep., 10, 4817, home (last access: 9 December 2019), 2017. https://doi.org/10.1038/s41598-020-61621-y, 2020. Cornes, R., van der Schrier, G., van den Besselaar, E. J. M., and Golian, S., Javadian, M., and Behrangi, A.: On the use of satellite, Jones, P. D.: An Ensemble Version of the E-OBS Temperature gauge, and reanalysis precipitation products for drought studies, and Precipitation Datasets, J. Geophys. Res.-Atmos., 123, 9391– Environ. Res. Lett., 14, 075005, https://doi.org/10.1088/1748- 9409, https://doi.org/10.1029/2017JD028200, 2018. 9326/ab2203, 2019. Dee, D. P., Uppala, S. M., Simmons, A. J., Berrisford, P., Poli, Gudmundsson, L. and Seneviratne, S. I.: Observation-based grid- P., Kobayashi, S., Andrae, U., Balmaseda, M. A., Balsamo, G., ded runoff estimates for Europe (E-RUN version 1.1), Earth Syst. Bauer, P., Bechtold, P., Beljaars, A. C. M., van de Berg, L., Bid- Sci. Data, 8, 279–295, https://doi.org/10.5194/essd-8-279-2016, lot, J., Bormann, N., Delsol, C., Dragani, R., Fuentes, M., Geer, 2016. A. J., Haimberger, L., Healy, S. B., Hersbach, H., Hólm, E. V., Hu, Z., Hu, Q., Zhang, C., Chen, X., and Li, Q.: Evaluation of re- Isaksen, L., Kållberg, P., Köhler, M., Matricardi, M., McNally, analysis, spatially interpolated and satellite remotely sensed pre- A. P., Monge-Sanz, B. M., Morcrette, J.-J., Park, B.-K., Peubey, cipitation data sets in central Asia, J. Geophys. Res.-Atmos., 121, C., de Rosnay, P., Tavolato, C., Thépaut, J.-N., and Vitart, F.: The 5648–5663, https://doi.org/10.1002/2016JD024781, 2016. ERA-Interim reanalysis: configuration and performance of the Jenicek, M., Seibert, J., Zappa, M., Staudinger, M., and Jonas, T.: data assimilation system, Q. J. Roy. Meteor. Soc., 137, 553–597, Importance of maximum snow accumulation for summer low https://doi.org/10.1002/qj.828, 2011. flows in humid catchments, Hydrol. Earth Syst. Sci., 20, 859– Dembélé, M., Schaefli, B., van de Giesen, N., and Mariéthoz, G.: 874, https://doi.org/10.5194/hess-20-859-2016, 2016. Suitability of 17 rainfall and temperature gridded datasets for Jones, P. W.: First- and Second-Order Conservative Remap- largescale hydrological modelling in West Africa, Hydrol. Earth ping Schemes for Grids in Spherical Coordinates, Mon. Syst. Sci. Discuss., https://doi.org/10.5194/hess-2020-68, in re- Weather Rev., 127, 2204–2210, https://doi.org/10.1175/1520- view, 2020. 0493(1999)1272.0.CO;2, 1999. Denissen, J. M. C., Teuling, A. J., Reichstein, M., and Orth, Jung, M., Koirala, S., Weber, U., Ichii, K., Gans, F., Camps-Valls, R.: Critical soil moisture derived from satellite observations G., Papale, D., Schwalm, C., Tramontana, G., and Reichstein, over Europe, J. Geophys. Res.-Atmos., 125, e2019JD031672, M.: The FLUXCOM ensemble of global land-atmosphere en- https://doi.org/10.1029/2019JD031672, 2020. ergy fluxes, Sci. Data, 6, 74, https://doi.org/10.1038/s41597-019- Dinku, T., Chidzambwa, S., Ceccato, P., Connor, S. J., and Ro- 0076-8, 2019. pelewski, C. F.: Validation of high-resolution satellite rainfall Kirtman, B., Power, S. B., Adedoyin, J. A., Boer, G. J., Bojariu, products over complex terrain, Int. J. Remote Sens., 29, 4097– R., Camilloni, I., Doblas-Reyes, F. J., Fiore, A. M., Kimoto, M., 4110, https://doi.org/10.1080/01431160701772526, 2008. Meehl, G. A., Prather, M., Sarr, A., Schär, C., Sutton, R., van Duethmann, D., Blöschl, G., and Parajka, J.: Why does a conceptual Oldenborgh, G. J., Vecchi, G., and Wang, H. J.: Near-term Cli- hydrological model fail to correctly predict discharge changes in mate Change: Projections and Predictability, in: Climate Change response to climate change?, Hydrol. Earth Syst. Sci., 24, 3493– 2013: The Physical Science Basis, Contribution of Working 3511, https://doi.org/10.5194/hess-24-3493-2020, 2020. Group I to the Fifth Assessment Report of the Intergovernmen- Ebert, E. E., Janowiak, J. E., and Kidd, C.: Comparison of Near- tal Panel on Climate Change, edited by: Stocker, T. F., Qin, D., Real-Time Precipitation Estimates from Satellite Observations Plattner, G.-K., Tignor, M., Allen, S. K., Boschung, J., Nauels, and Numerical Models, B. Am. Meteorol. Soc., 88, 47–64, A., Xia, Y., Bex, V., and Midgley, P. M., Cambridge University https://doi.org/10.1175/BAMS-88-1-47, 2007. Press, Cambridge, United Kingdom, New York, NY, USA, 953– Ehsan Bhuiyan, M. A., Nikolopoulos, E. I., Anagnostou, E. N., 1028, https://doi.org/10.1017/CBO9781107415324.023, 2013. Polcher, J., Albergel, C., Dutra, E., Fink, G., Martínez-de la Koster, R. D. and Mahanama, S. P. P.: Land Surface Controls on Hy- Torre, A., and Munier, S.: Assessment of precipitation error prop- droclimatic Means and Variability, J. Hydrometeorol., 13, 1604– agation in multi-model global water resource reanalysis, Hydrol. 1620, https://doi.org/10.1175/JHM-D-12-050.1, 2012. Earth Syst. Sci., 23, 1973–1994, https://doi.org/10.5194/hess-23- Koster, R. D., Dirmeyer, P. A., Guo, Z., Bonan, G., Chan, E., 1973-2019, 2019. Cox, P., Gordon, C. T., Kanae, S., Kowalczyk, E., Lawrence, Fallah, A., Rakhshandehroo, G. R., Berg, P., O, S., and Orth, D., Liu, P., Lu, C.-H., Malyshev, S., McAvaney, B., Mitchell, R.: Evaluation of precipitation datasets against local observa- K., Mocko, D., Oki, T., Oleson, K., Pitman, A., Sud, Y. C., tions in Southwestern Iran, Int. J. Climatol., 40, 4102–4116, Taylor, C. M., Verseghy, D., Vasic, R., Xue, Y., and Ya- https://doi.org/10.1002/joc.6445, 2020. mada, T.: Regions of Strong Coupling Between Soil Mois- Falkenmark, M. and Rockström, J.: The new blue and green water ture and Precipitation, Science, 305, 5687, https://doi.org/1138- paradigm: breaking new ground for water resources planning 1140/10.1126/science.1100217, 2004. https://doi.org/10.5194/hess-24-3725-2020 Hydrol. Earth Syst. Sci., 24, 3725–3735, 2020
3734                      A. Fallah et al.: Climate-dependent propagation of precipitation uncertainty into the water cycle

Koutsouris, A. J., Chen, D., and Lyon, S. W.: Comparing global          O, S., Dutra, E., and Orth, R.: Process-based models show com-
  precipitation data sets in eastern Africa: a case study of              paratively robust performance in changing climatic conditions, J.
  Kilombero Valley, Tanzania, Int. J. Climatol., 36, 2000–2014,           Hydrometeorol., accepted, 2020.
  https://doi.org/10.1002/joc.4476, 2016.                               Oki, T. and Kanae, S.: Global Hydrological Cycles and
Levizzani, V. and Cattani, E.: Satellite Remote Sensing of Precipita-     World Water Resources, Science, 313, 1068–1072,
  tion and the Terrestrial Water Cycle in a Changing Climate, Re-         https://doi.org/10.1126/science.1128845, 2006.
  mote Sens., 11, 2301, https://doi.org/10.3390/rs11192301, 2019.       Orth, R. and Seneviratne, S. I.: Using soil moisture forecasts
Martens, B., Miralles, D. G., Lievens, H., van der Schalie, R., de        for sub-seasonal summer temperature predictions in Europe,
  Jeu, R. A. M., Fernández-Prieto, D., Beck, H. E., Dorigo, W. A.,        Clim. Dynam., 43, 3403–3418, https://doi.org/10.1007/s00382-
  and Verhoest, N. E. C.: GLEAM v3: satellite-based land evapora-         014-2112-x, 2014.
  tion and root-zone soil moisture, Geosci. Model Dev., 10, 1903–       Orth, R. and Seneviratne, S. I.: Introduction of a simple-model-
  1925, https://doi.org/10.5194/gmd-10-1903-2017, 2017.                   based land surface dataset for Europe, Environ. Res. Lett., 10,
Massari, C., Crow, W., and Brocca, L.: An assessment of                   044012, https://doi.org/10.1088/1748-9326/10/4/044012, 2015.
  the performance of global rainfall estimates without ground-          Orth, R. and Destouni G.: Drought reduces blue-water fluxes more
  based observations, Hydrol. Earth Syst. Sci., 21, 4347–4361,            strongly than green-water fluxes in Europe, Nat. Commun., 9,
  https://doi.org/10.5194/hess-21-4347-2017, 2017.                        3602, https://doi.org/10.1038/s41467-018-06013-7, 2018.
Massari, C., Brocca, L., Pellarin, T., Abramowitz, G., Filippucci,      Orth, R., Staudinger, M., Seneviratne, S. I., Seibert, J., and Zappa,
  P., Ciabatta, L., Maggioni, V., Kerr, Y., and Fernandez Pri-            M.: Does model performance improve with complexity? A case
  eto, D.: A daily 25 km short-latency rainfall product for data-         study with three hydrological models, J. Hydrol., 523, 147–159,
  scarce regions based on the integration of the Global Precipi-          https://doi.org/10.1016/j.jhydrol.2015.01.044, 2015.
  tation Measurement mission rainfall and multiple-satellite soil       Pan, S., Pan, N., Tian, H., Friedlingstein, P., Sitch, S., Shi, H., Arora,
  moisture products, Hydrol. Earth Syst. Sci., 24, 2687–2710,             V. K., Haverd, V., Jain, A. K., Kato, E., Lienert, S., Lombar-
  https://doi.org/10.5194/hess-24-2687-2020, 2020.                        dozzi, D., Nabel, J. E. M. S., Ottlé, C., Poulter, B., Zaehle, S., and
Mazzoleni, M., Brandimarte, L., and Amaranto, A.:                         Running, S. W.: Evaluation of global terrestrial evapotranspira-
  Evaluating precipitation datasets for large-scale dis-                  tion using state-of-the-art approaches in remote sensing, machine
  tributed hydrological modelling, J. Hydrol., 578, 124076,               learning and land surface modeling, Hydrol. Earth Syst. Sci., 24,
  https://doi.org/10.1016/j.jhydrol.2019.124076, 2019.                    1485–1509, https://doi.org/10.5194/hess-24-1485-2020, 2020.
McKay, M. D., Beckman, R. J., and Conover, W. J.: Comparison            Roca, R., Alexander, L. V., Potter, G., Bador, M., Jucá, R., Con-
  of Three Methods for Selecting Values of Input Variables in             tractor, S., Bosilovich, M. G., and Cloché, S.: FROGS: a daily
  the Analysis of Output from a Computer Code, Technometrics,             1° × 1° gridded precipitation database of rain gauge, satellite
  21, 239–245, https://doi.org/10.1080/00401706.1979.10489755,            and reanalysis products, Earth Syst. Sci. Data, 11, 1017–1035,
  1979.                                                                   https://doi.org/10.5194/essd-11-1017-2019, 2019.
Mekonnen, G. B., Matula, S., Doležal, F., and Fišák, J.: Adjust-        Saha, S., Moorthi, S., Pan, H.-L., Wu, X., Wang, J., Nadiga, S.,
  ment to rainfall measurement undercatch with a tipping-bucket           Tripp, P., Kistler, R., Woollen, J., Behringer, D., Liu, H., Stokes,
  rain gauge using ground-level manual gauges, Meteorol. Atmos.           D., Grumbine, R., Gayno, G., Wang, J., Hou, Y.-T., Chuang, H.-
  Phys., 127, 241–256, https://doi.org/10.1007/s00703-014-0355-           y., Juang, H.-M. H., Sela, J., Iredell, M., Treadon, R., Kleist,
  z, 2015.                                                                D., Delst, P. V., Keyser, D., Derber, J., Ek, M., Meng, J., Wei,
Moriasi, D., Arnold, J., Van Liew, M., Bingner, R., Harmel, R., and       H., Yang, R., Lord, S., Dool, H. v. d., Kumar, A., Wang, W.,
  Veith, T.: Model evaluation guidelines for systematic quantifica-       Long, C., Chelliah, M., Xue, Y., Huang, B., Schemm, J.-K.,
  tion of accuracy in watershed simulations, T. ASABE, 50, 885,           Ebisuzaki, W., Lin, R., Xie, P., Chen, M., Zhou, S., Higgins, W.,
  https://doi.org/10.13031/2013.23153, 2007.                              Zou, C.-Z., Liu, Q., Chen, Y., Han, Y., Cucurull, L., Reynolds, R.
Motovilov, Y. G., Gottschalk, L., Engeland, K., and Rodhe,                W., Rutledge, G., and Goldberg, M.: The NCEP Climate Fore-
  A.: Validation of a distributed hydrological model against              cast System Reanalysis, B. Am. Meteorol. Soc., 91, 1015–1058,
  spatial observations, Agr. Forest Meteorol., 98–99, 257–277,            https://doi.org/10.1175/2010bams3001.1, 2010.
  https://doi.org/10.1016/S0168-1923(99)00102-1, 1999.                  Saha, S., Moorthi, S., Wu, X., Wang, J., Nadiga, S., Tripp,
Nash, J. E. and Sutcliffe, J. V.: River flow forecasting through con-     P., Behringer, D., Hou, Y., Chuang, H., Iredell, M., Ek,
  ceptual models part I – A discussion of principles, J. Hydrol., 10,     M., Meng, J., Yang, R., Mendez, M. P., van den Dool, H.,
  282–290, https://doi.org/10.1016/0022-1694(70)90255-6, 1970.            Zhang, Q., Wang, W., Chen, M., and Becker, E.: NCEP Cli-
Nerini, D., Zulkafli, Z., Wang, L.-P., Onof, C., Buytaert, W.,            mate Forecast System Version 2 (CFSv2) Monthly Products,
  Lavado-Casimiro, W., and Guyot, J.-L.: A Comparative Anal-              https://doi.org/10.5065/D69021ZF, 2012.
  ysis of TRMM – Rain Gauge Data Merging Techniques                     Satgé, F., Defrance, D., Sultan, B., Bonnet, M.-P., Seyler, F.,
  at the Daily Time Scale for Distributed Rainfall – Runoff               Rouché, N., Pierron, F., and Paturel, J.-E.: Evaluation of 23 grid-
  Modeling Applications, J. Hydrometeorol., 16, 2153–2168,                ded precipitation datasets across West Africa, J. Hydrol., 581,
  https://doi.org/10.1175/JHM-D-14-0197.1, 2015.                          124412, https://doi.org/10.1016/j.jhydrol.2019.124412, 2020.
O, S. and Kirstetter, P.-E.: Evaluation of diurnal variation of GPM     Schellekens, J., Dutra, E., Martínez-de la Torre, A., Balsamo,
  IMERG-derived summer precipitation over the contiguous US               G., van Dijk, A., Sperna Weiland, F., Minvielle, M., Cal-
  using MRMS data, Q. J. Roy. Meteorol. Soc., 144, 270–281,               vet, J.-C., Decharme, B., Eisner, S., Fink, G., Flörke, M.,
  https://doi.org/10.1002/qj.3218, 2018.                                  Peßenteiner, S., van Beek, R., Polcher, J., Beck, H., Orth,
                                                                          R., Calton, B., Burke, S., Dorigo, W., and Weedon, G. P.: A

Hydrol. Earth Syst. Sci., 24, 3725–3735, 2020                                              https://doi.org/10.5194/hess-24-3725-2020
A. Fallah et al.: Climate-dependent propagation of precipitation uncertainty into the water cycle 3735 global water resources ensemble of hydrological models: the Whan, K., Zscheischler, J., Orth, R., Shongwe, M., Rahimi, M., eartH2Observe Tier-1 dataset, Earth Syst. Sci. Data, 9, 389–413, Asare, E. O., and Seneviratne, S. I.: Impact of soil moisture on https://doi.org/10.5194/essd-9-389-2017, 2017. extreme maximum temperatures in Europe, Weather and Climate Schulzweida, Uwe.: CDO User Guide (Version 1.9.6), Zenodo, Extremes, 9, 57–67, https://doi.org/10.1016/j.wace.2015.05.001, https://doi.org/10.5281/zenodo.2558193, 2019. 2015. Sevruk, B., Ondrás, M., and Chvíla, B.: The WMO precipita- Xu, L., Chen, N., Moradkhani, H., Zhang, X., and Hu, C.: tion measurement intercomparisons, Atmos. Res., 92, 376–380, Improving Global Monthly and Daily Precipitation Estima- https://doi.org/10.1016/j.atmosres.2009.01.016, 2009. tion by Fusing Gauge Observations, Remote Sensing, and Re- Sharifi, E., Eitzinger, J., and Dorigo, W.: Performance of the State- analysis Data Sets, Water Resour. Res., 56, e2019WR026444, Of-The-Art Gridded Precipitation Products over Mountainous https://doi.org/10.1029/2019WR026444, 2020. Terrain: A Regional Study over Austria, Remote Sens., 11, 2018, Zandler, H., Haag, I., and Samimi, C.: Evaluation needs and tem- https://doi.org/10.3390/rs11172018, 2019. poral performance differences of gridded precipitation prod- Stahl, K., Hisdal, H., Hannaford, J., Tallaksen, L. M., van Lanen, ucts in peripheral mountain regions, Sci. Rep., 9, 15118, H. A. J., Sauquet, E., Demuth, S., Fendekova, M., and Jódar, J.: https://doi.org/10.1038/s41598-019-51666-z, 2019. Streamflow trends in Europe: evidence from a dataset of near- Zheng, H., Yang, Z.-L., Lin, P., Wei, J., Wu, W.-Y., Li, L., natural catchments, Hydrol. Earth Syst. Sci., 14, 2367–2382, Zhao, L., and Wang, S.: On the Sensitivity of the Precipita- https://doi.org/10.5194/hess-14-2367-2010, 2010. tion Partitioning Into Evapotranspiration and Runoff in Land Sun, Q., Miao, C., Duan, Q., Ashouri, H., Sorooshian, S., and Hsu, Surface Parameterizations, Water Resour. Res., 55, 95–111, K.-L.: A Review of Global Precipitation Data Sets: Data Sources, https://doi.org/10.1029/2017WR022236, 2019. Estimation, and Intercomparisons, Rev. Geophys., 56, 79–107, Zhou, X., Polcher, J., Yang, T., and Huang, C.-S.: A new uncertainty https://doi.org/10.1002/2017RG000574, 2018. estimation approach with multiple datasets and implementation Tebaldi, C. and Knutti, R.: The use of the multi-model ensemble for various precipitation products, Hydrol. Earth Syst. Sci., 24, in probabilistic climate projections, Philos. T. R. Soc. A, 365, 2061–2081, https://doi.org/10.5194/hess-24-2061-2020, 2020. 2053–2075, https://doi.org/10.1098/rsta.2007.2076, 2007. Ziese, M., Rauthe-Schöch, A., Becker, A., Finger, P., Meyer- Thiemig, V., Rojas, R., Zambrano-Bigiarini, M., and De Roo, A., Christoffer, A., and Schneider, U.: GPCC Full Data Daily Hydrological evaluation of satellite-based rainfall estimates over Version.2018 at 1.0◦ : Daily Land-Surface Precipitation the Volta and Baro-Akobo Basin, J. Hydrol., 499, 324–338, from Rain-Gauges built on GTS-based and Historic Data, https://doi.org/10.1016/j.jhydrol.2013.07.012, 2013. https://doi.org/10.5676/DWD_GPCC/FD_D_V2018_100, 2018. https://doi.org/10.5194/hess-24-3725-2020 Hydrol. Earth Syst. Sci., 24, 3725–3735, 2020
You can also read