Populus euphratica Phenology and Its Response to Climate Change in the Upper Tarim River Basin, NW China
←
→
Page content transcription
If your browser does not render page correctly, please read the page content below
Article

Populus euphratica Phenology and Its Response to Climate
Change in the Upper Tarim River Basin, NW China
Hualin Li 1,2,†, Jianzhong Feng 3,†, Linyan Bai 2,* and Jianjun Zhang 1

                                          1 College of Soil and Water Conservation, Beijing Forestry University, Beijing 100083, China;
                                            lihualin@bjfu.edu.cn (H.L.); zhangjianjun@bjfu.edu.cn (J.Z.)
                                          2 Key Laboratory of Digital Earth Science, Aerospace Information Research Institute,

                                            Chinese Academy of Sciences, Beijing 100094, China
                                          3 Agricultural Information Institute, Chinese Academy of Agricultural Sciences, Beijing 100081, China;

                                            fengjianzhong@caas.cn
                                          * Correspondence: baily@aircas.ac.cn; Tel.: +86-13-71804-4787
                                          † These authors equally contributed to this work.

                                          Abstract: Quantifying the phenological variations of Populus euphratica Olivier (P. euphratica) result-
                                          ing from climate change is vital for desert ecosystems. There has previously been great progress in
                                          the influence of climate change on vegetation phenology, but knowledge of the variations in P. eu-
                                          phratica phenology is lacking in extremely arid areas. In this study, a modified method was proposed
                                          to explore P. euphratica phenology and its response to climate change using 18-year Global Land
                                          Surface Satellite (GLASS) leaf area index (LAI) time series data (2000–2017) in the upper Tarim River
                                          basin. The start of the growing season (SOS), length of the growing season (LOS), and end of the
                                          growing season (EOS) were obtained with the dynamic threshold method from the reconstructed
                                          growth time series curve by using the Savitzky–Golay filtering method. The grey relational analysis
Citation: Li, H.; Feng, J.; Bai, L;       (GRA) method was utilized to analyze the influence between the phenology and the key climatic
Zhang, J. Populus euphratica Phenol-      periods and factors. Importantly, we also revealed the positive and negative effects between inter-
ogy and Its Response to Climate           annual climate factors and P. euphratica phenology using the canonical correlation analysis (CCA)
Change in the Upper Tarim River
                                          method, and the interaction between the SOS in spring and EOS in autumn. The results revealed
basin, NW China. Forests 2021, 12,
                                          that trends of P. euphratica phenology (i.e., SOS, EOS, and LOS) were not significant during the
1315.
                                          period from 2000–2017. The spring temperature and sunshine duration (SD) controlled the SOS, and
https://doi.org/10.3390/f12101315
                                          the EOS was mainly affected by the temperature and SD from June–November, although the im-
Academic Editor: Timothy A. Martin
                                          pacts of average relative humidity (RH) and precipitation (PR) on the SOS and EOS cannot be over-
                                          looked. Global warming may lead to SOS advance and EOS delay, and the increase in SD and PR
Received: 10 August 2021                  may lead to earlier SOS and later EOS. Runoff was found to be a more key factor for controlling P.
Accepted: 24 September 2021               euphratica phenology than PR in this region.
Published: 26 September 2021
                                          Keywords: Populus euphratica; Tarim River; phenology; climate change; leaf area index (LAI); dy-
Publisher’s Note: MDPI stays neu-         namic threshold method
tral with regard to jurisdictional
claims in published maps and institu-
tional affiliations.

                                          1. Introduction
                                               Vegetation phenology is the research of events in the plant life cycle, and how these
Copyright: © 2021 by the authors. Li-
                                          events adapt to climate changes [1,2], which makes it the most intuitive and sensitive bi-
censee MDPI, Basel, Switzerland.
                                          ological indicator of climate change. Climate change, such as modified precipitation, in-
This article is an open access article    creasing temperature, and increasing frequency of extreme weather events, will change
distributed under the terms and con-      the vegetation phenology [3], which will have extensive effects on plant community struc-
ditions of the Creative Commons At-       ture, plant distribution, energy cycles, vegetation ecosystems, and primary production of
tribution (CC BY) license (http://crea-   vegetation [4–8]. Altered phenological timing, furthermore, may have negative effects on
tivecommons.org/licenses/by/4.0/).        species interactions in the food chain, such as migration, survival, reproduction, and oc-

Forests 2021, 12, 1315. https://doi.org/10.3390/f12101315                                                               www.mdpi.com/journal/forests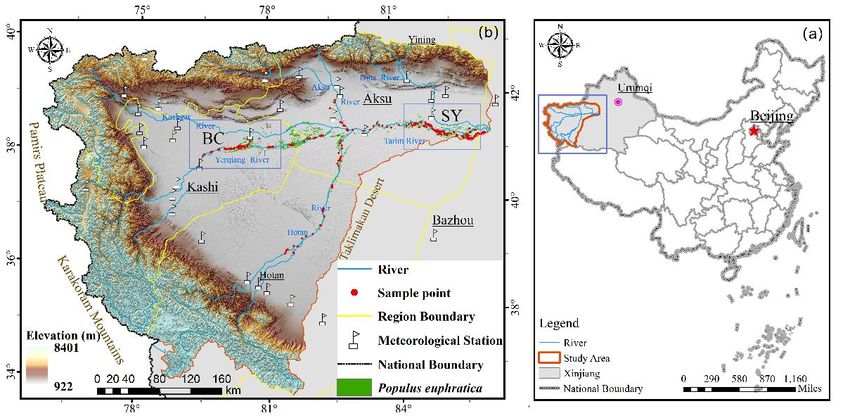
Forests 2021, 12, 1315                                                                                             2 of 19

                         cupying feeding habits [9,10]. Therefore, a better understanding of how vegetation phe-
                         nology responds to climate change can improve the accuracy of phenological simulation
                         models and provide a scientific reference for future management of vegetation ecosys-
                         tems.
                               Plant growth, including leaf unfolding, flowering, fruiting, and leaf senescence, has
                         been recorded to reflect the phenological characteristics of vegetation based on ground
                         monitoring sites of phenology. However, this method has some limitations in the spatio-
                         temporal scale and biome scale [11]. Therefore, the remote sensing technique for pheno-
                         logical monitoring, which is used to simulate various logistic regression models through
                         long-term series remote sensing data and to extract vegetation phenology (i.e., the start of
                         the growing season (SOS), length of the growing season (LOS), and end of the growing
                         season (EOS)) from suitable models, has been widely applied to explore the spatial–tem-
                         poral variations in vegetation phenology at the regional and global scales [12–17]. How-
                         ever, there is a wide range of mixed pixels in satellite remote sensing data, and the spatial
                         resolution of remote sensing data will affect the accuracy of vegetation phenological fea-
                         ture inversion, especially in the extreme arid areas where the vegetation distribution is
                         more sparse and the coverage is lower. In addition, previous studies on vegetation phe-
                         nology have focused on plant phenology change trends [18–20], phenology changes in
                         different vegetation types [21], temperature [22–24], rainfall [25–27], aspect [28], altitude
                         [23], solar radiation [29], and other single climatic factors affecting vegetation phenology.
                         Therefore, there is still a need to demonstrate the relationship of the preseason, interan-
                         nual, and multi-climatic factors with phenology, and what kind of interaction exists be-
                         tween the SOS and EOS.
                               Arid and semi-arid ecosystems are important parts of Earth’s climate system, cover-
                         ing 41% of the Earth’s land surface [30–32]. These regions are characterized by harsh en-
                         vironments and little rainfall, especially in extremely arid areas, where the average annual
                         rainfall is often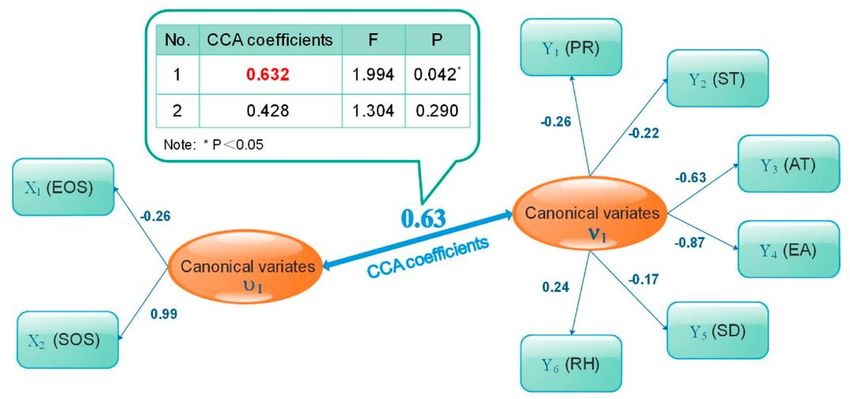
Forests 2021, 12, 1315                                                                                                 3 of 19

                         the end of the P. euphratica growing season influence each other. The results provide in-
                         sights into quantitative assessment of interannual variations of P. euphratica phenology
                         under climate change and provide a scientific reference for future management of the de-
                         sert ecosystem.

                         2. Study Area and Data
                         2.1. Study Area
                               Through field investigation, P. euphratica was found to be mainly distributed along
                         the upper reaches of the Tarim River and the Yerqiang River. Therefore, this investigation
                         mainly focused on the upper Tarim River and the Yeerqiang River basin, which was di-
                         vided into two regions (Figure 1b): Bachu (BC) and Shaya (SY). The study area experiences
                         a typical temperate arid continental climate, with long sunshine duration, strong annual
                         evaporation, and low annual rainfall. The extreme minimum temperature is −25 °C, the
                         extreme maximum temperature is 39.4 °C, and the annual average temperature is 10.4 °C
                         [34]. The annual average precipitation is 30–50 mm, and the annual potential evaporation
                         is 2000–2900 mm [43].

                         Figure 1. (a) Study area. (b) Sample points, meteorological stations, and typical sample area of Bachu
                         (BC) and Saya (SY) regions.

                         2.2. Data
                               The Global Land Surface Satellite (GLASS) leaf area index (LAI) has a temporal res-
                         olution of eight days and spans the period from 1981–2017. The LAI product from 1982–
                         1999 was developed from AVHRR reflectance with a spatial resolution of 0.05°, and that
                         from 2000–2017 with a spatial resolution of 1 km was derived from MODIS reflectance
                         [44]. The GLASS LAI data product is a national key project, and its dataset is superior to
                         other similar products in terms of spatial and temporal accuracy [45]. This product feature
                         has significant advantages in the continuity of its time series and the integrity of its spatial
                         scope [46]. Moreover, the GLASS LAI dataset has passed the verification analysis of the
                         measurement data of the common international site, with the results demonstrating that
                         the verification accuracy is higher than other similar products [47,48]. Since P. euphratica
                         has a small distribution area and low vegetation coverage, this study used the GLASS 1
                         km resolution data, which were from the National Earth System Science Data Sharing In-
                         frastructure, National Science & Technology Infrastructure of China (http://www.geo-
                         data.cn (14 October 2019)). A total of eighteen years of data from 2000–2017 were obtained,
                         and all the LAI values were the original values of the GLASS LAI dataset, which were
                         equal to 10 times the actual values.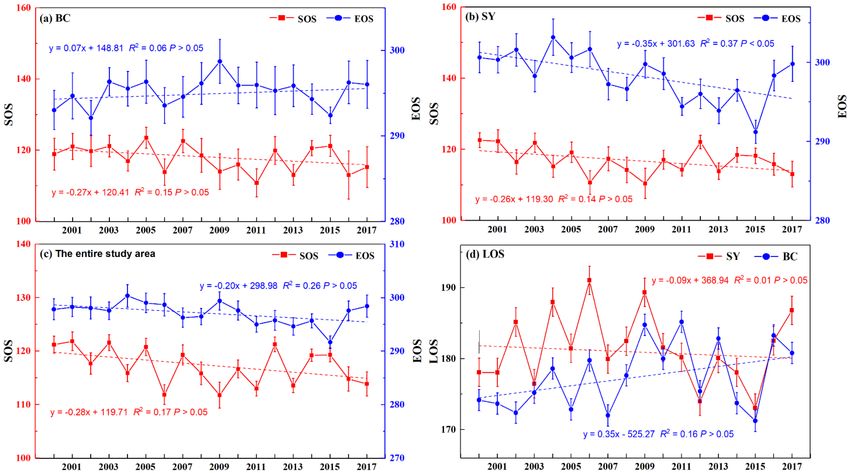
Forests 2021, 12, 1315                                                                                                 4 of 19

                              This study used climatic data, including sunshine duration (SD), average air temper-
                         ature (AT), average land surface temperature (ST), effective accumulated temperature
                         (EA), average relative humidity (RH), and precipitation (PR). These data were derived
                         from http://data.cma.cn/ (14 July 2021) from 1999–2018. Annual runoff data were derived
                         from the Statistical Bulletin of the Ministry of Water Resources of the People’s Republic of
                         China (http://www.mwr.gov.cn/sj/#tjgb (14 July 2021)). Additionally, in this study, based
                         on Landsat TM/OLI long time series remote sensing data with 30 m resolution from 1990–
                         2015, the distribution data of P. euphratica for 1990, 1995, 2000, 2005, 2010, and 2015 were
                         extracted using the object-oriented classification method. These data were then used to
                         select typical sample sites of P. euphratica.

                         3. Methods
                               The technique flowchart of this study is shown in Figure 2, the research steps were
                         as follows. (1) P. euphratica samples were selected and extracted from LAI time series data
                         using the sandwich spatial sampling method. The growth time series curve of P. euphratica
                         was then reconstructed using the Savitzky–Golay filtering method. (2) The phenological
                         features of P. euphratica, including the SOS, EOS, and LOS, were extracted using the dy-
                         namic threshold method. (3) The grey relational analysis (GRA) method was used to ana-
                         lyze the correlations between climatic factors and the SOS during three periods (spring,
                         SOS preseason, and annual), and the EOS during three periods (autumn, EOS preseason,
                         and annual). (4) The canonical correlation analysis (CCA) method was used to explore the
                         positive and negative effects between phenology (SOS, EOS) and interannual climatic fac-
                         tors (SD, AT, ST, EA, RH, and PR).

                         Figure 2. Schematic diagram of the extraction processes of henological features of P. euphratica. Ab-
                         breviations: Leaf area index (LAI), Global Land Surface Satellite (GLASS), sunshine duration (SD),
                         average air temperature (AT), average land surface temperature (ST), effective accumulated tem-
                         perature (EA), average relative humidity (RH), precipitation (PR), start of the growing season (SOS),
                         end of the growing season (EOS), Savitzky-Golay (S-G) filtering.

                         3.1. Extract LAI Features
                              Based on the distribution data of P. euphratica in 1990, 1995, 2005, 2010, and 2015, the
                         regional composition sample data of P. euphratica, which fully met the 1 km2 area criterion,
                         were automatically identified by a 1 km × 1 km square window. The typical sample points
                         were selected from high-resolution imagery (e.g., Google Earth imagery, Version 2018) by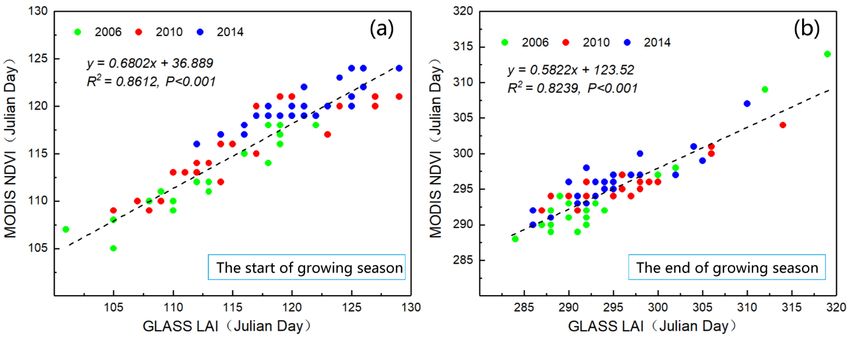
Forests 2021, 12, 1315 5 of 19
the Sandwich Spatial Sampling tool, which is developed based on spatial optimization
sampling strategy of Trinity theory. The LAI information was extracted from each sample
using the GLASS LAI products from 2000–2017.
3.2. Filtering and Reconstruction of LAI Curves
Although the GLASS LAI products have been processed to remove noise, the time
series information of the extracted sample points still exhibits the “pseudo” peak phenom-
enon. Thus, the Savitzky-Golay (S-G) filtering method was utilized to remove the noise
and reconstruct the LAI curves of P. euphratica. S-G filtering can be used with the time
series index data of different time scales and is not limited by sensor differences, so the
noise in the original data can be removed using the minimum root mean square error [49].
i =m
CY i j +1
(1)
Y j' = i =− m
N
where Yj is the resultant LAI value, Yj is the original LAI value, Ci is the coefficient for the
LAI value of the filter, and N is the number of convoluting integers and is equal to the
smoothing window size (2 m + 1).
3.3. Dynamic Threshold Method
The dynamic threshold method is widely utilized to extract phenological features of
vegetation because it has better spatio-temporal applicability [50,51]. In this method, the
SOS is defined as the time when the vegetation LAI increases by a certain percentage,
while the EOS is defined as the time when the vegetation LAI decreases by a certain per-
centage. The threshold used in this method is not a specific value, but a dynamic ratio.
When the dynamic threshold method was proposed to extract phenological features, Jöns-
son and Eklundh [52] suggested that the threshold at the SOS and EOS is 0.2, which has
been subsequently used by many scholars in phenological research. However, the choices
of threshold values depend on different plant species and different regions, so we had to
proceed cautiously and rigorously when selecting thresholds. In this study, we combined
remote sensing data with 2016 ground-based monitoring data and used the following pro-
cedure illustrated by the flow chart in Figure 3. The SOS and EOS values were obtained
using various dynamic thresholds (i.e., A1, A2) ranging from 0.1–0.4 at 0.02 intervals. Then,
the results were verified by using the ground-based monitoring data (Table 1). In terms
of these tests, we opted to use the thresholds of A = 0.2 and A2 = 0.3 to extract the SOS and
EOS of P. euphratica phenology in the study area from 2000 to 2017, respectively.
Table 1. Phenology (i.e., SOS and EOS) extracted from different thresholds (A1/A2) and ground-
based monitoring data in 2016.
A1/A2 SOS EOS A1/A2 SOS EOS
0.10 102.20 328.65 0.26 122.45 302.46
0.12 105.40 323.77 0.28 124.92 300.67
0.14 107.62 320.65 0.30 127.21 297.57
0.16 110.10 317.28 0.32 129.38 295.99
0.18 112.89 314.21 0.34 131.51 293.70
0.20 114.78 311.23 0.36 133.67 291.51
0.22 118.16 307.79 0.38 135.70 289.43
0.24 119.10 304.98 0.40 137.83 287.31
Observation data 114.98 298.14 ------ ------ ------
Note: A1 and A2 are thresholds of SOS and EOS, respectively.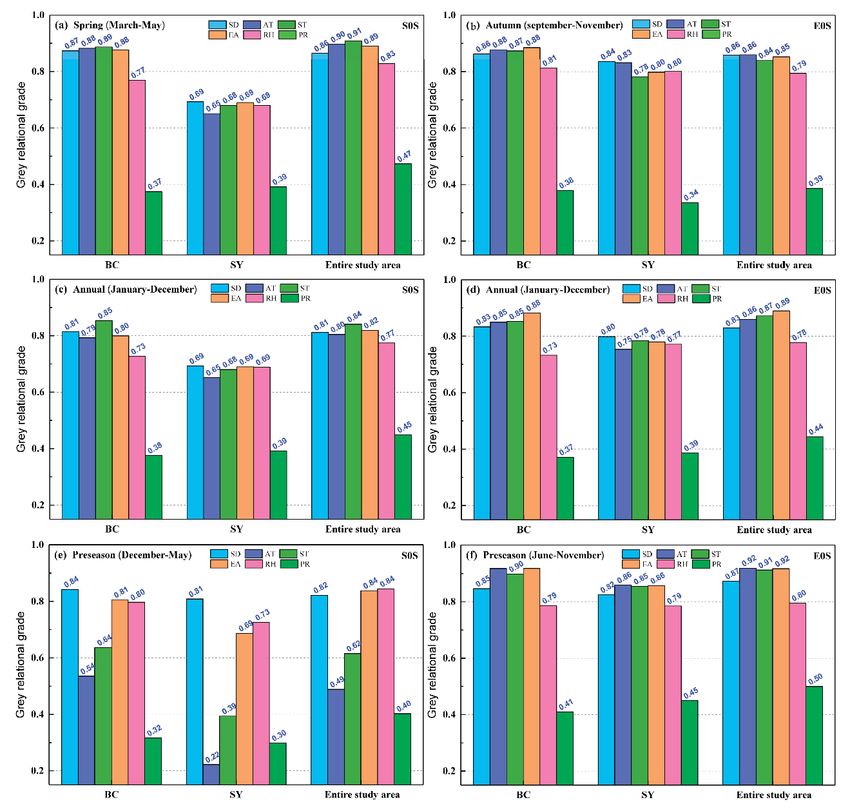
Forests 2021, 12, 1315 6 of 19
Figure 3. Flow chart of the dynamic threshold method used to extract the phenological features of
P. euphratica.
3.4. Grey Relational Analysis (GRA)
The relationship between many factors falls within a gray area, due to the limitations
of people’s understanding and the complexity of geographical phenomena, and it is diffi-
cult to objectively measure the degree of relevance by the relative correlation coefficient
method [53]. The grey relational analysis method makes up for the above shortcomings.
GRA is not limited by sample type and probability distribution, so it is a new method to
investigate uncertain problems under limited information and data [54,55]. Details of the
principles and computation steps of the PNPI were presented in Li et al. [53]. In this study,
the SOS is used as the reference factor sequences from 2000 to 2017, and the comparative
factor sequence consists of climatic factors (i.e., SD, AT, ST, EA, RH, and PR) during three
periods (spring, SOS preseason, and annual) from 2000 to 2017. The EOS from 2000 to 2017
is used as the reference factor sequence, and the comparative factor sequence consists of
climatic factors during three periods (autumn, EOS preseason, and annual). The correla-
tions between climatic factors and the P. euphratica phenology during different periods
were explored.
3.5. Canonical Correlation Analysis (CCA)
Canonical correlation is a statistical analysis method used to study the correlation
between two groups of variables and was first proposed by Hotelling in 1935 [56]. It is
also a dimensionality reduction technology, which is widely used in various fields [57].
Vegetation phenology is not only related to climatic factors, but also the physiological
characteristics of vegetation. The change in climatic factors may not lead to one-way phe-
nological changes due to the interaction effects between the SOS in spring and the EOS in
autumn [8,58]. It is not rigorous to use simple climatic data to describe these changes.
Therefore, the first set of variables (X1) consists of the EOS and SOS from 2000 to 2017 in
this study, and the interannual climatic factors (SD, AT, ST, EA, RH, and PR) during the
period of 2000–2017 as the second set of variables (Y1). The CCA method not only revealed
the relationship between SOS and EOS, but also explored the correlations between the P.
euphratica phenology and interannual climate factors. The principle and computation
steps are detailed in Hotelling [56].
4. Results
4.1. Monthly and Interannual Variations of Climate Variables
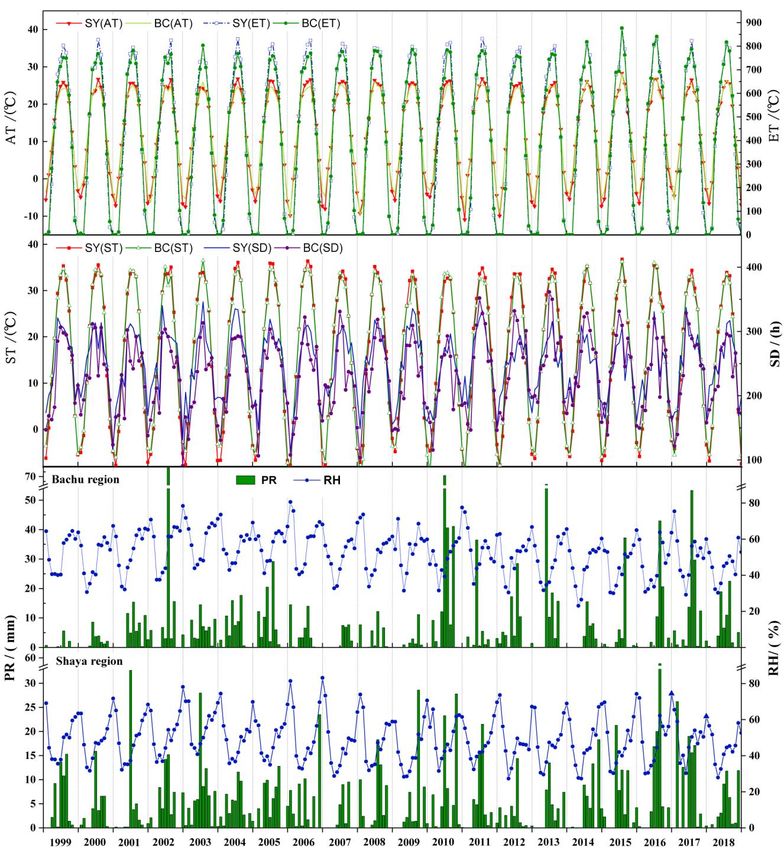
Figure 4 presents the monthly and interannual variations in SD, AT, ST, EA, RH, and
PR time series from 1999–2018 in the upper Tarim River basin (i.e., BC and SY). Generally,
the monthly and interannual variations trend of SD, AT, ST, EA, RH, and PR are consistent
in BC and SY regions, which have a typical temperate arid continental climate with strong
annual evaporation and low annual rainfall. The PR was scarce and mostly concentrated
from June to September with the highest value of 79.00 mm in July 2002 and 57.80 mm in
August 2016 in BC and SY regions, respectively. The annual PR of BC and SY ranged from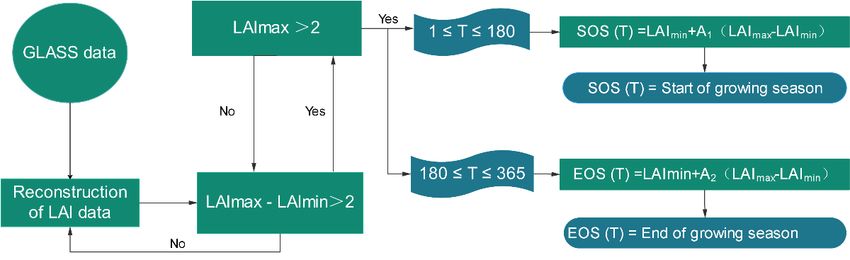
Forests 2021, 12, 1315                                                                                                       7 of 19

                                 8.70 mm (1999) to 183.90 mm (2010) and 24.80 mm (2007) to 107.00 mm (2016), respec-
                                 tively. The RH peaked in December, and the annual average RH was 44.42% (2018) and
                                 59.83% (2003). The AT peaked in July, and the highest average AT of BC and SY was 28.27
                                 °C (July 2015) and 28.28 °C (July 2015), respectively. From 1999–2018, the annual average
                                 AT was the highest (13.44 °C) in 2016 and the lowest (11.27 °C) in 2012 in this study area.
                                 The annual average ST ranged from 14.90 °C (2011) to 17.12 °C (2006). The annual SD
                                 ranged from 2574.60 h (2010) to 3077.00 h (2011) in the upper Tarim River basin, and the
                                 annual EA was 4420.50–5055.90 °C. The study showed that there was no significant trend
                                 in annual PR, SD, and EA, and annual average AT, EA, and ST from 1999–2018.

      Figure 4. Sunshine duration (SD), average air temperature (AT), average land surface temperature (ST), effective accumu-
      lated temperature (EA), average relative humidity (RH), and precipitation (PR) time series from 1999–2018 in Bachu region
      (BC) and Shaya region (SY).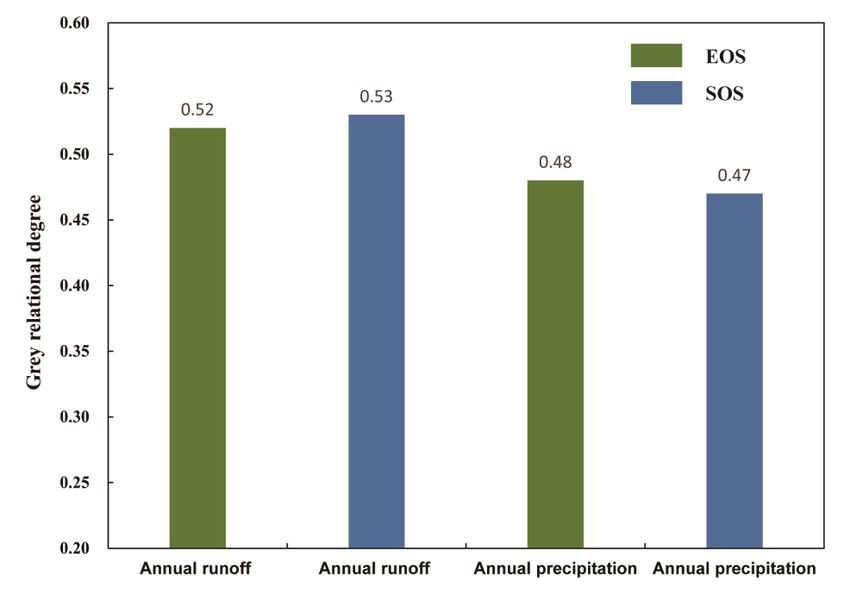
Forests 2021, 12, 1315                                                                                                    8 of 19

                                4.2. Interannual Variations of P. euphratica Phenology
                                     Interannual changes and P. euphratica phenology (SOS, LOS, EOS) are shown in Fig-
                                ure 5 in the upper Tarim River basin from 2000–2017. Generally, the upper Tarim River
                                basin showed advancing SOS from 2000–2017 and the EOS of P. euphratica was advanced,
                                but a slight lengthening in LOS was observed in the study area. However, it was found
                                that the interannual variation trends of the EOS, LOS, and SOS derived from GLASS LAI
                                data were not significant in the study time series. It is reasonable that a longer study time
                                series for GLASS LAI data should be considered to research P. euphratica phenology under
                                global climate change.

      Figure 5. Interannual changes in P. euphratica phenology (SOS, LOS, and EOS) in the upper Tarim River basin from 2000–
      2017. (a) Bachu region (BC), (b) Shaya region (SY), (c) entire study area, (d) LOS of BC and SY.

                                      As demonstrated in Figure 5a–c, the SOS of P. euphratica of BC and SY was advanced
                                from 2000–2017, the average SOS peaked in 2005 (124th, early May), and the troughs of
                                average SOS appeared in 2011 (111st, late April) in the BC regions. In the SY regions, how-
                                ever, the mean SOS of P. euphratica was the latest (123rd, early May) in 2000 and the earli-
                                est (111st, late April) in 2009. The 18-year average SOS of P. euphratica was on the 117th
                                day (late April) in the study area. BC showed delayed EOS, but this was different from
                                SY. The mean EOS of P. euphratica was the latest (299th, late October) in 2009 and the
                                earliest (292nd, late October) in 2002 in BC regions from 2000–2017. In the SY regions, the
                                average EOS of P. euphratica peaked in 2004 (303rd, early November) and the troughs of
                                average EOS appeared in 2015 (291st, late October). The 18-year average EOS of P. eu-
                                phratica was on the 297th day (late October) in the upper Tarim River basin. In Figure 5d,
                                the LOS of P. euphratica differs among the different regions (BC and SY) with the rank
                                order based on P. euphratica LOS being SY > BC, and the 18-year average LOS of BC and
                                SY regions were 177 and 181 days, respectively.
                                      Overall, the spatial heterogeneity of the P. euphratica phenology was higher, and the
                                changing trend of P. euphratica phenology varied in different regions (BC and SY). BC
                                showed delayed EOS, but in SY it was significantly advanced. The P. euphratica phenology
Forests 2021, 12, 1315 9 of 19
varied among different years in the same region, and the spatial heterogeneity of P. eu-
phratica phenology in the same year and region (BC or SY) was higher. This is reasonable
since climate, which is variable and complex, fundamentally determines the phenology
and interannual change trends of phenology.
4.3. Interannual Variations in P. euphratica Phenology
4.3.1. Effects of Key Climatic Periods and Factors
The GRA between phenology (SOS and EOS) and climatic factors (SD, AT, ST, EA,
RH, and PR) is presented in Figure 6. The SOS of P. euphratica was mainly affected by
spring climatic factors, while the EOS of P. euphratica was mainly affected by the EOS
preseason (June–November) meteorological factors. The SOS of P. euphratica was mainly
affected by the climatic factors (0.81) in spring (March–May) (Figure 6a), and less affected
by the annual (January–December) climatic factors (0.75) or the SOS preseason (Decem-
ber–May) climatic factors (0.67) (Figure 6c,e). Moreover, the influence of spring climatic
factors in the different regions (BC and ALE) on the SOS of P. euphratica was greater than
that of the annual climatic factors or the SOS preseason climatic factors.
Figure 6. Grey relational analysis between phenology (SOS and EOS) and climatic factors (SD, AT, ST, EA, RH, and PR).
(a) GRA between the SOS and climatic factors in spring (March–May), (b) GRA between the EOS and climatic factors in
autumn (September–November), (c) GRA between the SOS and the annual (January–December) climatic factors, (d) GRAForests 2021, 12, 1315 10 of 19
between the EOS and the annual (January–December) climatic factors, (e) GRA between the SOS and the SOS preseason
(December–May) climatic factors, (f) GRA between the EOS and the EOS preseason (June–November) climatic factors.
The EOS of P. euphratica was mainly affected by the EOS preseason (June–November)
meteorological factors (0.82) (Figure 6f), and less affected by the annual (January–Decem-
ber) climatic factors (0.78) or the meteorological factors (0.77) in autumn (September–No-
vember) (Figure 6b,d). Moreover, the influence of autumn climatic factors on the EOS of
P. euphratica was greater than that of the annual climatic factors or the EOS preseason
meteorological factors in the BC and SY regions. It indicated that spring climatic factors
(March–May) influence the SOS of P. euphratica more than climatic factors in other periods
(i.e., annual and preseason), and the EOS is more affected by the variations in climatic
factors from June to November.
Different climatic factors had different effects on phenology (Figure 6). The effects of
average ST (0.91), average AT (0.90), average EA (0.89), and SD (0.86) on the SOS of P.
euphratica were greater than those of average RH (0.82) and precipitation (0.47). The effects
of average AT (0.86), SD (0.86), average EA (0.85), and average ST (0.84) on the EOS of P.
euphratica were greater than those of average RH (0.79) and precipitation (0.39). Therefore,
we could infer that temperature (i.e., AT, ST, and EA) and SD controlled P. euphratica phe-
nology, although the impacts of RH and PR on P. euphratica phenology cannot be over-
looked in the upper Tarim River basin.
4.3.2. Exploration of the Relationships between SOS, EOS, and Interannual Climate
Figure 7 shows the CCA patterns between phenology (SOS and EOS) and climatic
factors (SD, AT, ST, EA, RH, and PR). A total of two pairs of canonical variables were
extracted, the first of which (U1, V1) was statistically significant (p < 0.05). The results
showed that the first pair of canonical correlation variables revealed a clear correlation
between phenology and climatic factors, as indicated by the canonical correlation coeffi-
cient of 0.63. The canonical variable U1 had a significant positive correlation with SOS but
a significant negative correlation with EOS, with typical load coefficients of −0.26 and 0.99,
respectively. The typical variable V1 had positive correlations with average RH with the
typical load coefficient of 0.24. V1 had negative correlations with PR, average ST, average
AT, EA, and SD, however, with typical load coefficients of −0.26, −0.22, −0.63, −0.87, −0.17,
respectively. These results generally indicated that the SOS had negative correlations with
PR, SD, and temperature (i.e., AT, ST, and EA), and a positive correlation with RH. The
EOS had positive correlations with PR and temperature, and negative correlations with
relative humidity.
Figure 7. Canonical correlation analysis patterns between phenology (SOS and EOS) and interan-
nual climatic factors (SD, AT, ST, EA, RH, and PR).Forests 2021, 12, 1315 11 of 19
The canonical redundancy analysis (Table 2) revealed that the first pair of canonical
variables U1 could explain 53.14% of the intragroup variation and 8.97% of the other group
variation. The typical variable V1, however, could explain 22.51% of the intragroup varia-
tion and 21.20% of the other group variation. Therefore, we could infer that the SOS and
EOS of P. euphratica affect each other. The phenology (SOS, EOS) of P. euphratica is not
only related to meteorological factors but also the physiological characteristics of P. eu-
phratica. Therefore, it was found that the SOS of P. euphratica was strongly related to EOS
with a high canonical correlation coefficient of 0.63, implying that a later SOS may gener-
ally be accompanied by a later EOS.
Table 2. Canonical redundancy analyses between U1 and V1.
X1 X2 Y1 Y2
U1 (%) 53.14 46.86 8.97 3.94
V1 (%) 21.20 8.60 22.51 21.46
Note: X1, X2, Y1, Y2, canonical variable.
5. Discussion
5.1. Validation of P. euphratica Phenology
Remote sensing monitoring of vegetation phenology is based on vegetation growth
characteristics (LAI, EVI, NDVI, and other features), and the vegetation phenology is sim-
ulated using a mathematical model. This method is different from the traditional ground
observation phenology method [11], but previous studies showed that the vegetation phe-
nology phase determined by remote sensing data was closely related to those obtained
from the ground phenology monitoring points [59]. This study was based on one year’s
worth of data from the ground phenology monitoring points of P. euphratica, and estab-
lished a mathematical model of P. euphratica phenology (Table 1). The phenological fea-
tures of P. euphratica, including the SOS, EOS, and LOS, were extracted using the dynamic
threshold method. To verify the accuracy of the research results and the applicability of
the method, based on the GLASS LAI and higher resolution of MODIS NDVI (MOD09Q1
V6) data in 2006, 2010, and 2014, 25 samples were randomly selected to compare and an-
alyze the results of key phenological phase extraction of P. euphratica through the process
flow chart steps in Figure 2. As shown in Figure 8, The results revealed that using the
GLASS LAI and MODIS NDVI to extract the phenology of P. euphratica yielded higher
correlations (SOS: R2 = 0.861, p < 0.001; EOS: R2 = 0.824, p < 0.001). Overall, this method
could quickly identify and extract the key phenological period of P. euphratica in a large
area, and this study’s findings are reliable and have scientific reference value for the study
of vegetation phenology, especially in extremely arid areas.Forests 2021, 12, 1315 12 of 19
Figure 8. Extraction of P. euphratica phenology based on MODIS NDVI and GLASS LAI data. (a) Start of the growing
season (SOS), (b) end of the growing season (EOS).
In addition, phenological research of P. euphratica in the Tarim River basin has been
rare, and other researchers [60–66] believe that air temperature is the main factor affecting
plant phenology in arid and semi-arid areas, and the accumulated temperature should
therefore be the condition used to judge P. euphratica phenology (Table 3). For example,
Zhao et al. [61,66], Liu et al. [64,65], Wu et al. [63], and Zhang et al. [62] monitored the
phenology of P. euphratica by taking the date the daily average temperature reached ≥5 °C
as the SOS of P. euphratica, and the date the daily average temperature reached ≤5 °C as
the EOS in Hexi Corridor. These results showed that the SOS of P. euphratica was early
March, which was earlier than the findings of this study. The EOS of P. euphratica was late
October, which was consistent with the findings of this study. However, our study
showed that the temperature (i.e., AT, ST, and EA) and SD were strongly related to phe-
nology (SOS, EOS) in the upper Tarim River basin. Moreover, vegetation phenology is
affected by many factors such as geographical factors and climatic factors. Therefore, us-
ing a single accumulated temperature as the criterion for judging the phenology of P. eu-
phratica cannot directly reflect this cycle, and this method is not rigorous.
Table 3. Canonical redundancy comparative study on the phenology of P. euphratica [60–66].
Study Area SOS (Mean) EOS (Mean) Method Data
Lower Tarim “phenological observation
late April mid-October ground observation data
River methods”
Lower Heihe daily mean temperature data from
late March late October accumulated temperature
River 1960–2010
Ejina Banner Oa- daily mean temperature data from
late March late October accumulated temperature
sis 1960–2010
daily mean temperature data from
Dunhuang Oasis late March late October accumulated temperature
1955–2010
daily mean temperature data from
Jiuquan Oasis late March late October accumulated temperature
1955–2010
daily mean temperature data from
Minqin Oasis late March late October accumulated temperature
1955–2010
daily mean temperature data from
China’s Oasis late March late October accumulated temperature
1960–2015
5.2. Relationships between Phenology of P. euphratica and Climatic FactorsForests 2021, 12, 1315 13 of 19
Previous researchers showed that the SOS of vegetation was advanced and EOS was
delayed with climate warming [67–70]. In this study, however, the SOS and EOS of P.
euphratica had an earlier trend, but the change was not significant in the upper Tarim River
basin from 2000–2017. Wu et al. [71] reported that there was no significant advance trend
in SOS from 1982–2016 in six temperate areas, and Zhang et al. [11] found that there was
no advanced trend of spring phenology and the rate of earlier SOS was slow with varia-
tions in climate from 2006–2017. Zhang et al.’s [11] study results implied that the trend of
EOS was not significant from 2006–2017, which was consistent with the findings of Li et
al. [72] and Shen et al. [8]. It is reasonable that the SOS displays a later trend and EOS
shows an earlier trend as the microclimate of this region is different. In addition, vegeta-
tion phenology is regional, which is closely related to species, geographical factors, and
climatic factors. The response of vegetation phenology to climate change is not universally
identical in different regions [73]. Therefore, it is necessary to explore the variations in P.
euphratica phenology and its response to climate change in extremely arid areas.
In this study, we found that temperature (i.e., AT, ST, and EA) and SD controlled P.
euphratica phenology, although the impacts of RH and PR on P. euphratica phenology can-
not be overlooked in the upper Tarim River basin. Importantly, Figure 9 revealed that the
SOS had negative correlations with PR, SD, and temperature (i.e., AT, ST, and EA), but a
positive correlation with RH, while the relationships between the EOS and meteorological
factors were the opposite. Air temperature is one of the main factors affecting the phenol-
ogy of P. euphratica, but precipitation has the least effect on phenology compared to other
climatic factors (i.e., AT, EA, ST, SD, RH) in the study area. The temperature increase may
lead to earlier SOS, which is attributed to the fact that increasing temperature can promote
the chemical reaction rate of vegetation to meet the thermal requirement for budburst and
leaf unfolding, and it can accelerate the rate of earlier SOS [8,11,74,75].
Figure 9. Grey relational analysis between phenology (SOS and EOS) and water (annual runoff and
annual precipitation).
Meanwhile, as reported in previous studies (e.g., Che et al. [73]; Dreesen et al. [76];
Anderegg et al. [77]) higher temperatures in spring and autumn will increase surface
evapotranspiration and decrease water availability, preventing plant photosynthesis and
growth, increasing plant death and chlorophyll degradation, and resulting in earlier EOS.
This study found that a temperature increase may lead to earlier SOS and later EOS, which
was similar to the findings of Wang et al. [67] and Tao et al. [78], who reported that aForests 2021, 12, 1315 14 of 19
temperature decrease may lead to later SOS and earlier EOS among different vegetation
types. In addition, the results of this study revealed that the SOS of P. euphratica was
strongly related to EOS with a high canonical correlation coefficient of 0.63, indicating that
a later SOS may generally be accompanied by a later EOS. This result was similar to the
findings of Wu et al. [58], who reported that SOS was positively correlated with EOS from
1997–2014.
5.3. Which has a Stronger Influence on Phenology, Runoff, or Precipitation?
Water is a key climatic factor restricting vegetation growth in arid areas [79,80]. The
phenological characteristics of P. euphratica in the Tarim River basin are affected by rainfall
and runoff. Rainfall directly increases soil moisture and provides direct absorption by the
roots of P. euphratica [81,82]. On the other hand, runoff compensates the groundwater so
the groundwater depth becomes shallow and is absorbed by the roots of P. euphratica
[34,43]. Based on the annual runoff and precipitation data, this study used the grey corre-
lation method to explore the grey correlation grade between P. euphratica phenology and
annual rainfall and runoff (Figure 9). The results demonstrated that the grey correlation
grade between runoff and phenology is higher than that between rainfall and phenology.
Precipitation is scarce in arid areas, and P. euphratica growth is not sensitive to precipita-
tion events, which is consistent with previous research results [83,84]. However, runoff
affects the growth of P. euphratica by replenishing the groundwater table, which is then
absorbed by the roots of P. euphratica, hence there is a certain lag effect [85]. Therefore, the
grey correlation grade of rainfall and runoff for the phenology of P. euphratica is low, but
runoff is still the dominant factor, which is easy to regulate and control. The regulation of
runoff and the stable control or reduction in shallow groundwater depth may weaken the
impact of global climate change on the phenology of P. euphratica.
5.4. Limitations
Through field investigation, the concentrated distribution of P. euphratica has been
found to be decreased [86,87]. P. euphratica has gradually declined due to climate changes
and disturbance by human activities, and its vegetation coverage is low [34,85]. The re-
trieval accuracy of the spatio-temporal patterns of P. euphratica phenology using 1 km × 1
km GLASS LAI remote sensing data is not high. Moreover, considering that there is a
wide range of mixed pixels in satellite remote sensing data, the spatial resolution of re-
mote sensing data will affect the accuracy of P. euphratica phenological feature inversion.
Therefore, to solve the above two problems, this study utilized a grid spatial sampling
strategy to select typical sample areas in order to obtain P. euphratica phenological infor-
mation, thereby reducing the impact of the above two problems to explore the changing
trend of P. euphratica phenology in arid areas and its response to climate change. This
paper has provided an approach in which the satellite product data are used to reveal the
interannual variations of the phenology of the vegetation, plant community, and a specific
tree species, of which the spatial aggregation and coverage are low.
Yang et al. [88] found that the preseasons of EOS were defined as 1–6 months before
early November, and the preseason temperature is the major control factor of the dor-
mancy onset date. Fu et al. [89] defined May to October as the EOS preseason, and then
revealed the influences of climate change and spring phenology on autumn phenology
from 1982–2015. Ren et al. [90] found that the phenology was most correlated with climatic
factors in the period of about three months to phenology (SOS, EOS). However, the key
periods that affect the phenology may vary among different areas [91–93]. In this study,
the climatic factors could be divided into five temporal periods, which have a certain sub-
jectivity. We should use a suitable method in the future, such as linear correlation analysis,
partial correlation analysis, and Pearson correlation analysis, to determine the optimal
periods, and make the climatic factors in the period have a strong correlation with phe-
nology.Forests 2021, 12, 1315 15 of 19
Since the study area mainly consists of modern alluvial plain and delta plain, the
topography is characterized by monotonous flatness and a slight slope of the entire plain,
and the range of elevation is small, the impact of topographical factors on P. euphratica
phenology was ignored. Due to the limitation of vegetation coverage and aggregation de-
gree of P. euphratica in arid areas, this study needs a longer time series and higher spatial
resolution remote sensing data to reveal the phenological characteristics of P. euphratica.
Meanwhile, this study established a model based on a single year of ground monitoring
data, and the accuracy of the simulation was insufficient, indicating that further improve-
ment is needed in simulation and validation. Thus, these questions await further investi-
gation.
6. Conclusions
Vegetation phenology is very sensitive to climate change in extremely arid regions,
and is thus the best indicator of climate change as well as an essential indicator of ecosys-
tem function. Using the Global Land Surface Satellite leaf area index time series data from
2000 to 2017, the phenological information (i.e., SOS, LOS, and EOS) was obtained with
the dynamic threshold method from the reconstructed growth time series curve by using
the Savitzky–Golay filtering method. The interannual variation trends of P. euphratica phe-
nology were not significant from 2000 to 2017 because there was no significant trend in
annual climatic factors. P. euphratica phenology was remarkably changed with respect to
its high spatial heterogeneity. The spring climatic factors had a great influence on the SOS
of P. euphratica, while the EOS was mainly affected by the EOS preseason (June–Novem-
ber) meteorological factors. The temperature and SD controlled P. euphratica phenology,
although the impacts of RH and PR on P. euphratica phenology cannot be overlooked in
the upper Tarim River basin, implying that it is not easy to characterize phenological
change with simple climate data. This difficulty is due to the interaction between the SOS
in spring and the EOS in autumn, as well as the comprehensive influence of multiple cli-
matic factors on vegetation phenology change, which has not been adequately considered
in current vegetation phenology research and ecosystem models. This study also revealed
that global warming may lead to SOS advancement and EOS delay, and the increase in
SD may lead to earlier SOS and later EOS. Due to the scarcity of rainfall in extremely arid
regions, vegetation growth primarily depends on groundwater recharge, so the phenol-
ogy of P. euphratica has a higher correlation with runoff than rainfall in the upper reaches
of the Tarim River. The results provide insights into quantitative assessment of spatio-
temporal variations in P. euphratica phenology under climate change and provide a scien-
tific reference for future management of the desert ecosystem.
Author Contributions: Conceptualization, H.L. and L.B.; methodology, H.L.; software, J.F.; valida-
tion, J.F. and J.Z.; formal analysis, H.L. and J.F.; investigation, H.L. and L.B; writing—original draft
preparation, H.L.; writing—review and editing, L.B. and J.F.; funding acquisition, L.B. and J.F. All
authors have read and agreed to the published version of the manuscript.
Funding: This research was funded by China’s Xinjiang Production and Construction Corps’s
(XPCC) Key Science and Technology Project (No. 2019AB002), the Agricultural Science and Tech-
nology Innovation Program (ASTIP) of the Chinese Academy of Agricultural Sciences (CAAS-
ASTIP-2016-AII), and the Strategic Priority Research Program of the Chinese Academy of Sciences
(No. XDA19030302).
Data Availability Statement: No new data were created or analyzed in this study. Data sharing is
not applicable to this article.
Acknowledgments: We would like to thank the National Earth System Science Data Center, Na-
tional Science & Technology Infrastructure of China (http://www.geodata.cn 14 October 2019) for
their data support. The authors appreciate the anonymous reviewers for their constructive com-
ments and suggestions that significantly improved the quality of this manuscript.
Conflicts of Interest: The authors declare no conflict of interest.Forests 2021, 12, 1315 16 of 19
References
1. Zhang, Q.; Kong, D.; Shi, P.; Singh, V.P.; Sun, P. Vegetation phenology on the Qinghai-Tibetan Plateau and its response to climate
change (1982–2013). Agric. For. Meteorol. 2018, 248, 408–417, https://doi.org/10.1016/j.agrformet.2017.10.026.
2. Nilsson, A.L.K.; Slagsvold, T.; Rostad, O.W.; Knudsen, E.; Jerstad, K.; Cadahia, L.; Reitan, T.; Helberg, M.; Walseng, B.; Stenseth, N.C.
Territory location and quality, together with climate, affect the timing of breeding in the white-throated dipper. Sci. Rep. 2019, 9, 7671,
https://doi.org/10.1038/s41598-019-43792-5.
3. He, L.; Jin, N.; Yu, Q. Impacts of climate change and crop management practices on soybean phenology changes in China. Sci. Total
Environ. 2020, 707, 135638, https://doi.org/10.1016/j.scitotenv.2019.135638.
4. Gonsamo, A.; Chen, J.M.; Price, D.T.; Kurz, W.A.; Liu, J.; Boisvenue, C.; Hember, R.A.; Wu, C.; Chang, K.-H. Improved assessment of
gross and net primary productivity of Canada’s landmass. J. Geophys. Res. Biogeosci. 2013, 118, 1546–1560, https://doi.org/10.1002/
2013jg002388.
5. Meng, F.; Niu, H.; Suonan, J.; Zhang, Z.; Wang, Q.; Li, B.; Lv, W.; Wang, S.; Duan, J.; Liu, P. Divergent responses of community repro-
ductive and vegetative phenology to warming and cooling: asymmetry vs symmetry. Front. Plant Sci. 2019, 10, 1310, https://doi.org/
10.3389/fpls.2019.01310.
6. Pabon-Moreno, D.E.; Musavi, T.; Migliavacca, M.; Reichstein, M.; Mahecha, M.D.J.B. Ecosystem physio-phenology revealed using
circular statistics. Biogeoences 2020, 17, 3991–4006, https://doi.org/10.5194/bg-17-3991-2020.
7. Schwieder, M.; Leitao, P.J.; Bustamante, M.M.D.; Ferreira, L.G.; Rabe, A.; Hostert, P. Mapping Brazilian savanna vegetation gradients
with Landsat time series. Int. J. Appl. Earth Obs. Geoinf. 2016, 52, 361–370, https://doi.org/10.1016/j.jag.2016.06.019.
8. Shen, M.; Jiang, N.; Peng, D.; Rao, Y.; Huang, Y.; Fu, Y.H.; Yang, W.; Zhu, X.; Cao, R.; Chen, X.; et al. Can changes in autumn phenology
facilitate earlier green-up date of northern vegetation? Agric. For. Meteorol. 2020, 291, 108077, https://doi.org/10.1016/j.agrformet.
2020.10807.
9. Misra, G.; Asam, S.; Menzel, A. Ground and satellite phenology in alpine forests are becoming more heterogeneous across higher
elevations with warming. Agric. For. Meteorol. 2021, 303, 108383, https://doi.org/10.1016/j.agrformet.2021.108383.
10. Burgess, M.D.; Smith, K.W.; Evans, K.L.; Leech, D.; Pearce-Higgins, J.W.; Branston, C.J.; Briggs, K.; Clark, J.R.; Feu, C.R.d.; Lewthwaite,
K.; et al. Tritrophic phenological match-mismatch in space and time. Nat. Ecol. Evol. 2018, 2, 970–945, https://doi.org/10.1038/s41559-
018-0543-1.
11. Zhang, J.; Tong, X.; Zhang, J.; Meng, P.; Li, J.; Liu, P. Dynamics of phenology and its response to climatic variables in a warm-temperate
mixed plantation. For. Ecol. Manag. 2021, 483, 118785, https://doi.org/10.1016/j.foreco.2020.118785.
12. Araghi, A.; Martinez, C.J.; Adamowski, J.; Olesen, J.E. Associations between large-scale climate oscillations and land surface phenol-
ogy in Iran. Agric. For. Meteorol. 2019, 278, 107682, https://doi.org/10.1016/j.agrformet.2019.107682.
13. Bornez, K.; Descals, A.; Verger, A.; Penuelas, J. Land surface phenology from VEGETATION and PROBA-V data. Assessment over
deciduous forests. Int. J. Appl. Earth Obs. Geoinf. 2020, 84, 11, https://doi.org/10.1016/j.jag.2019.101974.
14. Geng, X.; Zhou, X.; Yin, G.; Hao, F.; Zhang, X.; Hao, Z.; Singh, V.P.; Fu, Y.H. Extended growing season reduced river runoff in Luanhe
River basin. J. Hydrol. 2020, 582, 124538, https://doi.org/10.1016/j.jhydrol.2019.124538.
15. Norman, S.P.; Hargrove, W.W.; Christie, W.M. Spring and Autumn Phenological Variability across Environmental Gradients of Great
Smoky Mountains National Park, USA. Remote Sens. 2017, 9, 407, https://doi.org/10.3390/rs9050407.
16. Tong, X.Y.; Tian, F.; Brandt, M.; Liu, Y.; Zhang, W.M.; Fensholt, R. Trends of land surface phenology derived from passive microwave
and optical remote sensing systems and associated drivers across the dry tropics 1992-2012. Remote Sens. Environ. 2019, 232, 12,
https://doi.org/10.1016/j.rse.2019.111307.
17. Xu, X.J.; Zhou, G.M.; Du, H.Q.; Mao, F.J.; Xu, L.; Li, X.J.; Liu, L.J. Combined MODIS land surface temperature and greenness data for
modeling vegetation phenology, physiology, and gross primary production in terrestrial ecosystems. Sci. Total Environ. 2020, 726, 11,
https://doi.org/10.1016/j.scitotenv.2020.137948.
18. Delbart, N.; Beaubien, E.; Kergoat, L.; le Toan, T. Comparing land surface phenology with leafing and flowering observations from
the PlantWatch citizen network. Remote Sens. Environ. 2015, 160, 273–280, https://doi.org/10.1016/j.rse.2015.01.012.
19. Lim, C.H.; Jung, S.H.; Kim, A.R.; Kim, N.S.; Lee, C.S. Monitoring for Changes in Spring Phenology at Both Temporal and Spatial Scales
Based on MODIS LST Data in South Korea. Remote Sens. 2020, 12, 3282, https://doi.org/10.3390/rs12203282.
20. Suepa, T.; Qi, J.; Lawawirojwong, S.; Messina, J.P. Understanding spatio-temporal variation of vegetation phenology and rainfall sea-
sonality in the monsoon Southeast Asia. Environ. Res. 2016, 147, 621–9, https://doi.org/10.1016/j.envres.2016.02.005.
21. Yuan, M.X.; Zhao, L.; Lin, A.W.; Wang, L.C.; Li, Q.J.; She, D.X.; Qu, S. Impacts of preseason drought on vegetation spring phenology
across the Northeast China Transect. Sci. Total Environ. 2020, 738, 10, https://doi.org/10.1016/j.scitotenv.2020.140297.
22. Xu, Z.; Liu, Q.; Du, W.; Zhou, G.; Qin, L.; Sun, Z. Modelling leaf phenology of some trees with accumulated temperature in a temperate
forest in northeast China. For. Ecol. Manag. 2021, 489, 119085, https://doi.org/10.1016/j.foreco.2021.119085.
23. Zou, F.; Li, H.; Hu, Q. Responses of vegetation greening and land surface temperature variations to global warming on the Qinghai-
Tibetan Plateau, 2001–2016. Ecol. Indicators 2020, 119, 106867, https://doi.org/10.1016/j.ecolind.2020.106867.
24. Ma, J.; Xiao, X.; Li, R.; Zhao, B.; Myint, S.W. Enhanced spring phenological temperature sensitivity explains the extension of carbon
uptake period in temperate forest protected areas. For. Ecol. Manag. 2020, 455, 117679, https://doi.org/10.1016 /j.foreco.2019.117679.
25. Meier, G.A.; Brown, J.F.; Evelsizer, R.J.; Vogelmann, J.E. Phenology and climate relationships in aspen ( Populus tremuloides Michx.)
forest and woodland communities of southwestern Colorado. Ecol. Indicators 2015, 48, 189–197, https://doi.org/10.1016/j.ecolind.
2014.05.033.Forests 2021, 12, 1315 17 of 19
26. Li, X.; Zhang, L.; Luo, T. Rainy season onset mainly drives the spatiotemporal variability of spring vegetation green-up across alpine
dry ecosystems on the Tibetan Plateau. Sci. Rep. 2020, 10, 18797, https://doi.org/10.1038/s41598-020-75991-w.
27. Huang, S.; Zheng, X.; Ma, L.; Wang, H.; Huang, Q.; Leng, G.; Meng, E.; Guo, Y. Quantitative contribution of climate change and human
activities to vegetation cover variations based on GA-SVM model. J. Hydrol. 2020, 584, 124687, https://doi.org/10.1016/ j.jhy-
drol.2020.124687.
28. An, S.; Zhang, X.; Chen, X.; Yan, D.; Henebry, G. An Exploration of Terrain Effects on Land Surface Phenology across the Qinghai–
Tibet Plateau Using Landsat ETM+ and OLI Data. Remote Sens. 2018, 10, 1069, https://doi.org/10.3390/rs10071069.
29. Jin, J.; Wang, Y.; Zhang, Z.; Magliulo, V.; Jiang, H.; Cheng, M. Phenology Plays an Important Role in the Regulation of Terrestrial
Ecosystem Water-Use Efficiency in the Northern Hemisphere. Remote Sens. 2017, 9, 664, https://doi.org/10.3390/rs9070664.
30. Yuan, G.; Zhang, P.; Shao, M.-a.; Luo, Y.; Zhu, X. Energy and water exchanges over a riparian Tamarix spp. stand in the lower Tarim
River basin under a hyper-arid climate. Agric. For. Meteorol. 2014, 194, 144–154, https://doi.org/10.1016/j.agrformet. 2014.04.004.
31. Schimel, D.S. Drylands in the Earth System. Science 2010, 327, 418–419, https://doi.org/10.1126/science.1184946.
32. Yu, T.; Feng, Q.; Si, J.; Xi, H.; Su, Y.; Mitchell, P.J.; Pinkard, E.A. Flooding constrains tree water use of a riparian forest in the lower
Heihe River Basin, Northwest China. Sci. Total Environ. 2021, 760, 144069, https://doi.org/10.1016/j.scitotenv.2020.144069.
33. Noy-Meir, I. Desert ecosystems: environment and producers. Annu. Rev. Ecol. Syst. 1973, 4, 25–51, https://doi.org/10.1146/ an-
nurev.es.04.110173.000325.
34. Zhou, H.H.; Chen, Y.N.; Zhu, C.G.; Li, Z.; Fang, G.H.; Li, Y.P.; Fu, A.H. Climate change may accelerate the decline of desert riparian
forest in the lower Tarim River, Northwestern China: Evidence from tree-rings of Populus euphratica. Ecol. Indicators 2020, 111, 105997,
https://doi.org/10.1016/j.ecolind.2019.105997.
35. Li, H.; Bai, L.; Feng, J.; Gao, H.; Ran, Q.; Yu, T.; Gao, W. Analysis of spatio-temporal characteristics of Populus euphratica forests in the
Yarkand River Basin, Xinjiang. Acta Ecol. Sin. 2019, 39, 5080–5094, https://doi.org/10.5846/ stxb201811012364. (in Chinese)
36. Gou, S.; Miller, G. A groundwater-soil-plant-atmosphere continuum approach for modelling water stress, uptake, and hydraulic re-
distribution in phreatophytic vegetation. Ecohydrology 2014, 7, 1029–1041, https://doi.org/10.1002/eco.1427.
37. Chen, Y.; Li, Z.; Fan, Y.; Wang, H.; Deng, H. Progress and prospects of climate change impacts on hydrology in the arid region of
northwest China. Environ. Res. 2015, 139, 11–19, https://doi.org/10.1016/j.envres.2014.12.029.
38. Wu, K.; Xu, W.; Yang, W. Effects of precipitation changes on soil bacterial community composition and diversity in the Junggar desert
of Xinjiang, China. PeerJ 2020, 8, e8433, https://doi.org/10.7717/peerj.8433.
39. Xu, J.; Li, W.; Ji, M.; Lu, F.; Dong, S. A comprehensive approach to characterization of the nonlinearity of runoff in the headwaters of
the Tarim River, western China. Hydrol. Process. 2010, 24, 136–146, https://doi.org/10.1002/hyp.7484.
40. Keram, A.; Halik, Ü .; Keyimu, M.; Aishan, T.; Mamat, Z.; Rouzi, A. Gap dynamics of natural Populus euphratica floodplain forests
affected by hydrological alteration along the Tarim River: Implications for restoration of the riparian forests. For. Ecol. Manag. 2019,
438, 103–113, https://doi.org/10.1016/j.foreco.2019.02.009.
41. Lang, P.; Ahlborn, J.; Schäfer, P.; Wommelsdorf, T.; Jeschke, M.; Zhang, X.; Thomas, F.M. Growth and water use of Populus euphratica
trees and stands with different water supply along the Tarim River, NW China. For. Ecol. Manag. 2016, 380, 139–148,
https://doi.org/10.1016/j.foreco.2016.08.049.
42. Eusemann, P.; Petzold, A.; Thevs, N.; Schnittler, M. Growth patterns and genetic structure of Populus euphratica Oliv. (Salicaceae)
forests in NW China – Implications for conservation and management. For. Ecol. Manag. 2013, 297, 27–36, https://doi.org/
10.1016/j.foreco.2013.02.009.
43. Zhou, H.H.; Chen, Y.N.; Li, W.H.; Chen, Y.P. Photosynthesis of Populus euphratica in relation to groundwater depths and high tem-
perature in arid environment, northwest China. Photosynthetica 2010, 48, 257–268, https://doi.org/10.1007/s11099-010 -0032-5.
44. Hu, Y.; Li, H.; Wu, D.; Chen, W.; Zhao, X.; Hou, M.; Li, A.; Zhu, Y. LAI-indicated vegetation dynamic in ecologically fragile region: A
case study in the Three-North Shelter Forest program region of China. Ecol. Indicators 2021, 120, 106932, https://doi.org/10.1016/
j.ecolind.2020.106932.
45. Li, J.; Xiao, Z. Evaluation of the version 5.0 global land surface satellite (GLASS) leaf area index product derived from MODIS data.
Int. J. Remote Sens. 2020, 41, 9140–9160, https://doi.org/10.1080/01431161.2020.1797222.
46. Xiang, Y.; Xiao, Z.; Ling, S.; Wang, J.; Song, J. Validation of Global LAnd Surface Satellite (GLASS) leaf area index product. J. Remote
Sens. 2014, 18, 573–584, https://doi.org/10.11834/jrs.20143117.
47. Zhao, Y.; Bai, L.; Feng, J.; Lin, X.; Wang, L.; Xu, L.; Ran, Q.; Wang, K. Spatial and Temporal Distribution of Multiple Cropping Indices
in the North China Plain Using a Long Remote Sensing Data Time Series. Sensors 2016, 16, 21, https://doi.org/10.3390 /s16040557.
48. Wang, C.; Li, J.; Liu, Q.H.; Zhong, B.; Wu, S.L.; Xia, C.F. Analysis of Differences in Phenology Extracted from the Enhanced Vegetation
Index and the Leaf Area Index. Sensors 2017, 17, 1982, https://doi.org/10.3390/s17091982.
49. Cai, Z.; Jönsson, P.; Jin, H.; Eklundh, L. Performance of Smoothing Methods for Reconstructing NDVI Time-Series and Estimating
Vegetation Phenology from MODIS Data. Remote Sens. 2017, 9, 1271, https://doi.org/10.3390/rs9121271.
50. Guo, J.; Yang, X.; Niu, J.; Jin, Y.; Xu, B.; Shen, G.; Zhang, W.; Zhao, F.; Zhang, Y. Remote sensing monitoring of green-up dates in the
Xilingol grasslands of northern China and their correlations with meteorological factors. Int. J. Remote Sens. 2019, 40, 2190–2211,
https://doi.org/10.1080/01431161.2018.1506185.
51. Hu, L.; Fan, W.; Ren, H.; Liu, S.; Cui, Y.; Zhao, P. Spatiotemporal Dynamics in Vegetation GPP over the Great Khingan Mountains
Using GLASS Products from 1982 to 2015. Remote Sens. 2018, 10, 488, https://doi.org/10.3390/rs10030488.
52. Jönsson, P.; Eklundh, L. Seasonality extraction by function fitting to time-series of satellite sensor data. IEEE Trans. Geosci. Comput.
Remote Sens. 2002, 40, 1824–1832, https://doi.org/10.1109/TGRS.2002.802519.Forests 2021, 12, 1315 18 of 19
53. Li, P.; He, Z.; He, D.; Xue, D.; Wang, Y.; Cao, S. Fractional vegetation coverage response to climatic factors based on grey relational
analysis during the 2000-2017 growing season in Sichuan Province, China. Int. J. Remote Sens. 2019, 41, 1170–1190, https://doi.org/
10.1080/01431161.2019.1657605.
54. He, D.; Yi, G.; Zhang, T.; Miao, J.; Li, J.; Bie, X. Temporal and Spatial Characteristics of EVI and Its Response to Climatic Factors in
Recent 16 years Based on Grey Relational Analysis in Inner Mongolia Autonomous Region, China. Remote Sens. 2018, 10, 961, https://
doi.org/10.3390/rs10060961.
55. Gao, B.; Li, J.; Wang, X.S. Impact of frozen soil changes on vegetation phenology in the source region of the Yellow River from 2003 to
2015. Theor. Appl. Climatol. 2020, 141, 1219–1234, https://doi.org/10.1007/s00704-020-03266-5.
56. Hotelling, H. Relations Between Two Sets of Variates. Biometrika 1935, 28, 321–377, https://doi.org/10.1093/biomet/28.3-4.321.
57. Ivanova, Y.; Kovalev, A.; Yakubailik, O.; Soukhovolsky, V. The Use of Satellite Information (MODIS/Aqua) for Phenological and Clas-
sification Analysis of Plant Communities. Forests 2019, 10, 561, https://doi.org/10.3390/f10070561.
58. Wu, C.; Hou, X.; Peng, D.; Gonsamo, A.; Xu, S. Land surface phenology of China’s temperate ecosystems over 1999-2013: Spatial-
temporal patterns, interaction effects, covariation with climate and implications for productivity. Agric. For. Meteorol. 2016, 216, 177–
187, https://doi.org/10.1016/j.agrformet.2015.10.015.
59. Peng, D.; Zhang, X.; Wu, C.; Huang, W.; Gonsamo, A.; Huete, A.R.; Didan, K.; Tan, B.; Liu, X.; Zhang, B. Intercomparison and evalua-
tion of spring phenology products using National Phenology Network and AmeriFlux observations in the contiguous United States.
Agric. For. Meteorol. 2017, 242, 33–46, https://doi.org/10.1016/j.agrformet.2017.04.009.
60. Abdurahman, M.; Kurban, A.; Ablat, A.; Adilla, R.; Duan, H.; Ablekim, A.; Halik, U. Study on Phenological Characters of Populus
euphratica Oliv. in the Lower Reaches of the Tarim River. Arid Zone Res. 2008, 25, 525–530, https://doi.org/10.13866/j.azr.2008.04.002.
(in Chinese)
61. Zhao, M.; Liu, P.; Zhu, X.; Zhang, K. Respond of Populus euphratica Oliv. Phenology to climate Warming in the Oasis Lower Reaches
of Heihe Rvier from 1960 to 2010. Acta Bot. Boreali-Occident. Sin. 2012, 32, 2108–2115, https://doi.org/1000-4025(2012)10-2108-08. (in
Chinese)
62. Zhang, W.; Liu, P.; Feng, Q.; Wang, T.; Wang, T. The spatiotemporal responses of Populus euphratica to global warming in Chinese
oases between 1960 and 2015. J. Geogr. Sci. 2018, 28, 579–594, https://doi.org/10.11821/dlxb201707002.
63. Wu, H.; Zhang, S.; Ji, Y. Response of Populus euphratica Oliv to Climate Change in Minqin Oasis from 1955 to 2009. Res. Soil Water
Conserv. 2015, 22, 123–127, https://doi.org/10.13869/j.cnki.rswc.2015.01.024. (In Chinese)
64. Liu, P.; Zhu, X.; Zhao, M.; Yao, Y.; Chen, L. Response of Annual Growing Season of Populus euphraticato Climate Change in the
Jiuquan Oasis during the Period from 1955 to 2010. Arid Zone Res. 2013, 30, 101–108, https://doi.org/ 10.13866/j.azr.2013.01.010. (In
Chinese)
65. Liu, P.; Yang, Q. Response of the Annual Growing Season of Populus Euphratica to Climate Change in Dunhuang Oasis from 1955 to
2010. Resour. Sci. 2012, 34, 566–571, https://doi.org/1007-7588(2012)03-0566-06. (In Chinese)
66. Zhao, M.; Liu, P.; Zhu, X.; Zhang, K.; Hou, C. Response of Populus Euphratica′s Annual Growth Period to Climate Change in Ejina
Banner′s Oasis over the Last 51 Years. Bull. Soil Water Conserv. 2012, 32, 205–209, https://doi.org/10.13961/j.cnki.stbctb.2012.05.003. (In
Chinese)
67. Wang, Y.; Luo, Y.; Shafeeque, M. Interpretation of vegetation phenology changes using daytime and night-time temperatures across
the Yellow River Basin, China. Sci. Total Environ. 2019, 25, 693, https://doi.org/10.1016/j.scitotenv.2019.07.359.
68. Liang, S.; Shi, P.; Li, H. Urban spring phenology in the middle temperate zone of China: dynamics and influence factors. Int. J. Biome-
teorol. 2016, 60, 531–544, https://doi.org/10.1007/s00484-015-1049-z.
69. Karami, M.; Hansen, B.U.; Westergaard-Nielsen, A.; Abermann, J.; Lund, M.; Schmidt, N.M.; Elberling, B. Vegetation phenology gra-
dients along the west and east coasts of Greenland from 2001 to 2015. Ambio 2017, 46, S94–S105, https://doi.org/ 10.1007/s13280-016-
0866-6.
70. Zheng, C.; Tang, X.; Gu, Q.; Wang, T.; Wei, J.; Song, L.; Ma, M. Climatic anomaly and its impact on vegetation phenology, carbon
sequestration and water-use efficiency at a humid temperate forest. J. Hydrol. 2018, 565, 150–159, https://doi.org/10.1016/ j.jhy-
drol.2018.08.012.
71. Wu, X.C.; Liu, H.Y. Consistent shifts in spring vegetation green-up date across temperate biomes in China, 1982–2006. Glob. Chang.
Biol. 2013, 19, 870–880, https://doi.org/10.1111/gcb.12086.
72. Li, P.; Peng, C.; Wang, M.; Luo, Y.; Li, M.; Zhang, K.; Zhang, D.; Zhu, Q. Dynamics of vegetation autumn phenology and its response
to multiple environmental factors from 1982 to 2012 on Qinghai-Tibetan Plateau in China. Sci. Total Environ. 2018, 637–638, 855,
https://doi.org/10.1016/j.scitotenv.2018.05.031.
73. Che, M.; Chen, B.; Innes, J.L.; Wang, G.; Dou, X.; Zhou, T.; Zhang, H.; Yan, J.; Xu, G.; Zhao, H. Spatial and temporal variations in the
end date of the vegetation growing season throughout the Qinghai–Tibetan Plateau from 1982 to 2011. Agric. For. Meteorol. 2014, 189–
190, 81–90, https://doi.org/10.1016/j.agrformet.2014.01.004.
74. Chen, L.; Huang, J.-G.; Ma, Q.; Hanninen, H.; Tremblay, F.; Bergeron, Y. Long-term changes in the impacts of global warming on leaf
phenology of four temperate tree species. Glob. Chang. Biol. 2019, 25, 997–1004, https://doi.org/10.1111/gcb.14496.
75. Asse, D.; Chuine, I.; Vitasse, Y.; Yoccoz, N.G.; Delpierre, N.; Badeau, V.; Delestrade, A.; Randin, C.F. Warmer winters reduce the ad-
vance of tree spring phenology induced by warmer springs in the Alps. Agric. For. Meteorol. 2018, 252, 220–230, https://doi.org/
10.1016/j.agrformet.2018.01.030.
76. Dreesen, F.E.; Boeck, H.D.; Janssens, I.A.; Nijs, I. Do successive climate extremes weaken the resistance of plant communities? An
experimental study using plant assemblages. Biogeosciences 2014, 10, 9149–9177, https://doi.org/10.5194/ bg-11-109-2014.You can also read