Public Health Implications of Vaping in the US: The Smoking and Vaping Simulation Model - Research ...
←
→
Page content transcription
If your browser does not render page correctly, please read the page content below
Public Health Implications of Vaping in the US: The
Smoking and Vaping Simulation Model
David T Levy ( dl777@georgetown.edu )
Georgetown University https://orcid.org/0000-0001-5280-3612
Jamie Tam
Yale University
Luz Maria María Sanchez-Romero
Georgetown University
Yameng Li
Georgetown University
Zhe Yuan
Georgetown University Qatar
Jihyoun Jeon
University of Michigan
Rafael Meza
University of Michigan
Research
Keywords: E-cigarettes, ENDS, vaping, smoking, simulation model, public health
Posted Date: June 24th, 2020
DOI: https://doi.org/10.21203/rs.3.rs-36677/v1
License: This work is licensed under a Creative Commons Attribution 4.0 International License. Read Full
License
Version of Record: A version of this preprint was published at Population Health Metrics on April 17th, 2021. See
the published version at https://doi.org/10.1186/s12963-021-00250-7.
Page 1/36Abstract
Background
Nicotine vaping products (NVPs) are increasingly popular worldwide. They may provide public health benefits if
used as a substitute for smoking, but may create public health harms if used as a gateway to smoking or to
discourage smoking cessation. This paper presents the Smoking and Vaping Model (SAVM), which estimates
the public health implications of NVPs in the US.
Methods
SAVM adopts a cohort-approach and is available on an Excel platform. We derive public health implications by
comparing smoking- and NVP-attributable deaths under a No-NVP and an NVP Scenario. The No-NVP Scenario
projects current, former and never smoking rates via smoking initiation and cessation rates, and incorporates
excess risks of smoking. The NVP Scenario allows for NVP relative excess risks, switching from cigarette to NVP
use, separate NVP and smoking initiation rates, and separate NVP and smoking cessation rates. The model is
validated against recent US survey data on smoking and vaping prevalence.
Results
The SAVM projects that under current patterns of US NVP use and substitution, NVP use will translate into
5.8 million premature smoking- and vaping-attributable deaths avoided and 96.4 million life years gained
between 2013 and 2100. Sensitivity analysis shows that parameters for NVP relative risks, NVP-related
switching and smoking cessation are particularly influential in gauging public health impacts.
Discussion
The SAVM shows potential benefits of e-cigarette use over a wide range of parameters. However, there is a high
degree of uncertainty regarding key parameters. Policymakers, researchers and other public health stakeholders
can apply the SAVM to estimate the potential public health impact of NVPs in their country or region using their
own data sources.
Background
Smoking prevalence has markedly declined in the US over the past 50 years (Holford et al. 2014b, U.S.
Department of Health and Human Services 2014). During that time, cigarette taxes were substantially increased,
and smoke-free air policies, media campaigns, youth access policies and smoking cessation treatments were
implemented (U.S. Department of Health and Human Services 2014). These policies have been shown to be
effective (Levy et al. 2018b), and can explain much of the reduction in smoking prevalence (Holford et al. 2014b,
Levy et al. 2016, U.S. Department of Health and Human Services 2014, Warner 2014, Warner et al. 2014).
Despite this progress, the harms from cigarette smoking remain unacceptably high (U.S. Department of Health
and Human Services 2014). More than 480,000 Americans die each year due to smoking, and two-thirds of all
Page 2/36long-term smokers die prematurely of a smoking-attributable disease (Carter et al. 2015, Jha et al. 2013, Thun,
Lopez and Hartge 2013). To drastically reduce the harms of smoking on population health, innovative
approaches are needed.
The rising popularity of nicotine vaping products (NVPs), also known as e-cigarettes, has been a source of both
promise and controversy (Levy et al. 2017). NVPs, especially later generation models, have been shown to more
efficiently deliver nicotine (DeVito and Krishnan-Sarin 2018, Farsalinos et al. 2014, Glasser et al. 2016, Wagener
et al. 2016, Yingst et al. 2019) and have sensorimotor effects and throat irritation similar to smoking (Etter 2016,
Goldenson et al. 2016, Hajek et al. 2018, Voos et al. 2019), thus potentially serving as a substitute for cigarettes.
NVPs are increasingly being used by smokers to quit (Caraballo et al. 2017, Filippidis et al. 2017, Giovenco and
Delnevo 2018), and recent studies indicate their effectiveness (Bullen et al. 2013, Hajek et al. 2019, Levy et al.
2018d, Zhu et al. 2017). If used by existing continuing smokers switch entirely to NVPs, the health benefits could
be substantial since NVPs deliver only a small fraction of the toxicants delivered by smoking (Goniewicz et al.
2014, Goniewicz et al. 2017, Hecht et al. 2014, Ratajczak et al. 2018, Royal College of Physicians 2016, Shahab
et al. 2017a, Shahab et al. 2017b). However, there is also growing concern about increased use of these
products by youth (Cullen et al. 2019).
The US Food and Drug Administration has the authority to regulate NVPs (Federal Register 2014) and must now
consider “the risks and benefits of the tobacco product to the population as a whole”(U.S. Food and Drug
Administration 2020). In their review of NVPs, the agency evaluates the toxicity of the product and its effect on
the uptake and cessation of existing tobacco products from a public health perspective. The impact of NVP use
(“vaping’) on population health will depend on its use in relation to cigarette use (“smoking”) (Levy et al. 2017).
As a reduced risk alternative, vaping would improve public health when used by those who would have
otherwise initiated smoking or by those who would not have otherwise quit smoking. Vaping would worsen
public health if used by those who would not have otherwise initiated NVPs or smoking (i.e., as a gateway) or if
used by those who would have otherwise quit smoking.
While many models have been developed that incorporate NVPs (Bachand, Sulsky and Curtin 2018, Cherng et al.
2016, Cobb et al. 2015, Hill and Camacho 2017, Kalkhoran and Glantz 2015, Poland and Teischinger 2017,
Soneji et al. 2018, Warner and Mendez 2019, Weitkunat et al. 2015), these models are often geared towards
specific applications, lack the flexibility to be easily applied to other settings, require substantial efforts to
understand, and have generally not been validated against real-world data. The purpose of this paper is to
present a model that considers the public health implications of NVPs and bridges these gaps.
The Smoking and Vaping Model (SAVM) is validated against US observational data on both smoking and NVP
use. Unlike previous models, the SAVM adopts a cohort-based approach to better accommodate the impact of
new product availability and new policies across birth cohorts. This user-friendly model is based on an earlier
model (Levy et al. 2018a), but provides greater flexibility by incorporating a wider range of initiation, cessation
and switching parameters and can easily be adapted to other countries, states, or local areas. This study
presents the model and demonstrate its application to the US.
Methods
Model Structure
Page 3/36The SAVM adopts a public health framework (Levy et al. 2017) that has been specifically developed to consider
the impact of NVP use on smoking and public health. We focus on the regular (rather than experimental) use of
NVPs and cigarettes and the transitions between those uses both to simplify the model and because health
outcomes generally depend on regular (i.e. stable) use patterns over time (Jha et al. 2013). The public health
impact of NVP use among smokers and non-smokers is estimated by comparing two scenarios: a) the No-NVP
Scenario which projects future cigarette use and associated mortality outcomes for each birth cohort in the
absence of NVPs, and b) the NVP Scenario which incorporates NVP use patterns into each cohort’s cigarette use
trajectory.
The SAVM begins with separate cohorts of males and females by individual age. Within each cohort, the
population evolves with age. To simplify the model and focus on the current, former and never smoking and
vaping, their rates are translated into population levels using the actual and projected US population (Centers for
Disease Control and Prevention 2019a).
The No-NVP Scenario
The No-NVP Scenario projects the prevalence of never, current, and former smokers over time using age and
gender-specific initiation and cessation rates for each cohort. The data were developed using an age-period-
cohort statistical smoking model (Holford et al. 2014a, Holford, Levy and Meza 2016, Jeon et al. 2018, Tam et
al. 2018). Established smoking is measured as having smoked at least 100 cigarettes during one’s lifetime and
currently smoking every day or some days. Initiation is based on becoming an established current smoker and
occurs through age 40. Current smokers become former smokers after having quit. A two year cut-off is applied
to reflect cessation net of relapse, i.e., relapse is not explicitly considered. The initiation and cessation rates are
projected forward based on data from the NHIS through the year 2013, before NVPs became popular and thus
reflects smoking patterns in the absence of NVPs.
For a given cohort, the projected prevalence of never smokers at age a and time t is composed of the surviving
never smokers in the previous year (age a-1, time t-1) who did not initiate smoking. Denoting the initiation rate
from never smokers at a-1 and t-1 to smokers at a and t as Inita−1,t−1 and the death rate of never smokers in
previous year as DR_nevera−1,t−1, never smoker prevalence at age a and year t is calculated as:
Prev_nevera,t= Prev_nevera−1,t−1 * (1 - DR_nevera−1,t−1) * (1 – Inita−1,t−1). (1)
The prevalence of smokers includes surviving never smokers who initiate smoking and surviving smokers who
do not quit. Denoting the cessation rate from smokers at a-1 and t-1 to former smokers at a and t as Cessa−1,t−1
and the smoker death rate as DR_smokera−1,t−1, current smoking prevalence evolves as:
Prev_smokera,t = Prev_smokera−1,t−1 * (1- DR_smokera−1,t−1) * (1- Cessa−1,t−1)
+ Prev_nevera−1,t−1 * (1 - DR_nevera−1,t−1) * Inita−1,t−1. (2)
Denoting DR_former as the former smoker death rate, former smokers include surviving former smokers and
surviving smokers who quit smoking for at least two years, former smoking prevalence is:
Prev_formera,t = Prev_formera−1,t−1 * (1 – DR_formera−1,t−1) + Prev_smokera−1,t−1
Page 4/36* (1- DR_smokera−1,t−1) * Cessa−1,t−1. (3)
Since prevalence estimates decline each year due to deaths, each of the prevalence rates is multiplied by the
following correction factor to assure that they sum to 100%:
Correction factora,t = 1/[Prev_nevera−1,t−1*(1-DR_nevera−1,t−1) + Prev_smokera−1,t−1*
(1-DR_smokera−1,t−1) + Prev_formera−1,t−1*(1-DR_formera−1,t−1)]. (4)
The NVP Scenario
Starting from the same initial current, former and never smoking prevalence as in the No-NVP Scenario, the NVP
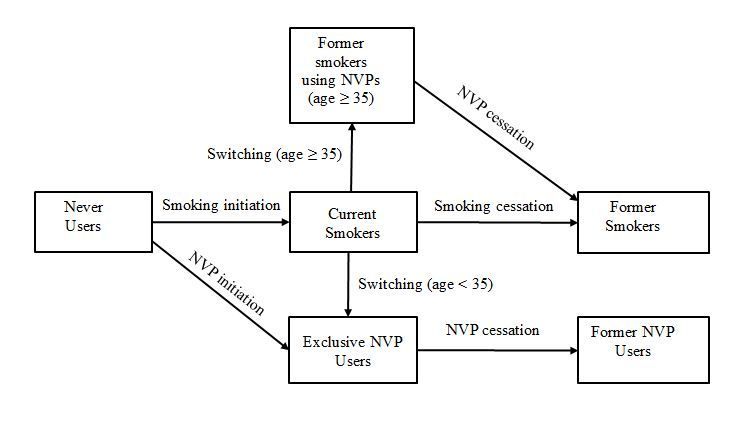
Scenario is expanded to include current and former NVP use. The transitions are shown in Fig. 1.
Figure 1 here
A switching parameter allows direct transitions from smoking to vaping. This parameter varies by age and
varies over time through an exponential decay process. The model directly relates the NVP Scenario to the No-
NVP Scenario by defining the NVP and smoking initiation rates in the NVP Scenario through separate linear
multipliers applied to the smoking initiation rate (Inita.t) in the No-NVP Scenario. Using a linear multiplier assures
that NVP and smoking initiation follows the same age patterns for smoking initiation as in the No-NVP case,
e.g., smoking initiation mostly occurs before age 21 and is minimal after age 30. Similarly, NVP and smoking
cessation are modelled as separate linear multipliers of smoking cessation (Cessa,t) in the No-NVP Scenario, so
that cessation follows the same age pattern in the No-NVP Scenario and tends to increase with age. With
variations by age incorporated via the respective initiation and cessation patterns in the No-NVP Scenario and
because current studies do not indicate different patterns, the smoking and vaping initiation and cessation
multipliers are simply modeled as independent of age. In addition, these multipliers are assumed to remain
constant over time, so that smoking and vaping initiation and cessation in the NVP Scenario follow the same
temporal patterns as in the No-NVP Scenario.
Because SAVM focuses on regular use, the NVP Scenario does not explicitly incorporate “gateway” effects
whereby youth transition from short-term vaping to regular smoking. Any such transitions are however
incorporated indirectly through the smoking initiation multiplier in the NVP Scenario. Similarly, the NVP Scenario
does not explicitly model short-term NVP use leading to quitting both cigarettes and NVPs, but is indirectly
incorporated through the smoking cessation multiplier. In addition, the NVP Scenario does not distinguish dual
cigarette and NVP users from exclusive smokers, because dual user have generally been found to either remain
dual users or soon transition to either exclusive cigarette or exclusive NVP use (Azagba, Shan and Latham 2019,
Borland et al. 2019, Coleman et al. 2018, Robertson et al. 2019, Stanton et al. 2020, Taylor et al. 2020) and the
health risks of dual users are similar to those of exclusive smokers (Goniewicz et al. 2017, Shahab et al. 2017a,
Shahab et al. 2017b). However, transitions from dual use to exclusive NVP use or to neither cigarette or NVP use
are reflected in the switching and smoking cessation parameters.
Never smokers include surviving never smokers who do not initiate into smoking or NVP use, calculated as:
Prev_nevera,t = Prev_nevera−1,t−1 *(1 – DR_nevera−1,t−1)* (1 – αS* Inita−1,t−1– αV * Inita−1,t−1), (5)
Page 5/36where αS and αV are the smoking (S) and vaping (V) initiation multipliers. Smokers include surviving smokers
who do not switch to vaping and who do not quit smoking and surviving never smokers who initiate smoking:
Prev_smokera,t = Prev_smokera−1,t−1*(1-DR_smokera−1,t−1)*(1 – σa−1*(1-δ)t−t0–1 – χS* Cessa−1,t−1)
+ Prev_nevera−1,t−1 * (1–DR_nevera−1,t−1) *(αS*Inita−1,t−1), (6)
where σa−1 is the switching rate from smoking to NVP use in the initial year t0 with decay rate δ for each cohort
and χS is the smoking cessation multiplier. Exclusive NVP users include surviving never smokers who initiate
vaping, surviving vapers who do not quit, and those switching to vaping from surviving current smokers before
age 35:
Prev_NVPa,t = Prev_nevera−1,t−1*(1-DR_nevera−1,t−1)*αV*Inita−1,t−1 + Prev_NVPa−1,t−1*
(1-DR_NVPa−1,t−1)*(1– χV * Cess a−1,t−1) + Prev_smokera−1,t−1* I(a-1 < 35)*
(1–DR_smokera−1,t−1)* σa−1*(1-δ)t−t0–1, where I(a-1) = 1 if a < 36, otherwise = 0. (7)
DR_NVP is the death rate of exclusive NVP users and χV is the NVP cessation multiplier. The transition from
smoker to exclusive NVP user is conditional on being less than age 35, because mortality risks of smoking are
small when quitting before age 35 (Jha et al. 2013).
Former smokers include surviving former smokers, surviving smokers who quit smoking and do not vape, and
surviving former smokers who regularly vaped but quit vaping:
Prev_formera,t = Prev_formersa−1,t−1*(1 – DR_formera−1,t−1) + Prev_smokera−1,t−1 *
(1 – DR_smokera−1,t−1) * (χS* Cess a−1,t−1) + Prev_FS-NVPa−1,t−1 *
(1 – DR_FS-NVPa−1,t−1) * (χV* Cess a−1,t−1), (8)
where Prev_FS-NVPa−1,t−1 is the prevalence of former smokers who currently use NVPs and DR_FS-NVPa−1,t−1 is
the corresponding death rate. Former NVP users include surviving former NVP users and surviving vapers who
quit:
Prev_FNVPa,t = Prev_FNVPa−1,t−1 * (1- DR_FNVPa−1,t−1) +
Prev_NVPa−1,t−1 * (1 – DR_NVPa−1,t−1) * χV * Cessa−1,t−1, (9)
where DR_FNVPa−1,t−1 denotes the former NVP user death rate. Since former smokers using NVPs may quit
vaping, former smokers using NVPs (after age 35) includes surviving former smokers using NVPs who do not
quit vaping and smokers who switch to vaping:
Prev_FS-NVPa,t = Prev_FS-NVPa−1,t−1*(1- DR_FS-NVPa−1,t−1)*(1 – χV * Cess a−1,t−1)
+ Prev_smokera−1,t−1* I(a-1 > 35) * (1- DR_smokera−1,t−1)*(σa−1*(1 + δ)t−t0–1),
Page 6/36where I(a-1) = 1 if a ≥ 36, otherwise = 0 (10)
As in the No-NVP Scenario, a correction factor is applied as the reciprocal of the sum of prevalence rates for
each smoking and vaping category i to ensure that the prevalence rates each period sum to 100%:
Correction factora,t = 1 / ∑i [Prev_ia−1,t−1 * (1 – DR_ia−1,t−1)]. (11)
Public Health Outcomes
The SAVM considers two public health outcomes considered: 1) Smoking- and vaping-attributable deaths, and
2) smoking- and vaping-attributable life-years lost (LYLs).. Both are based on the excess risks of smoking or
vaping and the number of current and former smokers and vapers.
In the No-NVP Scenario, smoking-attributable deaths (SADs) for current smokers is calculated by applying the
excess risks of smokers relative to never smokers (DR_smokera,t – DR_nevera,t) to the smoking population:
SAD_smokera,t = (DR_smokera,t – DR_nevera,t) * Prev_smokera,t * Populationa,t, (12)
and attributable deaths for former smokers is calculated as:
SAD_formera,t = (DR_formera,t – DR_nevera,t) * Prev_formera,t * Populationa,t (13)
SADs for current and former smokers are summed over all ages in a particular year to obtain total SADs in that
year. LYLs are estimated as the number of premature deaths multiplied by the remaining life expectancy (LE) of
a never smoker at each age in year t denoted by LE_Nevera,t:
LYLa,t = (SAD_smokera,t + SAD_formera,t ) * LE_Nevera,t. (14)
Summing over ages in a particular year obtains the LYLs in that year.
In the NVP Scenario, SAD_smokera,t and SAD_formera,t are calculated in the same manner as above except
using their respective prevalence rates in the NVP scenario. Vaping-attributable deaths for current exclusive NVP
users (VADs) and for former NVP users (FNVP) are measured by two similar equations (15) and (16). For current
exclusive NVP users, attributable deaths (VAD_NVPa,t) are a product of the number of NVP users and the excess
risks of smoking adjusted by NVP relative risk, denoted by RiskNVP, and similarly for former NVP use attributable
deaths (VAD_FNVPa,t):
VAD_NVPa,t = RiskNVP*(DR_smokera,t - DR_nevera,t)*Prev_NVPa,t*Populationa,t. (15)
VAD_FNVPa,t = RiskNVP*(DR_formera,t -DR_nevera,t)*Prev_FNVPa,t*Populationa,t. (16)
As a special case in the NVP Scenario, the death rate of NVP users who previously smoked is determined by the
portion of excess risk of current relative to former smokers plus the death rate of former smokers:
DR_FS-NVPa,t = RiskNVP * (DR_smokera,t - DR_formera,t) + DR_formera,t (17)
Page 7/36Smoking and vaping-attributable deaths (SVADs) for former smokers who currently use NVPs (FS-NVPs) in the
NVP Scenario is measured as a product of the number of FS-NVPs and the excess mortality risk of FS-NVP to
never smokers:
SVAD_FS-NVPa,t = [DR_FS-NVPa,t -DR_nevera,t)]*Prev_FS-NVPa,t* Populationa,t (18)
Attributable deaths are calculated by summing SADs, VADs and SVADs over ages each year for a given cohort.
LYLs in the NVP Scenario at each age are calculated as:
LYLa,t = (SAD_smokera,t + SAD_formera,t + VAD_NVPa,t + VAD_FNVPa,t +
SVAD_FS-NVPa,t)*LE_Nevera,t (19)
Summing over ages in a particular year obtains the LYLs in that year.
The public health impact of NVP use each year is evaluated as the difference in attributable deaths between the
No-NVP and NVP Scenarios, and similarly for LYLs.
Data and Parameters
A detailed description of model parameters is shown in Table 1.
Page 8/36Table 1
Data and Initial Parameters for the US Smoking and Vaping Model
Input Description Data source or estimate
parameters
Population Population by age, gender, US population projections (Center for Disease Control and
and year (2013–2100) Prevention 2019)
Mortality Mortality rates by age, gender, CISNET Lung Group,(Holford et al. 2014a, Holford, Levy and
rates and year for never, current, Meza 2016, Jeon et al. 2018, Tam et al. 2018) available on
and former smokers (2013– the CISNET website (CISNET 2016).
2100)
Expected Expected life years remaining CISNET Lung Group,(Holford et al. 2014a, Holford, Levy and
life years of never smokers by age, Meza 2016, Jeon et al. 2018, Tam et al. 2018) available on
gender, and year (2013–2100) the CISNET website (CISNET 2016).
Smoking Current and former smoking CISNET Lung Group,(Holford et al. 2014a, Holford, Levy and
prevalence prevalence by age and gender Meza 2016, Jeon et al. 2018, Tam et al. 2018) available on
for initial year the CISNET website (CISNET 2016).
NVP Excess risk of NVP use NVP mortality risks estimated to be 5% that of smoking
relative risk measured relative to excess excess risk for both genders at all ages, based on multi-
multiplier smoking risks (mortality rate criteria decision analysis(Nutt et al. 2016) and independent
of current smokers – review (McNeill et al. March 2020). 40% risk is also applied
mortality rate of never in the sensitivity analysis.
smokers)
NVP Rate of switching from Ranges from 0.6%-4.0%, estimated by age group and gender
Switching smoking cigarettes to using prospective analysis from PATH data 2013–2018
rate exclusive NVP use
Smoking Ratio of smoking initiation 75% of No-NVP smoking initiation rate, based on recent
initiation rate in the NVP Scenario to studies (Levy, Yuan and Li 2017, Levy et al. 2018c, National
multiplier smoking initiation in the No- Center for Health Statistics 2019).
in the NVP NVP Scenario
Scenario
NVP Ratio of NVP initiation rate in 50% of No-NVP smoking initiation rate, based on recent
initiation the NVP Scenario to smoking studies (Cullen et al. 2019, Hammond et al. 2019, Miech et
multiplier initiation in the No-NVP al. 2019b, Miech et al. 2019c).
in the NVP Scenario
Scenario
Smoking Ratio of smoking cessation 100% of the No-NVP smoking cessation rate
cessation rate in the NVP Scenario to
multiplier smoking cessation in the No-
in the NVP NVP Scenario
Scenario
NVP Ratio of NVP cessation rate in 100% of the No-NVP smoking cessation rate
cessation the NVP Scenario to smoking
multiplier cessation in the No-NVP
in the NVP Scenario
Scenario
Notes: NVP = nicotine vaping product. No-NVP Scenario refers to values in the absence of NVP use. NVP
Scenario refers to values with NVP use.
Table 1 here
Page 9/36The No-NVP Scenario
The current, former and never smoking death rates and expected life years of never smokers were developed by
Rosenberg et al (Holford et al. 2014a, Holford et al. 2014b, Holford, Levy and Meza 2016, Rosenberg et al. 2012)
and are available on the CISNET website (CISNET 2016). Current population, mortality rate and expected life
year estimates are from the CDC (Center for Disease Control and Prevention 2019).
The NVP Scenario
The NVP Scenario requires six input parameters: NVP mortality risks, NVP switching rate, smoking initiation,
vaping initiation, smoking cessation and vaping cessation.
The NVP relative risk multiplier, RiskNVP, represents the relative risk of death associated with current NVP use as
a percentage of the excess mortality risk experienced by current or former smokers as defined above. NVP
relative mortality risks are designated as 5% of cigarette excess risks based on a multi-criteria decision analysis
(Nutt et al. 2016) and a Public Health England review (McNeill et al. March 2020). Since others have suggested
higher risks (de Groot et al. 2018, Nelluri et al. 2016, Tegin et al. 2018, Unger and Unger 2018), an NVP relative
risk multiplier of 40% is also considered.
The NVP switching rate σa is the annual rate at which current smokers switch from smoking to NVP use, leading
to a direct reduction in smoking prevalence. Baseline male (female) NVP yearly switching rates are based on
prospective data that we collected from the 2013/2014, 2014/2015, 2015/2016, and 2016/2017 Population
Assessment of Tobacco and Health (PATH) surveys (U.S. Food and Drug Administration, National Institutes of
Health and Abuse. 2019) averaged over years: 4% (2.5%) for ages 18–24, 2.5% (2.0%) for ages 25–34, 2.5%
(1.6%) for age 35–44, 1.3% (1.4%) for ages 45–54, 1.2% (1.4%) for ages 55–64, and 0.6% (1.0%) for ages 65
and above. Those below age 18 were assigned the age 18–24 rate. We also consider switching rates that are
50% lower and 100% higher than those baseline estimates. Rates are initially assumed constant over time (i.e.,
0% decay), but we also consider a 20% decay rate, δ, to reflect the potential for switching rates to decline in the
absence of innovation.
Since the smoking initiation in the NVP Scenario is measured relative to smoking initiation (Inita,t) in the No-NVP
Scenario, the smoking initiation multiplier αS is greater than 100% if NVP use increases net smoking initiation
beyond the rate at which individuals would have otherwise initiated smoked in the absence of NVPs (i.e.,
gateway in > gateway out), and is less than 100% if those who would have initiated smoking tend to transition to
exclusive NVP use instead of smoking (i.e., gateway out > gateway in). Based on the more rapid downward trend
in US youth and young adult smoking as NVP use increased in recent years (Levy et al. 2019a), the age- and
time-invariant baseline smoking initiation multiplier is initially set at 75%, i.e. a 25% net decrease in smoking
initiation due to vaping. A range of 25–125% is also considered.
The NVP initiation rate multiplier αV reflects the youth and young adult initiation of NVP use relative to smoking
initiation rates (Inita,t) in the No-NVP Scenario. If less than 100%, NVP initiation rates are lower than smoking
initiation rates in the No-NVP Scenario. i.e., fewer individuals become regular NVP users than who would have
become smokers in the No-NVP Scenario. Reflecting the increased US youth and young adults regular NVP users
in recent years (Cullen et al. 2019, Hammond et al. 2019, Levy, Yuan and Li 2017, Miech et al. 2019b, Miech et al.
Page 10/362019c), the age- and time-invariant baseline NVP initiation multiplier is initially set at 50% for all ages.
Sensitivity analysis is conducted over the range of 25–75%.
Since smoking cessation in the NVP Scenario is measured relative to smoking cessation (Cessa,t) in the No-NVP
Scenario, the smoking cessation multiplier χS is greater than 100% if smoking cessation rates are higher in the
NVP Scenario than in the No-NVP Scenario, e.g., if the availability of NVPs leads to increased smoking
cessation. A parameter less than 100% implies that smokers on net are less likely to quit smoking in the NVP
Scenario compared to the No-NVP Scenario, e.g., NVP use leads to dual use (continued smoking) rather than
complete cessation among smokers. The baseline smoking cessation rate multiplier is initially set at 100% with
a range of 50%-150% also considered.
The NVP cessation multiplier χV is greater than 1 if NVP cessation rates are higher than smoking cessation rates
in the No-NVP Scenario. The parameter is less than 100% if NVP cessation rates are lower than smoking
cessation rates in the No-NVP Scenario, e.g., NVPs are less addictive than cigarettes. The baseline NVP
cessation multiplier is set at 100%, with a plausible range of 50%-150%.
Model Validation and Analysis
The model estimates the NVP effects over time for the prevalence of current and former smokers, current and
former NVP users, and former smokers using NVPs, and for smoking-attributable and NVP-attributable deaths.
The model was first validated over the years 2013 to 2018 by comparing model predictions of current smoking
prevalence to current smoking prevalence rates from the NHIS (Centers for Disease Control and Prevention
2019b) by age and gender. We focus on relative reductions over the period 2013–2018, because levels in the
initial year 2013 in the model differ from those in the NHIS. We also validated NVP use. However, we confine the
model comparison to NVP prevalence measures from the 2018 NHIS. Although NVP use was already occurring
in 2013, the model itself begins with no NVP use that year and is adjusted to reach the 2018 levels. (Levy et al.
2019b). Consequently, we validate NVP use against NHIS estimates for 2018, the latest year for which data was
available rather than rely on prior trend data. We defined NVP users as those who used e-cigarettes at least 10 of
the past 30 days to reflect more regular use.
Upon validating the model, we consider how NVP use affects smoking prevalence, smoking- and NVP-
attributable deaths and LYLs. We conduct sensitivity analyses for the NVP transition and risk parameters over
the plausible ranges specified above focusing on their impact on premature attributable deaths and LYLs.
Results
Validation of Smoking Prevalence
Using the initial (best estimate) input parameter estimates, the SAVM predictions are validated against smoking
prevalence from NHIS data for 2013–2018 as shown in Table 2. For ages 18 and above, SAVM projects that
male (female) smoking prevalence fell from 21.4% (15.9%) in 2013 to 16.7% (12.6%) in 2018, while NHIS shows
a decline from 20.3% (15.4%) in 2013 to 15.8% (12.0%) in 2018. NHIS shows a 22.2% (22.1%) relative reduction
between 2013 and 2018 compared to a 22.2% (20.7%) relative reduction in SAVM.
Table 2 here
Page 11/36By age group, SAVM projects that male (female) prevalence for ages 18–24 fell by 33.0% (33.7%) in relative
terms between 2013 and 2018 compared to 60.8% (52.6%) from NHIS over the same time period. For ages 25–
44, SAVM projects a relative decline of 21.0% (17.6%) compared to 17.2% (16.6%) from NHIS. For ages 45–64,
SAVM projects a relative decline of 19.9% (18.1%) compared to 15.2% (20.9%) from NHIS. For ages 65 and
above, SAVM projects a relative decline of 16.6% (20.3%) compared to 6.3% (4.0%) from NHIS.
Thus, while predicting smoking prevalence well for the adult population, SAVM tends to under-predict relative
reductions in smoking prevalence at younger ages and over-predict relative reduction at older ages. While SAVM
estimates for 2018 are often outside the NHIS confidence intervals, upon scaling all years by the initial year
(2013) from SAVM relative to the initial year in NHIS for comparability, the SAVM 2018 estimates are generally
within the NHIS confidence intervals, with the exceptions of the 18–24 age group for males and the 65 and
above age group for females. The scaled age group for ages 18 and above is shown for in Figs. 2.a. (includes
the SAVM and NHIS (with 95% confidence interval) male prevalence rates as shown in Table 2, and the scaled
male SAVM prevalence rates calculated as the male SAVM prevalence rates in 2013–2018 multiplied by 94.8%
=2013 NHIS male rate/2013 SAVM male rate) and Fig. 2.b. (includes the SAVM and NHIS (with 95% confidence
interval) female prevalence rates as shown in Table 2, and the scaled female SAVM prevalence rates calculated
as the as the female SAVM prevalence rates in 2013–2018 multiplied of 96.7% =2013 NHIS female rate/2013
SAVM female rate).
Figure 2.a. and Fig. 2.b. here
Validation of NVP Prevalence
The SAVM predictions for exclusive NVP use are validated against the overall NVP prevalence from NHIS data
for 2018 as shown in Table 3. For ages 18 and above, SAVM projects 2018 NVP prevalence of 3.0% for males
compared to 3.1% (95% CI:2.7%-3.5%) from NHIS, and 1.8% for females compared to 1.5% (95% CI:1.3%-1.8%).
By age group for males, the SAVM projection against NHIS comparisons (with confidence intervals) for 2018 are
7.5% vs 6.8% (95% CI:4.8%-8.8%) for ages 18–24, 4.2% compared to 4.7% (95% CI:3.8%-5.6%) for ages 25–44,
1.4% vs. 1.5% (95% CI:1.0%-1.9%) for ages 45–64, and 0.5% vs. 0.6% (95% CI:0.3%-0.9%) for ages 65 and above.
For females, SAVM projections vs NHIS estimates are 4.9% vs. 3.1% (95% CI:1.8%-4.5%) for ages 18–24, 2.4%
vs. 1.9% (95% CI:1.4%-2.3%) for ages 25–44, 1.0% vs. 1.3% (95% CI:1.0%-1.7%) for ages 45–64, and 0.4% vs.
0.5% (95% CI:0.3%-0.7%) for ages 65 and above. SAVM predictions (overall and by age group) fell within the 95%
confidence intervals estimated from NHIS data, except for females ages 18–24 and 25–44.
Table 3. here
Public Health Impact Under the Baseline NVP and No-NVP
Scenario
Table 4 presents US smoking and NVP use prevalence, deaths, and LYLs for males and females ages 18–99
over the modeling period 2013–2100 for all existing and new birth cohorts. We first apply the baseline
parameters: RiskNVP =5% that of smoking, with multipliers for smoking initiation αS = 75%, NVP initiation αV =
50%, smoking cessation χS = 100%, NVP cessation χV = 100%, with switching rates σa remaining constant over
time (δ = 0%).
Page 12/36Table 4
Baseline SAVM outcomes under NVP Scenario vs. No-NVP Scenario, all cohorts including new births, US, by
gender, in years 2013–2100, ages 18–99
Year 2013 2014 2040 2100 Cumulativea
US Males
No-NVP Scenariob Smokers (%) 21.4% 20.9% 13.7% 11.5% -
SADs 280,925 279,542 266,482 157,507 19,945,214
LYLs 3,668,313 3,651,554 2,808,307 1,665,429 217,668,305
NVP Scenarioc Smokers (%) 21.4% 20.4% 6.3% 4.0% -
NVP users (%) 0.0% 0.4% 7.2% 8.9% -
FS-NVP users (%) 0.0% 0.2% 2.2% 1.2% -
SVADs 280,925 278,242 234,175 65,057 15,591,862
LYLs 3,668,313 3,623,321 2,080,017 585,121 144,047,497
Difference SADs averted 0 1,300 32,307 92,450 4,353,351
LYLs averted 0 28,233 728,290 1,080,309 73,620,808
US Females
No-NVP Scenario Smokers (%) 15.9% 15.5% 9.8% 8.2% -
SADs 110,815 109,395 109,013 57,578 7,803,840
LYLs 1,405,272 1,399,722 1,079,004 569,181 80,719,695
NVP Scenario Smokers (%) 15.9% 15.2% 5.5% 3.7% -
NVP users (%) 0.0% 0.2% 4.4% 5.5% -
FS-NVP users (%) 0.0% 0.1% 1.4% 0.8% -
SVADs 110,815 108,576 95,375 27,797 6,266,913
LYLs 1,405,272 1,385,563 829,318 233,051 56,528,536
Difference SADs averted 0 819 13,638 29,782 1,536,927
LYLs averted 0 14,159 249,686 336,130 24,191,158
Notes: NVP = nicotine vaping product, SADs = smoking attributable deaths, SVADs = smoking and vaping
attributable deaths, LYLs = life-years lost, FS-NVP = former smokers using NVPs.
a Cumulative is the sum of SADs/SVADs or LYLs over the years 2013–2100.
b
No-NVP Scenario refers to the values of smoking prevalence (%), SADs, and LYLs in the absence of NVP
use.
cNVP Scenario refers to values of smoking prevalence (%), exclusive NVP prevalence (%), former smokers
using NVP prevalence (%), SVADs, and LYLs with NVP use.
Page 13/36Year 2013 2014 2040 2100 Cumulativea
Both genders
Difference SADs averted 0 2,119 45,946 122,232 5,890,278
LYLs averted 0 42,392 977,976 1,416,439 97,811,967
SADs averted (%) 0.0% 0.5% 12.2% 56.8% 21.2%
LYLs averted (%) 0.0% 0.8% 25.2% 63.4% 32.8%
Notes: NVP = nicotine vaping product, SADs = smoking attributable deaths, SVADs = smoking and vaping
attributable deaths, LYLs = life-years lost, FS-NVP = former smokers using NVPs.
a Cumulative is the sum of SADs/SVADs or LYLs over the years 2013–2100.
bNo-NVP Scenario refers to the values of smoking prevalence (%), SADs, and LYLs in the absence of NVP
use.
cNVP Scenario refers to values of smoking prevalence (%), exclusive NVP prevalence (%), former smokers
using NVP prevalence (%), SVADs, and LYLs with NVP use.
Table 4 here
In the No-NVP Scenario, smoking prevalence ages 18 and above is 21.4% in 2013 declining to 13.7% in 2040,
and 11.5% in 2100 for males, 15.9% in 2013 declining to 9.8% in 2040, and 8.2% in 2100 for females.
Cumulative (2013–2100) SADs are 19.9 million for males and 7.8 million for females, while cumulative LYLs are
217.7 million for males and 80.7 million for females.
In the NVP Scenario, male (female) smoking prevalence declines to 6.3% (5.5%) in 2040 and then declines to
4.0% (3.7%) in 2100. Exclusive NVP users include those who initiated NVP use from never smokers (de novo) at
all ages and those who switched to NVP use from smoking before age 35. Male (female) exclusive NVP use
increases from 0.4% (0.2%) in 2014 to 7.2% (4.4%) in 2040, and to 8.9% (5.5%) in 2100. The prevalence of
former smokers using NVPs (those switching from smoking to vaping after age 34) increases from 0.2% (0.1%)
in 2014 to 2.2% (1.4%) in 2040, then declines to 1.2% (0.8%) in 2100. Compared with females, greater reduction
in male smoking and increase in NVP use is due to higher levels of switching to NVPs at younger ages among
males. Smoking- and vaping-attributable deaths (SVADs) and LYLs cumulate to 15.6 million and 144.0 million
during 2013–2100 for males and to 6.3 million and 56.5 million for females.
Under the NVP Scenario, approximately 5.9 million (4.4 million males, 1.5 million females) premature deaths are
averted, a 21% relative reduction compared to the No-NVP Scenario, and 97.8 million (73.6 million males,
24.2 million females) LYLs are averted, a 33% relative reduction.
Sensitivity to NVP Transition Parameters
Sensitivity analyses are shown in Table 5 for smoking- and vaping-attributable deaths (SVADs) and in Table 6
for life-years lost (LYLs). While holding the NVP relative risk multiplier (RiskNVP) constant at 5% (columns 2 and
3 in both tables), we examine the individual impact of variations in transition rates on SVADs and LYLs averted
Page 14/36relative to the initial levels in the NVP Scenario. Each of five transition multipliers were varied for 1) NVP
switching, 2) smoking initiation, 3) NVP initiation, 4) smoking cessation, and 5) NVP cessation.
Page 15/36Table 5
Sensitivity analysis: Smoking attributable deaths and deaths averted in the No-NVP Scenario and NVP Scenario
across parameter changes, both genders, ages 18–99, 2013–2100
Scenario NVP relative risk (RiskNVP) a = NVP relative risk (RiskNVP) = Relative
40% Change
5%
(5% vs
40%)d
No-NVP Scenario Total SADs Total SADs
27,749,053 - 27,749,053 -
NVP Scenario with parameter Averted SADs Relative Averted SADs Relative
changes from baseline and SVADsb and SVADsb
Change Change
(vs. (vs. baseline
baseline estimate)c
estimate)c
50% of switch rate (σa),f no 5,890,278 - 2,947,060 - -50.0%
decay
(δ = 0%) g
200% of switch rate (σa), no 4,195,978 -28.8% 1,946,856 -33.9% -53.6%
decay (δ=0%)
100% of switch rate (σa), 7,914,890 34.4% 4,141,413 40.5% -47.7%
decay (δ= −0.20%)
25% of smoking initiation 2,332,235 -60.4% 835,516 -71.6% -64.2%
multiplier (αS)h
125% of smoking initiation 7,351,025 24.8% 4,913,944 66.7% -33.2%
multiplier (αS)
50% of switch rate (σa),f no 4,588,952 -22.1% 1,186,597 -59.7% -74.1%
decay
(δ = 0%) g
200% of switch rate (σa), no 5,901,511 0.2% 3,483,735 18.2% -41.0%
decay (δ=0%)
100% of switch rate (σa), 5,880,955 -0.2% 2,441,568 -17.2% -58.5%
decay (δ= −0.20%)
50% of smoking cessation 3,615,711 -38.6% 289,152 -90.2% -92.0%
(χS)j
150% of smoking cessation 7,081,194 20.2% 4,395,398 49.1% -37.9%
(χS)
Page 16/36Scenario NVP relative risk (RiskNVP) a = NVP relative risk (RiskNVP) = Relative
40% Change
5%
(5% vs
40%)d
50% of NVP cessation (χV)k 5,636,131 -4.3% 1,209,331 -59.0% -78.5%
150% of NVP cessation (χV) 5,998,902 1.8% 3,717,187 26.1% -38.0%
Notes: NVP = nicotine vaping product, SADs = smoking attributable deaths.
aThe NVP relative risk multiplier is the mortality risk of NVPs as a percentage of the excess mortality risk of
smoking.
bThe absolute reduction in smoking- and vaping-attributable deaths in the NVP Scenario compared to the
No-NVP Scenario over 2013–2100.
c The relative percent change in averted SADs for each NVP Scenario compared to the initial NVP Scenario
(best estimate). A negative (positive) value means that changing the parameter will decrease (increase) the
averted SADs in the specific scenario relative to averted SADs in the initial NVP Scenario.
d
The relative percent change in averted SADs between scenarios with NVP risk multipliers of 5% vs. 40% is
calculated as (Averted SADs with 40% NVP risk - Averted SADs with 5% NVP risk) / Averted SADs with 5%
NVP risk.
eThe initial values for each input parameters in NVP Scenario are as following. NVP switching rate (σa ) =
Males (Females): 4% (2.5%) for ages 24 and below, 2.5% (2.0%) for ages 25–34, 2.5% (1.6%) for age 35–44,
1.3% (1.4%) for ages 45–54, 1.2% (1.4%) for ages 55–64, and 0.6% (1.0%) for ages 65 and above; αS = 75%;
αV = 50%; χS =100%; χV =100%;δ = 0%.
f
NVP switching rate is the annual rate at which current smokers switch to NVPs.
g Annual decay rate is the exponential rate of decline in switching rates over time.
h Smoking initiation multiplier is relative to smoking initiation in the No-NVP Scenario.
i NVP initiation multiplier is relative to smoking initiation rates in the No-NVP Scenario.
j Smoking cessation multiplier is relative to smoking cessation in the No-NVP Scenario.
k
NVP cessation multiplier is relative to smoking cessation rates in the No-NVP Scenario.
Page 17/36Table 6
Sensitivity analysis: Life-years lost and averted life years lost in the No-NVP Scenario and NVP Scenario across
parameter changes, both genders, ages 18–99, 2013–2100
Scenario NVP relative risk (RiskNVP)a = NVP relative risk (RiskNVP) = Relative
40% Change
5%
(5% vs
No-NVP Scenario Total LYLs Total LYLs 40%)d
298,388,000 - 298,388,000 -
NVP Scenario with parameter Averted Relative Averted Relative
LYLsb LYLsb
changes from baseline Change Change
(vs. baseline (vs. baseline
estimate)c estimate)c
Baseline Estimatee 97,811,967 - 51,904,506 - -46.9%
50% of switch rate (σa),f no 70,025,600 -28.4% 34,869,552 -32.8% -50.2%
decay
(δ = 0%) g
200% of switch rate (σa), no 129,004,951 31.9% 71,011,990 36.8% -45.0%
decay (δ=0%)
100% of switch rate (σa), 36,052,459 -63.1% 13,960,932 -73.1% -61.3%
decay (δ= −0.20%)
25% of smoking initiation 118,118,260 20.8% 81,026,822 56.1% -31.4%
multiplier (αS)h
125% of smoking initiation 80,006,203 -18.2% 26,273,401 -49.4% -67.2%
multiplier (αS)
25% of NVP initiation (αV)i 97,981,994 0.2% 60,046,621 15.7% -38.7%
75% of NVP initiation (αV) 97,672,846 -0.1% 44,283,708 -14.7% -54.7%
50% of smoking cessation 64,946,262 -33.6% 13,426,132 -74.1% -79.3%
(χS)j
150% of smoking cessation 117,770,436 20.4% 75,901,585 46.2% -35.6%
(χS)
50% of NVP cessation (χV)k 94,648,016 -3.2% 28,084,183 -45.9% -70.3%
150% of NVP cessation (χV) 99,516,947 1.7% 64,898,048 25.0% -34.8%
Notes: NVP = nicotine vaping product, LYLs = life-years lost
a The NVP relative risk multiplier is the mortality risk of NVPs as a percentage of the excess
Page 18/36Scenario NVP relative risk (RiskNVP)a = NVP relative risk (RiskNVP) = Relative
40% Change
5%
(5% vs
No-NVP Scenario Total LYLs Total LYLs 40%)d
mortality risk of smoking.
bThe absolute reduction in life-years lost in the NVP Scenario compared to the No-NVP Scenario over 2013–
2100.
c The relative percent change in averted LYLs for each NVP Scenario compared to the initial NVP Scenario
(best estimate). A negative (positive) value means that changing the parameter will decrease (increase) the
averted LYLs in the specific scenario relative to averted LYLs in the initial NVP Scenario.
d The relative percent change in averted LYLs between scenarios with NVP risk multipliers of 5% vs. 40% is
calculated as (Averted LYLs with 40% NVP risk - Averted LYLs with 5% NVP risk) / Averted LYLs with 5% NVP
risk.
eThe initial values for each input parameters in NVP Scenario are as following. NVP switching rate (σa ) =
Males (Females): 4% (2.5%) for ages 24 and below, 2.5% (2.0%) for ages 25–34, 2.5% (1.6%) for age 35–44,
1.3% (1.4%) for ages 45–54, 1.2% (1.4%) for ages 55–64, and 0.6% (1.0%) for ages 65 and above; αS = 75%;
αV = 50%; χS =100%; χV =100%;δ = 0%.
f NVP switching rate is the annual rate at which current smokers switch to NVPs.
g Annual decay rate is the exponential rate of decline in switching rates over time.
h Smoking initiation multiplier is relative to smoking initiation in the No-NVP Scenario.
i NVP initiation multiplier is relative to smoking initiation rates in the No-NVP Scenario.
j Smoking cessation multiplier is relative to smoking cessation in the No-NVP Scenario.
k NVP cessation multiplier is relative to smoking cessation rates in the No-NVP Scenario.
Tables 5 and 6 here
If the baseline NVP switching rate parameter (σa) is reduced by 50% with 0% decay (δ = 0%), NVP replacement of
smoking is less in the NVP Scenario, and averted SVADs decline in relative terms by 28.8% from 5.9 million to
4.2 million; averted LYLs decline by 28.4% from 97.8 million to 70.0 million. A doubling of the NVP switching
rates from their initial levels from PATH yields a 34.4% relative increase in averted SVADs to 7.9 million and a
31.9% relative increase in averted LYLs to 129.0 million. Using the initial NVP switching rates but with a 20%
decay rate (δ= -20%) reduces averted SVADs by 60.4% to 2.3 million and reduces averted LYLs by 63.1% to
36.1 million.
Increasing the smoking initiation multiplier (αS) from its baseline level of 75% primarily increases youth and
young adult use at first, leading to more SVADs and LYLs later in life. An increase from 75–125% yields
4.6 million averted SVADs, a relative reduction of 22.1% compared to the initial NVP Scenario, and 80.0 million
Page 19/36averted LYLs, a relative reduction of 18.2%. With the smoking initiation multiplier at 25%, averted SVADs increase
to 7.4 million, a relative increase of 24.8%, and averted LYLs increase to 118.1 million, a relative increase 20.8%.
Increasing or decreasing the NVP initiation multiplier (αV) leads to a much smaller relative change in averted
SVADs and LYLs due to the lower risks of NVPs relative to smoking (5%). Increasing the NVP initiation multiplier
from 50–75% yields a relative reduction of 0.16% in averted SVADs and of 0.14% in averted LYLs. A reduction in
the NVP initiation multiplier to 25% resulted in the increase in averted SVADs by 0.19% and in averted LYLs by
0.17%.
Compared to changes in the initiation parameters, changes in cessation multipliers lead to a more immediate
impact on SVADs, since cessation generally occurs later in life when mortality risk is highest. Increasing the
smoking cessation multiplier (χS) from 100–150% of cessation in the No-NVP Scenario yields a 20.2% relative
increase to 7.1 million averted SVADs and a 20.4% relative increase to 117.8 million averted LYLs. Reducing the
smoking cessation multiplier from 100–50% yields a 38.6% reduction to 3.6 million averted SVADs and a 33.6%
reduction to 64.9 million averted LYLs. Comparable changes in the NVP cessation parameters yield less change.
Increasing the NVP cessation multiplier (χV) from 100–150%, averted SVADs increased by 1.8% and LYLs
increased by 1.7%. Reducing the NVP cessation multiplier to 50%, averted SVADs and LYLs decline by 4.3% and
3.2%, respectively.
Thus, increasing NVP risks leads to greater sensitivity of LYLs to changes in switching, NVP initiation, and NVP
cessation parameters, but still yields public health gains. Since the NVP risk is substantially lower than the
smoking risk, the relative changes in averted SVADs and LYLs using the NVP initiation or cessation multipliers
are less than the relative changes using the smoking initiation or cessation multipliers for comparable changes.
Sensitivity to NVP Relative Risks
Tables 5 and 6 provide estimates of averted SVADs and LYLs with an NVP relative risk multiplier (RiskNVP) of
40% (columns 4 and 5) instead of the baseline 5%, under the different NVP transition parameter ranges. With all
other parameters at their baseline levels in the NVP Scenario, averted SVADs decrease in relative terms by 50.0%
from 5.9 million with 5% NVP risks to 2.9 million with 40% NVP risks, and averted LYLs decrease by 46.9% from
97.8 million to 51.9 million.
Compared to an NVP relative risk of 5%, an NVP relative risk of 40% yields a 50.2% relative reduction in averted
LYLs when reducing the NVP switching rates (σa) by 50%, while increasing the NVP switching rates by 100%
yields a 45.0% relative reduction compared to 5% NVP risk. Reducing the smoking initiation multiplier (αS) from
75–25% yields a 31.4% relative reduction in LYLs, while an increase to 125% yields a 67.2% relative reduction.
Reducing the NVP initiation multiplier (αV) from 50–25% yields 38.7% fewer averted LYLs, while an increase to
75% yields 54.7% fewer averted LYLs. Reducing the smoking cessation multiplier (χS) from 100–50% yields
79.3% fewer averted LYLs, while an increase to 150% yields 35.6% fewer averted LYLs. Reducing the NVP
cessation rate multiplier (χ) from 100–50% yields 70.3% fewer averted LYLs, while an increase to 150% yields
34.8% fewer averted LYLs.
Discussion
Page 20/36The SAVM is among the first validated simulation models incorporating vaping. SAVM estimates for smoking
prevalence trends were generally close to those from 2013–2018 NHIS observational data, except at younger
ages where reductions in smoking prevalence in recent years were greater than those predicted by the model.
The validation of the 2018 NVP use estimate was less clear due to our assumption that NVP use begins at a
zero level in 2013, but SAVM 2018 estimates were generally consistent with those of the 2018 NHIS.
Based on our initial estimates of NVP health risk, switching rates, smoking and NVP initiation rates, and
smoking and NVP cessation rates, the SAVM projects that NVP use in the population will translate to 5.9 million
premature smoking- and vaping-attributable deaths avoided and 97.8 million life years gained from 2013–2100.
Our sensitivity analyses showed how different parameters influence the estimated impact of NVP use on public
health.
There is a considerable uncertainty and controversy surrounding the relative risks of NVP use compared to
smoking (Eissenberg et al. 2020). The initial NVP relative risk multiplier was set to 5% (Nutt et al. 2016,McNeill et
al. March 2020), but when increased to 40%, the associated public health gains were substantially reduced,
although still positive.
Model estimates are particularly sensitive to the rate of switching from smoking to NVP use and smoking
initiation in the NVP Scenario. These rates, particularly the NVP switching rates of young adults, may explain the
failure of the SAVM to predict the recent rapid decline in smoking by those ages 18–24. Recent studies (Al Rifai
et al. 2020, Creamer et al. 2019, Levy et al. 2019b, Mirbolouk et al. 2018, Vallone et al. 2020) indicate that NVP
use among US young adult smokers may be higher and smoking rates lower than indicated by our switching
rates. We assume that NVPs lead to a net decrease in smoking initiation rates (i.e., αS < 1). However, the
downward trend in youth and young adult smoking has been especially great since 2017, at the same time
vaping devices such as JUUL gained popularity (Chu et al. 2018, Jackler and Ramamurthi 2019, McKeganey and
Russell 2019, Vallone et al. 2018). Youth and young adult smoking prevalence dropped by as much as 40%
relative to earlier trends at about the time when NVP use increased in these same age groups (Levy et al. 2019a)
and the 2019 Monitoring the Future survey (University of Michigan 2019) indicates past 30 day smoking rates
as low as 5.8% and daily smoking rates as low as 2.4%. This recent data suggests that our smoking initiation
multiplier parameter. The role of NVPs in the initiation of smoking is particularly controversial (Levy et al. 2017),
but, like earlier work(Cherng et al. 2016, National Academy of Sciences 2018, Warner and Mendez 2019), public
health impacts are relatively insensitive to the NVP initiation parameter. Nevertheless, while there is currently
considerable uncertainty about NVP initiation, especially regarding more regular use (Hammond et al. 2019,
Miech et al. 2019a, Miech et al. 2019b, Miech et al. 2019c).
Public health estimates are sensitive to the smoking cessation parameter in the NVP Scenario. As a conservative
estimate, we assume that the smoking cessation multiplier was 100%, but cessation may be higher than in the
No-NVP Scenario to the extent that NVPs are an effective smoking cessation alternative (Hajek, McRobbie and
Bullen 2016, Przulj, Hajek and Phillips-Waller 2019, Zhu et al. 2017, Zhuang et al. 2016). Public health estimates
are less sensitive to the NVP cessation multiplier when the NVP relative risks are 5%, but more sensitive when
the risk increases to 40%. Our NVP cessation multiplier baseline value of 100% assumes NVP cessation rates
are identical to that of smoking, but some recent evidence indicates that NVPs may be less addictive than
smoking, implying a value greater than 100% (Bold et al. 2018, Liu et al. 2017, Martinez et al. 2019, Morean,
Krishnan-Sarin and O'Malley 2018, Strong et al. 2017). These rates, along with the NVP and smoking initiation
Page 21/36parameters, may vary over time (e.g., due to technological improvements in NVP or because those most
susceptible to quitting have already quit) with age- and gender-related variations.
Government regulations could dramatically influence the uptake, use, and risks of NVPs. (e.g., by the FDA in the
US). If the health risks of using NVPs are found to be higher than anticipated, those risks may be reduced with
prudent FDA regulations that ban or limit the presence of known toxicants in e-liquids and by implementing
product standards that encourage future NVP industry innovations that reduce NVP risks. Product regulations
can also reduce the addictiveness of NVPs by reducing allowable nicotine content, thereby reducing NVP
initiation and increasing NVP cessation. Policies that make NVPs more desirable relative to smoking could
improve public health through increased switching from cigarettes to NVPs and increased cessation from
smoking. Finally, the public health benefits of product regulation and industry innovation can be amplified with
strong policies that continue to be directed at smoking—which would improve public health through reduced
smoking initiation and increased smoking cessation. In particular, higher cigarette taxes relative to NVP taxes,
e.g., in proportion to their risks, is likely to increase switching from cigarette to NVP use (Chaloupka, Sweanor
and Warner 2015, Huang et al. 2018, Pesko et al. 2018, Stoklosa, Drope and Chaloupka 2016, Zheng et al. 2016).
Our analysis is subject to limitations. Future projections in the No-NVP Scenario are based on data through 2013
and we assumed that the projected trends would have simply continued. While our No-NVP Scenario is validated
based on trends informed by data through 2013, future trends are subject to uncertainty and would depend on
tobacco control policies and other environmental changes that would have occurred if NVPs had not come onto
the US market. Our validation of smoking prevalence indicates that the model under-predicts reductions for
those ages 18–24 and over-predicts reductions for those ages 65 and above. Further analysis is warranted. Our
validation of NVP use is sensitive to the measure of NVP use. We applied a measure of at least 10 of the last 30
days as a definition of regular use, but measures of regular use are not well defined. Measures of
everyday/someday use and at least 1 day in the past 30 days yield higher estimates, especially at younger ages.
The SAVM applies simplifying assumptions so that the model is user-friendly and can be adapted to individual
needs. In the SAVM, a never smoker who temporarily uses NVPs and does not transition to smoking is
considered a non-user. Our analysis of public health impacts also depends on the smoking prevalence projected
in the absence of NVPs. However, the model validated well through the year 2018. Because transitions to and
from dual use are often particularly unstable (Azagba, Shan and Latham 2019, Borland et al. 2019, Coleman et
al. 2018, Robertson et al. 2019), we have chosen not to distinguish dual use from cigarette smoking in the NVP
Scenario. In addition, the model does not consider relapse, so transitions to former smoker or former NVP users
are treated as permanent, consistent with previous CISNET models (Holford et al. 2014a, Holford et al. 2014b,
Holford, Levy and Meza 2016). Our analysis also does not explicitly consider smokers who temporarily use
NVPs (as a dual user or exclusive user) and quickly transition to no cigarette and no NVP as a former smoker.
Except for the switching parameter, we have assumed that the other NVP risk and transitions parameters are age
and time invariant, because current information was considered insufficient to indicate otherwise. As indicated
above, these parameters are likely to depend on regulatory policies toward NVPs. As more information becomes
available, it will be important to integrate such variation in key parameters.
In general, the relative risk, switching, initiation, and cessation parameters, while essential to the model, are
subject to considerable uncertainty. Compared to smoking, NVPs are new products with less empirical evidence
Page 22/36You can also read