A 30 m resolution dataset of China's urban impervious surface area and green space, 2000-2018
←
→
Page content transcription
If your browser does not render page correctly, please read the page content below
Earth Syst. Sci. Data, 13, 63–82, 2021
https://doi.org/10.5194/essd-13-63-2021
© Author(s) 2021. This work is distributed under
the Creative Commons Attribution 4.0 License.

         A 30 m resolution dataset of China’s urban impervious
               surface area and green space, 2000–2018
                         Wenhui Kuang1 , Shu Zhang1,2 , Xiaoyong Li2,3 , and Dengsheng Lu4,5
          1 Key   Laboratory of Land Surface Pattern and Simulation, Institute of Geographic Sciences and Natural
                           Resources Research, Chinese Academy of Sciences, Beijing 100101, China
        2 College of Resources and Environment, University of Chinese Academy of Sciences, Beijing 10049, China
          3 State Key Laboratory of Urban and Regional Ecology, Research Center for Eco-Environmental Sciences,

                                     Chinese Academy of Sciences, Beijing 100085, China
                     4 School of Geographical Sciences, Fujian Normal University, Fuzhou 350007, China
                        5 Fujian Provincial Key Laboratory of Subtropical Resources and Environment,

                                       Fujian Normal University, Fuzhou 350007, China
                               Correspondence: Wenhui Kuang (kuangwh@igsnrr.ac.cn)

                                   Received: 1 May 2020 – Discussion started: 25 June 2020
                    Revised: 10 November 2020 – Accepted: 22 November 2020 – Published: 14 January 2021

      Abstract. Accurate and timely maps of urban underlying land properties at the national scale are of significance
      in improving habitat environment and achieving sustainable development goals. Urban impervious surface (UIS)
      and urban green space (UGS) are two core components for characterizing urban underlying environments. How-
      ever, the UIS and UGS are often mosaicked in the urban landscape with complex structures and composites. The
      “hard classification” or binary single type cannot be used effectively to delineate spatially explicit urban land
      surface property. Although six mainstream datasets on global or national urban land use and land cover products
      with a 30 m spatial resolution have been developed, they only provide the binary pattern or dynamic of a single
      urban land type, which cannot effectively delineate the quantitative components or structure of intra-urban land
      cover. Here we propose a new mapping strategy to acquire the multitemporal and fractional information of the
      essential urban land cover types at a national scale through synergizing the advantage of both big data process-
      ing and human interpretation with the aid of geoknowledge. Firstly, the vector polygons of urban boundaries in
      2000, 2005, 2010, 2015 and 2018 were extracted from China’s Land Use/cover Dataset (CLUD) derived from
      Landsat images. Secondly, the national settlement and vegetation percentages were retrieved using a sub-pixel
      decomposition method through a random forest algorithm using the Google Earth Engine (GEE) platform. Fi-
      nally, the products of China’s UIS and UGS fractions (CLUD-Urban) at a 30 m resolution were developed in
      2000, 2005, 2010, 2015 and 2018. We also compared our products with six existing mainstream datasets in
      terms of quality and accuracy. The assessment results showed that the CLUD-Urban product has higher accu-
      racies in urban-boundary and urban-expansion detection than other products and in addition that the accurate
      UIS and UGS fractions were developed in each period. The overall accuracy of urban boundaries in 2000–2018
      are over 92.65 %; and the correlation coefficient (R) and root mean square errors (RMSEs) of UIS and UGS
      fractions are 0.91 and 0.10 (UIS) and 0.89 and 0.11 (UGS), respectively. Our result indicates that 71 % of pix-
      els of urban land were mosaicked by the UIS and UGS within cities in 2018; a single UIS classification may
      highly increase the mapping uncertainty. The high spatial heterogeneity of urban underlying covers was exhib-
      ited with average fractions of 68.21 % for UIS and 22.30 % for UGS in 2018 at a national scale. The UIS and
      UGS increased unprecedentedly with annual rates of 1605.56 and 627.78 km2 yr−1 in 2000–2018, driven by fast
      urbanization. The CLUD-Urban mapping can fill the knowledge gap in understanding impacts of the UIS and
      UGS patterns on ecosystem services and habitat environments and is valuable for detecting the hotspots of water-
      logging and improving urban greening for planning and management practices. The datasets can be downloaded
      from https://doi.org/10.5281/zenodo.4034161 (Kuang et al., 2020a).

Published by Copernicus Publications.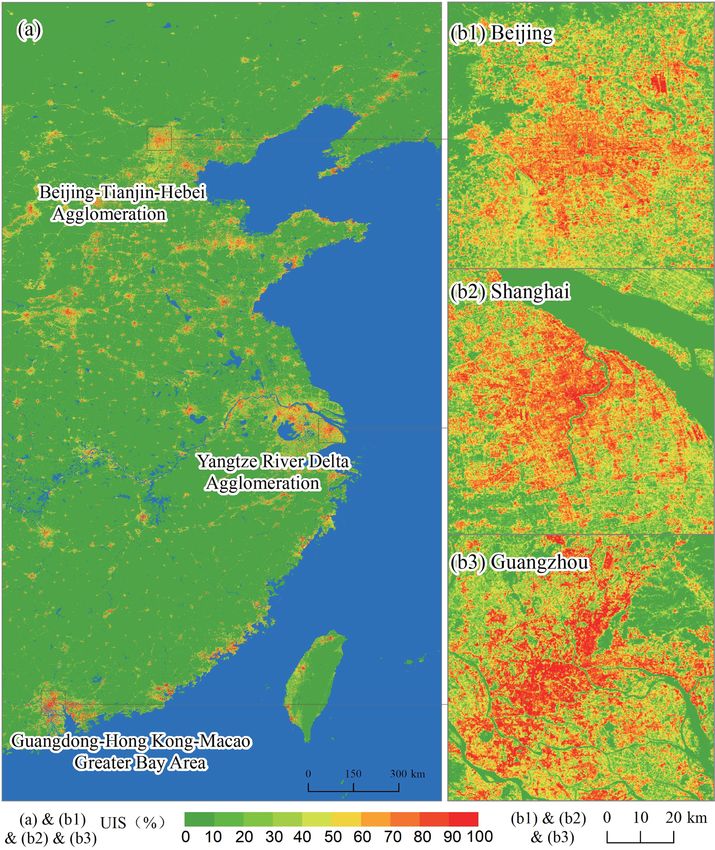
64                                                                        W. Kuang et al.: Dataset of China’s UIS and UGS

1    Introduction                                                al., 2015). Therefore, few urban land products have provided
                                                                 intra-urban UIS and UGS fractions at the sub-pixel level.
                                                                    A detailed UIS dataset inside a city is required as a pri-
                                                                 mary urban environmental index. Numerous studies on im-
The effects of rapid urbanization on environments have been      pervious surface mapping at the national scale mainly rely on
witnessed around the world (Seto et al., 2012; Bai et al.,       medium–low-spatial-resolution remotely sensed data such as
2018; Kuang et al., 2020b, Zhang et al., 2021) and pro-          MODIS and the Defense Meteorological Satellite Program’s
foundly contribute to changes in biosphere, hydrosphere and      Operational Linescan System (DMSP OLS) (Gong et al.,
atmosphere (Wu et al., 2014; Kuang et al., 2018). In China,      2013; Zhou et al., 2014; Grekousis et al., 2015; Zhou et
a rapid urbanization process emerged in the 21st century (Xu     al., 2015; Kuang et al., 2016; Zhou et al., 2018). Recently,
and Min, 2013; Ma et al., 2014; Bai et al., 2014; Kuang,         more research has shifted to employ medium–high-spatial-
2012; Kuang et al., 2016), resulting in a rapid increase in      resolution data (e.g., Landsat) to improve data products (Li
urban impervious surface area (UIS) (Kuang et al., 2013;         et al., 2018; Liu et al., 2018; Gong et al., 2019, 2020a; Li et
Kuang and Dou, 2020; Lu et al., 2008, Kuang and Yan,             al., 2020; Lin et al., 2020). The US Geological Survey have
2018). This process further triggered various urban envi-        developed the National Land Cover Database (NLCD) and
ronmental problems such as urban heat islands and urban          provided impervious surface fraction, percent tree canopy,
flooding (Haase et al., 2014; Hamdi and Schayes; 2007;           land cover classes and their changes with a spatial resolu-
Kuang, 2011; Kuang et al., 2015, 2017; Xu, 2006; Zhang           tion of 30 m (Falcone and Homer, 2012; Yang et al., 2018).
et al., 2017). Although many green areas have been con-          However, a detailed intra-urban UIS and UGS dataset with a
structed in Chinese cities recently, China has a relatively      30 m spatial resolution for China at the national scale is not
lower percentage of urban green space (UGS) than devel-          available yet, making it difficult to conduct detailed analysis
oped countries such as the United States (Nowak and Green-       of aspects such as urban living environments.
field, 2012; Kuang et al., 2014). These urban environmental         A systematic assessment on urban land mapping algo-
problems triggered the urgency of developing accurate ur-        rithms indicates that previous research mainly classified ur-
ban land cover datasets with high spatial resolutions for de-    ban land into a single type with “urban area” or impervious
lineating the underlying urban environments. Along with the      surface area (ISA), which limits recognition of the urban en-
development of Earth observation technologies, remote sens-      vironment (Reba and Seto, 2020). There are two critical chal-
ing has become the mainstream method for mapping UIS and         lenges in mapping urban land cover composites. Firstly, the
UGS and monitoring their changes (Weng, 2012; Wang et al.,       conceptual definition of urban land or ISA in previous re-
2013; Lu et al., 2014, 2018; Zhang et al., 2009).                search is unclear; thus, the spatial extent is inconsistent, re-
   Various land use products such as the Global Land Cover       sulting in a large divergence in the statistical area of urban
product (GlobaLand30) (Chen et al., 2015), the University        land. Meanwhile, the segmentation on urban–rural bound-
of Maryland (UMD) Land Cover Classification (Hansen et           aries has not been accurate from moderate-resolution satellite
al., 2000), Moderate Resolution Imaging Spectroradiometer        images using computer-based automatic classification ow-
(MODIS)-based land use and land cover products (Friedl et        ing to differences in geographic conditions, social economic
al., 2010), GlobCover (Bontemps et al., 2011), and Finer         conditions and land policies. Therefore, accurate mapping
Resolution Observation and Monitoring of Global Land             of urban–rural boundaries is pivotal in detecting urban land
Cover (FROM-GLC) (Gong et al., 2013) are freely available        cover change. Secondly, the spatial heterogeneity of urban
worldwide (Grekousis et al., 2015; Dong et al., 2017). These     surface properties has resulted in difficulty in decomposing
products have different definitions of urban areas or settle-    urban land cover types with complex surface materials at the
ments due to their different classification systems, such as     pixel scale, which has been limited by the huge amounts of
the International Geosphere-Biosphere Programme (IGBP)           data processing and storage capacities required for a 30 m
(Belward, 1996). Some urban land datasets, such as the           resolution.
Normalized Urban Areas Composite Index (NUACI), which               In reality, the urban land cover is composed of UIS, UGS
were constructed by supervised learning approaches, have         and other fractions. UIS refers to the urban impervious sur-
been released at a national or global scale with spatial res-    face features caused by artificial land use activities, like
olutions from 30 m to 1 km (Liu et al., 2018; He et al., 2019;   building roofs, asphalt or cement roads, and parking lots.
Gong et al., 2019). Others such as the built-up grid of the      UGS is an important component of the green infrastructure
Global Human Settlement Layer (GHSL Built) (Pesaresi et          of cities and provides a range of ecosystem services, includ-
al., 2013) and Global Urban Footprint (GUF) (Esch et al.,        ing parks, trees and grass. Previous studies have proven that
2017, 2018) have been published too. Most urban land prod-       spectral mixture analysis (SMA) provides an effective tool
ucts have focused on built-up land or urban area classifi-       to retrieve the UIS and UGS fractions from Landsat mul-
cation but cannot delineate urban land as a heterogeneous        tispectral imagery (Lu and Weng, 2004, 2006; Peng et al.,
unit consisting of UIS, UGS and other fractions (Chen et

Earth Syst. Sci. Data, 13, 63–82, 2021                                              https://doi.org/10.5194/essd-13-63-2021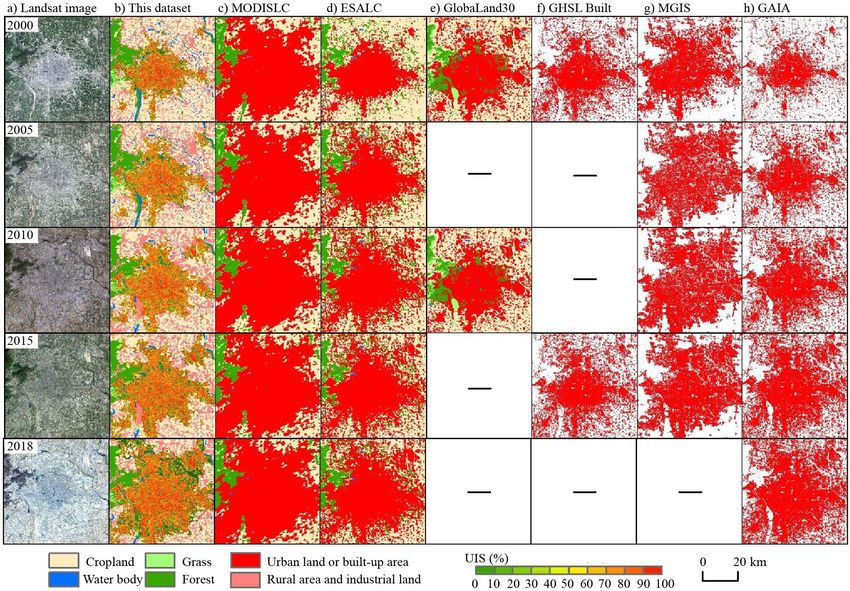
W. Kuang et al.: Dataset of China’s UIS and UGS                                                                                65

2016; Kuang et al., 2018). However, this method needs local       3     Data sources and pre-processing
knowledge for problem-specific analysis such as intra-urban
land cover analysis of a single city or a single urban agglom-    Landsat is the longest-running satellite series for Earth obser-
eration (Zhang and Weng, 2016; Xu et al., 2018). Although         vation. Landsat Thematic Mapper (TM), Enhanced Thematic
the globally standardized SMA can effectively extract sub-        Mapper Plus (ETM+) and Operational Land Imager (OLI)
strate, dark areas and vegetation (Small and Milesi, 2013),       data with path ranges of 118–149 and row ranges of 23–43
the UIS cannot be accurately and directly extracted from          in China were selected (Table 1). In mapping CLUD, Land-
multispectral images without post-processing considering its      sat TM, ETM+ and OLI in each period, China–Brazil Earth
widely spectral variation and different meanings of UIS and       Resources Satellite program (CBERS) and Huan Jing (HJ-
substrate (Lu et al., 2014). Because of the high correlation      1A and HJ-1B) satellite images in 2010 were used to gen-
between UIS and vegetation indices in the urban landscape         erate false-color composite images with near-infrared, red
(Weng et al., 2004), a fractional UIS dataset can be estimated    and green spectral bands as red, green and blue. Image en-
from vegetation indices using a regression-based approach         hancement was performed to improve the visual interpreta-
(Sexton et al., 2013; Wang et al., 2017).                         tion quality. Image-to-image registration was conducted to
   To address the above issues, we propose a synthetical strat-   control the image rectification errors of less than 2 pixels
egy to utilize the advantage of both accurate urban boundary      (60 m). CBERS-1 and Huan Jing (HJ-1A and HJ-1B) satel-
information from China’s Land Use/cover Dataset (CLUD)            lite images were only used in extracting the vector polygons
extracted by human–computer digitalization and the retrieval      of CLUD in 2010, which was conducted using uniform data
of UIS and UGS fractions through big-data processing from         processing with Landsat images.
the GEE platform. Based on this strategy, we developed the           In the retrieval of settlement and vegetation fractions,
product of a national UIS and UGS fraction dataset at a 30 m      Landsat TM, ETM+, and OLI data in each period from Jan-
spatial resolution in 2000, 2005, 2010, 2015 and 2018 across      uary to December were collected using the GEE platform.
China. This dataset provides a foundation for understanding       Shuttle Radar Topography Mission (SRTM) digital elevation
urban dwellers’ environments and enhances our understand-         model data and the normalized difference vegetation index
ing of the impacts of urbanization on ecological services and     (NDVI) with a 30 m resolution were acquired as input param-
functions, and it will also be helpful in future research and     eters to retrieve settlement and vegetation fractions. Google
practices in urban planning and urban environmental sustain-      Earth images in selected cities with a 0.6 m resolution were
ability.                                                          used to assess the accuracy of the CLUD-Urban product.

2   The strategy of developing the CLUD-Urban                     4     Extraction of urban boundaries from CLUD
    product
                                                                  4.1    The classification system and interpretation symbols
To acquire the accurate CLUD-Urban product, three steps
were generally implemented according to our mapping strat-        CLUD with 30 m resolution was developed by the Chinese
egy. Firstly, national urban boundaries in 2000–2018 were         Academy of Sciences and has been updated from 2000 to
extracted from CLUD which was generated using a uniform           2018 every 5 or 3 years. This dataset can delineate land
technological flow and classification system in a human–          use or land cover change associated with human activities,
computer digitalization environment. Time series of urban         including urbanization at a scale of 1 : 100 000 (Liu et al.,
boundaries and their expansions have good performance in          2005a, b, 2010). This product adopted a hierarchical clas-
accuracy and data quality. The national urban vector bound-       sification system covering the 6 first-level classes and the
aries in 2000, 2005, 2010, 2015 and 2018 were converted           25 second-level classes. Here the 6 first-level classes com-
to raster data with a 30 m resolution for further processing      prise cropland, woodland, grassland, water body, construc-
(Fig. 1). Secondly, the settlement and vegetation fractions       tion land and unused land. A detailed description of each
with a 30 m resolution were retrieved using a random forest       class can be found in previous publications (Liu et al., 2005b;
algorithm in the GEE platform. Thirdly, the UIS and UGS           Zhang et al., 2014). The construction land was divided into
fractions with a 30 m resolution were mapped through over-        three second-level classes, including urban land, rural set-
laying the urban boundaries of CLUD with settlement and           tlements, and industrial and mining lands beyond cities. Ur-
vegetation fractions, respectively (Fig. 1). Accuracy assess-     ban land was defined as a built-up area of the concentrated
ment both of urban boundaries and of UIS and UGS frac-            construction, i.e., buildings, roads, squares, green infrastruc-
tions was implemented using samples from Google Earth             ture and other lands for providing a living, industrial pro-
images. Quality control was conducted throughout the data         duction, and ecosystem services for the dwellers of cities or
processing in mapping the CLUD-Urban product. A detailed          towns. According to this definition, urban land can be megac-
description is given in the following sections.                   ities (more than 10 million population), megalopolises (5–
                                                                  10 million population), large cities (1–5 million population),
                                                                  medium cities (0.5–1 million population), small cities (0.2–

https://doi.org/10.5194/essd-13-63-2021                                                Earth Syst. Sci. Data, 13, 63–82, 2021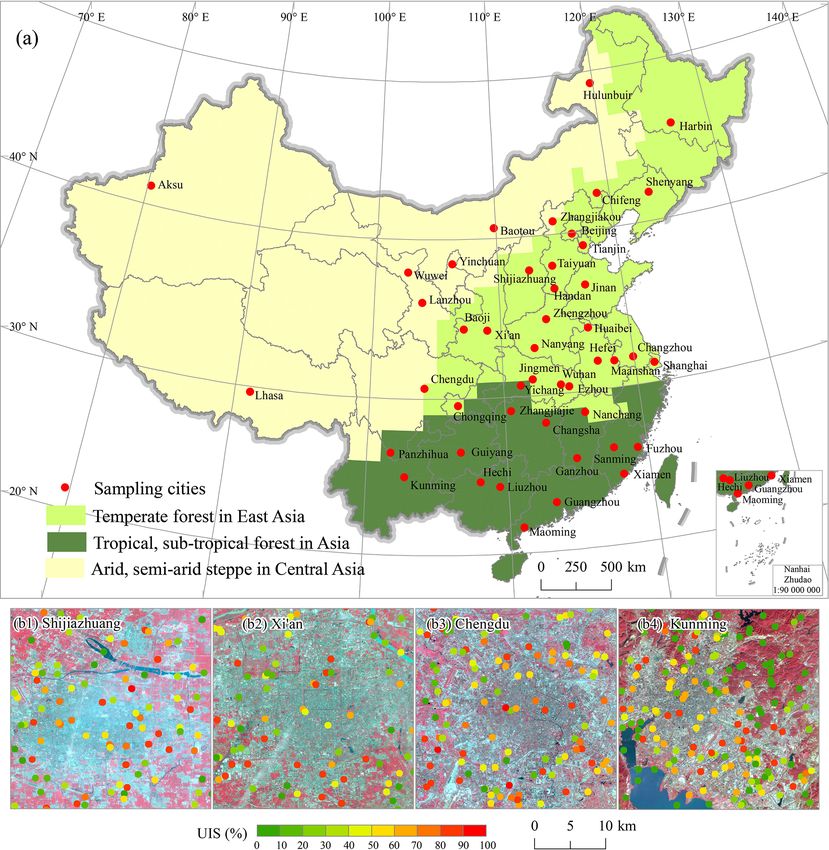
66 W. Kuang et al.: Dataset of China’s UIS and UGS
Figure 1. The technological flowchart of generating the CLUD-Urban product.
Table 1. The multitemporal data series used in this research.
Year Path Row Sensor Spatial resolution (m)
2000 Landsat TM 30
2005 Landsat TM 30
2010 118–149 23–43 Landsat TM and ETM+, HJ-1, CBERS-1 30
2015 Landsat 8 OLI 30
2018 Landsat 8 OLI 30
Data sources Resolution
SRTM digital elevation model data 30 m
NDVI 30 m
Google Earth images 0.6 m
0.5 million population) and towns (less than 0.2 million pop- 4.2 Land use and dynamic polygon interpretation
ulation) (Kuang, 2020a). The industrial and traffic lands out-
side cities are excluded in the urban land. Based on the de- According to the CLUD classification system, the vector
signed classification system, the interpretation symbols from polygons of land use classes in 2000 were digitalized through
the second-level classes were built for the false-color com- overlying the false-color composite images with the aid of
posite images as a reference to aid the human–computer in- interpretation symbols and geoknowledge from each zone
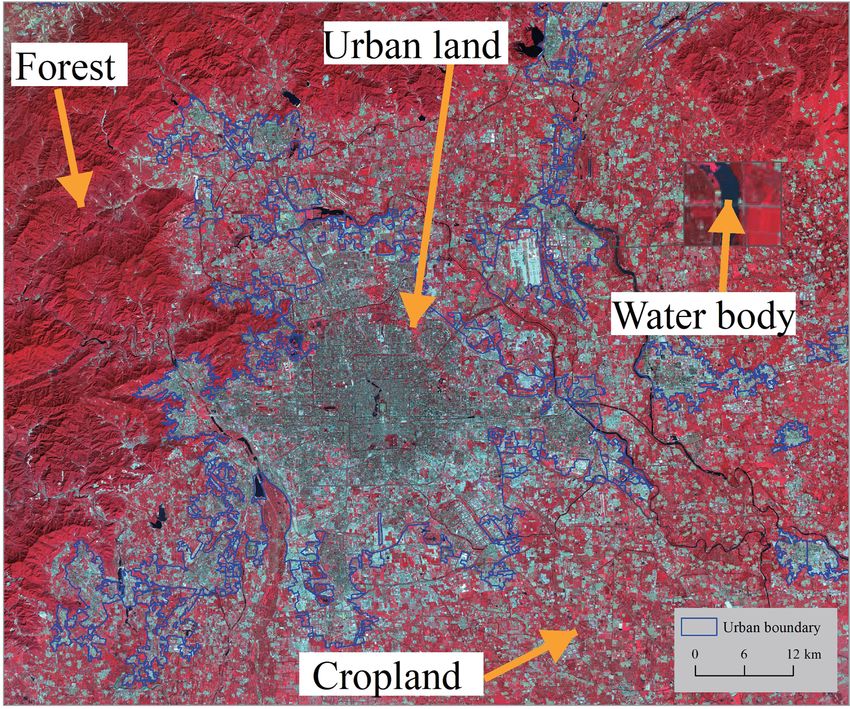
terpretation (Fig. 2) (Zhang et al., 2014). (Fig. 3). The polygons of urban lands were identified through
using detailed image interpretation symbols for each second-
level land use class based on Landsat or similar-resolution
images. Usually, the polygons of urban lands exhibit larger
Earth Syst. Sci. Data, 13, 63–82, 2021 https://doi.org/10.5194/essd-13-63-2021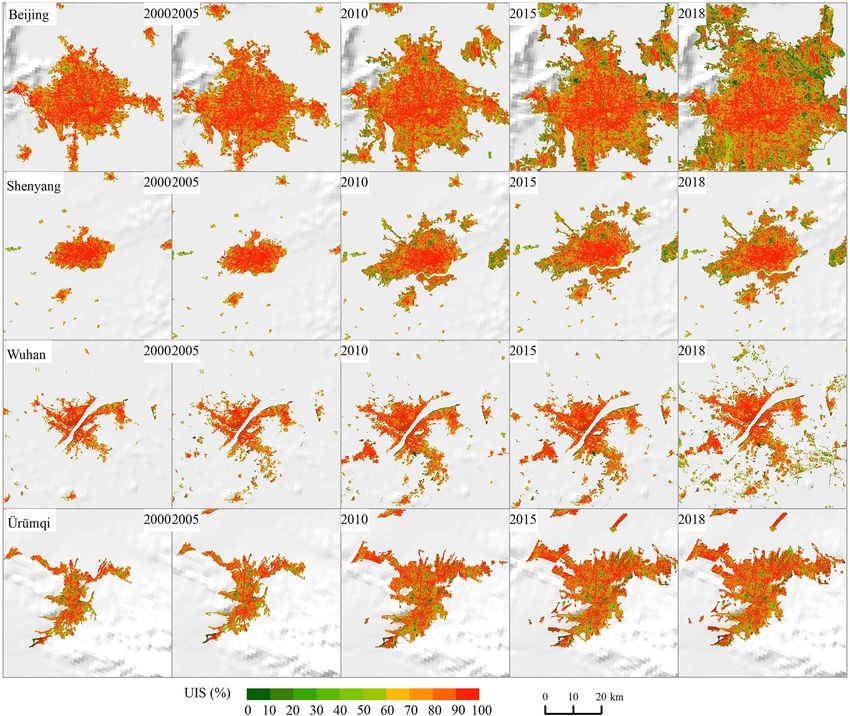
W. Kuang et al.: Dataset of China’s UIS and UGS                                                                                   67

Figure 2. The interpretation symbols and extracted urban boundaries from Landsat images in Beijing city. The images were provided by
the Geospatial Data Cloud site, Computer Network Information Center, Chinese Academy of Sciences (http://www.gscloud.cn, last access:
27 September 2017).

sizes than rural settlements and others (e.g., industrial and        CLUD. The detailed technological flow can be found in pre-
traffic lands) in a cinerous color ornamented with white. Dig-       vious publications (Liu et al., 2005b; Zhang et al., 2014). An
italization personnel differentiated the urban land from rural       example of a land use map in 2010 in the Conghua district of
settlements and others based on interpretation symbols and           Guangzhou and dynamic land use changes in 2010–2015 is
geoknowledge from field investigation (Fig. 2). In the digi-         illustrated in Fig. 3.
talization environment, each vector polygon was assigned a
code of the second-level classes. The vector polygons of land        4.3   Retrieval of multitemporal urban boundaries
use classes in 2000 were double-checked to ensure the cor-
rect type in interpretation. The dynamic polygons were ex-           The vector boundaries of urban extents were extracted from
tracted through comparing the difference in two differently          the CLUD land use maps in each period (Kuang et al., 2016).
dated images and assigned the codes including the types be-          We also examined 10 732 urban vector polygons in 2000.
fore and after changes (Fig. 3). The land use changes within         The number of polygons increase to 50 061 in 2018. The ur-
5 or 3 years were detected using the uniform method. Fi-             ban vector boundaries were acquired from Landsat images
nally, the land use maps in 2000, 2005, 2010, 2015 and 2018          or similar-resolution images. The vector polygons of urban
and their changes at 5- or 3-year intervals were generated for       boundaries were converted to raster data with a 30 m × 30 m
                                                                     cell size. The datasets on urban land across China in 2000,

https://doi.org/10.5194/essd-13-63-2021                                                   Earth Syst. Sci. Data, 13, 63–82, 2021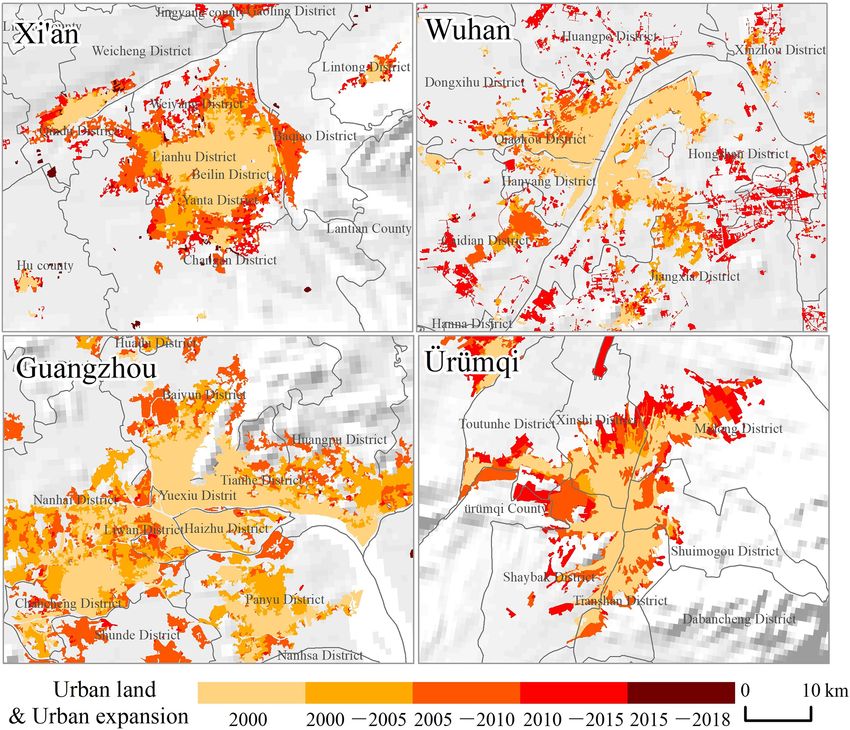
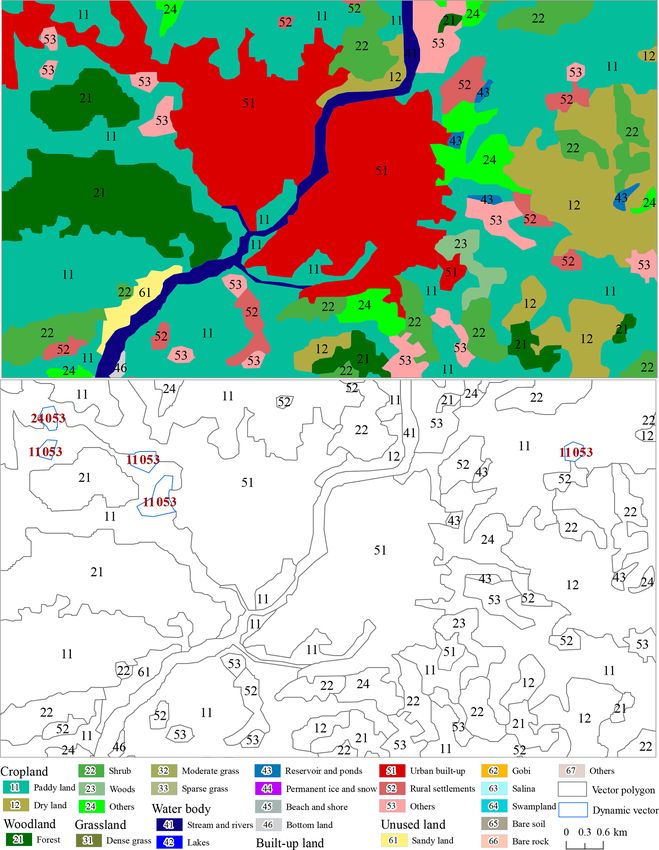
68                                                                              W. Kuang et al.: Dataset of China’s UIS and UGS

Figure 3. Land use classification and extracted vector polygons as an example with the Conghua district of Guangzhou.

Earth Syst. Sci. Data, 13, 63–82, 2021                                                    https://doi.org/10.5194/essd-13-63-2021
W. Kuang et al.: Dataset of China’s UIS and UGS                                                                                 69

2005, 2010, 2015 and 2018 were generated with 30 m reso-          where NDVIi is the NDVI value of the ith image. The in-
lution. Here we showed urban boundaries and the expansion         dividual NDVI was calculated from Landsat images in the
process with a 30 m resolution in the cities of Xi’an, Wuhan,     period between 1 January to 31 December, and all images
Guangzhou and Ürümqi (Fig. 4).                                    were collected using GEE (Gorelick et al., 2017).
                                                                     In the GEE platform, the settlement and vegetation frac-
5     Mapping UIS and UGS fractions using GEE                     tions were calculated for each urban ecoregion through us-
      platform                                                    ing the training parametrizations. The lawn, forest or their
                                                                  mosaicked areas were selected as input samples in mapping
5.1    Collection of training samples                             UGS. Post-processing was implemented to remove the pix-
                                                                  els with NDVI values greater than 0.5 or DEM slope values
The training samples of UIS and UGS fractions are a piv-          greater than 15◦ . In arid and semi-arid areas, the enhanced
otal input parameter in the random forest model for mapping       bare-soil index (EBSI) was utilized to separate UIS from bare
national settlement and vegetation fractions. In light of large   soils (As-syakur et al., 2012; Li et al., 2019). As a result, the
discrepancies among UIS and UGS composites in different           settlement and vegetation fractions with 30 m×30 m in 2000,
climate zones with various geographical and social economic       2005, 2010, 2015 and 2018 were generated for developing
conditions, we collected a total of 2570 samples from ran-        the CLUD-Urban product (Fig. 6).
domly selected cities in different climate zones (Schneider et
al., 2010) (Fig. 5). Here we also refer to the existing UIS
                                                                  5.3    Mapping of UIS and UGS fractions
dataset to acquire samples with 10 % intervals of the ISA
fraction, and those samples are primarily distributed in the      The settlement and vegetation fractions with a 1◦ × 1◦ grid
homogeneous UIS or UGS areas, which might provide more            of each period were downloaded from GEE platform. In
effective samples and decrease the impact of imagery mis-         ArcGIS 10.0 software, the settlement and vegetation layers
match. The samples of UIS and UGS covered with diversi-           were merged at a provincial scale with a 30 m × 30 m. The
fied types, including buildings, roads and squares and grass      national UIS and UGS fractions with 30 m × 30 m resolution
and trees from parks, roads and residential green spaces. The     in 2000, 2005, 2010, 2015 and 2018 were produced through
UIS and UGS percentages were interpreted within each sam-         overlaying the urban boundaries of CLUD with settlement
ple using Google Earth images (Fig. 5b1–b4). Finally, the         and vegetation fractions, respectively (Figs. 7, 8 and 9).
training samples in 2000, 2005, 2010, 2015 and 2018 were
used for training the random forest model.
                                                                  6     Accuracy assessment of the CLUD-Urban product

5.2    Retrieval of settlement and vegetation fractions           The national urban boundaries and UIS and UGS fractions
       using random forest model                                  were assessed through qualitative and quantitative indices,
                                                                  respectively. Firstly, on the accuracy of CLUD in 2000, 2005
Many previous studies have indicated that random forest is
                                                                  and 2010 we referred to our previous publications (Liu et
more effective and accurate in classifying urban land types
                                                                  al., 2010, 2014; Zhang et al., 2014). The accuracy of the six
than other machine learning approaches such as support vec-
                                                                  first-level classes – cropland, forest, grassland, built-up area,
tor machines (SVMs) and artificial neural networks (ANNs)
                                                                  water body and unused – and of the second-level land use
(Zhang et al., 2020). Random forest exhibits a strong capac-
                                                                  and land cover types, including urban land, rural settlements,
ity in processing high-dimensional datasets and has been suc-
                                                                  industrial and traffic lands, was assessed using the field inves-
cessfully applied to mapping global ISA at a 30 m resolution
                                                                  tigation data and the Google Earth images (Liu et al., 2010,
(Zhang et al., 2020). In this research, we proposed a strat-
                                                                  2014; Zhang et al., 2014). We also implemented accuracy as-
egy to acquire the settlement and vegetation percentage at
                                                                  sessment on urban boundaries of CLUD from 2000 to 2018
the pixel scale using the advantage of random forest and big-
                                                                  using overall accuracy, producer’s accuracy and user’s accu-
data processing based on the GEE platform.
                                                                  racy (Fig. 10) (Kuang et al., 2016; Kuang, 2020a).
   According to 16 global urban ecoregions based on temper-
                                                                     The validation samples for assessing the accuracy of UIS
ature, precipitation, topographic conditions and social eco-
                                                                  and UGS fractions were collected within urban boundaries
nomic factors (Schneider et al., 2010), China has three urban
                                                                  using a stratified random sampling method with the ISA frac-
ecoregions. In each urban ecoregion, the annual maximum
                                                                  tion at 10 % intervals. Those samples with a window size of
NDVI; spectral bands in Landsat TM, ETM+ and OLI; and
                                                                  3 pixels × 3 pixels (90 m × 90 m) were used to digitalize the
the slope index derived from the SRTM DEM with a 30 m
                                                                  UIS and UGS polygons through the human–computer inter-
resolution were selected as the input parameters to run the
                                                                  action based on Google Earth images (Kuang et al., 2014;
random forest model. The Landsat images were from 1 Jan-
                                                                  Kuang, 2020b). A total of 1869 validation samples were ran-
uary to 31 December of each baseline year. The annual max-
                                                                  domly acquired in different regions in China in 2000–2018,
imum NDVI (NDVImax ) was retrieved using Eq. (1):
                                                                  including 1070 samples located in the changed UIS and UGS
NDVImax = max(NDVI1 , NDVI2 , · · ·, NDVIi ),              (1)    areas (Fig. 10). Mean UIS and UGS fractions in each grid

https://doi.org/10.5194/essd-13-63-2021                                                Earth Syst. Sci. Data, 13, 63–82, 2021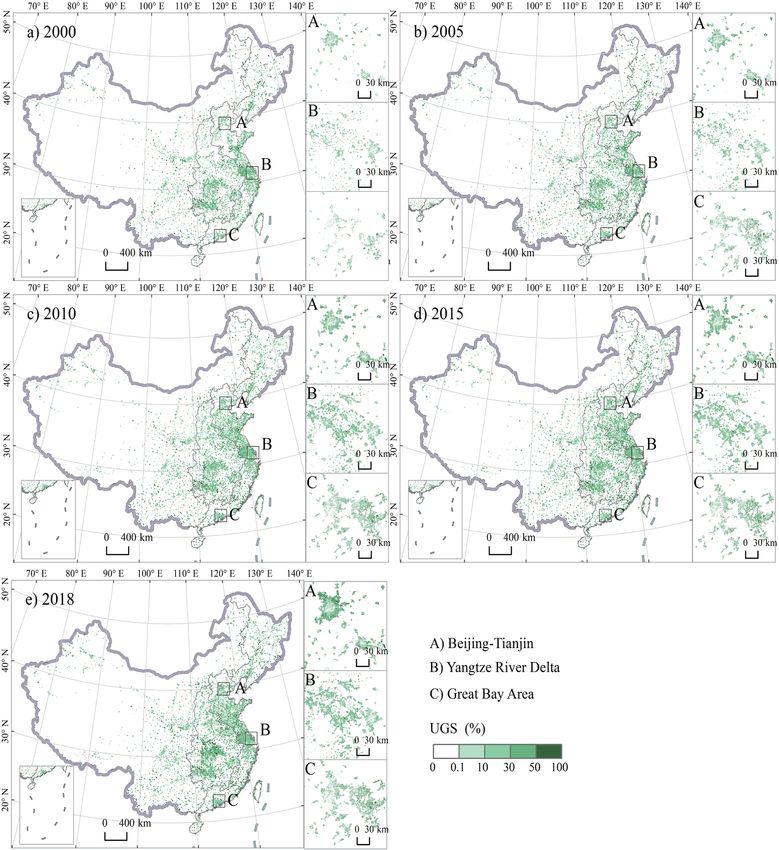
70                                                                              W. Kuang et al.: Dataset of China’s UIS and UGS

Figure 4. The urban boundaries extracted from CLUD with a 30 m resolution in selected cities. The administrative boundaries were provided
by the National Geomatics Center of China (http://www.webmap.cn, last access: 15 September 2020); DEM dataset was downloaded from
SRTM 90 m digital elevation data (http://srtm.csi.cgiar.org/, last access: 15 September 2020).

were calculated. The comparison between estimated values               land use and land cover types is 98.04 % in 2000, 94.3 %
and validation values was conducted using the correlation co-          in 2010, 91.64 % in 2015 and 91.12 % in 2018 (Liu et al.,
efficient (R) and root mean square error (RMSE) (Kuang et              2014; Zhang et al., 2014; Kuang et al., 2016; Ning et al.,
al., 2014; Kuang, 2020b). We also evaluated the changed UIS            2018). The built-up area has the highest accuracy among the
and UGS areas using R and RMSE based on 1070 validation                six land use types owing to its clear urban boundaries, and
samples.                                                               the accuracy reached 98.92 % in 2000 and 97.01 % in 2005
                                                                       according to previous assessment (Zhang et al., 2014). The
7     Results                                                          user’s accuracy of urban land type is relatively high with
                                                                       93.67 % in 2010, 92.65 % in 2015 and 91.32 % in 2018 (Ta-
7.1    The accuracy of CLUD-Urban                                      ble 2). Overall, the urban land accuracy shows a decreas-
                                                                       ing trend, which resulted from the fuzzy and unidentifiable
A quality check and data integration were performed for the            urban–rural boundaries owing to the continuous pattern of
years 2000, 2005, 2010, 2015 and 2018 to ensure the qual-              urban–rural land driven by China’s fast urban development
ity and consistency of the interpretation results. Our assess-         since the 21st century. In CLUD, the change polygons were
ment results indicated the overall accuracy of the first-level

Earth Syst. Sci. Data, 13, 63–82, 2021                                                     https://doi.org/10.5194/essd-13-63-2021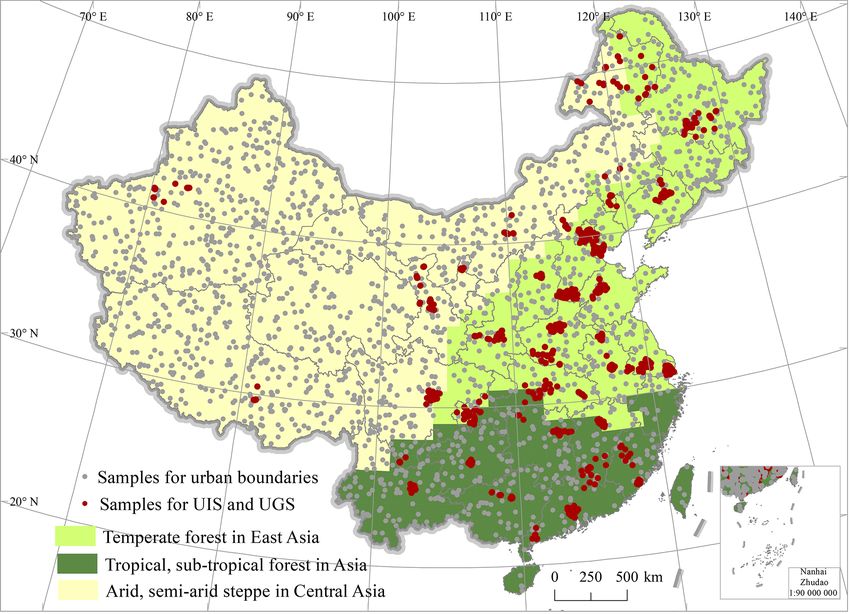
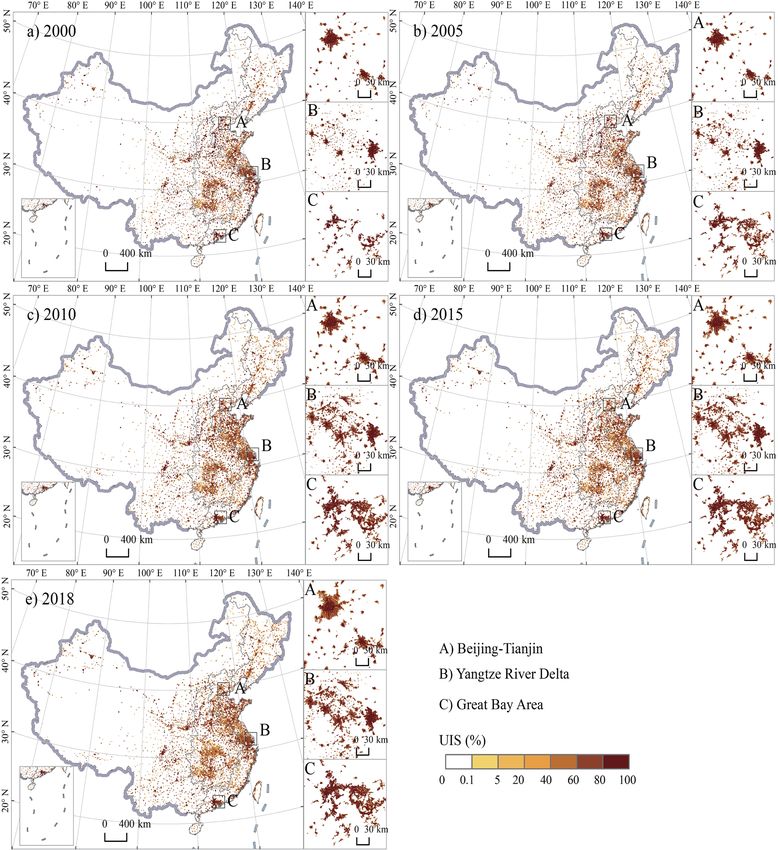
W. Kuang et al.: Dataset of China’s UIS and UGS                                                                                         71

Figure 5. Distribution of sampling cities in China and training samples in selected cities. The images were provided by the Geospatial Data
Cloud site, Computer Network Information Center, Chinese Academy of Sciences (http://www.gscloud.cn, last access: 13 August 2015 for
Shijiazhuang, 1 July 2015 for Xi’an, 2 April 2015 for Chengdu, and 20 November 2015 for Kunming). The administrative boundaries were
provided by the National Geomatics Center of China (http://www.webmap.cn, last access: 15 September 2020).

identified based on human interpretation. The validation of             7.2   Patterns and dynamics of UIS and UGS since the
UIS and UGS fractions in each period showed that the RM-                      beginning of the 21st century
SEs were 0.11–0.12 and 0.11–0.12 respectively, and the R
values were 0.89–0.91 and 0.87–0.90, respectively (Table 3).            Our result indicated that China’s UIS increased from 2.46 ×
The R and RMSE values for the changed UIS areas in 2000–                104 km2 in 2000 to 5.35 × 10⁴ km2 in 2018 (Fig. 7). From
2018 are 0.88 and 0.12, and those for the changed UGS areas             the perspective of the quality of dwellers’ habitat environ-
in the same period are 0.85 and 0.12, respectively.                     ments, the percentage of UIS in China’s urban areas in 2018

https://doi.org/10.5194/essd-13-63-2021                                                       Earth Syst. Sci. Data, 13, 63–82, 2021
72                                                                                  W. Kuang et al.: Dataset of China’s UIS and UGS

Figure 6. Distribution of sampling cities in China and training samples in selected cities. The administrative boundaries and residential point
information were provided by the National Geomatics Center of China (http://www.webmap.cn, last access: 15 September 2020).

is 74.42 %, showing a higher UIS density than developed                   As shown in Fig. 9, UIS and UGS of cities from coastal,
countries like the USA (Kuang et al., 2014). However, the                 northeastern and southwestern China have high spatial het-
UIS percentage in urban areas decreased from 74.42 % in                   erogeneity and showed the different urban expansion rate in
2000 to 68.21 % in 2018 owing to the improvement of ur-                   the past 28 years.
ban greening conditions. As shown in Fig. 7, the UIS across                  The large discrepancies of the UIS and UGS percentage
China is mainly distributed in the coastal and central re-                in urban areas were exhibited among eastern, central, west-
gions and is relatively discrete in the western regions. The              ern and coastal zones. The coastal zone showed a remarkable
pattern of “high in east and low in west” national UIS re-                increasing trend from 16.50 % in 2000 to 21.66 % in 2018
mained unchanged between 2000 and 2018 (Fig. 7). China’s                  (Figs. 9 and 11). We also found that urban greening condi-
UGS shows an increasing trend. The total UGS area in-                     tions were positively improved in Beijing in the same period,
creased from 1.00 × 10⁴ km2 in 2000 to 1.83 × 10⁴ km2 in                  which resulted in the increase in UGS percentage and de-
2018 (Fig. 8). Looking at both UIS and UGS in urban areas,                crease in UIS percentage in urban areas (Fig. 9). This means
our results indicate a slight increase in UGS density and de-             that urban habitat environment in coastal zones has become
crease in UIS density, which has resulted from strengthening              more liveable and comfortable, which is associated with the
urban greening since the start of the 21st century. The UGS               greening of parks and forests. We also found that the western
percentage rose from 18.91 % in 2000 to 22.30 % in 2018.                  cities have a relatively low UGS percentage in urban areas,

Earth Syst. Sci. Data, 13, 63–82, 2021                                                         https://doi.org/10.5194/essd-13-63-2021
W. Kuang et al.: Dataset of China’s UIS and UGS                                                                                     73

Figure 7. Spatial distribution of urban impervious surface (UIS) in 2000–2018 across China. The administrative boundaries were provided
by the National Geomatics Center of China (http://www.webmap.cn, last access: 15 September 2020).

which is 0.86 % lower than the average of China owing to the          7.3   Comparisons of the CLUD-Urban product with other
low-greening conditions (Figs. 9 and 11).                                   datasets

                                                                      We compared the vector boundaries of urban areas with
                                                                      the existing land use products and found obvious discrep-
                                                                      ancies because of the differences in data production, data

https://doi.org/10.5194/essd-13-63-2021                                                    Earth Syst. Sci. Data, 13, 63–82, 2021
74 W. Kuang et al.: Dataset of China’s UIS and UGS Figure 8. Spatial distribution of urban green space (UGS) in 2000–2018 across China. The administrative boundaries were provided by the National Geomatics Center of China (http://www.webmap.cn, last access: 15 September 2020). source, resolution and definition of urban land use types. ite of UIS and UGS (note both the GHSL Built and Globa- The spatial resolutions of land cover products range from 30 Land30 products cover only 2 years). The accuracy of urban to 1000 m. Figure 12 provides a comparison of urban land boundaries from CLUD-Urban is over 92 % and is basically datasets (see Table 4 for these datasets), showing that our inconsistent with that of the impervious surface map (Zhang product has better performance in delineating the detailed et al., 2020). Our dataset has a higher classification accu- spatial patterns of intra-urban land cover, i.e. the compos- racy in urban boundaries than that of GHSL with 90.3 %, Earth Syst. Sci. Data, 13, 63–82, 2021 https://doi.org/10.5194/essd-13-63-2021
W. Kuang et al.: Dataset of China’s UIS and UGS                                                                                       75

Figure 9. The spatial distribution of urban impervious surface (UIS) in selected cities from 2000 to 2018. DEM dataset was downloaded
from SRTM 90 m digital elevation data (http://srtm.csi.cgiar.org/, last access: 15 September 2020).

FROM-GLC with 89.6 %, Human Built-up and Settlement                      land, rural settlements, and industrial and traffic lands in pe-
Extent (HBASE) with 88.0 %, GlobaLand30 with 88.4 % and                  riphery of cities for accurately acquiring the urban bound-
NUACI with 85.6 %. Furthermore, our CLUD-Urban prod-                     aries and to retrieve the UIS and UGS fractions at pixel
uct can accurately delineate the spatial heterogeneity of UIS            scale. The urban boundaries are generally mapped using clas-
and UGS composites, which showed the R with 0.90 and                     sification methods such as unsupervised classifiers, super-
0.89 and RMSE with 0.11 and 0.11, respectively. In those                 vised classifiers, human–computer interpretation and other
existing datasets, the UIS and UGS composites can’t be ef-               advanced algorithms (i.e., ANN, SVM and random forest)
fectively decomposed at the pixel scale (Fig. 12).                       (Wu and Murray, 2003; Zhang et al., 2020). Among these
                                                                         methods, human–computer interpretation is widely regarded
                                                                         as a most accurate method in classifying urban land use and
8     Discussions                                                        land cover changes, especially in both detecting changing in-
                                                                         formation and extracting vector polygons as whole geofea-
8.1    The mapping advantages integrated with                            tures. However, this method takes more time and manual la-
       human–computer interpretation and GEE platform                    bor to digitalize a large number of polygons. CLUD has an
In mapping urban land use and land cover change at national              advantage for providing the accurate urban boundaries and
scale, two pivotal steps were required to segment the urban

https://doi.org/10.5194/essd-13-63-2021                                                        Earth Syst. Sci. Data, 13, 63–82, 2021
76 W. Kuang et al.: Dataset of China’s UIS and UGS
Figure 10. Validation samples on the CLUD-Urban product. The administrative boundaries were provided by the National Geomatics Center
of China (http://www.webmap.cn, last access: 15 September 2020).
Table 2. Confusion matrix of China’s Land Use/cover Dataset.
Accuracy for specific land type Source
Year Land type
Samples Producer’s accuracy User’s accuracy Overall
size (%) (%) accuracy
2000 Built-up area 8055 98.92 % Zhang et al. (2014)
2005 Built-up area 7382 97.01 % Zhang et al. (2014)
Built-up area – –
Urban land 94.30 93.67
2010 7875 Kuang et al. (2016)
Rural settlement 91.76 91.76
Industrial and traffic lands 91.67 90.26
Built-up area – –
Urban land 91.30 92.65
2015 7235
Rural settlement 89.29 93.28
Industrial and traffic lands 95.45 91.30
This study
Built-up area 7235 – –
Urban land 90.40 91.32
2018
Rural settlement 88.19 92.18
Industrial and traffic lands 94.43 92.13
Earth Syst. Sci. Data, 13, 63–82, 2021 https://doi.org/10.5194/essd-13-63-2021W. Kuang et al.: Dataset of China’s UIS and UGS 77 Figure 11. The fractions of urban impervious surface (UIS) and urban green space (UGS) at national and regional scales (coastal, central, western and northeastern zones) in 2000 and 2018. Figure 12. A comparison of urban land cover between this product and other datasets in Beijing. The Landsat images were provided by the Geospatial Data Cloud site, Computer Network Information Center, Chinese Academy of Sciences (http://www.gscloud.cn, last access: 20 August 2000 for 2000, 8 September 2005 for 2005, 8 June 2010 for 2010, 23 September 2015 for 2015, and 8 April 2018 for 2018). https://doi.org/10.5194/essd-13-63-2021 Earth Syst. Sci. Data, 13, 63–82, 2021
78                                                                          W. Kuang et al.: Dataset of China’s UIS and UGS

Table 3. Accuracy assessments for the UIS and UGS fractions.      8.3    Limitations of the method and dataset

                           UIS                 UGS
                                                                  Although state-of-the-art technologies and methodologies
            Year                                                  were applied to the development of CLUD-Urban (Dong et
                      R     RMSE          R     RMSE              al., 2017; Kuang et al., 2020b), improvement to the map-
            2000    0.91         0.11   0.90         0.11         ping CLUD-Urban quality can still be made. For example,
            2005    0.90         0.11   0.90         0.11         the retrieval of UIS and UGS was conducted as a prereq-
            2010    0.90         0.11   0.88         0.11         uisite of CLUD, which focused on the pixel decomposition
            2015    0.91         0.11   0.88         0.11         of UIS and UGS in urban areas. If the UIS and UGS frac-
            2018    0.89         0.12   0.87         0.12         tions are parameterized to be input into a hydrological pro-
                                                                  cess model or urban climate, the settlements or impervious
                                                                  surfaces located on the outskirts of a city or in rural areas are
is updated at an interval of every 5 or 3 years from 2000 to      removed from CLUD. To address this issue, the first-level
2018.                                                             classification or second-level classification of CLUD should
   Cities or towns were classified as a homogeneous unit in       be utilized to merge with UIS and UGS using the method
CLUD. We developed the UIS and UGS fractions to fill the          in our previous publication (Kuang et al., 2020b). Mapping
data gap for the requirement of urban environmental manage-       CLUD requires a large amount of labor and time as many
ment. Here we adopted the advantage of high accuracy and          interpreters are involved in this work. The extraction of ur-
long-time series in mapping urban land from CLUD. Mean-           ban boundaries might be subjective, and there is a time lag
while we also utilized the highly efficient computation and       in mapping UIS and UGS. It is needed to develop some ad-
large storage capacities on the GEE platform. In mapping the      vanced tools to extract urban boundaries using automatic al-
CLUD-Urban product, we proposed quantitatively retrieving         gorithms.
the UIS and UGS fractions using random forest. Because               Fine urban land use and land cover change mapping at a
we used advantages of manual interpretation and intelligent       national scale with high-resolution multi-source data may be
computation, CLUD-Urban exhibits high accuracy and reli-          developed with the aid of big data and cloud platforms (Gong
ability in delineating urban land surface properties.             et al., 2020a). The development of a series of new algo-
                                                                  rithms and models are pivotal for improving the accuracy of
                                                                  datasets in retrieving urban boundaries and land cover com-
8.2   The potential implications of promoting habitat             posites. However, geoknowledge is still essential for retriev-
      environment and urban sustainability                        ing a high-quality dataset (Kuang et al., 2018). CLUD-Urban
                                                                  can contribute to the development of sustainable cities, such
The CLUD-Urban product may effectively delineate the
                                                                  as with Global Ecosystems and Environment Observation
“built-up environment” of Chinese cities, especially maps
                                                                  (GEO) and UN-Habitat, in future.
on surface imperviousness and greening conditions (Kuang,
2020b). CLUD-Urban can be applied to such fields as en-
hancing the quality of the urban habitat environment, reduc-      9     Data availability
ing urban heat islands, and improving prevention of rain-
storm and flood disasters (Huang et al., 2018). Our previous      All data presented in this paper are available at
study indicated that the thermal dissipation strength of forest   https://doi.org/10.5281/zenodo.4034161 (Kuang et al.,
canopy or lawns in cities may be assessed at the pixel scale      2020a). These new-version datasets include the UIS and
and that the greening projects are more effective in allevi-      UGS fractions with a 30 m spatial resolution in 2000, 2005,
ating urban-heat-island intensity (Kuang et al., 2015). The       2010 2015 and 2018. A detailed metadata description is
CLUD-Urban product also helps identify urban flood regu-          provided, including contact information.
lation priority areas based on ecosystem service approaches
(Li et al., 2020).                                                10     Conclusion
   The analysis of CLUD-Urban indicates an unprecedented
rate and magnitude of urban expansion since the start of the      CLUD-Urban – China’s UIS and UGS fraction datasets with
21st century. The low UGS of cities in western zones indi-        30 m spatial resolution – was generated using multiple data
cates the need to promote their greening level (Kuang and         sources. CLUD-Urban provides detailed delineation of UIS
Dou, 2020). The CLUD-Urban product can also be used to            and UGS components in China for the years of 2000, 2005,
assess sustainable-development-goal (SDG) targets such as         2010, 2015 and 2018. Comparing to other products, the nov-
the ratio of land consumption to population growth or aver-       elty of this dataset is to take cities as heterogeneous units
age share of the built-up area that is open space for public      at the pixel level, which consist of UIS, UGS and others.
use. Therefore, CLUD-Urban can have many potential ap-            The accuracy of the CLUD-Urban dataset is over 92.65 % us-
plications in the development of sustainable, liveable and re-    ing the integrated approach of visual interpretation and prior
silient cities.                                                   knowledge. The RMSEs of UIS and UGS fractions are 0.10

Earth Syst. Sci. Data, 13, 63–82, 2021                                                https://doi.org/10.5194/essd-13-63-2021
W. Kuang et al.: Dataset of China’s UIS and UGS 79
Table 4. A summary of existing urban land products.
Name Spatial Abbreviation Method Reference
resolution
Land cover from Moderate 500 m MODIS LC Decision tree classification Friedl et al. (2010)
Resolution Imaging Spectrora-
diometer
European Space Agency global 300 m ESA LC Unsupervised classification and Bontemps et al. (2011)
land cover data change detection
Built-up grid of the Global Hu- 30 m GHSL Built Symbolic machine learning Pesaresi et al. (2013)
man Settlement Layer
Global Land Cover at 30 m res- 30 m GlobaLand30 Pixel–object–knowledge-based Chen et al. (2015)
olution (POK-based) classification
Multi-temporal Global imper- 30 m MGIS Normalized urban areas com- Liu et al. (2018)
vious surface posite index
Annual maps of global artificial 30 m GAIA “Exclusion–inclusion” ap- Gong et al. (2020b)
impervious area proach
and 0.14, respectively. Results from the analysis of urban ar- built-up and bare land in an urban area, Remote Sens., 4, 2957–
eas, including UIS and UGS, show large regional differences 2970, https://doi.org/10.3390/rs4102957, 2012.
in China. CLUD-Urban provides fundamental data sources Bai, X., Shi, P., and Liu, Y.: Society: realizing China’s urban dream,
for examining urban environment issues and for delineating Nature, 509, 158–160, https://doi.org/10.1038/509158a, 2014.
intra-urban structure or urban landscape at the national scale. Bai, X., Dawson, R. J., Urge-Vorsatz, D., Delgado, G. C., Ba-
rau, A. S., Dhakal, S., Dodman, D., Leonardsen, L., Masson-
Delmotte, V., Roberts, D., and Schultz, S.: Six research pri-
orities for cities and climate change, Nature, 555, 19–21,
Author contributions. WK, SZ and XL designed the research;
https://doi.org/10.1038/d41586-018-02409-z, 2018.
SZ and XL implemented the research; WK, SZ and DL wrote the
Belward, A. (Ed.): The IGBP-DIS global 1 km land cover data set
paper.
“DISCover”: proposal and implementation plans. Report of the
Land Cover Working Group of the IGBP-DIS, IGBP-DIS Work-
ing Paper, No. 13, Stockholm, 1996.
Competing interests. The authors declare that they have no con- Bontemps, S., Defourny, P., Bogaert, E., Arino, O., Kalo-
flict of interest. girou, V., and Perez, J.: Globcover 2009. Products Description
and Validation Reports, available at: https://epic.awi.de/31014/
16/GLOBCOVER2009_Validation_Report_2-2.pdf (last access:
Acknowledgements. We thank Yali Hou and Changqing Guo for 18 April 2019), 2011.
processing the data and Fengyun Sun and Rafiq Hamdi for their help Chen, J., Chen, J., Liao, A., Cao, X., Chen, L., Chen, X., He,
in manuscript editing. C., Han, G., Peng, S., Lu, M., Zhang, W., Tong, X., and Mills,
J.: Global land cover mapping at 30 m resolution: a POK-
based operational approach, ISPRS J. Photogramm., 103, 7–27,
Financial support. This research has been supported by the Na- https://doi.org/10.1016/j.isprsjprs.2014.09.002, 2015.
tional Natural Science Foundation of China (grant no. 41871343) Dong, J., Kuang, W., and Liu, J.: Continuous land cover change
and the Strategic Priority Research Program A of the Chinese monitoring in the remote sensing big data era, Sci. China Earth
Academy of Sciences (grant no. XDA23100201). Sci., 60, 2223–2224, https://doi.org/10.1007/s11430-017-9143-
3, 2017.
Esch, T., Heldens, W., Hirner, A., Keil, M., Marconcini, M.,
Review statement. This paper was edited by Yuyu Zhou and re- Roth, A., Zeidler, J., Dech, S., and Strano, E.: Breaking
viewed by four anonymous referees. new ground in mapping human settlements from space – the
Global Urban Footprint, Isprs J. Photogramm., 134, 30–42,
https://doi.org/10.1016/j.isprsjprs.2017.10.012, 2017.
Esch, T., Bachofer, F., Heldens, W., Hirner, A., Marconcini, M.,
References Palacios-Lopez, D., Roth, A., Üreyen, S., Zeidler, J., Dech, S.,
and Gorelick, N.: Where we live – a summary of the achieve-
As-syakur, A. R., Adnyana, I. W. S., Arthana, I. W., and Nuarsa, I.
W.: Enhanced built-up and bareness index (EBBI) for mapping
https://doi.org/10.5194/essd-13-63-2021 Earth Syst. Sci. Data, 13, 63–82, 202180 W. Kuang et al.: Dataset of China’s UIS and UGS ments and planned evolution of the global urban footprint, Re- a fully convolutional network, Environ. Res. Lett., 14, 34008, mote Sens., 10, 895, https://doi.org/10.3390/rs10060895, 2018. https://doi.org/10.1088/1748-9326/aaf936, 2019. Falcone, J. A. and Homer, C. G.: Generation of a U.S. national Huang, C., Yang, J., and Jiang, P.: Assessing impacts of ur- urban land-use product, Photogramm. Eng. Rem. S., 78, 1057– ban form on landscape structure of urban green spaces in 1068, https://doi.org/10.14358/PERS.78.10.1057, 2012. China using Landsat images based on Google Earth Engine, Friedl, M. A., Sulla-Menashe, D., Tan, B., Schneider, A., Ra- Environ. Res. Lett., 10, 054011, https://doi.org/10.1088/1748- mankutty, N., Sibley, A., and Huang, X.: MODIS Collection 9326/10/5/054011, 2018. 5 global land cover: algorithm refinements and characteriza- Kuang, W.: Simulating dynamic urban expansion at regional scale tion of new datasets, Remote Sens. Environ., 114, 168–182, in Beijing-Tianjin-Tangshan Metropolitan Area, J. Geogr. Sci., https://doi.org/10.1016/j.rse.2009.08.016, 2010. 21, 317–330, https://doi.org/10.1007/s11442-011-0847-4, 2011. Gong, P., Wang, J., Yu, L., Zhao, Y., Zhao, Y., Liang, L., Niu, Z., Kuang, W.: Evaluating impervious surface growth and Huang, X., Fu, H., Liu, S., Li, C., Li, X., Fu, W., Liu, C., Xu, its impacts on water environment in Beijing-Tianjin- Y., Wang, X., Cheng, Q., Hu, L., Yao, W., Zhang, H., Zhu, P., Tangshan metropolitan area, J. Geogr. Sci., 22, 535–547, Zhao, Z., Zhang, H., Zheng, Y., Ji, L., Zhang, Y., Chen, H., Yan, https://doi.org/10.1007/s11442-012-0945-y, 2012. A., Guo, J., Yu, L., Wang, L., Liu, X., Shi, T., Zhu, M., Chen, Kuang, W.: 70 years of urban expansion across China: Trajec- Y., Yang, G., Tang, P., Xu, B., Giri, C., Clinton, N., Zhu, Z., tory, pattern, and national policies. Sci. Bull., 65, 1970–1974, Chen, J., and Chen, J.: Finer resolution observation and mon- https://doi.org/10.1016/j.scib.2020.07.005, 2020a. itoring of global land cover: first mapping results with Land- Kuang, W.: National urban land-use/cover change since sat TM and ETM+ data, Int. J. Remote Sens., 34, 2607–2654, the beginning of the 21st century and its policy im- https://doi.org/10.1080/01431161.2012.748992, 2013. plications in China, Land Use Pol., 97, 104747, Gong, P., Li, X., and Zhang, W.: 40-Year (1978–2017) hu- https://doi.org/10.1016/j.landusepol.2020.104747, 2020b. man settlement changes in China reflected by impervious sur- Kuang, W. and Dou, Y.: Investigating the patterns and dy- faces from satellite remote sensing, Sci. Bull., 64, 756–763, namics of urban green space in China’s 70 major cities https://doi.org/10.1016/j.scib.2019.04.024, 2019. using satellite remote sensing, Remote Sens., 12, 1929, Gong, P., Chen, B., Li, X., Liu, H., Wang, J., Bai, Y., https://doi.org/10.3390/rs12121929, 2020. Chen, J., Chen, X., Fang, L., and Feng, S.: Mapping Kuang, W. and Yan, F.: Urban structural evolution over a century in essential urban land use categories in China (EULUC- Changchun city, Northeast China, J. Geogr. Sci., 28, 1877–1895, China): preliminary results for 2018, Sci. Bull., 65, 182–187, https://doi.org/10.1007/s11442-018-1569-7, 2018. https://doi.org/10.1016/j.scib.2019.12.007, 2020a. Kuang, W., Liu, J., Zhang, Z., Lu, D., and Xiang, B.: Spatiotem- Gong, P., Li, X., Wang, J., Bai, Y., Chen, B., Hu, T., poral dynamics of impervious surface areas across China dur- Liu, X., Xu, B., Yang, J., Zhang, W., and Zhou, Y.: An- ing the early 21st century, Chin. Sci. Bull., 58, 1691–1701, nual maps of global artificial impervious area (GAIA) be- https://doi.org/10.1007/s11434-012-5568-2, 2013. tween 1985 and 2018, Remote Sens. Environ., 236, 111510, Kuang, W., Chi, W., Lu, D., and Dou, Y.: A comparative anal- https://doi.org/10.1016/j.rse.2019.111510, 2020b. ysis of megacity expansions in China and the U.S.: patterns, Gorelick, N., Hancher, M., Dixon, M., Ilyushchenko, S., Thau, D., rates and driving forces, Landscape Urban Plan., 132, 121–135, and Moore, R.: Google Earth Engine: planetary-scale geospa- https://doi.org/10.1016/j.landurbplan.2014.08.015, 2014. tial analysis for everyone, Remote Sens. Environ., 202, 18–27, Kuang, W., Dou, Y., Zhang, C., Chi, W., Liu, A., Liu, Y., Zhang, https://doi.org/10.1016/j.rse.2017.06.031, 2017. R., and Liu, J.: Quantifying the heat flux regulation of metropoli- Grekousis, G., Mountrakis, G., and Kavouras, M.: An tan land use/land cover components by coupling remote sensing overview of 21 global and 43 regional land-cover map- modeling with in situ measurement, J. Geophys. Res.-Atmos., ping products, Int. J. Remote Sens., 36, 5309–5335, 120, 113–130, https://doi.org/10.1002/2014JD022249, 2015. https://doi.org/10.1080/01431161.2015.1093195, 2015. Kuang, W., Liu, J., Dong, J., Chi, W., and Zhang, C.: The rapid Haase, D., Larondelle, N., Andersson, E., Artmann, M., Borgström, and massive urban and industrial land expansions in China be- S., Breuste, J., Gomez-Baggethun, E., Gren, Å., Hamstead, Z., tween 1990 and 2010: a CLUD-based analysis of their trajecto- Hansen, R., Kabisch, N., Kremer, P., Langemeyer, J., Rall, E. ries, patterns, and drivers, Landscape Urban Plan., 145, 21–33, L., McPhearson, T., Pauleit, S., Qureshi, S., Schwarz, N., Voigt, https://doi.org/10.1016/j.landurbplan.2015.10.001, 2016. A., Wurster, D., and Elmqvist, T.: A quantitative review of urban Kuang, W., Yang, T., Liu, A., Zhang, C., Lu, D., and Chi, W.: An ecosystem service assessments: concepts, models, and imple- EcoCity model for regulating urban land cover structure and ther- mentation, Ambio, 43, 413–433, https://doi.org/10.1007/s13280- mal environment: taking Beijing as an example, Sci. China Ser. 014-0504-0, 2014. D-Earth Sci., 60, 1098–1109, https://doi.org/10.1007/s11430- Hamdi, R. and Schayes, G.: Sensitivity study of the urban heat is- 016-9032-9, 2017. land intensity to urban characteristics, Int. J. Climatol., 28, 973– Kuang, W., Yang, T., and Yan, F.: Examining urban land-cover char- 982, https://doi.org/10.1002/joc.1598, 2007. acteristics and ecological regulation during the construction of Hansen, M. C., Defries, R. S., Townshend, J. R. G., and Sohlberg, Xiong’an New District, Hebei Province, China, J. Geogr. Sci., R.: Global land cover classification at 1 km spatial resolution us- 28, 109–123, https://doi.org/10.1007/s11442-018-1462-4, 2018. ing a classification tree approach, Int. J. Remote Sens., 21, 1331– Kuang, W., Zhang, S., Li, X., and Lu, D.: A 30-meter res- 1364, https://doi.org/10.1080/014311600210209, 2000. olution dataset of impervious surface area and green He, C., Liu, Z., Gou, S., Zhang, Q., Zhang, J., and Xu, L.: De- space fractions of China’s cities, 2000–2018, Zenodo, tecting global urban expansion over the last three decades using https://doi.org/10.5281/zenodo.3778424, 2020a. Earth Syst. Sci. Data, 13, 63–82, 2021 https://doi.org/10.5194/essd-13-63-2021
W. Kuang et al.: Dataset of China’s UIS and UGS                                                                                           81

Kuang, W., Du, G., and Lu, D.: Global observation of urban expan-        Lu, D., Li, L., Li, G., Fan, P., Ouyang, Z., and Moran, E.: Examin-
   sion and land-cover dynamics using satellite big-data, Sci. Bull.,      ing spatial patterns of urban distribution and impacts of physical
   accepted, https://doi.org/10.1016/j.scib.2020.10.022, 2020b.            conditions on urbanization in coastal and inland metropoles, Re-
Li, H., Wang, C., Zhong, C., Su, A., Xiong, C., Wang, J.,                  mote Sens., 10, 1101, https://doi.org/10.3390/rs10071101, 2018.
   and Liu, J.: Mapping urban bare land automatically from               Ma, Q., He, C., Wu, J., Liu, Z., Zhang, Q., and Sun,
   Landsat imagery with a simple index, Remote Sens., 9, 249,              Z.: Quantifying spatiotemporal patterns of urban imper-
   https://doi.org/10.3390/rs9030249, 2019.                                vious surfaces in China: an improved assessment using
Li, X., Zhou, Y., Zhu, Z., Liang, L., Yu, B., and Cao, W.:                 nighttime light data, Landscape Urban Plan., 130, 36–49,
   Mapping annual urban dynamics (1985–2015) using time se-                https://doi.org/10.1016/j.landurbplan.2014.06.009, 2014.
   ries of Landsat data, Remote Sens. Environ., 216, 674–683,            Ning, J., Liu, J., Kuang, W., Xu, X., Zhang, S., Yan, C., Li,
   https://doi.org/10.1016/j.rse.2018.07.030, 2018.                        R., Wu, S., Hu, Y., Du, G., Chi, W., Pan, T., and Ning, J.:
Li, X., Zhou, Y., Zhu, Z., and Cao, W.: A national dataset of              Spatiotemporal patterns and characteristics of land-use change
   30 m annual urban extent dynamics (1985–2015) in the con-               in China during 2010–2015, J. Geogr. Sci., 28, 547–662,
   terminous United States, Earth Syst. Sci. Data, 12, 357–371,            https://doi.org/10.1007/s11442-018-1490-0, 2018.
   https://doi.org/10.5194/essd-12-357-2020, 2020.                       Nowak, D. J. and Greenfield, E. J.: Tree and impervious cover
Lin, Y., Zhang, H., Lin, H., Gamba, P. E., and Liu, X.: In-                in the United States, Landscape Urban Plan., 107, 21–30,
   corporating synthetic aperture radar and optical images to in-          https://doi.org/10.1016/j.landurbplan.2012.04.005, 2012.
   vestigate the annual dynamics of anthropogenic impervious             Peng, J., Shen, H., Wu, W., Liu, Y., and Wang, Y.: Net
   surface at large scale, Remote Sens. Environ., 242, 111757,             primary productivity (NPP) dynamics and associated urban-
   https://doi.org/10.1016/j.rse.2020.111757, 2020.                        ization driving forces in metropolitan areas: a case study
Liu, J., Liu, M., Tian, H., Zhuang, D., Zhang, Z., Zhang,                  in Beijing City, China, Landscape Ecol., 31, 1077–1092,
   W., Tang, X., and Deng, X.: Spatial and temporal patterns               https://doi.org/10.1007/s10980-015-0319-9, 2016.
   of China’s cropland during 1990–2000: an analysis based               Pesaresi, M., Huadong, G., Blaes, X., Ehrlich, D., Ferri, S.,
   on Landsat TM data, Remote Sens. Environ., 98, 442–456,                 Gueguen, L., Halkia, M., Kauffmann, M., Kemper, T.,
   https://doi.org/10.1016/j.rse.2005.08.012, 2005a.                       Lu, L., Marin-Herrera, M. A., Ouzounis, G. K., Scav-
Liu, J., Liu, M., Zhuang, D., Zhang, Z., and Deng, X.:                     azzon, M., Soille, P., Syrris, V., and Zanchetta, L.: A
   Study on spatial pattern of land-use change in China dur-               Global Human Settlement Layer from optical hr/vhrrs
   ing 1995–2000, Sci. China Ser. D-Earth Sci., 46, 3732003,               data: concept and first results, Ieee J-Stars., 6, 2102–2131,
   https://doi.org/10.1360/03yd9033, 2005b.                                https://doi.org/10.1109/JSTARS.2013.2271445, 2013.
Liu, J., Zhang, Z., Xu, X., Kuang, W., Zhou, W., Zhang, S., Li, R.,      Reba, M. and Seto, K. C.: A systematic review and as-
   Yan, C., Yu, D., Wu, S., and Jiang, N.: Spatial patterns and driv-      sessment of algorithms to detect, characterize, and moni-
   ing forces of land use change in China during the early 21st cen-       tor urban land change, Remote Sens. Environ., 242, 111739,
   tury, J. Geogr. Sci., 20, 483–494, https://doi.org/10.1007/s11442-      https://doi.org/10.1016/j.rse.2020.111739, 2020.
   010-0483-4, 2010.                                                     Schneider, A., Friedl, M. A., and Potere, D.: Mapping global urban
Liu, J., Kuang, W., Zhang, Z., Xu, X., Qin, Y., Ning, J., Zhou, W.,        areas using MODIS 500 m data: new methods and datasets based
   Zhang, S., Li, R., Yan, C., Wu, S., Shi, X., Jiang, N., Yu, D.,         on “urban ecoregions”, Remote Sens. Environ., 114, 1733–1746,
   Pan, X., and Chi, W.: Spatiotemporal characteristics, patterns,         https://doi.org/10.1016/j.rse.2010.03.003, 2010.
   and causes of land-use changes in China since the late 1980s,         Seto, K. C., Guneralp, B., and Hutyra, L. R.: Global forecasts
   J. Geogr. Sci., 24, 195–210, https://doi.org/10.1007/s11442-014-        of urban expansion to 2030 and direct impacts on biodiversity
   1082-6, 2014.                                                           and carbon pools, P. Natl. Acad. Sci. USA, 109, 16083–16088,
Liu, X., Hu, G., Chen, Y., Li, X., Xu, X., Li, S., Pei, F.,                https://doi.org/10.1073/pnas.1211658109, 2012.
   and Wang, S.: High-resolution multi-temporal mapping of               Sexton, J. O., Song, X., Huang, C., Channan, S., Baker, M.
   global urban land using Landsat images based on the Google              E., and Townshend, J. R.: Urban growth of the Wash-
   Earth Engine Platform, Remote Sens. Environ., 209, 227–239,             ington, D.C.–Baltimore, MD metropolitan region from
   https://doi.org/10.1016/j.rse.2018.02.055, 2018.                        1984 to 2010 by annual, Landsat-based estimates of
Lu, D. and Weng, Q.: Spectral mixture analysis of the ur-                  impervious cover, Remote Sens. Environ., 129, 42–53,
   ban landscape in Indianapolis with Landsat ETM plus                     https://doi.org/10.1016/j.rse.2012.10.025, 2013.
   imagery, Photogramm. Eng. Rem. S., 70, 1053–1062,                     Small, C. and Milesi, C.: Multi-scale standardized spectral
   https://doi.org/10.14358/PERS.70.9.1053, 2004.                          mixture models, Remote Sens. Environ., 136, 442–454,
Lu, D. and Weng, Q.: Use of impervious surface in urban                    https://doi.org/10.1016/j.rse.2013.05.024, 2013.
   land-use classification, Remote Sens. Environ., 102, 146–160,         Wang, H., Lu, S., Wu, B., and Li, X.: Advances in remote sensing
   https://doi.org/10.1016/j.rse.2006.02.010, 2006.                        of impervious surfaces extraction and its applications, Adv. Earth
Lu, D., Tian, H., Zhou, G., and Ge, H.: Regional mapping of                Sci., 28, 327–336, 2013.
   human settlements in southeastern China with multisensor re-          Wang, P., Huang, C., Brown de Colstoun, E. C., Tilton, J.
   motely sensed data, Remote Sens. Environ., 112, 3668–3679,              C., and Tan, B.: Global Human Built-up And Settlement
   https://doi.org/10.1016/j.rse.2008.05.009, 2008.                        Extent (HBASE) dataset from Landsat, NASA Socioeco-
Lu, D., Li, G., Kuang, W., and Moran, E.: Methods to extract imper-        nomic Data and Applications Center (SEDAC), Palisades, NY,
   vious surface areas from satellite images, Int. J. Digit. Earth, 7,     https://doi.org/10.7927/H4DN434S, 2017.
   93–112, https://doi.org/10.1080/17538947.2013.866173, 2014.

https://doi.org/10.5194/essd-13-63-2021                                                        Earth Syst. Sci. Data, 13, 63–82, 2021
You can also read